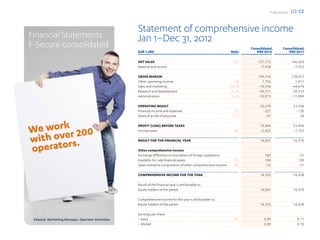
Annual Report 2012


Protecting the irreplaceable
F-Secure has been protecting the digital lives of consumers and businesses for
                                                                                         Contents
25 years. Our Internet security and content cloud services are available through
reseller partners, through over 200 operators in more than 40 countries and
directly to consumers.
                                                                                         01 Key figures 2012  .  .  .  .  .  .  .  .  .  .  .  .  .  .  .  .  .  . 01
In 2012, the company’s revenues were EUR 157 million and it has over 900                       F-Secure in brief  .  .  .  .  .  .  .  .  .  .  .  .  .  .  .  .  .  . 02
employees in more than 20 offices worldwide. F-Secure Corporation is listed on                 CEO letter .  .  .  .  .  .  .  .  .  .  .  .  .  .  .  .  .  .  .  .  .  . 04
the NASDAQ OMX Helsinki.

                                                                                         02 Board of Directors’ Report 2012  .  .  .  .  .  .  .  .  . 06

                                                                                         03 FINANCIAL STATEMENTS
                                                                                               F-SECURE CONSOLIDATED .  .  .  .  .  .  .  .  .  .  .  . 12
                                                                                               Statement of comprehensive income  .  .  .  .  . 12
                                                                                               Statement of financial position  .  .  .  .  .  .  .  .  . 13
                                                                                               Statement of cash flows  .  .  .  .  .  .  .  .  .  .  .  .  . 14
                                                                                               Statement of changes in equity  .  .  .  .  .  .  .  .  . 15
                                                                                               Notes to the financial statements .  .  .  .  .  .  .  . 16
                                                                                               Calculation of key ratios .  .  .  .  .  .  .  .  .  .  .  .  .  . 35

                                                                                               F-SECURE CORPORATION  .  .  .  .  .  .  .  .  .  .  .  . 36
                                                                                               Income statement  .  .  .  .  .  .  .  .  .  .  .  .  .  .  .  .  . 36
                                                                                               Balance sheet .  .  .  .  .  .  .  .  .  .  .  .  .  .  .  .  .  .  .  . 37
                                                                                               Cash flow statement .  .  .  .  .  .  .  .  .  .  .  .  .  .  .  . 38
                                                                                               Notes to the financial statements .  .  .  .  .  .  .  . 39

                                                                                               Auditor’s report (translation) .  .  .  .  .  .  .  .  .  .  . 47

                                                                                         04 Corporate Governance Statement .  .  .  .  .  .  . 48
                                                                                               Board of Directors  .  .  .  .  .  .  .  .  .  .  .  .  .  .  .  .  . 52
                                                                                               Leadership Team .  .  .  .  .  .  .  .  .  .  .  .  .  .  .  .  .  . 53
                                                      Sarogini, Quality Engineer, Labs
                                                                                         05 Information for shareholders  .  .  .  .  .  .  .  .  .  . 54
F-Secure 2012            01 01


Key figures 2012
                                  Revenues and operating profit                                                Revenues by the operator business
                                  2008–2012, MEUR                                                              2001–2012, MEUR
                                                                                                                                                                                95.4
                                                                                               157.2                                                                        84.8
                                                                                146.0
                                          17%
                                                 125.1          130.1
                                                                                                                                                                     67.1

                 157.2
                                  113.0
                                                                                                                                                              60.3
                                                                                    12%
                                                         11%                                                                                           48.3
Revenues MEUR
                                                                                                       8%                                       35.9

Operating Profit MEUR 20.3
                                                                        4%
                                                                                                                                         26.0
                                                                                                                                  16.6
                                          24.3           24.0           21.8*           23.6           27.3*
                                                                                                                            8.5

Earnings per share EUR 0.09
                                                                                                               0.5 1.4 3.5
                                    2008           2009           2010            2011           2012          01 02 03 04 05 06 07 08 09 10 11 12


Dividend per share EUR 0.06
                                  l Revenues  l  Operating profit
                                  l  Revenue growth
                                  * excluding one-offs


R&D investments 31% of revenues
                                  Regional revenue split                                                       Personnel by function
                                  2012, %                                                                      2012, %


Equity ratio 73%
                                          14%                                                                       14%
                                                          30%
                                   10%

Personnel 931
                                                                                                                                  44%

                                                                                                                 42%
                                            46%


                                  l    Nordic countries 30%                                                    l  Sales & Marketing 44%
                                  l    Rest of Europe 46%                                                      l  Research & Development 42%
                                  l    North America 10%                                                       l  Administration 14%
                                  l    Rest of the world 14%
F-Secure 2012   01 02


                                               F-Secure in brief
                                                           Protecting the Irreplaceable
                                                           F-Secure’s promise ‘Protecting the irreplaceable’ captures the essence of
                                                           what we do. We protect people’s valuable digital content and their online
                                                           interactions. As our customers’ on-the-go digital lives flow between smart-
                                                           phones, tablets, and PCs, they can be confident that their content is backed
                                                           up and secure and their devices and data are protected from digital threats.
                                                           So what’s personal stays personal and safe, anywhere. People are going
                                                           online for business, leisure, and everything in between. Our job at F-Secure
                                                           is to make all of this safe and secure – to protect people’s lives online.

                                                           Strategy
                                                           F-Secure’s first priority is to seek growth and market expansion. We will
                                                           increasingly promote our converged security and content cloud portfolio,
                                                           services which meet today’s needs for protection and privacy of devices,
                                                           content and personal data.
                                                               Simultaneously we will continue to bring innovative new products to the
                                                           market, products whose development is being determined by key trends
                                                           such as soaring mobile adoption, takeoff of personal cloud services, and
                                                           ubiquitous consumerization. By addressing these trends we will remain
                                                           competitive, meeting the needs of the mass market.
                                                               F-Secure has been protecting the digital lives of consumers and
                                                           businesses for 25 years. Two very strong assets give us a solid foundation
                                                           for our future success: our award-winning, competitive technology and
                                                           our channels. We sell through operators, broadband and mobile providers,
                                                           work together with resellers as well as sell directly to consumers through our
                                                           eStore, app stores and selected retail partners.


Dmitriy, Director, New Concepts & Technology
F-Secure 2012   01 03


Market Trends                                                                        Products and services
The role of security and privacy is increasing exponentially. This means             F-Secure’s long history of expertise in online security and portfolio of
F-Secure has a growing role to play in people’s lives. Most of us know that          award-winning security products are complemented by its innovation in
we need to protect our computers. But as we use more and more devices                cloud services.
to go online, we face the same security threats on our other devices too. All           Being constantly connected brings its own risks, and today’s sophisti-
devices and their precious user generated content need to be protected.              cated malware requires advanced protection. F-Secure Internet Security and
    Security software revenues in 2012 are estimated to be $19.2 billion, a          Mobile Security provide complete protection for computers, smartphones
growth of 8.4% from the previous year (Gartner, August 2012). The fore-              and tablets.
casted growth for the overall global security software market remains solid at          F-Secure’s personal content cloud product enables consumers to store,
around 8.2% until 2016 (CAGR). The growth of the security market is mostly           sync, access and share their photos, videos, documents and other files
organic and is derived from emerging markets, such as APAC, China and                safely anywhere, from any device. Users’ content stays 100 percent private,
Latin America (Gartner, August 2012).                                                safe and under their control as content is scanned only for malware, not for
    Users create and share content constantly. The volume of user-generated          marketing analytics or profiling.
digital content is expected to continue to increase rapidly in the coming
years, driven by digital photos, videos and music. 89% of people (F-Secure
Broadband Consumer Survey, 2012) want all their content to be available
on all their devices and look for services to share, store and control their         Unique business model
                                                                                                                                                                    BUSINESSES
personal data. Parks Associates forecasts that operators providing security,
storage and sharing value-added services have a revenue opportunity of                                                                                              We have the best corporate
$1.03 billion in 2012, increasing to $4.82 billion in 2015.                                                                                                         security strategy.
                                                                                     CONSUMERS
Customers                                                                            We have the best protec-
People and companies are online 24/7, storing data in multiple systems               tion in the world and we                                                       PARTNERS
and locations. There is a growing need and challenge to protect the truly
irreplaceable for people in work and private life: identity and reputation,
                                                                                     securely store PETABYTES                                                       We are the leader with over
digital memories, IPR and privacy. F-Secure protects tens of millions of             of content for millions of                                                     200 operator partnerships
customers’ irreplaceable digital content and online interactions. Anytime,           customers.                                                                     in over 40 countries.
anywhere, on any device.
    Behind our over 200 operator partners in more than 40 countries there
are currently more than 250 million broadband and mobile end users. We
also serve consumers directly through our e-Store and retailers in select
markets, and corporate customers through our global network of resellers.
Our services help customers enjoy a digital lifestyle to the fullest, whether it’s
surfing, sharing content, social networking or at work.
F-Secure 2012   01 04


                                             Your Security – Our Pride
CEO letter                                   My first year as CEO at F-Secure was very inspiring. Now, after one year and after meeting
                                             hundreds of F-Secure employees and many customers in various different countries
                                             I am more convinced than ever that this company has great assets to become a truly
                                             meaningful global player. In my opinion we have vast opportunities in the security and
                                             content cloud businesses to clearly change these areas as an innovator and thought leader.

                                                                           Over the past year we have made good operative progress. We have
                                                                           renewed our Leadership Team and organizational structure and have started
                                                                           to change our way of working to improve our productivity and operational
                                                                           efficiency as well as time-to-market and customer-centricity. We wanted to
                                                                           better focus our resources on areas important for our future and eliminate
                                                                           work which was not moving us towards our goals. The changes were
                                                                           successful; we now get more important development done with less costs.
                                                                           Our main goal is to seek revenue growth while gradually improving our
                                                                           profitability. We have now taken positive steps in this direction.
                                                                               Our journey to more growth and profitability will be accompanied by a
                                                                           few key trends. It’s hardly news that mobile adoption is soaring and creating
                                                                           a growing awareness and need for mobile security. And while the personal
                                                                           cloud is finally taking off as users start seeing the advantage of having
                                                                           content accessible from anywhere at any time, ubiquitous consumerization
                                                                           will change the dynamics of the industry. We are responding to and evolving
                                                                           with all three of these trends.

                                                                           Internet Security portfolio continues to evolve with success
                                                                           Over the year we launched several new Internet security products for
                                                                           consumers and corporate users for both PC and mobile environments. We
                                                                           introduced a unique Banking Protection feature for our flagship consumer
                                                                           PC product, F-Secure Internet Security 2013, and are now able to support
                                                                           all major mobile operating systems with F-Secure Mobile Security. The new
                                                                           version of F-Secure Protection Service for Business lifted the product to
                                                                           the next level of best-of-breed business security solutions. We are proud of
                                                                           our solutions, and independent test organizations proved that we provide
                                                                           state-of-the-art products. Our corporate security strategy was recognized
                                                                           as top-ranked in The Forrester Wave, Endpoint Security report. In January
                                                                           2013, we received the award from AV-TEST for Best Protection in the Home
   Christian Fredrikson, President and CEO                                 User category – just to name the highlight among many other awards our
                                                                           flagship consumer product has received.
F-Secure 2012   01 05


   The growth in mobile device usage is opening new                largest operators, launched their content cloud service last        development. By addressing these trends we are preserving
opportunities and our mobile security sales are picking up. At     autumn and it is progressing well. These launches, together         our product competitiveness and will be able to introduce
the same time the slower growth of PC shipments is causing         with growing interest among service providers, fuel our             innovative products designed to meet the needs of the mass
challenges in one of our traditionally strongest business areas.   excitement for our next-generation content cloud offering.          market. Simultaneously, we will increasingly promote our
Nonetheless, last year our Internet security business performed                                                                        converged security and content cloud portfolio. We are also
very well especially through our main channel, operators and       Consumerization is changing the game                                seeking further growth by expanding our geographical reach,
Internet service providers, and again achieved double-digit        We live in exciting times. People have become multi-screeners       especially in Latin America and Asia Pacific.
subscriber and revenue growth overall. During the year we          who use smartphones, tablets, computers, even TVs or gaming             To succeed in our efforts we will employ one of our
launched several new partnerships. Our latest entry into the       consoles to get online. Over 65% of people have more than           greatest assets: our channel with more than 200 operators,
Latin American continent contributed to a strong performance.      one device. Many activities are performed either sequentially       service providers and cable operators worldwide. F-Secure
Traditional channels, corporate and direct to consumer, were       or in parallel on various devices, which defines new require-       is the global leader in providing security as a service through
doing better than expected at the beginning of the year,           ments for software. We have and we will continue to create new      operators addressing a customer base of more than 250 million
showing once again the competiveness of our products.              products to address the rising need for safety and protecting       subscribers. Additionally, we now aim to grow through our two
                                                                   the most private content in an environment where the                other solid channels, direct consumer and resellers.
Breakthrough in our new content cloud                              importance of PCs is diminishing, and mobile or other devices           We are building further success on solid ground. This year
A competitive portfolio is also needed in the content cloud        connected to the Internet are on the rise.                          marks the 25th anniversary of F-Secure with a great track
business. It’s a fast moving, highly competitive market that           However, we see one mega-trend: consumerization. BYOD           record in the security business. F-Secure has been protecting
sees many start-up and mature companies driving innovations.       (Bring Your Own Device) and BYOA (Bring Your Own App)               the digital lives of consumers and businesses since late 80’s.
Tens of millions of cloud subscribers are needed to build up a     are part of this trend and offer individuals and companies          Today we provide Internet security and content cloud services
sustainable business and be established as a big player. A lot     new opportunities to increase productivity and reduce IT            in more than 40 countries around the world. We are the trusted
of companies have difficulties monetizing their content cloud      infrastructure costs. At the same time this trend generates         partner in data protection for millions of homes and businesses.
offerings and in the end many won’t make it. While content         new challenges for protecting content, privacy, reputation and          As the story continues, I wish to thank our personnel for
cloud business models are still evolving we are pleased with       intellectual property. For us, consumerization will significantly   their great contribution, and our customers and partners for
our progress in that area. We securely store billions of photos,   impact the development of our products, go-to-market strate-        their excellent cooperation last year. I would also like to extend
videos, documents, and other files for millions of consumers       gies and last but not least our way of working. We see ourselves    my warmest thanks to our shareholders for their continued
globally. Located in five data centers on three continents,        well placed for this shift, with our strong focus on providing      trust in F-Secure.
F-Secure’s ever-increasing cloud content has grown to make         security and content cloud products for people – whether in
up several petabytes of data. What makes our personal content      a business or leisure context. We have a great asset to build
cloud so different from many other products? The answer            on: we serve both businesses and consumers. Working with
is simple: security. With F-Secure, consumers’ content stays       each group increases our insight and expertise and benefits
100 percent private, safe and under their control. Content is      the other. The consumer-led change of how people use the
scanned only for malware, not for marketing analytics and          internet is at our fingertips and we know that in the future it     Christian Fredrikson
profiling as with some other companies.                            will be the user’s behavior – not the device, not the app – that    President & CEO
    Our new productized content cloud solution is highly           drives technology development.
scalable, enables a much faster time to market and strengthens
our competitive position in the emerging content cloud             We are investing in growth
business. Our latest launch at BT – one of the major European      The mentioned industry trends such as mobility and the
operators – once again proves the excellence of our products       need for mobile security, the growth of the personal content
and our ability to deliver on time. AT&T, one of the world’s       cloud, and consumerization are determining our product
F-Secure 2012   02 06


                                           Board of Directors’ Report 2012
                                           In 2012, F-Secure’s overall performance was solid. The Company continued its profitable
                                           growth while the revenue growth has been below the target level. During the year, the
                                           Company made organizational changes to improve its operational efficiency, time-to-
                                           market capabilities and market-centricity. These changes combined with an award-
                                           winning Internet Security portfolio and Content Cloud products are expected to support
                                           the Company’s aim back to high growth in the coming years.


                                                                         Financial performance and key figures
                                                                         Total revenues in 2012 were 157.2 million, representing a growth of 8% (146m).
                                                                         Revenue growth through the operator channel remained solid, with a
                                                                         growth of 12% from the previous year and reaching revenues of 95.2 million
                                                                         (84.8m). Revenues through the other channels grew over 1%, totaling 61.9
                                                                         million (61.2m). EBIT was 20.3 million (23.6m), representing 13% of revenues
                                                                         (16%). EBIT excluding one-offs due to restructuring in the French subsidiary
                                                                         were 27.3 million, representing 17% of revenues.
                                                                            Earnings per share were EUR 0.09 (EUR 0.11). Cash flow from operations
                                                                         was 25.6 million positive (20.8m positive). Deferred revenues were 37.7
                                                                         million at the end of December (38.3m).
                                                                            Total fixed costs were 131.2 million (115.9m), 13% higher than in the previous
                                                                         year. The increases in operational costs were allocated to geographic
                                                                         expansion in Latin America and to R&D to improve the competitiveness of
                                                                         the products.
                                                                            The cost level was impacted by increased depreciations from past
                                                                         capitalized R&D-expenses and other investments (R&D activations, software,
                                                                         and hardware); 7.9 million (6.5m) in total. F-Secure capitalized less develop-
                                                                         ment costs than in the previous year, 4.9 million (7.8m) in total. The one-offs
                                                                         due to restructuring of the French subsidiary were approximately 7 million.
                                                                         These were based on redundancies of 41 employees and related costs, 2.5
                                                                         million (final costs were a bit higher than the 2.1m estimated in October) and
                                                                         write-offs of 4.5 million from the related technology and customer assets.
                                                                         The negotiations related to restructuring at F-Secure SDC (France) were
                                                                         concluded in November.
                                                                            In addition, there was a write-off of 0.8 million from obsolete Content
                                                                         Cloud development, booked in Q4, and a write-off of 0.8 million from
Esa, Product Manager, Product Management                                 an obsolete sales tool, booked in Q2. All one-off costs during the year,
                                                                         including restructuring costs and all write-offs, amounted to 8.6 million in
F-Secure 2012   02 07


total. The total fixed costs excluding these one-offs were 122.6    Cloud business. The development of the previous version of         security and Content Cloud services for PC and mobile devices.
million (114.9m), 7% higher than in the previous year.              the Content Cloud product has been stopped in France and           The Corporate channel serves customers globally mainly
    In the beginning of the year 2012, F-Secure gave guidance       this will improve the Company’s financial performance.             through the reseller and Managed Services Partner network.
for company revenues and profitability, which was further               One of Europe’s major operators, BT, is now taking the         The Consumer channel works globally through the eStore,
defined in connection with the publication of interim reports.      final steps to the launch of its Content Cloud service, and is     AppStores and retailers in selected markets.
The company’s revenues and profitability were in accordance         planning to make it publicly available during Q1 2013. Powered         F-Secure’s corporate products received the highest
with the given guidance (latest guidance: revenue growth            by F-Secure’s latest Content Cloud technology, the operator’s      score in strategy among top endpoint security vendors in
5–10% from previous year; EBIT around 15% excluding one-offs        consumer customers will now get more out of their digital          an independent study (The Forrester Wave™; January 2013).
in France).                                                         content while safely accessing and sharing it from virtually       Forrester Research acknowledged F-Secure’s service-enabling
    At the end of the year, the geographical breakdown of           anywhere.                                                          business approach as it is well aligned with the great shift in
revenues was as follows: Finland and Scandinavia 31% (32%), rest        The Company’s co-operation with AT&T is also progressing       the software industry towards services. Additionally, F-Secure’s
of Europe 45% (45%), North America 10% (11%) and rest of the        well. F-Secure has delivered the digital content and cloud         score was among the highest in the antimalware category,once
world 14% (12%).                                                    storage platform for AT&T’s mobile device users to let them        again demonstrating the strength of the Company’s protection
    Further information on the key financial data is presented in   synchronize and share data in one safe, convenient location.       features.
note 29 to the financial statements.                                AT&T launched their Content Cloud service in Q3 2012 and has           Sales in traditional channels continued slightly better
                                                                    invested in various marketing campaigns to push the service in     than anticipated. Customer satisfaction in security services
Operator channel                                                    the market.                                                        remained high, which was visible in healthy license and renewal
The Operator channel, which includes Internet service                   In 2012, F-Secure entered into partnerships with several new   sales.The new version of the Company’s flagship consumer
providers, mobile operators and cable operators, is the             operators. In Europe these operator partners were e.g. VOO         product, Internet Security 2013, sold very well. Annual revenues
main channel through which F-Secure services are delivered.         (Belgium) and Primacom (Germany). In Latin America F-Secure        showed growth of over 1% and totaled 61.9 million (61.2m), and
F-Secure has more than 200 partners in over 40 countries, with      entered into partnership with Telefonica Movistar operators        39% (42%) of the Company’s total revenues.
an addressable market of over 250 million fixed and mobile          in Chile, Mexico and Panama. In addition, some partners
broadband customers. The total number of F-Secure’s operator        expanded their offering to support both PC and mobile              Product announcements
partners is significantly larger than that of any other security    Internet security. These operators include MTS (India), KPN net    F-Secure develops and sells Internet Security and Content
service vendor. Through operators, F-Secure provides easy and       (Netherlands), Vectra (Poland), Play (Poland), TDC (Denmark)       Cloud products that support personal computers, servers and
intuitive to use Internet security and Content Cloud products       and PCCW (Hong Kong). This demonstrates that the competi-          an increasing set of major smartphone, tablet and other mobile
for computers and mobile devices.                                   tiveness of our comprehensive Internet Security offering is        device operating systems. Services include a wide range of
    F-Secure securely stores billions of photos, videos, docu-      meeting the requirements of converging online life.                Internet Security products like anti-virus, anti-theft, browsing
ments, and other files for millions of consumers globally.              In Latin America, F-Secure is also opening two new sales       protection and parental control as well as Content Cloud
Located in five data centers on three continents, F-Secure’s        offices, Chile and Colombia, to take advantage of the rapidly      products like online backup, synchronization and sharing.
ever-increasing cloud content currently makes up several            growing business opportunity in the area and to support the
petabytes of data. F-Secure Cloud Services, online backup           partnership with Telefonica outside Brazil.                        In 2012 the key product announcements were as follows:
and sync & share, are trusted by many of the world’s largest            Annual revenues by the operator channel showed growth of
telecom companies and serve more than 100 operators around          12% and totaled 95.2 million (84.8m), representing 61% (58%) of    ●●   In November, F-Secure introduced Banking Protection, a
the world.                                                          the Company’s total revenues.                                           new feature for F-Secure’s Internet Security 2013 product.
   The Company has developed a new productized, highly-                                                                                     Banking Protection is designed especially to protect
scalable Content Cloud offering and streamlined its project         Corporate and Direct to Consumer channels                               consumers’ online banking sessions from malicious attacks
delivery to provide a shorter time to market. This new product      Corporate and Direct to Consumer channels mainly provide                and to protect online banking sessions against trojans by
strengthens the competitive position in the emerging Content        new license and renewal sales for a wide range of Internet              adding an extra layer of security. It works unobtrusively
F-Secure 2012   02 08


     without interrupting the banking session, while still allowing        and tablets.The release is a solution for today’s workplace,     Risks and uncertainties
     access to sites that are verified as safe by F-Secure.                where mobile devices are increasingly used to access             Uncertainty in the economic environment may impact the
                                                                           e-mail and other business-sensitive information. F-Secure’s      growth of broadband connections, operators’ willingness to
●●   In October, F-Secure introduced patch management as a
                                                                           Protection Service for Business provides protection against      invest in new services and may create pricing pressure. These
     business security feature. The debut of Software Updater
                                                                           malware specifically designed for smartphones, for example       may have a negative impact on F-Secure’s security and Content
     breaks new ground for small and medium-sized businesses
                                                                           billing scams or spy-tools that steal contacts for spam          Cloud sales.
     as proactive patch management software that is part of a
                                                                           lists. F-Secure protection can also track lost devices, giving       F-Secure’s risks and uncertainties are related to, among
     comprehensive SMB security solution. Software Updater
                                                                           businesses the power to remotely lock the device or delete       other things, the competitiveness of F-Secure’s product
     ensures that an organization’s operating systems and
                                                                           all confidential information.                                    portfolio, competitive dynamics in the industry, pricing models
     third-party applications are up-to-date. It proactively scans
                                                                                                                                            (e.g. free services, cost of Content Cloud services), impact of
     computers for missing security updates and patches and           ●●   In March, F-Secure introduced Safe Infinity, which is offered    changes in technology, timely and successful commercializa-
     deploys them automatically, displaying the results.                   through operator partners. F-Secure Safe Infinity safeguards     tion of complex technologies and new products and solutions,
●●   In September, F-Secure launched the newest version of its             irreplaceable content while enabling a secure online life.       the ability to protect intellectual property (IPR) in F-Secure’s
     flagship PC product, F-Secure Internet Security 2013, which           The solution covers all the functionalities available from       solutions as well as the use of third party technologies on
     gives consumers the best protection for their computers               F-Secure’s Internet security service such as anti-virus,         reasonable commercial terms, subcontracting relationships,
     and online identity when browsing the web. Among                      firewall, spam protection and parental control as well as        regional development in new growth markets, sustainability
     key improvements, F-Secure Internet Security 2013 now                 backup and restore functionality via the cloud.                  of partner relationships, compromising stored personal data,
     supports all popular browsers, including Google Chrome.          ●●   In March, F-Secure also launched Safe Anywhere, a unique         service quality related penalties, risk exposure from increasing
     A redesigned firewall comes with additional filters and                offering which allows consumers to obtain full ­protection      contractual liability requirements and forming of the new
     works seamlessly in home and public networks. F-Secure                 for their computers, smartphones and tablets in a single        business areas.
     Internet Security users will also receive automatic updates            service through their local operators. The solution includes       The completion schedules during the early stages of
     for new beneficial features throughout the year, such as the          F-Secure’s protection from viruses, spam, phishing and           projects in the Content Cloud and storage business are more
     Banking Protection feature that was launched in November.              other kinds of malware and cyber attacks. F-Secure Safe         prone to changes than the schedules in the traditional security
     F-Secure Internet Security 2013 also supports the Windows 8           Anywhere combines F-Secure Protection Service for                services business. This may result in delivery delay penalties
     operating system.                                                     Consumers and F-Secure Mobile Security, and it supports          and variation in revenue forecasts.
●●   Also in September, F-Secure released a new version                    PCs, Macs and mobile devices running on Android,                 Events after period-end
     of F-Secure Mobile Security, which features universal                 ­Blackberry, iOS and Symbian operating systems.
                                                                                                                                            No material changes regarding the Company’s business or
     support for all Android devices including smartphones,
                                                                      ●●   In February, F-Secure introduced its entry into the Content      financial position have materialized after the end of December
     TVs and set-top boxes. The new version also comes with
                                                                           Cloud space: F-Secure Content Anywhere. F-Secure                 2012.
     a completely revamped user experience and a renewed
                                                                           Content Anywhere synchronizes a user’s content in the
     commitment to family protection measures. The release                                                                                  Personnel and organization
                                                                           cloud, making it accessible on any device, including PCs,
     arrived as Android threats were intensifying. F-Secure
                                                                           smartphones, tablets and connected digital TVs, anywhere         F-Secure’s personnel totaled 931 at the end of December (942).
     Mobile Security is available through F-Secure’s eStore,
                                                                           and anytime. Consumers’ ease of use is paramount when            The number of personnel has decreased, especially in the R&D
     global mobile operators and channel partners, and is also
                                                                           accessing their content from more than one device and            function, due to reductions of 41 employees in the French
     distributed via Google Play .
                                                                           therefore the user interface will be uniform across all          subsidiary.
●●   In May, F-Secure released an updated version of its security-         connected devices. Operators will be able to offer a safe            F-Secure revised its organizational structure as of July 1, 2012.
     as-a-service solution, F-Secure Protection Service for                personal cloud to their customers to save, synchronize and       With this organizational change, F-Secure aims to improve
     Business, which now includes protection for smartphones               share their digital content.                                     its operational efficiency as well as time-to-market and
F-Secure 2012   02 09


 market-centricity. The main sales channels are the operator          The objective of F-Secure’s capital management is to            web pages. F-Secure will publish its corporate governance
 channel with Internet Security and Content Cloud services, and    achieve an efficient capital structure that ensures the func-      statement for 2012 in the Annual Report and on the Company
 other channels with traditional license sales to businesses and   tioning of business operations and promotes the increase of        website in March 2013.
 consumers.                                                        shareholder value.
    Pirkka Palomäki acted as an interim CEO of the Company                                                                            Annual General Meeting
 between November 1, 2011 - January 15, 2012. Christian            Shares, shareholders’ equity, own shares                           The Annual General Meeting of F-Secure Corporation was held
 Fredrikson started as President and CEO as of January 16, 2012.   and option programs                                                on April 3, 2012. The Meeting confirmed the financial state-
Mr. Fredrikson joined F-Secure from Nokia Siemens Networks,        The total number of Company shares is currently 158,798,739.       ments for the financial year 2011. The members of the Board
 where he worked in several international executive positions      The corresponding number of shares diluted is 159,115,294. The     and the President and CEO were granted a discharge from
 from 1994. In the recruiting process, the Board especially        Company’s registered shareholders’ equity is EUR 1,551,311.18.     liability. The Annual General Meeting decided to distribute
 valued Mr.Fredrikson’s strong experience in the operator          The total number of own shares held at the end of December         a dividend of EUR 0.06 per share, which was paid to those
 business as well as his international experience.                 2012 was 3,732,390 shares, corresponding to approximately          shareholders that on the record date of April 10, 2012 were
    Currently, the Leadership Team consists of the following       2.4% of the Company’s shares and voting rights. Own shares         registered in the Register of Shareholders held by Euroclear
 persons: Christian Fredrikson (President and CEO), Ari            will be purchased to be used in the incentive compensation         Finland Ltd. The dividend was paid on April 17, 2012.
Alakiuttu (Human Resources & Facilities), Samu Konttinen           plans, to improve the Company’s financial structure, to be used         The Annual General Meeting decided that the annual
(Customer and Market Operations), Timo Laaksonen (Content          for making acquisitions or implementing other arrangements         compensation remain on the previous year’s level; for the
Cloud Business), Maria Nordgren (Consumer Security                 related to the Company’s business, or otherwise assigning or       chairman it is EUR 55,000, for the chairmen of Executive and
­Business), Pirkka Palomäki (Chief Strategy Office), Jari Still    cancelling the shares.                                             Audit Committee EUR 40,000 and for members EUR 30,000.
(R&D Operations), Pekka Usva (Corporate Security Business)             The subscription period of F-Secure shares with F-Secure       Approximately 40% of the annual remuneration will be paid as
 and Taneli Virtanen (Chief Financial Officer).                    2005 warrant program ended on November 30, 2012. Currently,        company shares.
                                                                   the Company does not have any warrant program.                          It was decided that the number of Board members would
Finance and capital structure                                          In November 2012, the Board of Directors established a new     be six. The following members were re-elected: Jussi Arovaara,
Cash flow from operations in 2012 was 25.6 million positive        synthetic option-based incentive program, earning period           Sari Baldauf, Pertti Ervi, Juho Malmberg, Anu Nissinen and
(20.8m positive). The net financial income was slightly negative   2012–2014, for its key employees excluding the management.         Risto Siilasmaa. The Board elected in the first meeting Mr.
at 0.3 million (negative 0.1m), impacted by low interest income    The purpose of the program is to increase the value of the         Siilasmaa as the Chairman of the Board. The Board nominated
and exchange rates losses.                                         company and to commit the key employees to the company.            Ms. Baldauf as the Chairman of the Executive Committee and
    The Company’s cash position has developed according to             In January 2013, the company assigned a total of 316,555       Mr. Siilasmaa and Ms.Nissinen as members of the Executive
the longer term efficient capital management objectives. The       shares to 19 participants of the F-Secure share-based incentive    Committee. Mr. Ervi was nominated as the Chairman of the
market value of F-Secure’s liquid assets on December 31, 2012      program as a reward payment based on the 2009 earning              Audit Committee and Mr. Arovaara and Mr. Malmberg were
was 33.1 million (28.1m). Dividends of 9.3m were paid in April.    period (share-based incentive program 2008–13). After the          nominated as members of the Audit Committee.
Changes in exchange rates had a slight positive impact on          transfer, F-Secure Corporation holds a total of 3,415,835 of its        It was decided that the auditors fee will be paid against an
profitability.                                                     own shares.                                                        approved invoice. Ernst & Young Oy was elected as the Groups
    F-Secure’s capital expenditure in 2012 was 10.3 million                                                                           auditors. APA, Mr. Erkka Talvinko is acting as the responsible
(18.7m), consisting mainly of IT hardware and software as well     Corporate Governance                                               partner.
as capitalization of development expenses amounting to 4.9         F-Secure complies with the Corporate Governance recommen-               It was decided that the Board of Directors may pass a
million (7.8m).                                                    dations for public listed companies published by the Securities    resolution to purchase a maximum of 10,000,000 shares of
    F-Secure’s financial position remained solid. F-Secure’s       Market Association, a body established by the Confederation        the Company. The amount represents approximately 6.3% of
equity ratio at the end of December was 73% (68%) and the          of Finnish Industries EK, the Central Chamber of Commerce          all the shares issued by the Company. The authorization would
gearing ratio was 51% negative (47% negative).                     and NASDAQ OMX Helsinki Ltd., as explained on F-Secure’s           be valid for one year. The authorization covers the purchase of
F-Secure 2012   02 10


shares through public trading on the NASDAQ OMX Helsinki             shares may be carried out in deviation from the shareholders’          device. The choice of device depends on the place, context
Ltd. in accordance with its rules or through a public tender offer   pre-emptive rights (directed issue). The authorization is valid        and time people have on their hands. Many activities are
made to the shareholders of the Company. The consideration           for 18 months. In connection with registering this authorization,      performed either sequentially or in parallel on various devices
payable for the shares shall be based on the market price.           the authorization by the AGM 2011 for a directed share issue           which defines new requirements for software.
    In purchasing of the Company’s own shares derivative,            was reversed.                                                              Users create and share content 24/7. The volume of
share lending and other contracts customary to the capital                                                                                  user-generated digital content is expected to continue to
markets may be concluded pursuant to law and applicable legal        Market view                                                            increase rapidly during coming years, driven by digital photos,
provisions. The authorization entitles the Board of Directors to     The long-term market opportunities are attractive for F-Secure.        videos and music. According to F-Secure Broadband Consumer
pass a resolution to purchase the shares by deviating from the       Malware threats and targeted attacks to private users and              Survey, 2012 89% of people want access all their content on all
shareholders’ pre-emptive rights (directed purchase) subject         businesses in both PC and mobile operating environments are            their devices and look for services to share, store and control
to the provisions of the applicable law. Own shares will be          still evolving. Every day, F-Secure’s Labs automation handles          their personal data. Parks Associates forecasts that operators
purchased to be used for making acquisitions or implementing         and makes decisions on hundreds of thousands of executables            providing security, storage and sharing value-added services
other arrangements related to the Company’s business, to             and handles many millions of queries to the backend about              have a revenue opportunity of $1.03 billion in 2012, increasing
improve the Company’s financial structure, to be used as             URLs and binaries.                                                     to $4.82 billion by 2015.
part of the incentive compensation plan or for the purpose               The security software revenues in 2012 are estimated to                The majority of people do not trust the safety of cloud
of otherwise assigning or cancelling the shares. The Board           be $19.2 billion, growing 8.4% from the previous year (Gartner,        services according to F-Secure’s Broadband Consumer Survey.
of Directors shall have the right to decide on other matters         August 2012). The forecasted growth for the overall global             However, the need for Internet security and different kinds
related to the purchase of the Company’s own shares.                 security software market remains solid at around 8.2% until 2016       of safe content cloud services is increasing. It opens new
    The Annual General Meeting authorized the Board of Direc-        (Gartner). The growth of the security market is mostly organic         opportunities for security and safe content cloud service
tors to decide on a transfer of a maximum of 13,732,390 own          and is derived from emerging markets, such as APAC, China              providers who have built trust over years and have a solid track
shares of the Company either against consideration or without        and Latin America (Gartner, August 2012).                              record.
payment. The authorization would be valid for one year. The               At the same time as threats are emerging, the number of               New players in the Internet security area are entering the
Board of Directors is authorized to transfer the shares in           Internet users is growing and is close to 2.5 billion, reaching        market, especially focused on mobile operating systems. There
deviation from the shareholders’ pre-emptive rights (directed        a global Internet penetration of close to 35%; in Asia close           are a lot of new vendors in the emerging Content Cloud busi-
transfer) subject to the provisions of the applicable law. The       to 30%, in Europe over 60%, and in North America close to              ness. However, during the last quarter there were no significant
shares may be transferred as a consideration to finance              80% (Internet World Stats, U.S. Census Bureau, estimated in            changes in the competitive landscape or pricing levels for
acquisitions or in other arrangements and used as part of the        June 2012). The growth of smartphones and other Internet               Internet Security. F-Secure’s competitive position in general
equity-based incentive plans of the Company as decided by the        connected devices is expected to accelerate to tens of billions        and especially in the Operator channel has remained strong
Board of Directors. The Board of Directors shall also have the       during next ten years (gigaom/Ericson). By 2016, the total             based on innovative products with a great user experience and
right to sell the shares through public trading on the NASDAQ        installed base of mobile devices will grow threefold to 3.7 billion,   award-winning technical performance.
OMX Helsinki Oy. The Board of Directors shall have the right to      whereas desktops and notebooks will see a drastic slowdown                 Based on several industry analyst estimates, the Software
decide on other matters related to the transfer of own shares.       growing only 30% from 1.5 billion to 2 billion devices (Gartner,       as a Service (SaaS) business model is expected to continue to
    It was decided by the Annual General Meeting that the            October 2012).                                                         grow strongly and to gain more market share over traditional
Board of Directors is authorized to decide on the issuance                People have become multi-screeners who use smartphones,           license sales. For Operators, the Software as a Service model
of shares. The amount of shares to be issued based on this           tablets, computers or even TVs to get online. According                is a natural expansion to their other service offerings. The
authorization shall not exceed 40,000,000 shares. The Board          to F-Secure’s Consumer Broadband Survey 2012 (6,400                    SaaS business offers operators an opportunity to replace
of Directors decides on all the conditions of the issuance of        broadband subscribers from France, the UK, Germany, Sweden,            revenues lost from the provision of commoditized services
shares. The authorization concerns both the issuance of new          Finland, Italy, Spain, the Netherlands, Belgium, USA, Canada,          and to increase loyalty in the face of competitive threats from
shares as well as the transfer of treasury shares. The issuance of   Brazil, India and Japan) 65% of people have more than one              over-the-counter providers and third parties.
F-Secure 2012   02 11


Long-term objectives and strategy                                   subscriber base. Profitability is targeted to develop towards the   distributable shareholders’ equity. The suggested dividend
summary for 2012–2014                                               25% level at the end of the strategy period. F-Secure’s longer-     record date is April 8, 2013 and the payment date April 16, 2013.
The Board approved F-Secure’s long-term objectives and              term profitability level continues to be driven by revenue          The dividend payout ratio is 66%.
strategy for 2012 - 2014. F-Secure’s first priority is to drive     growth and scalable operations.                                         On December 31, 2012, the parent company distributable
growth and market expansion. Based on the Company’s strong                                                                              equity totaled EUR 43,9 million. No material changes have
technology assets in security products, cloud computing and         Outlook for 2013                                                    taken place in the company’s financial position after the
Content Cloud services, F-Secure continues to create new            The long-term business opportunity with Internet Security and       balance sheet date and the proposed dividend does not
innovative offerings to augment traditional security services,      Content Cloud products for multiple devices and platforms           compromise the company’s financial standing.
especially in the Content Cloud space.                              is attractive. The Company is looking for ways to increase its
   The Company sells its products globally through three            revenue growth and to improve its profit margin.                    Helsinki, February 14, 2013
channels; Direct to Consumer channel (eStore, App Stores,               The Operator channel is expected to continue to drive
retail), Corporate channel (reseller network) and Operator          the revenue growth powered by Internet security sales and           F-Secure Corporation
channel (SaaS).                                                     supported by a productized, highly-scalable Content Cloud           Board of Directors
    Operators, including Internet service providers, mobile         service. However, the short-term revenue growth remains
operators and cable operators, are the main channel for             at a lower level due to contractual changes and decreased           Risto Siilasmaa
F-Secure services. F-Secure provides, through operators,            Content Cloud project revenues as the project sizes are             Jussi Arovaara
award-winning security and Content Cloud services and utilizes      smaller. The Company also estimates good progress from the          Sari Baldauf
the local presence and brand of operators to reach millions of      Corporate and Direct to Consumer channels. To meet the              Pertti Ervi
consumers in a cost-efficient and scalable way.                     evolving threat level and to open new business opportunities        Juho Malmberg
    F-Secure’s competitive advantage derives from existing          for Internet Security services, F-Secure will continuously launch   Anu Nissinen
operator network and relationships built over the years. Key        new security features with a shorter time to market over the
assets include security research, scalable products optimized       upcoming quarters.                                                  President and CEO
for the mass-market, experience in service provisioning in the          The actual operational cost increase is fairly limited, and     Christian Fredrikson
operator network environment and the growing user base of           is targeted at driving product portfolio competitiveness and
operators. F-Secure stands out in its ability to combine security   supporting geographical expansion.
with safe Content Cloud services for both computers and                 Management’s estimation for the year: the annual revenue
mobile devices and its understanding of the Operator channel        growth is estimated to be over 5% compared to 2012. The
as a whole.                                                         annual profitability is estimated to be over 15% of revenues. The
    During the strategy period, the Company is aiming for           revenue estimate is based on the sales pipeline at the time of
double-digit revenue growth, driven by the Operator channel         publishing, existing subscriptions and support contracts as well
and supported by the Corporate and Direct to Consumer               as current exchange rates. The Company continues to priori-
channels. The growth is expected to come from the western           tize growth over short-term profitability and plans to invest the
hemisphere and some emerging markets like Latin America             majority of the improved earnings in growth opportunities in
and APAC.                                                           its core business, while aiming to improve profitability.
   The Company will continue its investments in new services
around the Content Cloud and Internet security products with        Proposal for dividend distribution
emphasis on end-customer focus. These investments ensure            The Board of Directors is proposing to the Annual General
the scalability and competiveness of the services and drive         Meeting 2012, to be held on Wednesday, April 3, 2013, that
F-Secure service ramp-up, both PC and mobile, for a wide            a dividend of EUR 0.06 per share is to be paid from the
F-Secure 2012   03 12


                                                  Statement of comprehensive income
Financial Statements                              Jan 1–Dec 31, 2012
F-Secure consolidated                                                                                                   Consolidated,       Consolidated,
                                                  EUR 1,000                                                    Note        IFRS 2012           IFRS 2011

                                                  NET SALES                                                      (1)        157,172                146,028
                                                  Material and service                                                       –7,438                 –7,955

                                                  GROSS MARGIN                                                              149,734                138,073
                                                  Other operating income                                         (2)          1,756                  1,417
                                                  Sales and marketing                                          (3, 4)       –70,936                –64,674
                                                  Research and development                                     (3, 4)       –49,311                –39,319
                                                  Administration                                               (3, 4)       –10,973                –11,899

                                                  OPERATING RESULT                                                           20,270                 23,598
                                                  Financial income and expenses                                  (7)          –327                   –130
                                                  Share of profit of associate                                  (11)            –47                     28

                                                  PROFIT (LOSS) BEFORE TAXES                                                 19,896                 23,496
                                                  Income taxes                                                   (8)         –5,835                 –7,125

                                                  RESULT FOR THE FINANCIAL YEAR                                              14,061                 16,370

                                                  Other comprehensive income
                                                  Exchange difference on translation of foreign operations                      183                   –21
                                                  Available-for-sale financial assets                            (7)            104                   120
                                                  Taxes related to components of other comprehensive income     (8)            –25                   –31

                                                  COMPREHENSIVE INCOME FOR THE YEAR                                          14,323                 16,438

                                                  Result of the financial year is attributable to:
                                                  Equity holders of the parent                                               14,061                 16,370

                                                  Comprehensive income for the year is attributable to:
                                                  Equity holders of the parent                                               14,323                 16,438

                                                  Earnings per share
 Edward, Marketing Manager, Operator Activities   – basic                                                        (9)           0.09                   0.11
                                                  – diluted                                                                    0.09                   0.10
F-Secure 2012   03 13


Statement of financial position Dec 31, 2012
                                             Consolidated,   Consolidated,                                                         Consolidated,       Consolidated,
EUR 1,000                             Note      IFRS 2012       IFRS 2011    EUR 1,000                                    Note        IFRS 2012           IFRS 2011

ASSETS                                                                       SHAREHOLDERS’ EQUITY AND LIABILITIES
NON-CURRENT ASSETS                                                           SHAREHOLDERS’ EQUITY                           (18)
Tangible assets                       (10)         9,767            9,072    Share capital                                               1,551                 1,551
Intangible assets                     (10)        20,847           25,256    Share premium                                                 165                   165
Goodwill                              (12)        19,398           19,398    Treasury shares                                            –8,419                –9,002
Investments in associated companies   (11)            94              155    Fair value reserve                                            195                   116
Deferred tax assets                   (13)         5,035            5,034    Translation differences                                        14                 –169
Other financial assets                                                308    Reserve for invested unrestricted equity                    5,051                 5,051
Total non-current assets                          55,141           59,223    Retained earnings                                          66,547                61,845
                                                                             Equity attributable to equity holders of the parent        65,105                59,557
CURRENT ASSETS
Inventories                           (14)           235             350     NON-CURRENT LIABILITIES
Trade and other receivables           (15)        36,008          36,741     Deferred tax liabilities                      (13)            446                  1,617
Income tax receivables                (15)         2,688           1,160     Provisions                                    (20)            130
Available-for-sale financial assets   (16)        16,793          15,993     Other non-current liabilities                 (21)          8,497                  8,442
Cash and bank accounts                (17)        16,480          12,205     Total non-current liabilities                               9,073                 10,059
Total current assets                              72,204          66,450
TOTAL ASSETS                                     127,345         125,673     CURRENT LIABILITIES                           (21)
                                                                             Trade and other payables                                   23,289                 25,484
                                                                             Income tax liabilities                                        627                    739
                                                                             Other current liabilities                                  29,252                 29,833
                                                                             Total current liabilities                                  53,167                 56,057
                                                                             TOTAL SHAREHOLDERS’ EQUITY AND
                                                                             LIABILITIES                                               127,345                125,673
F-Secure 2012   03 14


Statement of cash flows Dec 31, 2012
                                                    Consolidated,   Consolidated,                                                      Consolidated,       Consolidated,
EUR 1,000                                    Note      IFRS 2012       IFRS 2011    EUR 1,000                                   Note      IFRS 2012           IFRS 2011

Cash flow from operations                                                           Cash flow from investments
Result for the financial year                            14,061           16,370    Investments in intangible and tangible assets          –11,120                –16,686
Adjustments                                (24)          19,867           16,491    Proceeds from sale of intangible and tangible
Cash flow from operations before change in                                          assets                                                                             1
working capital                                          33,927           32,861    Proceeds from sale of other investments                      1                     5

Change in net working capital                                                       Cash flow from investments                             –11,120                –16,680
  Current receivables, increase (–),
  decrease (+)                                              658           –7,586
                                                                                    Cash flow from financing activities
  Inventories, increase (–), decrease (+)                   115               43
                                                                                    Increase in share capital                                                       1,864
  Non-interest bearing debt, increase (+),
  decrease (–)                                             –399            2,389    Treasury shares                                                                –1,509
  Provisions, increase (+), decrease (–)                    130               –1    Dividends paid                                          –9,304                 –9,254
                                                                                    Decrease in short term liabilities                                              –200
Cash flow from operations before financial items                                    Cash flow from financing activities                     –9,304                 –9,099
and taxes                                                34,432           27,707
                                                                                    Change in cash                                           5,176                 –4,981
Interest expenses paid                                       –7               –8
Interest income received                                     15               42    Cash and bank at the beginning of the period            28,051                 32,831
Other financial income and expenses                       –217               –69
Income taxes paid                                        –8,623           –6,874    Translation difference                                    –205                    81

Cash flow from operations                                25,599           20,798    Change in net fair value of current
                                                                                    available-for-sale assets                                  105                   120

                                                                                    Cash and bank at period end                             33,127                 28,051
F-Secure 2012   03 15


Statement of changes in equity Dec 31, 2012
Attributable to the equity holders of the parent

                                                           Share premium    Treasury   Available                    Unrestricted    Retained
EUR 1,000                                  Share capital             fund     shares    for sale   Transl. diff.   equity reserve   earnings      Total equity

Equity Dec 31, 2010                               1,551              169     –7,493          27          –148              3,186     54,141              51,432

Available-for-sale financial assets, net                                                     89                                                              89
Translation difference                                                                                     –21                                              –21
Result of the financial year                                                                                                         16,370              16,370
Total comprehensive income for the year                                                      89            –21                       16,370              16,438

Dividends                                                                                                                            –9,254              –9,254
Acquisition of treasury shares                                               –1,509                                                                      –1,509
Exercise of options                                                                                                        1,864                          1,864
Cost of share based payments                                                                                                            586                 586
Equity Dec 31, 2011                               1,551              169     –9,002         116          –169              5,050     61,843              59,557

Available-for-sale financial assets, net                                                     80                                                              80
Translation difference                                                                                     184                                              184
Result of the financial year                                                                                                         14,061              14,061
Total comprehensive income for the year                                                      80            184                       14,061              14,324

Dividends                                                                                                                            –9,304              –9,304
Cost of share based payments                                                    583                                                     –55                 528
Equity Dec 31, 2012                               1,551              169     –8,419         195             15             5,050     66,545              65,105
F-Secure 2012   03 16


Notes to the financial statements
Group information                                                      Revised IFRS 1 First Time Adoption of IFRS regarding a               the discount rate.The key assumption used to determine
F-Secure produces software protection and Internet security         severe Hyperinflation and Removal of Fixed Dates for First-time         the recoverable amount for goodwill, including sensitivity
services for consumers and businesses against computer              Adopters: The adoption of the standard had no affect on the             analysis, are further explained in note 12;
viruses and other threats coming through the Internet or            Group’s Financial Statement.
                                                                                                                                       ●●   deferred tax assets: the Group has assessed how much
mobile networks, as well as online backup services preventing          Amendment to IAS 12 Deferred tax: Recovery of Underlying
                                                                                                                                            unused tax losses can be utilized in the future and has
loss of valuable content and enabling sharing of important files.   Assets: The amendment relates to the booking of deferred tax
                                                                                                                                            recognized these tax losses as deferred tax assets. Further
    The parent company of the Group is F-Secure Corporation         assets investments in real estates. The adoption of the standard
                                                                                                                                            details are disclosed in note 13;
incorporated in Finland and domiciled in Helsinki. Company’s        had no affect on the Group’s Financial Statement.
registrant address is Tammasaarenkatu 7, 00180 Helsinki. A                                                                             ●●   development expenditures carried forward: initial capi-
copy of consolidated financial statement can be received on         Management judgment on significant accounting                           talization of cost is based on management’s judgment on
the Internet address www.f-secure.com or from the parent            principals and use of estimates and assumptions                         technological and economical feasibility. The Group has
company’s registrant address.                                                                                                               made assumptions regarding the expected future cash
                                                                    The preparation of the consolidated financial statements
    In their meeting on 14 February 2013 the Board of Directors                                                                             generation of the projects. Further details are disclosed in
                                                                    requires the use of estimates and assumptions as well as use
of F-Secure Corporation has agreed to permit the publication                                                                                note 10.
                                                                    of judgment when applying accounting principles that affect
of the consolidated financial statements of F-Secure Corpora-
                                                                    the reported amount of assets and liabilities, and the reported    ●●   used arguments when recognizing share-based payment
tion for the year 2012. According to the Finnish Companies
                                                                    amounts of revenues and expenses during reporting periods. It           transactions: the cost of share-based payment transactions
Act, the Annual General Meeting can confirm or reject the
                                                                    is possible that actual results may differ from these estimates.        are based on to the fair value at the date at which they were
consolidated financial statement after publication. The General
                                                                        The estimates are based on management’s best knowledge              granted. The cost of cash-settled transactions is measured
Annual Meeting can also decide to change the financial
                                                                    at the reporting date. Estimates and assumptions are based              by reference to the fair value at the date of balance sheet.
statement.
                                                                    upon past experience, as well as information available relating         The assumptions and models used for estimating fair value
                                                                    to the Group’s expected development of the economic                     for share-based payment transactions are disclosed in
ACCOUNTING PRINCIPLES
                                                                    environment. Possible changes in estimates and assumptions              note 19.
Basis for presentation                                              are recognized in the period when they occur.
                                                                        The key judgments and assumptions concerning the future        Principles of consolidation
The consolidated financial statements of F-Secure Corporation
                                                                    and other key sources of estimation uncertainty at the reporting
of 2011 have been prepared in accordance with International                                                                            Subsidiaries in which F-Secure Corporation’s holding exceeds
                                                                    date, that have a significant risk a material adjustment are
Financial Reporting Standards (IFRS) and IAS- and IFRS- stan-                                                                          50 percent are consolidated in the financial statements.
                                                                    following:
dards as well as SIC- and IFRIC- interpretations valid 31st of                                                                         Subsidiaries are consolidated from the date on which control
December 2011 has been followed as adopted by the EU. The           ●●   revenue recognition: service based project deliveries are     is transferred to the Group and cease to be consolidated from
disclosures also conform to Finnish Accounting legislation.              recognized with the percentage of completion method,          the date on which control is transferred out of the Group. The
    The Group has adopted the following new or amended Stan-             when the outcome is reliably estimated.                       Company’s holding in the associated companies is also consoli-
dards and Interpretations during the year.                                                                                             dated. The Group’s investment in its associate is accounted for
                                                                    ●●   assessment of assets: at each reporting date, the Group
    Amendments to IFRS 7 Financial Instruments: Disclosures–                                                                           under the equity method of accounting. The income statement
                                                                         assesses whether there is any indication that an asset may
Transfers of Financial Assets: The amendments improve the                                                                              reflects the share of the results of operations of the associate.
                                                                         be impaired.
transparency of presentation of the business transactions                                                                              Equity accounting is discontinued when the carrying amount of
regarding the transfers of the financing instruments. The           ●●   impairment of assets: the recoverable amount is deter-        the investment in an associated company reaches zero, unless
adoption of the standard had no affect on the Group’s Financial          mined based on value in use calculations. The key variables   the Group has incurred or guaranteed obligations in respect
Statement.                                                               used in the calculations are profitability, growth rate and   of the associated company. The Group’s share of profit or loss
F-Secure 2012   03 17

of an associate is shown as a separate line after the operating       undertaken at the date of acquisition plus costs directly            straight-line basis over the estimated useful life of an asset. The
result.                                                               attributable to the acquisition. The excess cost of acquisition      estimated useful lives of tangible assets are as follows:
    All intra-group transactions and balances, including unreal-      over the fair value of the net assets of the subsidiary acquired     Machinery and equipment	           3–8 years
ized profits arising from intra-group transactions, have been         is recorded as goodwill. Goodwill represents the excess of           Other tangible assets	            5–10 years
eliminated on consolidation. Where necessary, the accounting          purchase cost over the fair value of separately identifiable             Ordinary repairs and maintenance costs are charged to the
policies of subsidiaries have been adjusted to ensure consis-         assets less liabilities of acquired companies. Following initial     income statement during the financial period in which they
tency with the policies adopted by the Group.                         recognition, goodwill is measured at cost less any accumulated       are incurred. The cost of major renovations is included in the
                                                                      impairment losses. Goodwill is reviewed for impairment, annu-        assets’ carrying amount when it is probable that the Group
Segment reporting                                                     ally or more frequently if events or changes in circumstances        will derive future economic benefits in excess of the originally
The Group has one segment; data security. The segment is              indicate that the carrying value may be impaired.                    assessed standard or performance of the existing asset. Any
reported in a manner consistent with the internal reporting                                                                                gain or loss arising on derecognition of the asset (calculated
provided with the chief operating decision maker. The chief           Research and development costs                                       as the difference between the net disposal proceeds and
operating decision maker, who is responsible for the allocating       Research costs are expensed as incurred. Development                 the carrying amount of the asset) is included in the income
resources and assessing performance, has been identified as           expenditures incurred on individual projects of totally new          statement in the year the asset is derecognized. Gains or losses
the Executive Team that makes strategic decisions.                    products or product versions with significant new features are       on de-recognition are shown in other operating income or
                                                                      carried forward when they are technically feasible and their         expenses.
Foreign currency translation                                          future recoverability can reasonably be regarded as assured.
The presentation currency of F-Secure Group is the euro, which        Depreciation is recorded on a straight-line basis over the           Government grants
is the measurement currency of the parent. For purposes               estimated useful life of an asset. The estimated useful life of      Government grants are recognized at their fair value where
of inclusion in the consolidated financial statements, the            these assets is 3 years.                                             there is reasonable assurance that the grant will be received
balance sheet of each foreign entity is translated into euros at                                                                           and all attaching conditions will be complied with. When the
the exchange rates prevailing at the balance sheet date. The          Other intangible assets                                              grant relates to an expense item, it is recognized as income
income statement of each foreign entity is translated at the          Intangible assets recognized separately from goodwill in             over the period necessary to match the grant on a systematic
average exchange rates for the financial year. The resulting net      acquisitions consist of technology-based intangible assets and       basis to the costs that it is intended to compensate. These
translation difference is recorded in the shareholders’ equity        customer-based intangible assets. The fair value was measured        grants are recognized as other operating income in the
and the change in the other comprehensive income.                     by using Multi-Period Excess Earnings model. Depreciation is         income statement. Government grants related to an asset are
    The Consolidated Statement of Cash Flows has been                 recorded on a straight-line basis over the estimated useful life     deducted from the acquisition cost of the asset and recognized
prepared by translating each subsidiary’s individual cash flow        of an asset. The estimated useful life of these assets is 8 years.   as income by reducing the depreciation charge of the asset
statements at the average exchange rates for the financial                Other intangible assets include intangible rights and            they relate to.
year.                                                                 software licenses. Assets with finite useful life are recorded at
    Foreign currencies are translated into the local currency         historical cost less accumulated depreciation. Depreciation          Inventories
using fixed monthly exchange rates. At the balance sheet              of intangible rights is recorded on a progressive basis over         Inventories are valued at the lower of cost and net realizable
date, assets and liabilities denominated in foreign currencies        the estimated useful life of an asset. Depreciation of software      value with cost being determined by first-in first-out method.
are translated at the rates of exchange prevailing at that date.      licenses is recorded on straight-line basis over the estimated       Net realizable value is the estimated selling price in the
Exchange rate gains and losses of financial transactions are          useful life of an asset. The estimated useful lives of other         ordinary course of business, less estimated costs of completion
recognized in the income statement under financial items.             intangible assets are as follows:                                    and the estimated costs necessary to make the sale.
                                                                      Intangible rights	                    5 years
INTANGIBLE ASSETS                                                     Other intangible assets	          5–10 years                         Leases
                                                                                                                                           Leases where the lessor retains substantially all the risks and
Goodwill                                                              Tangible assets                                                      benefits of ownership of the asset are classified as operating
Mutual ownership of shares has been accounted using the               Other tangible assets include renovation costs of rented             leases. The Group has only operating leases. Operating lease
acquisition method. The cost of an acquisition is measured at         office space. Tangible assets are recorded at historical cost        payments are recognized as an expense in the income state-
the fair value of the assets given up, shares issued or liabilities   less accumulated depreciation. Depreciation is recorded on a         ment on a straight-line basis over the lease term.
F-Secure 2012   03 18

Impairment of assets                                                   together with a corresponding entry in equity and liability, over       tax basis of assets and liabilities, use the enacted tax rates in
At each reporting date, the Group assesses whether there               the period in which the performance conditions are fulfilled,           effect in the years in which the differences are expected to
is any indication that an asset may be impaired. Where an              ending on the date on which the relevant employees become               reverse. Deferred tax assets are recognized to the extent that it
indicator of impairment exists, the Group makes a formal               fully entitled to the award (vesting date). If the holder of the        is probable that future taxable profit will be available.
estimate of recoverable amount. Where the carrying amount of           warrant leaves company before vesting the warrant is forfeited.
an asset exceeds its recoverable amount the asset is considered        The cumulative expense recognized for transactions at each              Revenue recognition
impaired and written down to its recoverable amount. Recover-          reporting date until the vesting date reflects the extent to            Revenue is primarily derived from monthly software as a service
able amount is the higher of an asset’s or cash-generating unit’s      which the vesting period has expired and the number of awards           sale, software license agreement sales and operator’s system
fair value less costs to sell and its value in use and is determined   that, in the opinion of the directors of the Group at that date,        integration and maintenance sales. License agreements consist
for an individual asset, unless the asset does not generate cash       based on the best available estimate of the number of equity            of initial license agreements and periodic maintenance agree-
inflows that are largely independent of those from other assets        instruments that will ultimately vest.                                  ments covering product updates and customer support. The
or groups of assets. A previously recognized impairment loss is            The share-based incentive program has been established              revenue recognition policy of F-Secure Group recognizes the
reversed only if there has been a change in the estimates used         as part of the key employee incentive and retention system              service revenue at the time of delivery, the license agreement’s
to determine the asset’s recoverable amount since the last             inside F‑Secure Group. Reward will be settled in two phases so          license fee revenues as the product is delivered, the license
impairment loss was recognized. The increased amount cannot            that one part is settled as equity-settled payment and one part         agreement’s maintenance revenues are recognized over the
exceed the carrying amount that would have been determined,            as cash-settled payment. Cost of equity-settled transactions            maintenance period, and service based project deliveries
net of depreciation, had no impairment loss been recognized            is measured by reference to the fair value by using market              are recognized with the percentage of completion method,
for the asset in prior years. Impairment losses relating to            price of F-Secure Corporation share at the date on which they           when the outcome can be reliably estimated. The degree of
Goodwill cannot be reversed in future periods.                         are granted and cost of cash-settled by using market price              completion is determined by relation of project costs incurred
                                                                       of F-Secure Corporation on the date of balance sheet. The               for work performed to date bear the estimated total project
Pensions                                                               cost is recognized over the period in which the performance             costs. If total project costs will exceed total project revenue,
All of F-Secure Group’s pension arrangements are in accor-             conditions are fulfilled, ending on the date on which the               the expected loss is recognized as an expense immediately.
dance with local statutory arrangements and defined contribu-          relevant employees become fully entitled to the reward (end             Indirect taxes, discounts granted and exchange rate differences
tion plans. Contributions to defined contribution plans are            of lock-up period). The cost of equity-settle corresponding             are excluded from net sales.
recognized in the income statement in the period to which the          entry is recognized in equity and cost of cash-settle in liabilities.
contributions relate. The Group recognizes disability commit-          If relevant employee leaves company before fully entitled to            Other operating income
ment of Finnish TYEL pension plan when disability appears.             the reward, the reward is forfeited. The cumulative expense             Other operating income includes profits from the sales of fixed
                                                                       recognized for share-based incentive program transactions at            assets, rental revenue, and government grants received for
Share-based payment transactions                                       each reporting date is based on the best available estimate of          research and development projects.
In the Company’s industry it is common practice internation-           the number of equity instruments that will ultimately fulfill.
ally that incentives are provided to employees in the form of                                                                                  Presentation of expenses
equity-settled share-based instruments. Company has three              Provisions                                                              Classification of the functionally presented expenses has
kinds of incentive programs; warrant-based program, synthetic          Provisions are recognized when the Group has a present                  been made as follows: various types of expenses in different
warrant-based program and a share-based program.                       obligation (legal or constructive) as a result of a past event, it      geographical locations have been allocated to the various
    The Company’s warrant programs cover key personnel. The            is probable that an outflow of resources embodying economic             functions by allocating to directly allocable expenses to the
warrant program reward is settled as equity-settled payment            benefits will be required to settle the obligation and a reliable       respective function, and other operating expenses have been
and synthetic warrant-based program as cash-settled payment.           estimate can be made of the amount of the obligation.                   allocated to functions on the basis of average headcount in
The cost of equity-settled transactions with employees is                                                                                      each location.
measured by reference to the fair value at the date on which           Income taxes
they are granted. The cost of cash-settled transactions with           Direct current taxes are calculated on the results of all Group         Operating results
employees is measured by reference to the fair value at the            companies in accordance with the local tax and accounting               IAS 1 Presentation of Financial Statements standard does
date of balance sheet. The fair value is determined by using           rules in each country. Deferred taxes, resulting from temporary         not define the concept of operating result. The Group has
the Binomial model. The cost of transactions is recognized,            differences between the financial statement and the income              defined it as follows: operating result is the net amount, which
F-Secure 2012   03 19

consists of the net sales and other operating income less             When financial assets recognized as available-for-sale is sold,     initial adoption. The amended standard becomes effective for
cost of purchase which is adjusted for changes in inventories,        the accumulated fair value changes are released from equity         the financial years beginning on or after 1 January 2013. The
and reduced employee benefit costs, depreciation, possible            and recognized in the income statement.                             standard is adopted by the EU.
impairment losses and other operating expenses.                          Cash and cash equivalents in the Consolidated Statement of           IFRS 9 Financial Instruments: The Group expects that
                                                                      Financial position comprise cash at bank and in hand and other      adoption of the revised standard will have an impact on the
Non-recurring items                                                   highly liquid short-term investments.                               disclosures of Group’s financial statements in the period of
One-off items include mainly income and expenses related to              For the purpose of the Consolidated Statement of Cash            initial application. Amended standard becomes effective
restructurings, non-current impairment of assets and other            Flows, cash and cash equivalents consist of cash and cash           for financial years beginning on or after 1 January 2015. The
non-recurring items which are not based on the Group’s                equivalents as defined above.                                       standard is not adopted by the EU.
normal activities and which distort the comparability of the                                                                                  IFRS 10 Consolidated Financial Statements: The Group
groups underlying profitability.                                      Derivative financial instruments and hedging                        expects that the adoption of the revised standard will have
                                                                      The Group uses derivative financial instruments such as forward     an impact on the Group’s financial statements in the period
Treasury shares                                                       currency contracts to hedge its risks associated with foreign       of initial adoption. The amended standard becomes effective
Parent company has acquired treasury shares. The cost of              currency fluctuations. Such derivative financial instruments are    for financial years beginning on or after 1 January 2014. The
acquisition is recognized as a deduction in the shareholders’         initially recognized at fair value on the date on which a deriva-   standard is adopted by the EU.
equity.                                                               tive contract is entered into and are subsequently recognized           IFRS 11 Joint Arrangements: The Group expects that the
                                                                      at fair value. Any gains and losses arising from changes in fair    revised standard will not have an impact on the Group’s finan-
Financial assets                                                      value on derivatives that do not qualify for hedge accounting       cial statements in the period of initial application. The amended
According to IAS 39 standard, financial assets have been              are taken directly to net profit or loss for the year. The fair     standard becomes effective for financial years beginning on or
classified into financial assets at fair value through profit or      value of forward currency contracts is calculated by reference      after 1 January 2014. The standard is adopted by the EU.
loss, held-to-maturity, loans and receivables originated by the       to current forward exchange rates for contracts with similar            IFRS 12 Disclosures of Interests of Other Entities: The Group
enterprise and available-for-sale financial assets. The classifica-   maturity profiles.                                                  expects that the revised standard will have an impact on the
tion is dependent on the purpose for which the assets were                                                                                Group’s financial statements in the period of initial application.
acquired. Purchases and sales of financial assets are recognized      Adoption of new and revised standards                               The amended standard becomes effective for financial years
on the trade date i.e. the date that the Group commits to             The Group has not applied the following new or revised              beginning on or after 1 January 2014. The standard is adopted
purchase the asset. The cost of purchase includes transaction         Standards and Interpretations that have been issued, but are        by the EU.
costs. Financial assets are currently classified as loans and         not yet effective.                                                      IFRS 13 Fair Value Measurement: The Group expects that
receivables and available-for-sale financial asset.                       Amendment to IAS 1 Presentation of Items of Other               the revised standard will have impact on the Group’s financial
    Loans and receivables originated by the enterprise are            Comprehensive Income: The Group expects that the revised            statements in the period of initial application. The amended
measured at amortized cost. Trade receivables are carried             standard will have impact on the Group’s financial statements       standard becomes effective for financial years beginning on or
at the original invoice amount to customers less an estimate          in the period of initial application. Amended standard becomes      after 1 January 2013. The standard is adopted by the EU.
made for doubtful receivables. Outstanding receivables are            effective for financial years beginning on or after 1 July 2012.        IAS 27 Separate Financial Statements: The Group expects
reviewed periodically and bad debts are written off when              The standard is adopted by the EU.                                  that the adoption of the revised standard will have no impact
identified.                                                               Amendment to IFRS 7 Disclosures-Offsetting Financial            on the Group’s financial statements in the period of initial
    Available-for-sale financial assets consist of interest-bearing   Assets Financial Liabilities: The Group expects that the adoption   adoption. The amended standard becomes effective for
debt securities and shares in mutual funds invested in similar        of the revised standard might have an impact on the Group’s         financial years beginning on or after 1 January 2014. The
instruments. For assets that are actively traded in organized         financial statements in the period of initial adoption. The         standard is adopted by the EU.
financial markets, fair value is determined by reference to Stock     amended standard becomes effective for the financial years              IAS 28 Investments in Associates and Joint Ventures: The
Exchange quoted market bid prices at the close of business on         beginning on of after 1 January 2013. The standard is adopted       Group expects that the revised standard will have an impact on
the balance sheet date. Assets, the fair value of which cannot        by the EU.                                                          the Group’s financial statements in the period of initial applica-
be measured reliably, are recognized at cost less impairment.             Amendment to IAS 19 Employee Benefits: The Group                tion. The amended standard becomes effective for financial
The fair value changes of available-for-sale financial assets are     expects that the adoption of the revised standard will have no      years beginning on or after 1 January 2014. The standard is
recognized in shareholders’ equity under fair value reserve.          impact on the Group’s financial statements in the period of         adopted by the EU.
F-Secure 2012   03 20

    Amendment IAS 32 Financing instruments: Presentation:
                                                                    1. Segment information
The amendment will have no significant effect on the Group’s
financial statements. The amended standard becomes effective        The Group has one business segment; data and content security. The chief operating decision
for financial years beginning on or after 1 January 2014. The       maker i.e. the leadership team gets financial information on a monthly basis of the revenue of
standard is adopted by the EU.                                      the sales channels. The revenues of different geographical areas are presented by the location of
    Improvements to IFRSs 2009–2011, May 2012: The adoption         the customers and the long-term assets by the location of the assets.
of the improvements will have no significant effect on the
Group’s financial statements in the period of initial applica-      Sales channels
tion. The amendments become effective for financial years                                                                         Operator    Other
                                                                    Consolidated Dec 31, 2012                                      Channel Channels  Group
beginning on or after 1 January 2013. The improvements have
not been adopted by EU.                                             Revenue from external customers                                95,236   61,936 157,172
    Amendment IFRS 1 Government Loans: The adoption of
                                                                                                                                  Operator    Other
the amendment will have no effect on the Group’s financial          Consolidated Dec 31, 2011                                      Channel Channels           Group
statements in the period of initial application. The amendments     Revenue from external customers                                 84,806   61,222          146,028
become effective for financial years beginning on or after 1
January 2013. The improvements have not been adopted by EU.
    IFRIC 20 Stripping Costs in the Production Phase of a Surface   Geographical information
                                                                                                           Finland
Mine: The interpretation will not have an effect on the Group’s                                                and                                 Rest
financial statements. The interpretation becomes effective                                                 Scandi-     Rest of       North       of the
                                                                    Consolidated Dec 31, 2012                navia     Europe      America       world   Group
for financial years beginning on or after 1 January 2013. The
standard is adopted by the EU.                                      Revenue from external customers        47,930      71,225       15,855      22,161 157,172
                                                                    Segment long-term assets               24,663      23,647          698       1,097  50,106

                                                                                                           Finland
                                                                                                               and                                 Rest
                                                                                                           Scandi-      Rest of      North        of the
                                                                    Consolidated Dec 31, 2011                navia      Europe     America        world       Group
                                                                    Revenue from external customers         47,291      65,111      16,413       17,213      146,028
                                                                    Segment long-term assets                23,663      28,387         487        1,652       54,189
F-Secure 2012   03 21

2. Other operating income                                                                4. Personnel expenses
EUR 1,000                                          Consolidated 2012 Consolidated 2011   EUR 1,000                                           Consolidated 2012 Consolidated 2011

Rental revenue                                                  156               144    Personnel expenses
Government grants                                             1,583             1,187    Wages and salaries                                             –56,079                  –48,332
Other                                                            18                86    Pension expenses – defined contribution plan                    –7,345                   –6,681
Total                                                         1,756             1,417    Share-based payments                                             –745                    –1,100
                                                                                         Other social expenses                                           –5,509                   –4,951
3. Depreciation and reduction in value                                                   Total                                                          –69,678                  –61,064
EUR 1,000                                          Consolidated 2012 Consolidated 2011
                                                                                         Employee benefits of Management are stated in disclosure 27. Related party transactions
Depreciations from non-current assets                                                    Share-based payments are stated in disclosure 19. Share-based payment transactions
Other capitalized expenditure                               –2,903             –2,783
Capitalized development                                                         –503     Average number of personnel                                         970                    878
                                                            –1,121
Intangible assets                                                              –3,286    Personnel by function Dec 31
                                                            –4,024
                                                                                         Sales and marketing                                                 409                    410
Machinery and equipment                                                        –2,884    Research and development                                            389                    406
                                                            –3,511
Other tangible assets                                                           –339     Administration                                                      133                    126
                                                             –405
                                                                               –3,222    Total                                                               931                    942
Tangible assets                                             –3,916
Total depreciation                                          –7,940             –6,508
                                                                                         5. Non-recurring items
Reduction in value from non-current assets                                               EUR 1,000                                           Consolidated 2012 Consolidated 2011
Other cap. expenditure                                      –5,000               –154
Capitalized development                                                          –810    Non-recurring items
Total reduction in value                                                         –964    Reduction in value                                              –5,000                    –964
                                                            –5,000
                                                                                         Personnel expenses                                              –2,238
Total depreciation and reduction in value                                      –7,472    Other operating expenses                                        –1,394
                                                           –12,940
                                                                                         Total                                                           –8,632                    –964
Depreciations and reduction in value by function
Sales and marketing                                                            –2,370    Non-recurring items by function
                                                            –5,464
Research and development                                                       –4,942    Sales and marketing                                             –2,429
                                                            –6,996
Administration                                                                  –160     Research and development                                        –5,538                    –964
                                                             –480
Total depreciation and reduction in value                                      –7,472    Administration                                                   –666
                                                           –12,940
                                                                                         Total                                                           –8,632                    –964
F-Secure 2012   03 22

6. Audit fees                                            7. Financial income and expenses
EUR 1,000          Consolidated 2012 Consolidated 2011   EUR 1,000                                       Consolidated 2012 Consolidated 2011

Group auditor                                            Interest income                                              14                    43
Audit fees                    –124               –131    Interest expense                                             –5                    –5
Tax consulting                 –24                –32    Other financial income                                      671                    81
Other consulting               –16               –102    Exchange gains and losses                                  –883                  –143
Total                         –163               –265    Other financial expenses                                   –124                  –106
Others                                                   Total financial income and expenses                        –328                  –130
Audit fees                     –21                –18
Tax consulting                 –62                –11    Financial income and expenses from loans and
                                                         receivables
Total                          –83                –29
                                                            Interest income                                           14                    43
                                                            Interest expense                                           5                    –5
                                                            Exchange gains and losses                               –990                  –108
                                                         Total                                                      –971                   –70

                                                         Financial income and expenses from Available-
                                                         for-sale financial assets
                                                            Other financial income                                   662                    74
                                                         Total                                                       662                    74

                                                         Components of other comprehensive income
                                                         available-for-sale financial assets
                                                         Gains/(losses) arising during the year                      361                   172
                                                         Reclassification adjustements included in the
                                                         income statement                                           –256                  –52
                                                         Total                                                       105                  120
F-Secure 2012   03 23

8. Income taxes                                                                                    9. Earnings per share
EUR 1,000                                             Consolidated 2012 Consolidated 2011          EUR 1,000                                             Consolidated 2012 Consolidated 2011

Income taxes of the business activity                             –6,901                 –7,261    Basic earnings per share amounts are calculated by dividing net profit for the year attributable
Income taxes from previous years                                                            140    on ordinary equity holders of the parent by the weighted average number of ordinary shares
                                                                   –129
                                                                                                   outstanding during the year. Diluted earnings per share amounts are calculated by dividing the
Deferred tax                                                       1,194                     –3
                                                                                                   net profit attributable to ordinary shareholders by the weighted average number of ordinary
Total                                                             –5,835                 –7,125
                                                                                                   shares outstanding during the year adjusted for the effects of dilutive options.

Components of other comprehensive income                                                           Net profit attributable to equity holders from
Available-for-sale financial assests                                 –25                     –31   continuing operations                                              14,061                  16,370

A reconciliation of income tax expense applicable to accounting profit before income tax at the    Weighted average number of
statutory income tax rate to income tax expense at the Groups’ effective income tax rate for the   ordinary shares (1,000)                                          155,057                  154,433
years ended 31 December 2012 and 2011 is as follows:                                               Adjusted weighted average number of ordinary
                                                                                                   shares for diluted earning per share                             156,774                  157,499

Result before taxes                                               19,896                 23,496
                                                                                                   Basic earnings per share (EUR/share)                                  0.09                   0.11
                                                                                                   Diluted earnings per share (EUR/share)                                0.09                   0.10
Income taxes at statutory rate of 24.5%/26%                       –4,874                 –6,109
Taxes on foreign subsidiaries’ net income in
                                                                                                   The weighted average number of shares take into account the effect of change in treasury
excess of income taxes at statutory rates                           –334                 –1,727    shares.
The change in tax rates                                                                      85
Non-deductible expenses                                            –358                   –581
Unrecognised tax losses                                              –93                    958
Income taxes from previous years                                   –129                     140
Other                                                                –48                    108
Total                                                             –5,835                 –7,126
F-Secure 2012   03 24

10. Non-current assets
                                                       INTANGIBLE ASSETS                                   TANGIBLE ASSETS
                                       Other cap.     Capitalized                           Machinery 
Consolidated                         expenditure    development        Goodwill     Total         equip.    Other Tangible                Total

Acquisition cost Jan 1, 2011              19,044          7,676          19,398    46,118        18,010             3,366                21,376
Translation difference                        23                                       23            37                –6                    31
Additions                                  5,736          7,827                    13,563         4,660               302                 4,962
Disposals                                   –446         –1,176                    –1,622         –115                                    –115
Acquisition cost Dec 31, 2011              24,357        14,327          19,398    58,082        22,592             3,662                26,254
Translation difference                       –36                                      –36           –28                 7                   –21
Additions                                    706          4,882                     5,588         4,314               357                 4,671
Disposals                                   –441          –828                     –1,269         –169                –32                 –201
Acquisition cost Dec 31, 2012              24,586        18,382          19,398    62,366        26,709             3,994                30,703

Acc. depreciations Jan 1, 2011           –7,583          –3,129                   –10,712       –11,883            –2,028               –13,912
Translation difference                      –22                                       –22           –29                 2                   –27
Depreciation of the financial year       –2,786           –503                     –3,290        –2,850             –396                 –3,246
Depreciation of decreases                   383           1,177                     1,560             3                                       3
Reduction in value                         –154           –811                      –965
Acc. depreciations Dec 31, 2011          –10,163         –3,267                   –13,428       –14,761            –2,422               –17,183
Translation difference                       36                                        36            14                –8                     6
Depreciation of the financial year       –2,901          –1,121                    –4,022        –3,514             –386                 –3,900
Depreciation of decreases                   292                                       292           122                18                   140
Reduction in value                       –5,000                                    –5,000
Acc. depreciations Dec 31, 2012          –17,735         –4,388                   –22,122       –18,139            –2,797               –20,936

Book value as at Dec 31, 2011             14,194         11,061          19,398    44,654         7,831             1,240                 9,071
Book value as at Dec 31, 2012              6,851         13,994          19,398    40,244         8,569             1,198                 9,767
F-Secure 2012   03 25

11. Investments in associate                                                                              13. Deferred tax
EUR 1,000                                                Consolidated 2012 Consolidated 2011              EUR 1,000                                               Consolidated 2012 Consolidated 2011

Book value as at Jan 1                                                   155                      163     Deferred tax assets
Share of associated companies’ results                                   –61                       –8     Other temporary differences                                           4,430                    4,522
Book value as at Dec 31                                                   94                      155     Losses carried forward                                                  605                      512
                                                                                                          Total                                                                 5,035                    5,034
Associate’s balance sheet, revenue and profit
Assets                                                                   449                      768     Deferred tax assets, changes in year:
Liabilities                                                              179                      324     Recognized in profit or loss                                               1                    –451
Revenue                                                                1,386                    1,745
Profit                                                                 –134                        81     Deferred tax liability
                                                                                                          Other temporary differencies                                            283                      185
Associated companies                                               Group (%)               Group (%)      Fair value adjustments on acquisition                                    98                    1,391
Vineyard International Ltd, Helsinki Finland                          34,83                    34,83          Change in fair value, available-for-sale                             65                       40
                                                                                                          Total                                                                   446                    1,617

12. Impairment testing of goodwill                                                                        Deferred tax liabilities, changes in year:
                                                                                                          Recognized in profit or loss                                         –1,196                     –433
In impairment testing the Group’s assets are tested against the Group’s total generated cash flow.        Recognized in other comprehensive income                                                          27
                                                                                                                                                                                   25
The cash flow estimates have been reviewed by the management and cover the next five                      At December 31, 2012 the Group had 6.4 million euro losses carried forward that are available
years. The estimates are based on 2013 planning and after that revenue growth of 7% during                indefinitely for offset against future taxable profits in the companies in which the losses arose.
2013–2017, and after that terminal growth of 1%. The CAGR of 7% growth is based on Gartner’s              Deferred tax assets have been recognized of 1.5 million losses as at the minimum that amount
estimation of revenues for the consumer and enterprise antivirus business globally. (source:              may be used to offset future taxable profits.
Gartner, 2012). The profitability is based on past years’ profitability level, 2013 planning and longer
term communicated profitability target level. The used discount rate is 13.8% before taxes. The           14. Inventories
impairment test, based on these assumptions, show no need to impair assets and/or goodwill.
                                                                                                          EUR 1,000                                               Consolidated 2012 Consolidated 2011
Sensitivity to changes in assumptions                                                                     Other inventories                                                    235                350
The main parameters in the calculations are profitability, growth rate and discount rate. If
the revenue growth was as calculated and the profitability would decline below 8%, or if the              No impairment was recognized from inventories in years 2012 and 2011.
profitability level remained the same, and the revenue would decline by 13% compared to
previous year (year after year) in 2013–2017, the discounted amount would meet the book value.
Test is not practically sensitive to discount rate.
F-Secure 2012   03 26

15. Receivables                                                                                        EUR 1,000                                              Consolidated 2012 Consolidated 2011
EUR 1,000                                               Consolidated 2012 Consolidated 2011
                                                                                                       Fair value as at Jan 1                                             15,993                  16,819
Current receivables                                                                                    Additions/deductions, net                                             539                   –981
Trade receivables                                                    30,466                  31,542    Change in fair value                                                  260                     155
Loan receivables                                                         18                      16    Fair value as at Dec 31                                            16,792                  15,993
Other receivables                                                     1,157                   1,357
Prepaid expenses and accrued income                                   4,366                   4,135    Shares – unlisted                                                     145                     146
Accrued income tax                                                    2,688                   1,160    Maturity date less than 3 months                                   16,647                  15,847
Total                                                                38,696                  38,210    Fair value as at Dec 31                                            16,792                  15,993
                                                                                                       Acquisition value as at Dec 31                                     16,532                  15,837
Trade receivables
As at 31 December 2012, trade receivables at nominal value of 1 135 thousand eur (2011: 628            17. Cash and short-term deposits
thousand eur) were impaired and fully provided for.
                                                                                                       EUR 1,000                                              Consolidated 2012 Consolidated 2011
Book value as at Jan 1                                                  628                  508
Charge for the year                                                     700                  270       Cash at bank and in hand                                                                   12 205
                                                                                                                                                                          16 480
Utilised                                                              –193                  –151
Book value as at Dec 31                                               1,135                  628       Available-for-sale financial assets are recognized as liquid short-term investments and are held as
                                                                                                       part of the Group’s ongoing cash management activities. See note 23. Financial risk management
Ageing analysis of trade receivables                       total    not due         past due           objectives and policies
                                                                                    90         90
                                                                                   days        days    For the purposes of the Consolidated Statement of Cash Flows, cash and cash equivalents
As at Dec 31, 2012                                       30,466      22,514       7,503         449    comprise the following at December 31:
As at Dec 31, 2011                                       31,542      25,053       5,945         544
                                                                                                       Cash at bank and in hand                                           16,480                  12,205
Material items included in prepaid expenses and accrued income                                         Available-for-sale                                                 16,647                  15,847
Prepaid expenses                                            2,479                              2,221   Total                                                              33,127                  28,051
Prepaid expenses, royalty                                   1,887                              1,914
Total                                                       4,366                              4,135

16. Available-for-sale financial assets

Available-for-sale financial assets consist of interest-bearing debt securities and shares in funds
invested in similar instruments. For assets that are actively traded in organized financial markets,
fair value is determined by reference to Stock Exchange quoted market bid prices at the close
of business on the balance sheet date. Assets, which fair value cannot be measured reliably, are
recognized at cost less impairment. The fair value changes of available-for-sale financial assets
are recognized in shareholders’ equity under fair value reserve.
F-Secure 2012   03 27

18. Shareholders’ Equity                                                                               Treasury shares
                                                                                                       The cost of acquistion is recognised as a deduction in the shareholders’ equity. The shares were
During the year, ordinary shares were subscibed with warrants attached to F-Secure option              acquired through public trading on NASDAQ OMX Helsinki in accordance with its rules and at
programs and converted as follows.                                                                     market price.
                                                                                                       The parent company has not acquired treasury shares during the period.
Issued and fully paid                                                                                  The total number of acquired treasury shares was 3,732,390 at the end of the year 2012. This
                                                           Share Unrestricted                          represent 2,4 percent of the Company’s voting power on December 31, 2012.
                      Number of             Share       premium       equity              Treasury
EUR 1,000                 shares           capital          fund     reserve                shares
                                                                                                       Fair value reserve
31 Dec, 2010         154,231,930             1,551            169      3,187                –7,492
                                                                                                       The reserve is used to record increments and decrements in the fair value of available-for-sale
Exercise of
options                1,259,496                                             1,864                     financial assets.
Acquisition of                                                                                                                                   FAIR VALUE, AVAILABLE-FOR-SALE
treasury shares       –700,000                                                                –1,509   EUR 1,000                                Before tax           Tax       After tax            Total
31 Dec, 2011        154,791,426             1,551             169            5,051            –9,001   Equity Dec 31, 2010                              36          –10                26              26
Exercise of share                                                                                      Available-for-sale, net                         137          –35              102              102
based incentive         274,923                                                  0               583
                                                                                                       Fair value gains/losses to PL                   –17              4            –13             –13
31 Dec, 2012         155,066,349            1,551             169            5,051            –8,418
                                                                                                       Equity Dec 31, 2011                             155          –41              115              115
                                                                                                       Available-for-sale, net                         244          –59              185              185
The share capital amounted to 1,551,311 euro and the number of shares was 158,798,739 (including
own shares 3,732,390) at the end of the year 2012. A share has no nominal value. Accountable par       Fair value gains/losses to PL                  –139            34            –105            –105
value is EUR 0,01.                                                                                     Equity Dec 31, 2012                             259          –65              195              195

Share premium fund
Proceeds from exercised warrants were recognized under the share capital and share premium
                                                                                                       19. Share-based payment transactions
fund until March 26, 2008.                                                                             During the period the Group have had five different incentive plans which cover the key
                                                                                                       personnel.
Unrestricted equity reserve
On March 20, 2007, the shareholders’ meeting decided to decrease the share premium fund. The           Warrant programs
decreased amount of 33,582 thousand euro was transferred to unrestricted equity reserve. On            The Company has had warrant programs since April 1998. During the period the Group had three
March 26, 2008, the shareholders’ meeting decided that the total amount of the subscription            warrant programs. The Company’s warrant programs cover the key personnel. If the holder of
prices paid for new shares issued after the date of the meeting, based on stock options under the      the warrant leaves the company before vesting, the warrant is forfeited.
F-Secure Stock Option Plan 2005, be recorded in companys’ unrestricted equity reserve.                    The Group has applied IFRS 2 to equity-settled awards granted after November 7, 2002 that
                                                                                                       had not vested on or before January 1, 2005.
Translation differences
The translation difference is used to record exchange difference arising from the translation of       Option scheme 2005
the financial statements of foreign subsidiaries.                                                      On March 23, 2005, the shareholders’ meeting decided to issue a total of 4,500,000 warrants.
                                                                                                       Each warrant entitled the holder to subscribe for one share. The subscription period of 2005A
Dividends proposed and paid                                                                            expired on November 30, 2009. The subscription period of 2005B expired on November 30, 2010.
Proposed for approval at AGM for year 2012 0.06 euro per share.                                        The subscription period of 2005C expired on November 30, 2011. The subscription period of
Final dividend for year 2011 0.06 euro per share, paid during the year 2012: 9,303,981 euro            2005D expired on November 30, 2012. The subscription in full would have increased the capital
Final dividend for year 2010 0.06 euro per share, paid during the year 2011: 9,253,916 euro            stock by 45,000 euro. A total of 2,028,332 shares were subscribed, which represent 1.3 percent
                                                                                                       of the Company’s share capital and voting power on December 31, 2012. The subscription price
                                                                                                       of a share in each series is the trade volume weighted average price of the Company’s share
F-Secure 2012   03 28

quoted on the OMX The Nordic Exchange, Helsinki as follows: 2005A on March 2005; 2005B on               The options outstanding by range of exercise prices
March 2006; 2005C on March 2007 and 2005D on March 2008, rounded off to the nearest cent.               December 31, 2011
The subscription price of the stock options was, as per the dividend recorded date, reduced by                                                           Weighted average
                                                                                                                                                                   remaining
the amount of dividend per share. However, only such dividends whose distribution has been                                                                contractual life in       Weighted average
agreed upon after of the period for determination of the share subscription price and which             Exercise price euro       Number of options                     years      exercise price euro
have been distributed prior to the share subscription are deducted from the subscription price.         1.43–1.60
Pursuant to the Companies Act, the share subscription price was, nevertheless, always at least          2.09–2.78                           410,000                      0.92                     2.03
the accounting equivalent value per share.                                                                                                  410,000
                                                                                                        Expense arising from share-based payment transactions in year 2011 was 27 thousand euro.
Plan                     Issued       Category               Start             End Exercise price
                                         2005A         1. 3. 2008     30. 11. 2009           1.43       Synthetic option-based incentive programs
                                         2005B         1. 3. 2009     30. 11. 2010           2.72       The synthetic option-based incentive programs have been established on February 2009 and
                                         2005C         1. 3. 2010     30. 11. 2011           1.48       November 2012 as part of the key employee incentive and retention system within F-Secure
                                        2005D          1. 3. 2011     30. 11. 2012           1.97       Group. The programs offer for the participants a possibility to receive synthetic options of
2005                 4,500,000                                                                          F-Secure Corporation as a long-term incentive compensation. No reward can be given to any
                                                                                                        participating employee, whose employment has terminated before the end of the vesting period.
The shares subscribed for on the basis of the warrants entitled the holder to dividend for the              The synthetic option-based incentive programs will last five years. Both comprises three
financial period in which the subscription took place. Other shareholder rights commenced               granting periods and subsequent vesting period of two years after each granting year. The
upon the entry into the Trade Register of increase of the share capital.                                program 2009–2011 ends on December 31, 2013. The programm 2012–2014 ends on December
                                                                                                        31, 2016. Within the framework of each program, the aggregate number of options to be given as
Options outstanding and weighted average exercise price                                                 reward cannot exceed 5 million. The actual compensation is the difference of subscription price
                                                                                                        and the vesting price, and will be paid to the participatingemployees as a cash-settled payment.
                                Jan 1–Dec 31, 2012                           Jan 1–Dec 31, 2011
                                                                                                            The subscription price of the synthetic option is the weighted average share price in the
                                         Weighted                                    Weighted
                                           average                                      average         period of October to December prior to the granting year. The vesting price is the weighted
                        Number of exercise price                     Number of    exercise price        average share price in period of September to November prior to the payment month. The
EUR 1,000                  options            euro                     options             euro         subscription price for the granting period of 2009 is 2.17 euro. The subscirtion price for the
                                                                                                        granting period of 2010 is 2.27 by Board decision on November 30, 2010. The subscription price
Outstanding Jan 1              410,000                2.03           1,725,000                   1.67   for the granting period of 2011 is 2.10. The subscirtion price for the granting period of 2012 is 1.85
Forfeited                                                                5,000                   1.48   by Board decision on November 22, 2012.
Exercised                                                            1,259,496                   1.48
Expired                        410,000                1.97              50,504                   1.48
Outstanding Dec 31                                                     410,000                   2.03
Exercisable Dec 31                                                     410,000                   2.03

For options exercised in year 2011 the weighted average share price was 2.11 euro. In year 2011 the
Group received 1,864 thousand euro for exercised option, which was recorded to unrestricted
equity reserve.
F-Secure 2012   03 29

Options outstanding                                                                                         The share-based incentive program 2011–2013 has been established on March 2011. The
                                Jan 1–Dec 31,                                          Jan 01–Dec 31,   program will last five years. It comprises three earning and lock-up periods. The program ends
                                        2012                                                     2011   on December 31, 2015. The rewards will be settled in two phases so that one part is settled as
Outstanding Jan 01                1,820,000            Outstanding Jan 1                    1,535,000   equity-settled payment and one part as cash-settled payment. The participants in the share-
Granted                              950,000           Granted                                910,000   based incentive program are recommended not to sell more than 50% of the received shares
Forfeited                             15,000           Forfeited                               55,000   and to cumulate the shares received from the share program equals the annual gross base salary
Expired                              910,000           Expired                                570,000   of the employee. On the basis of the program maximum total of 2,500,000 shares and a cash
                                                                                                        payment corresponding the registration date value of the shares shall be given as reward.
Outstanding Dec 31                1,845,000            Outstanding Dec 31                   1,820,000
                                                                                                            The participating employee shall be entitled to the shareholder rights of to the reward shares
Expense arising from share-based payment transactions during the period was –30 thousand                from the moment the shares have been entered into the participating employee’s book-entry
euro (–10 thousand euro in year 2011). The carrying amount of liability at December 31, 2012 was        account.
18 thousand euro. There were no settlements for granting periods 2009–2010.                                 Expense arising from the share-based payment transactions during the period was 775
                                                                                                        thousand euro (1,062 thousand euro in year 2011). During the period F-Secure has assigned a
The fair value of options granted during the period was determined by using the Binomial model.         total of 274,923 shares and cash payment payment corresponding the registration date value of
                                                                                                        the share to the participants as a reward for the 2008 earning period. The costs of the equity-
Used arguments:                                                         Synthetic option program        settled transactions are measured by reference to the fair value of the F-Secure Corporation
                                                                                                        share at the date on which they are granted. The costs of cash-settled transactions are measured
                                                                         2012               2011
                                                                                                        by reference to the fair value of the F-Secure Corporation share on the date of balance sheet.
Weighted average share price euro                                        1.51                2.02
Weighted average exercise price euro                                        –                   –
Expected volatility                                                   23.72%              25.02%        20. Provisions
Option life in years                                                      2.0                 2.0       EUR 1,000                                             Consolidated 2012 Consolidated 2011
Risk-free interest rate                                                0.35%               1.32%
Expected dividends                                                          –                   –       A provision is recognized for the vacant premises. The provision is expected be realized during
                                                                                                        2013.
Expected volatility reflects the assumption that the historical volatility is indicative of future
trends, which may also not necessarily be the actual outcome. Based on previous years, the              Book value as at Jan 1
company has estimated that 2–3% of granted options will be forfeited.                                   Arising during the year                                               130
                                                                                                        Book value as at Dec 31                                               130
Share-based incentive programs
                                                                                                        Other                                                                 130
During the period the Group had two share-based incentive programs. The share-based
incentive program has been established as part of the key employee incentive and retention
system within F-Secure Group. The programs will offer for the participants a possibility to receive
shares of F-Secure Corporation as an incentive reward if the Company’s financial targets set for
the earning period have been achieved. No reward can be given to any participating employee,
whose employment has terminated before the end of the lock-up period. The share-based
incentive program 2008–2010 has been established on May 2008. The program will last six years.
It comprises three earning and lock-up periods. The participating employee may not sell or
transfer the shares received before the end of the lock-up period on each earnings period. The
program ends on December 31, 2013. The rewards will be settled in two phases so that one part is
settled as equity-settled payment and one part as cash-settled payment. Within the framework
of the program, the aggregate number of shares to be given as reward cannot exceed 5 million
shares.
F-Secure 2012   03 30

21. Liabilities                                                                                       Level 3: techinques which use inputs which have a significant effect on the recorded fair value
                                                                                                      that are not based on observable market data
EUR 1,000                                              Consolidated 2012 Consolidated 2011
                                                                                                      Assets measured at fair value                             Total     Level 1     Level 2      Level 3
Non-current liabilities
                                                                                                      Available-for-sale financial assets Dec 31, 2012         16,792     16,647            –         145
Deferred revenues                                                    8,497                   8,442
                                                                                                      Available-for-sale financial assets Dec 31, 2011         15,993     15,847            –         146
Total                                                                8,497                   8,442
                                                                                                      During the reporting period ending 31 December 2012, there were no transfers between levels.
Current liabilities
Deferred revenues                                                  29,252                  29,833
Trade payables                                                      4,371                   7,674
                                                                                                      23. Financial risk management objectives and policies
Other liabilities                                                   2,370                   1,457
                                                                                                      General
Accrued expenses                                                   16,548                  16,353
                                                                                                      The goal of risk management is to identify risks that may hinder the group from achieving its
Income tax liabilities                                                627                     739
                                                                                                      business objectives. The responsibility for the company’s risk management lies with CEO, the
Total                                                              53,167                  56,057     management and finally with the Board of Directors. The risks related to the Group’s financial
                                                                                                      instruments are mainly related to credit risks and foreign currency fluctuations. The Group’s
Material amounts shown under accruals and                                                             available-for-sale assets are also exposed to interest rate fluctuations.
deferred income
Accrued personnel expenses                                         12,230                  11,839     Credit risk
Deferred royalty                                                    1,018                     999     The Group trades only with recognized, creditworthy third parties. Receivable balances are
Accrued expenses                                                    3,300                   3,515     monitored and collected on an ongoing basis. The maximum exposure to credit risk at the
Total                                                              16,548                  16,353     reporting date is the carrying value of financial assets. There are no significant concentrations of
                                                                                                      credit risk within the Group. See notes 15. Receivables and 22. Financial assets and liabilities

22. Financial assets and liabilities                                                                  Foreign currency risk
EUR 1,000                                              Consolidated 2012 Consolidated 2011            The Group invoices mainly in Euros. However, there are some transactional currency exposures
                                                                                                      that arise from sales or purchasing in other currencies. The other main measurement currencies
Loans and other receivables                                          18                324
                                                                                                      are USD, JPY, SEK and GBP. In order to minimize the impact of the fluctuation of the exchange
Trade receivables                                                30,466             31,542
                                                                                                      rates, the goal is to use forward currency contracts to eliminate the currency exposure of the
Available-for-sale financial assets                              16,792             15,993            estimated cash flow of these currencies for a period of six months.
Cash and bank accounts                                           16,480             12,205
Trade payables                                                   –4,371             –7,674            Derivatives
Total                                                            59,386             52,390            Currency instruments – Currency forward contract
                                                                                                      EUR 1,000                                      Consolidated 2012 Consolidated 2011
The carrying amounts of the Group’s financial instruments are equivalent to fair values.              Nominal value                                             3,278              3,008
                                                                                                      Fair value                                                   61                –95
Fair value hierarchy
The Group uses the following hierarchy for determining and disclosing the fair value of financial
intruments by valuation technique
Level 1: quouted prices in active markets for indentical assets or liabilities
Level 2: other techniques for which all inputs which have a significant effect on the recorded fair
value are observable, either directly or indirectly
F-Secure 2012   03 31

F-Secure Corporation has hedged receivables denominated in USD, JPY, SEK and GBP with a              Capital management
forward rate contract. The forward rate contracts expires on January 24 and April 25, 2013. The      The objective of the Group’s capital management is to maintain an efficient capital structure
company does not have other derivatives.                                                             that ensures the functioning of business operations and promotes the increase of shareholder
   F-Secure Corporation does not hedge investements made in its subsidiaries because the             value. Reviewing the capital structure of the Group is part of the process for monitoring financial
impact of changes of exchange rates would not be relevant in the Group’s balance sheet.              performance. The objective of the Group is to improve its current capital structure.
                                                                                                        AGM 2007 made a decision to decrease the share premium to distributable equity. This
Sales in different currencies                                            %                       %   enabled the Group to employ various actions to improve the efficiency of the equity; and/or to
EUR                                                                     63                      65   return the equity to shareholders. EGM 2008 made a decision that assets from the distributable
                                                                                                     equity will be distributed to shareholders EUR 0.23 per share totalling 35,719 thousand euro.
SEK, GBP                                                                12                      12
                                                                                                        According to the dividend policy of F-Secure Corporation, approximately half of its annual
USD, JPY                                                                19                      18
                                                                                                     profit is paid as dividend. Subject to circumstances, the company may deviate from this policy.
Other currencies                                                         6                       6
                                                                       100                     100
                                                                                                     24. Notes to cash flow statement
The risk involved in the sales in foreign currency is notabaly diminished by the operational
                                                                                                     EUR 1,000                                              Consolidated 2012 Consolidated 2011
expenses in subsidiaries that use the same currency.
                                                                                                     Adjustments
Financial assets and liablilities                                                                    Deferred income                                                        –72                     704
in different currencies                                                  %                       %   Depreciation and amortization                                       12,940                   6,503
EUR                                                                     68                      67   Profit / loss on sale of fixed assets                                  210                   1,190
SEK, GBP                                                                 9                       7   Other adjustments                                                      627                     838
USD, JPY                                                                17                      20   Financial income and expenses                                          327                     130
Other currencies                                                         7                       6   Income taxes                                                         5,835                   7,125
                                                                       100                     100   Total                                                               19,867                  16,491

The table below demonstrates how sensitive the Group’s profit before taxes is to reasonably
possible changes in the USD, JPY, SEK and GBP exchange rate, assuming that all other variables       25. Operating lease commitments
are held constant. The analysis is based +/– 10% exchange rate change, on trade receivables and
includes forward currency contracts.                                                                 The Group has entered into commercial leases on office space and on motor vechicles. Motor
                                                                                                     vechicle leases have an average life of three years and office space between two and five years
                                                                                                     with renewal terms included in the contracts.
USD, JPY                                                       +194/–194               +445/–445
GBP, SEK                                                       +274/–274               +378/–378     Future minimum rentals payable under non-cancellable operating leases as at December 31 are
                                                                                                     as follows:
Interest rate risk                                                                                   As lessee
The Group does not have any interest bearing liabilities. Based on the Group’s conservative          EUR 1,000                                         Consolidated 2012 Consolidated 2011
investment policy, it invests its cash mainly in short term and low risk funds. Investments are      Within one year                                                 5,642                  5,846
made in creditworthy funds. These available-for-sale investments are exposed to market risk for      After one year but not more than five years                                          12,656
                                                                                                                                                                   10,121
changes in interest risks.
                                                                                                     Total                                                         15,763                 18,502
   The Group’s objective is to maintain a balance between continuity of funding and flexibility
through the use of cash and available-for-sale financial assets. See note 16.
                                                                                                     Rents during the period                                              5,096                   4,596
F-Secure 2012   03 32

26. Contingent liabilities                                                                         The managing director’s retirement age and the determination of his pension conform to the
                                                                                                   standard rules specified by Finland’s Employee Pension Act (TYEL). The period of notice for the
EUR 1,000                                             Consolidated 2012 Consolidated 2011
                                                                                                   managing director is six (6) months both ways and managing director is entitled to severance
Other liabilities
                                                                                                   payment equivalent of six (6) months’ salary.
Others                                                                  106                  237
                                                                                                   The consolidated financial statements include the financial statements of corporations listed in
                                                                                                   the following table.
27. Related party disclosures                                                                                                                            Country of
                                                                                                   Name                                                  incorporation                  Group (%)
The Group’s related parties include parent company, subsidiaries and associate, as well as
members of the Board, managing director and members of the Leadership Team.                        Parent F-Secure Corporation, Helsinki                 Finland
                                                                                                   DF-Data Oy, Helsinki                                  Finland                                100
Compensation of key management personnel of the Group                                              F-Secure Inc., San Jose                               United States                          100
EUR 1,000                                    Consolidated 2012 Consolidated 2011                   F-Secure (UK) Ltd, London                             Great-Britain                          100
Wages and other short-term employee benefits            2,055              2,734                   F-Secure KK, Tokyo                                    Japan                                  100
Share-based payments                                      359                589                   F-Secure GmbH, München                                Germany                                100
Total                                                   2,414              3,324                   F-Secure eStore GmbH, München                         Germany                                100
                                                                                                   F-Secure SARL, Maisons-Laffitte                       France                                 100
Wages and other short-term employee benefits                                                       F-Secure SDC SAS, Bordeaux                            France                                 100
EUR 1,000                                    Consolidated 2012 Consolidated 2011                   F-Secure France SARL, Maisons-Laffitte                France                                 100
Managing directors                                        262                827                   F-Secure BVBA, Heverlee-Leuven                        Belgium                                100
Members of the boards of directors                        225                225                   F-Secure AB, Stockholm                                Sweden                                 100
                                                                                                   F-Secure Srl, Milano                                  Italy                                  100
Board of directors 2012 and managing director                                                      F-Secure SP z.o.o.,Warsaw                             Poland                                 100
                                                                         Incentive Other com-      F-Secure Corporation (M) Sdn Bhd, Kuala Lumpur        Malaysia                               100
                                                Wages            Fees      reward penstions
                                                                                                   F-Secure Pvt Ltd, Hyderabad                           India                                  100
Christian Fredrikson, managing director             262            –           105             –   F-Secure Pte Ltd, Singapore                           Singapore                              100
Risto Siilasmaa, chairman of the board                –           55             –             –   F-Secure B.V., Utrecht                                The Netherlands                        100
Jussi Arovaara                                        –           30             –             –   F-Secure Limited, Hong Kong                           Hong Kong                              100
Sari Baldauf                                          –           40             –             –   F-Secure Pty Limited, Sydney                          Australia                              100
Pertti Ervi                                           –           40             –             –   F-Secure Iberia SL, Barcelona                         Spain                                  100
Juho Malmberg                                         –           30             –             –   F-Secure do Brasil Tecnologia da Informãcao Ltda      Brazil                                 100
Anu Nissinen                                          –           30             –             –   F-Secure Chile Limitada, Santiago                     Chile                                  100
Total                                               262          225           105             –   F-Secure Colombia SAS, Bogota D.C.                    Columbia                               100

Incentive reward granted to managing director is measured as following; the equity-settled part    Associate company information see note 11
to the fair value of the F-Secure Corporation share at the date which it was granted and cash-
settled part to the fair value of the share on the date of balance sheet. The cost is recognized
over the period in which the performance conditions are fullfilled 22. 11. 2012–31. 12. 2014.
F-Secure 2012   03 33

28. Shares and shareholders, December 31, 2012                                            Administrative register
                                                                                          Skandinaviska Enskilda Banken                       4,409,789           2.78%             2.84%
Shares and share ownership distribution, December 31, 2012                                Nordea Pankki Suomi Oyj                             3,444,031           2.17%             2.22%
                             Number of Percentage of                        Percentage    Svenska Handelsbanken AB                            1,340,622           0.84%             0.86%
Shares                     shareholders shareholders        Total shares      of shares   Other registers                                       280,607           0.18%             0.18%
1–100                             3,268      13.58%             213,300           0.13%
101–1,000                        15,463      64.24%           5,865,333           3.69%   Other shareholders                                36,605,697           23.05%            23.61%
1,001–10,000                      4,953      20.58%          14,489,458           9.12%   Total                                            155,066,349                            100.00%
10,001–50,000                       313       1.30%           6,275,196           3.95%
50,001–100,000                       30       0.12%           2,111,752           1.33%   Own shares F-Secure Corporation                    3,732,390            2.35%
100,001–                             44       0.18%         129,843,700         81.77%    Total                                            158,798,739          100.00%
Total                            24,071     100.00%         158,798,739        100.00%

                                                                                          Ownership of management
Shareholder category, December 31, 2012                                     Percentage
                                                            Total shares      of shares
Corporations                                                  8,552,516           5.39%   Board of Directors                                                   Shares             % shares
Financial and insurance institutions                         23,458,891         14.77%    Risto Siilasmaa                                                  63,099,454              39.74%
General government                                           28,747,156         18.10%    Jussi Arovaara                                                       16,818                0.01%
Non-profit organizations                                      1,248,793           0.79%   Sari Baldauf                                                        109,264                0.07%
Households                                                   96,412,792         60.71%    Pertti Ervi                                                          25,264                0.02%
Other countries and international organizations                 378,591           0.24%   Juho Malmberg                                                        36,449                0.02%
Total                                                       158,798,739        100.00%    Anu Nissinen                                                         16,818                0.01%
                                                                                          Total                                                            63,304,067              39.86%

Largest shareholders and administrative register                                          Leadership Team                                                       Shares            % shares
Owner                                              Shares        % shares      % votes    Ari Alakiuttu                                                         16,954               0.01%
Risto Siilasmaa                               63,099,454          39.74%       40.69%     Samu Konttinen                                                        16,954               0.01%
Varma Mutual Pension                                                                      Maria Nordgren                                                         8,476               0.01%
Insurance Company                             13,659,874           8.60%         8.81%
Ilmarinen Mutual Pension                                                                  Pirkka Palomäki                                                       28,918               0.02%
Insurance Company                               8,839,432          5.57%         5.70%    Jari Still                                                            70,359               0.04%
Mandatum Life Insurance Company                 6,674,081          4.20%         4.30%    Taneli Virtanen                                                       31,954               0.02%
The State Pension Fund                          5,000,000          3.15%         3.22%    Total                                                                173,615               0.11%
Ari Hyppönen                                    3,843,332          2.42%         2.48%
Ismo Bergroth                                   3,000,000          1.89%         1.93%    Ownership of management
Kaleva Mutual Insurance Company                 2,036,000          1.28%         1.31%    The Board of Directors owned a total of 63,304,067 shares on December 31, 2012. This represents
                                                                                          39.9 percent of the Company’s shares and 40.8 percent of votes.
Nordea Nordic Small Cap Fund                    1,833,430          1.15%         1.18%
Aktia Capital Fund                              1,000,000          0.63%         0.64%
F-Secure 2012   03 34

29. Key ratios
                                        IFRS     IFRS       IFRS       IFRS    IFRS                                               IFRS       IFRS     IFRS          IFRS        IFRS
Economic indicators                    2012      2011      2010       2009    2008      Key ratios                               2012        2011    2010          2009        2008
Net sales (MEUR)                      157.2     146.0     130.1      125.1   113.0      Earnings / share (EUR)                   0.09        0.11     0.10          0.12        0.13
Net sales growth %                       8%       12%         4%       11%     17%      Earnings / share diluted                 0.09        0.10     0.10          0.12        0.12
Operating result (MEUR)                20.3      23.6       19,8       24.0    24.3     Shareholders’ equity per share           0.41        0.38     0.33          0.31        0.26
   % of net sales                     12.9%     16.2%     15,2%      19.2%   21.5%      Dividend per share *                     0.06        0.06     0.06          0.06        0.07
Result before taxes                    19.9      23.5       19.9       25.2    26.4     Dividend per earnings (%)               66.7%       54.5%   60.0%         50.0%       53.8%
   % of net sales                     12.7%     16.1%     15.3%      20.1%   23.4%      Effective dividends (%)                  3.9%        3.0%    3.0%          2.2%        3.7%
ROE (%)                               22.6%     29.5%     30.3%      32.2%   36.0%      P/E ratio                                17.1        19.0     23.1          22.8        14.9
ROI (%)                               34.9%     44.3%     42.5%      45.0%   51.5%      Share price, lowest (EUR)                1.32        1.88     1.97          1.86        1.73
Equity ratio (%)                      72.7%     68.1%     69.1%      69.8%   71.3%      Share price, highest (EUR)               2.14        2.66     2.93          3.14        3.05
Investments (MEUR)                     10.3      18.7       10.4       37.2     3.1     Mean share price (EUR)                   1.79        2.26     2.27          2.43        2.39
   % of net sales                      6.6%     12.8%      8.0%      29.7%    2.7%      Share price Dec 31                       1.55        2.01     2.00          2.74        1.88
RD costs (MEUR)                       49.3      39.3       34.5       28.0    25.5     Market capitalization (MEUR)            246.1       319.2   315.1         431.5       293.4
   % of net sales                     31.4%     26.9%     26.5%      22.4%   22.6%      Trading volume (millions)                23.0        42.6     65.9          55.5        64.5
Capitalized development (MEUR)           4.9       7.8        2.3       1.7     0.5     Trading volume (%)                      14.9%       27.6%   42.5%         35.6%       41.5%
Gearing %                            –50.9%    –47.1%    –63.2%     –68.5% –148.5%
                                                                                        * Board proposal
Wages and salaries (MEUR)              56.1      48.3       45.9       39.7    35.8
Personnel on average                    970       878        835        770     652
Personnel on Dec 31                     931       942        812        826     718


                                                                                                                         Turnover and average share price per month
Adjusted number of shares               IFRS 2012     IFRS 2011        IFRS 2010        IFRS 2009        IFRS 2008
average during the period            155,056,557    154,432,955      154,967,615      155,770,113      155,301,688        10
                                                                                                                          million                                             EUR
                                                                                                                                                                               2.5
average during the period, diluted   156,774,495    157,499,090      158,893,701      160,248,717      161,464,443
Dec 31                               158,798,739    158,798,739      157,539,243      157,469,243      156,077,161       8                                                     2.0
Dec 31, diluted                      159,115,294    160,940,348      160,990,852      161,269,612      161,270,407
                                                                                                                         6                                                     1.5

                                                                                                                         4                                                     1.0

                                                                                                                         2                                                     0.5

                                                                                                                         0                                                     0.0
                                                                                                                             01 02 03 04 05 06 07 08 09 10 11 12
                                                                                                                         l  Turnover EUR
                                                                                                                         l  Average price
F-Secure 2012   03 35


Calculation of key ratios
                                       Shareholders’ equity + minority interest
Equity ratio, %                                                                                                     � 100
                                       Balance total – received advance payments

                                       Result before taxes + financial expenses
ROI, %                                                                                                              � 100
                                       Balance total – non-interest bearing liabilities (average)

                                       Result before taxes – taxes
ROE, %                                                                                                              � 100
                                       Shareholders’ equity + minority items (average)

                                       Interest bearing liabilities – cash and bank accounts, liquid financial assets
Gearing, %                                                                                                            � 100
                                       Shareholders’ equity + minority items

                                       Result before taxes – taxes +/– minority interest
Earnings per share, euro
                                       Adjusted number of shares (average)

                                       Shareholders’ equity
Shareholders’ equity per share, euro
                                       Adjusted number of shares, Dec 31

                                       Share price closing, Dec 31
P/E ratio
                                       Earnings per share

                                       Dividend per share
Dividend per earnings, %                                                                                            � 100
                                       Earnings per share

                                       Dividend per share
Effective dividends, %                                                                                              � 100
                                       Share price closing, Dec 31
F-Secure 2012   03 36


                                              Income statement
Financial Statements                          Jan 1–Dec 31, 2012
F-Secure Corporation                          EUR 1,000                                      FAS 2012               FAS 2011

                                              NET SALES                               (1)    135,906                128,694

                                              Material and service                            –7,503                 –8,565

                                              Gross margin                                   128,402                120,128

                                              Other operating income                  (2)      3,182                  2,368
                                              Sales and marketing                   (3, 4)   –58,773                –55,466
                                              Research and development              (3, 4)   –40,687                –31,685
                                              Administration                        (3, 4)    –9,162                –34,266

                                              OPERATING RESULT                                22,962                   1,080

                                              Financial income and expenses           (6)         94                   –183

                                              PROFIT (LOSS) BEFORE APPROPRIATIONS
                                              AND TAXES                                       23,055                    897

                                              Change in depreciation reserve                   –411                   –729
                                              Income taxes                            (7)     –5,989                 –6,390
                                              RESULT FOR THE FINANCIAL YEAR                   16,656                 –6,222


   Sami, Product Manager, Consumer Security
F-Secure 2012   03 37


Balance sheet Dec 31, 2012
EUR 1,000                                    FAS 2012   FAS 2011   EUR 1,000                                           FAS 2012               FAS 2011

ASSETS                                                             SHAREHOLDERS’ EQUITY AND LIABILITIES
NON-CURRENT ASSETS                                                 SHAREHOLDERS’ EQUITY                    (15, 16)
Intangible assets                      (8)    30,519     30,986    Share capital                                         1,551                  1,551
Tangible assets                        (8)     4,119      4,173    Share premium                                           165                    165
Investments in associated companies    (9)        42         42    Treasury shares                                      –8,419                 –9,002
Investments in group companies         (9)    25,894     10,244    Fair value reserve                                      162                    101
Total non-current assets                      60,574     45,444    Reserve for invested unrestricted equity              5,051                  5,051
                                                                   Retained earnings                                    30,615                 46,157
CURRENT ASSETS                                                     Profit for the financial year                        16,656                 –6,222
Inventories                           (11)       235        350    Total shareholders’ equity                           45,780                 37,801
Long-term receivables                 (12)     5,247        719
Short-term receivables                (12)    36,223     34,772    APPROPRIATIONS
Short-term investments                (13)    15,447     14,674    Depreciation reserve                                  1,139                    729
Cash and bank accounts                (14)     9,357      6,598
Total current assets                          66,508     57,113    LIABILITIES
TOTAL ASSETS                                 127,083    102,558    Deferred tax liabilities                    (10)         53                     36
                                                                   Long-term liabilities                       (18)      6,427                  6,641
                                                                   Short-term liabilities                      (18)     73,684                 57,351
                                                                   Total liabilities                                    80,163                 64,028
                                                                   TOTAL SHAREHOLDERS’ EQUITY
                                                                   AND LIABILITIES                                     127,083                102,558
F-Secure 2012   03 38


Cash flow statement Dec 31, 2012
EUR 1,000                                          FAS 2012   FAS 2011   EUR 1,000                                       FAS 2012               FAS 2011

Cash flow from operations                                                Cash flow from investments
Result for the financial year                       16,656     –6,222    Investments in intangible and tangible assets    –8,290                –26,505
Adjustments                                         13,816     37,908    Investments in subsidiary shares                –15,650
Cash flow from operations before change in                               Other investments                                                            6
working capital                                     30,472     31,686    Proceeds from sale of intangible
                                                                         and tangible assets                                                          1
Change in net working capital                                            Dividends received                                   15                     38
 Current receivables, increase (–), decrease (+)    –4,297       1,173
Inventories, increase (–), decrease (+)                115          43   Cash flow from investments                      –23,925                –26,460
Non-interest bearing debt,
increase (+), decrease (–)                          18,198       5,642
                                                                         Cash flow from financing activities
                                                                         Increase in share capital                                                1,864
Cash flow from operations
before financial items and taxes                    44,489     38,545    Treasury shares                                                         –1,509
                                                                         Dividends paid                                   –9,304                 –9,254
Interest expenses paid                                  –2         –2
Interest income received                                11         94    Cash flow from financing activities              –9,304                 –8,899
Other financial income and expenses                     –6         61
Income taxes paid                                   –7,807     –6,610    Change in cash                                    3,455                 –3,270
                                                                         Cash and bank at the beginning of the period     21,126                 24,295
Cash flow from operations                           36,684     32,088
                                                                         Change in net fair value of current
                                                                         available-for-sale assets                            77                    101
                                                                         Cash and bank at period end                      24,658                 21,126
F-Secure 2012   03 39


Notes to the financial statements
Corporate information                                               Machinery and equipment	           3–8 years                       Pensions
F-Secure produces services and software protection to               Capitalized development costs	       3 years                       Pension arrangement is of local statutory arrangement and
individuals and businesses against computer viruses and other       Intangible rights	                   5 years                       defined contribution plans. Contributions to defined contribu-
threats coming through the Internet or mobile networks.             Intangible assets	                5–10 years                       tion plans are recognized in income statement in the period to
   The parent company of the Group is F-Secure Corporation              Ordinary repairs and maintenance costs are charged to the      which the contributions relate. The Company recognizes the
incorporated in Finland and domiciled in Helsinki. Company’s        income statement during the financial period in which they         disability commitment of TYEL pension plan when disability
registrant address is Tammasaarenkatu 7, 00180 Helsinki. Copy       are incurred. The cost of major renovations is included in the     appears.
of consolidated financial statement can be received from            assets’ carrying amount when it is probable that the Company
Internet address www.f-secure.com or the parent company’s           will derive future economic benefits in excess of the originally   Share-based payment transactions
registrant address.                                                 assessed standard or performance of the existing asset. Any        In the Company’s industry it is common practice internation-
                                                                    gain or loss arising on derecognition of the asset (calculated     ally that incentives are provided to employees in the form of
ACCOUNTING PRINCIPLES                                               as the difference between the net disposal proceeds and            equity-settled share-based instruments. Company has three
The financial statement of F-Secure Corporation has been            the carrying amount of the asset) is included in the income        kinds of incentive programs; warrant-based program, synthetic
prepared in accordance with Finnish Accounting Standards            statement in the year the asset is derecognized.                   warrant-based program and a share-based program.
(FAS).                                                                                                                                     The Company’s warrant programs cover key personnel. The
                                                                    Research and development costs                                     synthetic warrant-based program is settled as cash-settled
Foreign currency translation                                        Research costs are expensed as incurred. Development               payment. The cost of cash-settled transactions with employees
Foreign currencies are translated into the local currency using     expenditures incurred on individual projects of totally new        is measured by reference to the fair value at the date of balance
fixed monthly exchange rates. At the balance sheet date, assets     products or product versions with significant new features are     sheet. The fair value is determined by using the Binomial
and liabilities denominated in foreign currencies are translated    carried forward when they are technically feasible and their       model. The cost of transactions is recognized, together with
at the rates of exchange prevailing at that date. Exchange          future recoverability can reasonably be regarded as assured.       a corresponding entry in liability, over the period in which
rate gains and losses of financial transactions are recognized                                                                         the performance conditions are fulfilled, ending on the date
in the income statement under financial items. Forward              Inventories                                                        on which the relevant employees become fully entitled to
rate contracts for hedging purposes are recorded using the          Inventories are valued at the lower of cost and net realizable     the award (vesting date). If the holder of the warrant leaves
exchange rate prevailing at the balance sheet date.                 value with cost being determined by method first-in first-out      company before vesting the warrant is forfeited. The cumula-
                                                                    method. Net realizable value is the estimated selling price        tive expense recognized for transactions at each reporting
Tangible and intangible assets                                      in the ordinary course of business, less estimated costs of        date until the vesting date reflects the extent to which the
Intangible assets include intangible rights and software            completion and the estimated costs necessary to make the           vesting period has expired and the number of awards that, in
licenses. Intangible assets recognized on merger consist of         sale.                                                              the opinion of the directors of the Group at that date, based on
technology-based intangible assets. Tangible and intangible                                                                            the best available estimate of the number of equity instruments
assets are recorded at historical cost less accumulated             Leases                                                             that will ultimately vest.
depreciation. Depreciation of intangible rights is recorded on a    Leases where the lessor retains substantially all the risks and        The share-based incentive program has been established
progressive basis over the the estimated useful life of an asset.   benefits of ownership of the asset are classified as operating     as part of the key employee incentive and retention system
Other depreciation is recorded on a straight-line basis over the    leases. The Company has only operating leases. Operating           inside F‑Secure. Reward will be settled in two phases so that
estimated useful life of an asset. The estimated useful lives of    lease payments are recognized as an expense in the income          one part is settled as equity-settled payment and one part as
tangible and intangible assets are as follows:                      statement on a straight-line basis over the lease term.            cash-settled payment. Cost of cash-settled transactions is
                                                                                                                                       measured by reference to the fair value by using market price
                                                                                                                                       of F‑Secure Corporation share on the date of balance sheet.
F-Secure 2012   03 40

The cost is recognized over the period in which the perfor-         Other operating income
mance conditions are fulfilled, ending on the date on which the     Other operating income includes profits from the sales of fixed
relevant employees become fully entitled to the reward (end of      assets, rental revenue, and government grants received for
lock-up period). The cost of cash-settle corresponding entry is     research and development projects.
recognized in liabilities. If relevant employee leaves company
before fully entitled to the reward, the reward is forfeited. The   Presentation of expenses
cumulative expense recognized for share-based incentive             Classification of the functionally presented expenses has
program transactions at each reporting date is based on the         been made as follows: various types of expenses in different
best available estimate of the number of equity instruments         geographical locations have been allocated to the various
that will ultimately fulfill.                                       functions by allocating directly to allocable expenses to the
                                                                    respective function, and other operating expenses have been
Income taxes                                                        allocated to functions on the basis of average headcount in
Direct current taxes are calculated in accordance with the          each location.
local tax and accounting rules. Deferred taxes, resulting from
temporary differences between the financial statement and           Treasury shares
the income tax basis of assets and liabilities, use the enacted     Company has acquired treasury shares. The cost of acquisition
tax rates in effect in the years in which the differences are       is recognized as a deduction in the shareholders’ equity.
expected to reverse.
    Deferred tax assets are recognized to the extent that it is     Financial assets
probable that future taxable profit will be available.              Short-term investments are measured at fair value. Short-term
                                                                    investments consist of interest-bearing debt securities and
Revenue recognition                                                 shares in mutual funds invested in similar instruments. For
Revenue is primarily derived from monthly software as a service     assets that are actively traded in organized financial markets,
sale, software license agreement sales and operator’s system        fair value is determined by reference to Stock Exchange quoted
integration and maintenance sales. License agreements consist       market bid prices at the close of business on the balance
of initial license agreements and periodic maintenance agree-       sheet date. Assets, the fair value of which cannot be measured
ments covering product updates and customer support. The            reliably, are recognized at cost less impairment. The fair value
revenue recognition policy of F-Secure Group recognizes the         changes of short-term investments are recognized in share-
service revenue at the time of delivery, the license agreement’s    holders’ equity under fair value reserve. When financial assets
license fee revenues as the product is delivered, the license       recognized as available-for-sale are sold, the accumulated fair
agreement’s maintenance revenues are recognized over the            value changes are released from equity and recognized in the
maintenance period, and service based project deliveries            income statement.
are recognized with the percentage of completion method,                Cash and cash equivalents in the balance sheet comprise
when the outcome can be reliably estimated. The degree of           cash at bank and in hand and other highly liquid short-term
completion is determined by relation of project costs incurred      investments.
for work performed to date bear the estimated total project
costs. If total project costs will exceed total project revenue,
the expected loss is recognized as an expense immediately.
Indirect taxes, discounts granted and exchange rate differences
are excluded from net sales.
F-Secure 2012   03 41

1. Net Sales                                                       Depreciations by function
EUR 1,000                                    FAS 2012   FAS 2011   Sales and marketing                                             –2,715                   –2,337
Geographical information                                           Research and development                                        –3,497                   –2,105
Finland and Scandinavia                       45,680     45,227    Administration                                                   –122                     –160
Rest of Europe                                64,435     60,731    Total depreciation                                              –6,334                   –4,602
North America                                  8,287     10,483
Rest of the world                             17,504     12,253
Total                                        135,906    128,694    4. Personnel expenses
                                                                   EUR 1,000                                                      FAS 2012                 FAS 2011
                                                                   Personnel expenses
2. Other operating income                                          Wages and salaries                                             –31,015                  –26,968
EUR 1,000                                    FAS 2012   FAS 2011   Pension expenses                                                –5,612                   –4,993
Rental revenue                                    37          36   Other social expenses                                           –1,804                   –1,603
Government grants                              1,583         778   Total                                                          –38,431                  –33,563
Other                                          1,562       1,554
Total                                          3,182       2,368   Compensation of key management personnel
                                                                   Wages and other short-term employee benefits                    –1,659                   –2,381
                                                                   Total                                                           –1,659                   –2,381
3. Depreciation and reduction in value
EUR 1,000                                    FAS 2012   FAS 2011   Wages and other short-term
                                                                   employee benefits
Depreciations from non-current assets
                                                                   Managing director                                                 –262                     –626
Other capital expenditure                     –3,314     –2,532
                                                                   Members of the boards of directors                                –225                     –225
Capitalized development                        –962       –278
Intangible assets                             –4,276     –2,810
                                                                   Wages and other short-term employee benefits of the board of directors and managing director:
                                                                   The managing director’s retirement age and the determination of his pension conform to the
Machinery and equipment                       –2,058     –1,792    standard rules specified by Finland’s Employee Pension Act (TYEL). The period of notice for the
Tangible assets                               –2,058     –1,792    managing director is six (6) months both ways and managing director is entitled to severance
                                                                   payment equivalent of six (6) months’ salary.
Total depreciation                            –6,334     –4,602
                                                                   EUR 1,000                                                      FAS 2012                 FAS 2011
Reduction in value from non-current assets                         Average number of personnel                                        498                       428
Other capital expenditure                      –754        –154    Personnel by function Dec 31
Capitalized development                                    –810    Sales and marketing                                                 165                     173
Total reduction in value                       –754        –964    Research and development                                            290                     254
                                                                   Administration                                                       39                      40
Total depreciation and reduction in value     –7,088     –5,566    Total                                                               494                     467
F-Secure 2012   03 42

5. Audit fees                                                       7. Income taxes
EUR 1,000                              FAS 2012      FAS 2011       EUR 1,000                                            FAS 2012                  FAS 2011
Audit fees                                 –99            –97       Income taxes of the business activity                 –5,891                     –6,505
Tax consulting                             –24            –32       Income taxes from previous years                         –98                        115
Other consulting                           –15           –102       Total                                                 –5,989                     –6,390
Total                                     –137           –231       Result before taxes                                   23,055                        897
                                                                    Income taxes at statutory rate of 24.5%/26%           –5,649                       –233
                                                                    Non-deductible expenses                                 –242                     –6,272
6. Financial income and expenses                                    Income taxes from previous years                         –98                        115
EUR 1,000                              FAS 2012      FAS 2011       Total                                                 –5,989                     –6,390
Interest income                             21             95
Interest expense                           –68            –93
Other financial income                     662             76
Dividends                                   15             38
Exchange gains and losses                 –468           –237
Other financial expenses                   –69            –61
Total                                       94           –183

8. Non-current assets                                                   Intangible assets                                                 Tangible assets
                                       Other cap.     Capitalized
                                     expenditure    development                    Total     Machinery  equip.   Other Tangible                     Total
Acquisition cost Jan 1, 2011              11,374           6,366                  17,740                13,154                 5                    13,159
Additions                                 18,284           7,827                  26,111                 2,287                                       2,287
Decreases                                  –154           –1,176                  –1,330                  –111                                       –111
Acquisition cost Dec 31, 2011             29,504          13,017                  42,521                15,330                5                     15,335
Additions                                    509           4,882                   5,391                 2,015                                       2,015
Decreases                                                   –828                   –828                    –36                                         –36
Acquisition cost Dec 31, 2012             30,013          17,071                  47,084                17,309                5                     17,314
Acc. depreciations Jan 1, 2011            –6,815          –2,277                  –9,092                –9,370                                      –9,370
Depreciation of the financial year        –2,531            –278                  –2,809                –1,792                                      –1,792
Reduction of value                         –154             –811                   –965
Acc. depreciations of decreases              154           1,176                   1,330
Acc. depreciations Dec 31, 2011           –9,346          –2,190                 –11,536                –11,162                                    –11,162
Depreciation of the financial year        –3,314            –962                  –4,276                 –2,058                                     –2,058
Reduction of value                         –754                                    –754
Acc. depreciations of decreases                                                                              25                                         25
Acc. depreciations Dec 31, 2012         –13,413           –3,152                 –16,566                –13,195                                    –13,195
Book value as at Dec 31, 2011            20,158           10,827                  30,985                  4,168               5                      4,173
Book value as at Dec 31, 2012            16,599           13,919                  30,518                  4,114               5                      4,119
F-Secure 2012   03 43

9. Investments                                                                            10. Deferred tax
                                       Group comp.           Associated
                                            shares         comp. shares          Total    EUR 1,000                                     FAS 2012               FAS 2011
Book value as at Jan 1                     10,244                    42         10,286    Deferred tax liability
Additions                                  15,650                               15,650    Tax charged to shareholders’ equity
Book value as at Dec 31                    25,894                   42          25,936       Change in fair value, available-for-sale        53                     36
                                                                                          Total                                              53                     36
                                                 Country of                    Share of
Name                                             incorporation            ownership (%)
                                                                                          11. Inventories
Parent F-Secure Corporation, Helsinki            Finland
                                                                                          EUR 1,000                                     FAS 2012               FAS 2011
DF-Data Oy, Helsinki                             Finland                           100
                                                                                          Other inventories                                 235                     350
F-Secure Inc., San Jose                          United States                     100
F-Secure (UK) Ltd, London                        Great-Britain                     100
F-Secure KK, Tokyo                               Japan                             100
F-Secure GmbH, München                           Germany                           100
F-Secure eStore GmbH, München                    Germany                           100
F-Secure SARL, Maisons-Laffitte                  France                             98
F-Secure France SARL, Maisons-Laffitte           France                            100
F-Secure BVBA, Heverlee-Leuven                   Belgium                           100
F-Secure AB, Stockholm                           Sweden                            100
F-Secure Srl, Milano                             Italy                             100
F-Secure SP z.o.o.,Warsaw                        Poland                            100
F-Secure Corporation (M) Sdn Bhd, Kuala Lumpur   Malaysia                          100
F-Secure Pvt Ltd, Hyderabad                      India                             100
F-Secure Pte Ltd, Singapore                      Singapore                         100
F-Secure B.V., Utrecht                           The Netherlands                   100
F-Secure Limited, Hong Kong                      Hong Kong                         100
F-Secure Pty Limited, Sydney                     Australia                         100
F-Secure Iberia SL, Barcelona                    Spain                             100
F-Secure Chile Limitada, Santiago                Chile                              99
F-Secure Colombia SAS, Bogota D.C.               Colombia                          100


                                                                               Share of
Associated companies                                                      ownership (%)
Vineyard International Ltd, Helsinki             Finland                           34.8
F-Secure 2012   03 44

12. Receivables
EUR 1,000                             FAS 2012   FAS 2011
                                                            13. Short-term investments
Non-current
                                                            Short-term investments consist of interest-bearing debt securities and shares in funds invested
Receivables from group companies        4,500
                                                            in similar instruments. For assets that are actively traded in organized financial markets, fair value
Other receivables                         747        719
                                                            is determined by reference to Stock Exchange quoted market bid prices at the close of business
Total                                   5,247        719    on the balance sheet date. Assets, which fair value cannot be measured reliably, are recognized
                                                            at cost less impairment. The fair value changes of short-term investments are recognized in
Current receivables                                         shareholders’ equity under fair value reserve.
Trade receivables                      22,207     23,477
Loan receivables                           18         16    EUR 1,000                                                           FAS 2012                 FAS 2011
Other receivables                          39         41    Fair value as at Jan 1                                               14,674                    16,817
Prepaid expenses and accrued income     6,358      4,186    Additions/deductions, net                                               558                    –2,280
Total                                  28,622     27,720    Change in fair value                                                    215                       137
                                                            Fair value as at Dec 31                                              15,447                    14,674
Receivables from group companies
Trade receivables                       7,601       7,047   Shares – unlisted                                                        146                     146
Other receivables                                       5   Maturity date less than 3 months                                      15,301                  14,528
Total                                   7,601       7,052   Fair value as at Dec 31                                               15,447                  14,674
                                                            Book value as at Dec 31                                               15,232                  14,537
Current receivables total              36,223     34,772

Material items included in prepaid
                                                            14. Cash and short-term deposits
expenses and accrued income
Prepaid expenses                        2,080       1,698   For the purposes of the cash flow statement, cash and cash equivalents comprise the following
Prepaid expenses, royalty               1,887       1,914   as at December 31:
Accrued interest                                        1
Accrued tax                             2,391         573   EUR 1,000                                                           FAS 2012                 FAS 2011
                                                    4,186   Cash at bank and in hand                                              9,357                     6,598
Total                                   6,358
                                                            Available-for-sale                                                   15,301                    14,528
                                                            Total                                                                24,658                    21,126
F-Secure 2012   03 45

15. Statement of changes in shareholders’ equity
                                                                                                                                                  Unrestricted
                                                                                      Share premium              Treasury          Fair value          equity           Retained
Parent Company, FAS                                                     Share capital           fund               shares            reserve          reserve           earnings           Total equity

Equity Dec 31, 2010                                                             1,551               165            –7,493                  27             3,187               55,411            52,847
Available-for-sale financial assets, net                                                                                                   75                                                       75
Result of the financial year                                                                                                                                                  –6,222            –6,222
Dividend                                                                                                                                                                      –9,254            –9,254
Acquisition of treasury shares                                                                                     –1,509                                                                       –1,509
Exercise of options                                                                                                                                       1,864                                  1,864
Equity Dec 31, 2011                                                             1,551               165            –9,002                102              5,051               39,935            37,801
Available-for-sale financial assets, net                                                                                                  61                                                        61
Result of the financial year                                                                                                                                                  16,656            16,656
Dividend                                                                                                                                                                      –9,304            –9,304
Cost of share based payments                                                                                          583                                                        –16               566
Equity Dec 31, 2012                                                             1,551               165            –8,419                163              5,051               47,271            45,780


16. Shareholders’ Equity

The Company’s share capital amounted to 1,551,311 euro and the number of shares was 158,798,739 at the end of the year 2012. See group disclosure 18. Shareholders’ Equity.

Treasury shares
See group disclosure 18. Shareholders’ Equity

Distributable shareholders’ equity on December 31, 2012
EUR 1,000
Unrestricted equity reserve                                                                                                                                                                       5,051
Retained earnings                                                                                                                                                                                22,212
Result of the financial year                                                                                                                                                                     16,656
Distributable shareholders’ equity on December 31, 2012                                                                                                                                          43,918


17. Share-based payment transactions
See group disclosure 19. Share-based payment transactions
F-Secure 2012   03 46

18. Liabilities                                                                         20. Notes to cash flow statement
EUR 1,000                                                      FAS 2012      FAS 2011   EUR 1,000                                                       FAS 2012                 FAS 2011
Non-current liabilities                                                                 Adjustments
Deferred revenues                                                 6,427         6,641   Deferred income                                                    –406                      420
Deferred tax liabilites                                              53            36   Depreciation and amortization                                      7,088                   4,602
Total                                                             6,479         6,676   Profit / loss on sale of fixed asset                                  11                  24,968
                                                                                        Other adjustments                                                    817                     617
Current liabilities                                                                     Financial income and expenses                                        317                     911
Deferred revenues                                                23,729       23,942    Income taxes                                                       5,989                   6,390
Trade payables                                                    3,501        6,524    Total                                                             13,816                  37,908
Other liabilities                                                 1,174          779
Accrued expenses                                                 11,464       11,987    21. Operating lease commitments
Total                                                            39,868       43,233    The Group has entered into commercial leases on office space and on motor vehicles. Motor
                                                                                        vehicle leases have an average life of three years and office space between two and five years
                                                                                        with renewal terms included in the contracts.
Liabilities to the group companies
                                                                                        Future minimum rentals payable under non-cancellable operating leases as at 31 December are
Advance payments                                                  3,797        3,845    as follows:
Trade payables                                                    7,825        7,696    As lessee
Other liabilities                                                22,194        2,578    EUR 1,000                                                          FAS 2012              FAS 2011
Total                                                            33,816       14,118    Within one year                                                                             3,092
                                                                                                                                                              3,373
                                                                                        After one year but not more than five years                           6,847                 9,401
Total current liabilities                                        73,684       57,351    Total                                                                                      12,492
                                                                                                                                                             10,221

Material amounts shown under accruals
and deferred income                                                                     22. Contingent liabilities
Accrued personnel expenses                                        8,619        8,170
                                                                                        EUR 1,000                                                       FAS 2012                 FAS 2011
Deferred royalty                                                  1,018          999
                                                                                        Guarantees for other group companies                                 40
Accrued expenses                                                  1,826        2,818
Total                                                            11,464       11,987
                                                                                        Other liabilities
                                                                                        Others                                                                 67                    238
19. Financial risk management objectives and policies
See Group disclosure 23. Financial risk management objectives and policies              Derivatives see Group disclosure 23. Financial risk management objectives and policies

                                                                                        23. Shares and shareholders
                                                                                        See Group disclosure 28. Shares and shareholders


                                                                                        24. Key ratios
                                                                                        See Group disclosure 29. Key ratios
F-Secure 2012   03 47


Auditor’s report (translation)
To the Annual General Meeting                                         reasonable assurance about whether the financial statements         Opinion on the company’s financial statements
of F-Secure Corporation                                               and the report of the Board of Directors are free from material     and the report of the Board of Directors
We have audited the accounting records, the financial                 misstatement, and whether the members of the Board of               In our opinion, the financial statements and the report of
statements, the report of the Board of Directors, and the             Directors of the parent company or the Managing Director            the Board of Directors give a true and fair view of both the
administration of F-Secure Corporation for the financial              are guilty of an act or negligence which may result in liability    consolidated and the parent company’s financial performance
period 1. 1.–31. 12. 2012. The financial statements comprise          in damages towards the company or have violated the Limited         and financial position in accordance with the laws and regula-
the consolidated statement of financial position, statement           Liability Companies Act or the articles of association of the       tions governing the preparation of the financial statements and
of comprehensive income, statement of changes in equity               company.                                                            the report of the Board of Directors in Finland. The information
and statement of cash flows, and notes to the consolidated                An audit involves performing procedures to obtain audit         in the report of the Board of Directors is consistent with the
financial statements, as well as the parent company’s balance         evidence about the amounts and disclosures in the financial         information in the financial statements.
sheet, income statement, cash flow statement and notes to the         statements and the report of the Board of Directors. The
financial statements.                                                 procedures selected depend on the auditor’s judgment,               Helsinki, February 14, 2013
                                                                      including the assessment of the risks of material misstatement,
Responsibility of the Board of Directors                              whether due to fraud or error. In making those risk assessments,    Ernst  Young Oy
and the Managing Director                                             the auditor considers internal control relevant to the entity’s     Authorized Public Accountant Firm
The Board of Directors and the Managing Director are respon-          preparation of financial statements and report of the Board of
sible for the preparation of consolidated financial statements        Directors that give a true and fair view in order to design audit   Erkka Talvinko
that give a true and fair view in accordance with International       procedures that are appropriate in the circumstances, but not       Authorized Public Accountant
Financial Reporting Standards (IFRS) as adopted by the EU, as         for the purpose of expressing an opinion on the effectiveness
well as for the preparation of financial statements and the           of the company’s internal control. An audit also includes evalu-
report of the Board of Directors that give a true and fair view in    ating the appropriateness of accounting policies used and the
accordance with the laws and regulations governing the prepa-         reasonableness of accounting estimates made by management,
ration of the financial statements and the report of the Board        as well as evaluating the overall presentation of the financial
of Directors in Finland. The Board of Directors is responsible for    statements and the report of the Board of Directors.
the appropriate arrangement of the control of the company’s               We believe that the audit evidence we have obtained is
accounts and finances, and the Managing Director shall see to         sufficient and appropriate to provide a basis for our audit
it that the accounts of the company are in compliance with the        opinion.
law and that its financial affairs have been arranged in a reliable
manner.                                                               Opinion on the consolidated financial statements
                                                                      In our opinion, the consolidated financial statements
Auditor’s Responsibility                                              give a true and fair view of the financial position, financial
Our responsibility is to express an opinion on the financial          performance, and cash flows of the group in accordance with
statements, on the consolidated financial statements and on           International Financial Reporting Standards (IFRS) as adopted
the report of the Board of Directors based on our audit. The          by the EU.
Auditing Act requires that we comply with the requirements
of professional ethics. We conducted our audit in accordance
with good auditing practice in Finland. Good auditing
practice requires that we plan and perform the audit to obtain
F-Secure 2012   04 48


                                          Corporate Governance Statement
                                                    General principles
                                                    F-Secure Corporation applies principles of corporate governance and
                                                    follows high ethical standards in all its operations. F-Secure’s corporate
                                                    governance practices comply with Finnish laws and regulations, F-Secure’s
                                                    Articles of Association, the rules of the Helsinki stock exchange as well
                                                    as with Finnish Corporate Governance Code issued by the Securities
                                                    Market Association of Finland in 2010. The code is publicly available at
                                                    www.cgfinland.com.
                                                        The key elements of the Corporate Governance practices of F-Secure
                                                    Corporation are described briefly below. In addition, in 2012 the most
                                                    essential tasks and responsibilities of the Board of Directors, Board
                                                    Committees and the other main governing bodies are described. This
                                                    statement also includes the description of the main features of internal
                                                    control and risk management pertaining to the financial reporting process.
                                                    More information on corporate governance practices of the company is
                                                    available on F-Secure Corporation’s website.

                                                    Annual General Meeting of
                                                    Shareholders (AGM)
                                                    The highest governing body of the corporation is the General Meeting
                                                    of Shareholders. The AGM’s tasks are defined in detail by the Finnish
                                                    Companies Act, Articles of Association of F-Secure Corporation and other
                                                    regulations. The AGM shall decide on the number of members of the Board
                                                    of Directors, confirm remunerations to the Board members and auditors,
                                                    appoint Board members, approve financial statements, determine dividends
                                                    and select auditor and determine other issues defined by the Articles of
                                                    Association and the Finnish Companies Act. The AGM shall be held after
                                                    the end of the financial year within a period determined by the Board of
                                                    Directors and as defined by the Companies Act. F-Secure Corporation has
                                                    only one class of shares and thus all shares have equal voting power at the
                                                    General Meetings of Shareholders.
                                                        In 2012, the Annual General Meeting was held in Helsinki, HTC Ruoholahti
                                                    on April, 3. The decisions made by the AGM 2012 are presented in detail in
                                                    the Board of Directors’ report for 2012.

                                                    The main tasks of the Board of Directors
                                                    The objective of the Board of Directors is to direct the company with the aim
Veli-Jussi, Director, Security Products             of achieving the best possible return on invested capital for shareholders in
                                                    the long term. The Board of Directors represents all shareholders. The Board
F-Secure 2012   04 49


of Directors shall always work to the best advantage of the           The Board of Directors shall convene at least five times         the members are Jussi Arovaara and Juho Malmberg. The
company and all of its shareholders.                               during its term. The Board shall conduct an annual self-            Chairman of the Executive Committee is Sari Baldauf and the
    The Board of Directors is responsible for making sure          assessment of its operations.                                       members are Risto Siilasmaa and Anu Nissinen.
that supervision of th e company’s accounting and financial                                                                               The charters of both Committees are available on the
management is duly organized. The meetings of the Board            Board of Directors in 2012                                          Company’s web pages under About F-Secure  Investors 
shall regularly discuss reports presented by the CEO of the        According to the decision of the Annual General Meeting 2012,       Governance.
Company on the financial status and operations of the company.     the Board has six (6) members. The members of the Board
Furthermore, it is the duty of the Board to prepare matters to     are Risto Siilasmaa (Chairman), Jussi Arovaara, Sari Baldauf,       Audit Committee
be handled by the shareholders’ meeting, to decide on the          Pertti Ervi, Juho Malmberg and Anu Nissinen. All members            The Audit Committee prepares, instructs and evaluates the
convening of the shareholders’ meeting and to make sure that       were re-elected. Risto Siilasmaa continued as a Chairman of the     Corporation’s risk management, internal supervision systems,
the decisions made at the shareholders’ meeting are executed.      Board.                                                              IT strategy and practices, financial reporting, external auditing
    Any matters that are significant or far-reaching from the          The majority of F-Secure Corporation’s Board of Directors,      of the accounts and internal control. During 2012, the Audit
company’s point of view shall be dealt with by the Board. These    Pertti Ervi, Sari Baldauf, Juho Malmberg, Anu Nissinen and Jussi    Committee held five meetings and the attendance was close
include strategic outlines, approval of budgets and operating      Arovaara, have no dependence neither on the company nor             to 100%.
plans and supervision of how these are put into effect, acquisi-   the significant shareholders. The Chairman of the Board, Mr.            In 2012, the Audit Committee covered topics widely within
tions and corporate structure, any major investments with          Siilasmaa, is a major shareholder of the company.                   the charter focusing on internal and external IT (hosting).
regard to the operation of the company, organization of the             During 2012, the Board of Directors held 10 meetings and       Furthermore, the Committee assessed efficiency of internal
supervision of accounting and financial management, internal       the attendance was close to 100%. The Board of Directors            control systems and risk management process and practices
monitoring systems and risk management as well as personnel        focused, besides their ongoing duties, especially on the            including financial and legal risks. The Committee also
policies and reward systems.                                       execution of the Company’s growth strategy,introduction of          reviewed the interim reports and all other relevant stock
    The duties and responsibilities of the Board are more          the new CEO, restructuring of the organization, new leadership      exchange releases before their publication.
thoroughly defined in the Articles of Association of the           nominations and product creation capabilities. According to
company, the Finnish Companies Act and other applicable laws       the strategy, F-Secure’s first priority is to drive growth and      Executive Committee
and regulations. The Articles of Association and the charter       market expansion by continuing to create new innovative             The Executive Committee prepares material and provides
of the Board, including a more complete list of its main duties    offerings to augment traditional security services, especially in   instructions on issues related to the composition and compen-
and tasks and its committees, are presented in detail on the       the content cloud space. The Company has three channels for         sation of the Board of Directors and remuneration of the
company’s Investor web pages.                                      its products, while Operators are currently the biggest channel.    other members of the executive management. The Executive
    According to the Articles of Association, the Board shall      The Company’s strategy is described in more detail in the Board     Committee held five meetings in 2012 and the attendance was
have a minimum of three and maximum of seven ordinary              of Director’s report for 2012.                                      close to 100%.
members, whose term ends at the end of the next AGM                    Other significant tasks and responsibilities of the Board           In 2012, the Executive Committee focused especially on
following the election of members. The Annual General              comprised a general overview of the company’s financials,           the re-organization of the Company and new leadership
Meeting of Shareholders shall decide the number of Board           budget approval, setting the target levels for executive level      nominations. Other tasks comprised of e.g. long and short-
members and elect the Board members. The Board shall elect         and deciding on the incentive program for the Leadership            term incentive programs for the top management and other
the Chairman of the Board from among its members. The              Team and other key employees.                                       key personnel, discussion on employee satisfaction surveys,
Board shall also elect a secretary, who may be a non-member                                                                            and follow-up of improvement actions. The Committee also
of the Board. The term of each Board member is one year. The       Board Committees                                                    prepared proposals for the Board composition and remunera-
majority of the Board members shall be independent of the          The Board has two committees; Audit Committee and                   tion for the Annual General Meeting of Shareholders.
company. More detailed information about other terms of            Executive Committee (nomination and remuneration issues).
Board membership can be found in the Articles of Association.      The Chairman of the Audit Committee is Pertti Ervi and
F-Secure 2012   04 50


President and CEO                                                   statements. More details on the remuneration and option               the activities and financial situation of the company. Actual
The President and CEO is responsible for the day-to-day             programs are also available in the Remuneration Statement             performance against sales and cost targets and comparison
management of the company. The CEO’s duties include                 published on the Company’s investor web pages under                   period is constantly followed up by operative reporting
managing the business according to the instructions issued by       Corporate Governance.                                                 systems on a daily, weekly or monthly basis.
the Board of Directors, presenting the matters to be dealt with         CEO and the Leadership Team are presented later as a part             The company constantly monitors its cost efficiency and
in the Board of Directors’ meeting, implementing the matters        of this report.                                                       profitability as well as incoming and outgoing payment transac-
resolved by the Board of Directors and other issues determined                                                                            tions. If any inconsistencies appear, the issues are handled
in the Companies Act. The Board of Directors shall appoint the      Auditors                                                              without delay. The company’s controlling function works in
CEO and decide upon his/her remuneration and other benefits.        The auditor is elected by the Annual General Meeting for one          close cooperation with CFO and business units, providing
    The Interim CEO of the Company was Pirkka Palomäki              year’s term of service. The auditor is responsible for auditing       relevant data for business planning purposes and sales
during November 1, 2011–January 15, 2012. Christian Fredrikson      the consolidated and parent company’s financial statements            estimates. Estimates and revenue recognition are constantly
started as President and CEO as of January 16, 2012.                and accounting. The auditor will report to the Board of Direc-        monitored with various follow-up methods. The Company’s
                                                                    tors at least once a year.                                            controlling team is responsible for consistency and reliability
Leadership Team                                                         For 2012, F-Secure Corporation’s auditor was Ernst  Young        of internal control methods. The controlling team meets
The Leadership Team supports the CEO in daily operative             Oy, an auditing company of Authorized Public Accountant               business management and key personnel in order to assess the
management and development of the Company. The CEO                  authorized by the Central Chamber of Commerce. APA Erkka              reliability of estimates on continuous basis.
appoints the Leadership Team members and decides upon               Talvinko acts as responsible partner for the direction and                During 2012, the controlling team focused especially on
the terms and conditions of their employment. The Board             coordination of the audit work. During 2012, the Company              the financial management of the new organization structure.
of Directors approves the compensation for the Leadership           paid for auditing services a total of EUR 123,920 (2011: EUR          Another focus area continued to be financial support for the
Team. The bonuses and granting of stock options are based           130,810) and EUR 39,100 (2011: EUR 133,956) for other services.       Content Cloud business and its restructuring. Furthermore,
on the performance of the Company and the individual. The           Ernst  Young Oy has been F-Secure ­Corporation’s auditor             other important focus areas were financial monitoring of
Leadership Team meets regularly once a month and separately         since 1999.                                                           market expansion to Latin America as well as activation and
as needed.                                                                                                                                write-off occurrence of RD projects.
   The Leadership Team currently consists of the following          DESCRIPTION OF THE MAIN FEATURES
persons: Christian Fredrikson (President and CEO), Pirkka           OF INTERNAL CONTROL AND RISK                                          Internal audit
Palomäki (Chief Strategy Officer), Ari Alakiuttu (Vice President,   MANAGEMENT PERTAINING TO THE                                          The principles of internal audit are embedded in written
Human Resources), Taneli Virtanen (Chief Financial Officer),        FINANCIAL REPORTING PROCESS                                           guidelines and policies concerning accounting, risk manage-
Pekka Usva (Vice President, Corporate Security), Samu                                                                                     ment and controlling. These guidelines and policies in F-Secure
Konttinen (Executive Vice President, Customer and Market            Internal Control                                                      are coordinated by the company’s Finance department. The
Operations), Jari Still (Vice President, Research  Develop-        The purpose of Internal Control is to ensure that operations are      company guidelines cover accounting, reporting, documenta-
ment), Maria Nordgren (Vice President, Consumer Security)           effective and aligned with the strategy, financial reporting and      tion, authorization as well as other relevant issues. F-Secure
and Timo Laaksonen (Vice President, Content Cloud).                 that management information is reliable and in compliance             has no separate internal audit function, and therefore this has
                                                                    with applicable regulations and operating principles.                 been taken into account when defining the scope of external
Remuneration                                                            Internal control consists of all the guidelines, policies,        audit. The financial management team meets with the auditors
The remuneration paid to the Board of Directors and the             processes, practices and organizational structure that help           several times a year.
Leadership Team as well as their holdings of F-Secure shares        ensure that the business conduct is in compliance with all appli-
and options are described in notes 27 and 28 to the financial       cable regulations, and that all financial reporting is correct. The   Risk management
statements. The general principles of remuneration of the           guidelines and instructions are made to ensure that accounting        Risk management is an integrated part of F-Secure’s
President and CEO are described in note 27 to the financial         and financial information is a true and accurate reflection of        governance and management. The goal is to support the
F-Secure 2012   04 51


achievement of the Company’s objectives and continuity of the      committees approve and monitor the reporting procedures, as        information on a regular basis, and (3) project-based insiders.
operations by ensuring that the Company:                           well as the adequacy, appropriateness and effectiveness of the     The company maintains its public insider registers in the
                                                                   company’s business and administrative processes.                   Euroclear Finland Ltd’s SIRE system. The trading of F-Secure
●●   has comprehensive understanding of major risks, both
                                                                       Weekly and monthly financial reporting that covers the         shares and options of permanent public insiders is public.
     opportunities and threats
                                                                   entire company is used to monitor how well financial targets           Permanent public insiders and permanent company-
●●   takes proactive action to manage opportunities and threats    are being met. The reports include actual figures, plans and       specific insiders or their interest parties defined in the Finnish
                                                                   up-to-date forecasts. The company has sought to manage             Securities Markets Act are not entitled to trade shares, options
●●   has systematic means to identify, analyze, evaluate and
                                                                   the risks relating to its business operations by developing its    or other securities 21 days prior to publication of interim finan-
     control risks
                                                                   operating processes and control systems. The Board has set         cial statements or company accounts. Project-based insiders
●●   has clear understanding of roles and responsibilities         certain appropriate authorization limits to the management,        are not entitled to trade shares, options or other securities
     regarding risk management                                     and if these limits are exceeded, the decisions shall be handled   until the termination of the project. Up-to-date information
                                                                   by the Board of Directors.                                         on the holdings of F-Secure’s permanent insiders with a duty to
●●   has systematic means to collect, analyze and learn from
                                                                      The invoicing is mainly in euros. In order to minimize the      declare can be found on the company’s website.
     occurred risks.
                                                                   impact of the fluctuation of the exchange rates, the goal is           The person in charge of F-Secure’s insider issues is the
The foundation for risk management is defined in the Compa-        to hedge the estimated cash flow of affected currencies. The       IR-function of the company.
ny’s Risk Management Policy. It expresses the mandate and          Company does not provide financing outside the industry
commitment for F-Secure Risk Management and the processes          standard payment terms. The Company’s investment policy            Silent Period
and practices that are in place to identify, communicate and       for cash reserves is conservative. Cash and cash equivalent        The company observes a silent period of 21 days before each
manage material risks across the company. The policy also          are mainly invested in short-term funds and other low-risk         quarterly report announcement. During the silent period, the
ensures that responsibilities have been appropriately delegated    investments.                                                       company will arrange neither meetings nor conference calls
for Risk Management.                                                   During 2012, the most significant risks were related to        with the investor community.
    The Board of Directors is responsible for approval of the      the competitiveness of F-Secure’s product portfolio in the
Risk Management Policy and determines the company’s overall        changing market situation, the ability to protect the intel-       Communications
risk attitude. The Board of Directors and its Audit Committee      lectual property (IPR) in F-Secure’s solutions, risk exposure      The aim of the Company’s communications is to support the
are responsible for monitoring the company’s top risks and         from increasing contractual liability requirements, regional       correct valuation of the company by providing the markets
related controls and the effective implementation of the policy.   development in new growth markets, sustainability of partner       with sufficient information on F-Secure’s financial position,
The Audit Committee annually conducts a top risk review and        relationships, forming of new business areas, continuous           strategy and objectives. The Board of Directors has approved
evaluates the effectiveness of the risk management system.         change in the storage and content cloud services markets, and      the disclosure policy that defines the guidelines in communica-
    The CEO and the Leadership Team are accountable to             potential security threats targeted to these services.             tions to financial markets and investors and other parties.
the Board for approving the Company’s risk management                                                                                 F-Secure’s web site contains all information made public
standards and ensuring they are applied in a constant manner       OTHER GOVERNANCE ISSUES                                            according to the disclosure requirements for listed companies.
across the organization.
    The corporate Risk Management function provides and            Management of insider issues
maintains a process to identify, analyze, evaluate and treat       The company follows the insider regulations of the NASDAQ
of risks. Risk assessments are conducted twice a year as part      OMX Helsinki Ltd. Insiders are divided into three categories:
of the biannual company planning cycle. The company level          (1) permanent public insiders including the members of the
risk profile is approved by the Leadership Team. Leadership        Board, the auditors, and the Leadership Team of the company,
Team conducts a company level risk review biannually in sync       (2) permanent company-specific non-public insiders including
with the operational planning. The Board of Directors and its      persons who by virtue of their position or tasks learn inside
F-Secure 2012   04 52


Board of Directors
Risto Siilasmaa                                                  Sari Baldauf                                                  Main board memberships and public duties:
Chairman of the Board of Directors since 2006                    Board member since 2005                                       Chairman of the Board of Directors of Inventure Oy
Board member since 1988                                          Chairman of the Executive Committee                           Chairman of the Board of Directors Nevtor Oy
b. 1966, M.Sc. (Engineering)                                     b. 1955, M.Sc. (Bus. Adm.)                                    Chairman of the Board of Directors Efecte Corporation
Main employment history:                                         Main employment history:                                      Chairman of the Board of Directors Ixonos Plc
Currently Chairman of the Board, F-Secure Corporation            Worked for more than twenty years at Nokia Corporation e.g.   Chairman of the Board of Directors Comptel Corporation
Founder, F-Secure Corporation                                    Member of the Group Executive Board, 1994–2005                Member of the Board of Directors of Teleste Corporation
President and CEO, F-Secure Corporation, 1988–2006               Executive Vice President and General Manager of Networks,     Holdings: number of shares 27,616.
Main board memberships and public duties:                        1998–2005
Chairman of the Board of Directors of Nokia Corporation          Main board memberships and public duties:                     Juho Malmberg
Member of the Board of Directors of Mendor Oy                    Chairman of the Board of Directors of Fortum Corporation      Board member since 2008
Vice Chairman of the Board of Federation of Finnish              Member of the supervisory Board of AkzoNobel N.V.             b. 1962, M.Sc. (Computer Science)
Technology Industries                                            Member of the supervisory Board Daimler AG                    Main employment history:
Member of the Board of Directors of Confederation of Finnish     Member of the supervisory Board Deutsche Telekom AG           Currently CEO of ZenRobotics Ltd
Industries, EK                                                   Vice Chairman of the Board of Finnish Business and Policy     Executive Vice President, Development and a Member of
Member the Tsinghua SEM Advisory Board, Tsinghua University      Forum EVA                                                     Executive Board of KONE Corporation, 2006–2012
Holdings: number of shares 63,102,689, holding 39.74%            Member of Steering Group for Finland’s external economic      Managing Director of Accenture Finland, 2002–2005
                                                                 relations                                                     Director, Nordic Outsourcing of Accenture, 2005
Jussi Arovaara                                                   Chairman of the Board of Savonlinna Opera Festival            Deputy Managing Director of Accenture, 1999–2002
Board member since 2010                                          Member of the Board of Muuvit Health and Learning Oy          Technology Director of Accenture, 1992–1999
b. 1966                                                          Member of the Board of the Finnish Children and Youth         Holdings: number of shares 38,213.
Main employment history:                                         foundation
Currently Vice President, Global Operations in Corel             Member of the Board of the Tukikummit foundation              Anu Nissinen
Corporation (UK)                                                 Member of the Board of John Nurminen foundation               Board member since 2010
Senior Director, International Sales and Marketing Operations,   Holdings: number of shares 111,616.                           b. 1963, M.Sc. (Economics)
2005–2009 Corel Corporation (UK)                                                                                               Main employment history:
Director, International Product Marketing, 2004–2005 Corel       Pertti Ervi                                                   Currently CEO of Sanoma Media Finland Oy and a Member of
Corporation (UK)                                                 Board member since 2003                                       the Executive Management Group of Sanoma
Vice President, EMEA Sales, 2002–2004 Corel Corporation (UK)     Chairman of The Audit Committee                               President of Sanoma Entertainment Ltd, 2008–2011
Vice President, Sales Operations, 1999–2001 Corel Corporation    b. 1957, B.Sc. (Electronics)                                  President of SW Television Oy/ Welho, 2004–2008
(Canada)                                                         Main employment history:                                      Marketing Director of Helsinki Televisio Oy, 2001–2004
Previously worked in several sales and marketing positions in    Currently an independent management consultant                Marketing Manager of Oy Sinebrychoff Ab, 1998–2000
computer wholesale.                                              Co-founder, Managing Director, Computer 2000 Finland Oy,      Holdings: number of shares 18,582.
Holdings: number of shares 18,582.                               1983–1995
                                                                 Co-President, Member of the Executive Board, Computer 2000
                                                                 AG, 1995–2000
                                                                 Has worked at international management level with major IT
                                                                 vendors such as Cisco, IBM, Intel, HP and Microsoft.
F-Secure 2012   04 53


Leadership Team
Christian Fredrikson                                              management and product development.                                 Jari Still
President and CEO                                                 Holdings: number of shares: 41,633                                  Vice President, Research  Development Operations
b.1964, M.Sc. (Engineering)                                                                                                           b. 1965, B.Sc.(Information processing sciences)
Main employment history:                                          Taneli Virtanen                                                     Main employment history:
Joined F-Secure in January, 2012. Was previously responsible      Chief Financial Officer                                             Member of the Leadership Team since April 2012. Has worked e.g.
for global sales for of Network Systems business unit at Nokia    b. 1965, M.Sc. (Economics)                                          as a head of research and development of Mobile Business Unit.
Siemens Networks. Furthermore, past positions at Nokia Siemens    Main employment history:                                            Prior to joining F-Secure in 2000, worked as co-founder and Chief
Networks include Head of Asia Pacific Region and Head of OBS      Member of Leadership Team since 2002. Prior to joining              Executive Officer in Modera Point Oy and in its subsidiary in San
Business Unit (Operations and Business Software), including RD   F- Secure in 1999, worked for Santasalo-JOT Group as Group          Jose, CA. Has worked for Finnish telecommunication and software
and sales. Joined Nokia in 1994, and has held several executive   Controller.                                                         companies in product development and management positions.
level positions in the company, including RD and sales.          Holdings: number of shares: 56,633                                  Has also had several Chairman positions in the Oulu area software
    Christian Fredrikson is a member of the Communications                                                                            and business forums.
Administration Committee of Ministry of Transport and             Pekka Usva                                                          Holdings: number of shares: 82,698
Communications in Finland as well as a member of the Steering     Vice President, Corporate Security
Board of the European Cloud Partnership under the European        born 1969, Vocational Qualification (Bus.Adm.)                      Maria Nordgren
Commission.                                                       Main employment history:                                            Vice President, Consumer Security
Holdings: –                                                       Member of the Leadership Team since July 2012. Joined               b. 1964, M.Sc.
                                                                  F-Secure in 1995 and has served in various positions including      Main employment history:
Pirkka Palomäki                                                   Director in Corporate Business Solutions, Director of Product       Member of the Leadership Team since 2010. Has previously served
Chief Strategy Officer                                            Management and Development in Corporate Business and                as Vice President, Channel Business, Vice President and Corporate
b. 1970, M.Sc. (Industrial Management)                            Director of Solution Management in Corporate Business.              Business. Joined F-Secure’s International Sales unit in 2005. Has
Main employment history:                                          Holdings: –                                                         held management positions in Finnish software companies such
Member of the Leadership Team since 2001. Joined F-Secure                                                                             as DeskArtes which she co-founded and later headed.
in 1997 and has previously headed Product Management,             Samu Konttinen                                                      Holdings: 20,815
Marketing and RD in F-Secure. Prior to F-Secure worked           Executive Vice President, Customer and Market Operations
for Telecom Finland (currently TeliaSonera) in the field of       b. 1973, studies in Haaga-Helia university of Applied Sciences      Timo Laaksonen
marketing, business development and development manage-           (Bus.Adm.)                                                          Vice President, Content Cloud
ment for data communication services.                             Main employment history:                                            born 1961, M.Sc. (Economics)
Holdings: number of shares 53,597                                 Member of the Leadership Team since 2009. Has previously            Main employment history:
                                                                  served as Executive Vice President, Sales and Marketing, Vice       Member of the Leadership Team since October 2012. Prior
Ari Alakiuttu                                                     President of Sales and Geographical Operations and Vice             to joining F-Secure, worked as Chief Commercial Officer in
Vice President, Human Resources                                   President of Mobile Business Unit. Prior to that, worked in sales   Tecnotree Corporation. Started his career in enterprise IT sales
b. 1967, M.Sc. (Engineering)                                      and channel management, including Director of Regional              and marketing management in Nokia Data and Teamware Group
Main employment history:                                          Operations, covering F-Secure operations in +20 countries in        (Fujitsu). Then moved on to drive and manage a number of
Member of the Leadership Team since 2007. Joined F-Secure         EMEA. Before joining F-Secure in 2005 held a Vice President         international growth business ventures in the telecom, internet
in 2000 and served as Vice President, Products  Services and     position at Valimo Wireless Ltd 2001–2005.                          and mobile arena, as Executive VP in Sonera SmartTrust and as
held positions in Product Management, Product Marketing           Main Board Memberships taken: member of the Board in                CEO of First Hop and Xtract.
and Channel Development until 2008. Prior to joining F-Secure     Ixonos Plc.                                                         Holdings: –
worked for Tellabs and for Nokia in the fields of product         Holdings: number of shares: 41,633
F-Secure 2012   05 54


Information for shareholders
The main goal of F-Secure’s investor communications is to make                    F-Secure Corporation
available correct, up-to-date information about F-Secure and its opera-           Corporate Headquarters
tions – impartially and simultaneously to all interest groups. All published      Tammasaarenkatu 7
investor information including annual reports, interim reports, as well as        P.O. Box 24
stock exchange and press releases are available on the Group’s website            00181 Helsinki
www.f-secure.com  About F-Secure  Investors. All investor information           Finland
is published in English and in Finnish. Subscriptions for the emailing list for   Tel. +358 9 2520 0700
stock exchange releases can be made by sending your contact details to            E-mail: helsinki@f-secure.com
investor-relations@f-secure.com.                                                  www.f-secure.com
    F-Secure publishes a financial statement bulletin and three interim
reports during 2013, and arranges news conferences for media and analysts
at the time of publishing the quarterly reports. F-Secure observes a three-
week silent period before the publishing of each quarterly report. During
this time, F-Secure does arranges neither meetings nor phone conferences
with investors or analysts.

Annual General Meeting
The Annual General Meeting of F-Secure Corporation is scheduled to be
 held on Wednesday, April 3, 2013 at 3.30 p.m. (Finnish time) at F-Secure
­Corporation, Tammasaarenkatu 7, 00180 Helsinki. More information on
 how to attend as well as the documents for the meeting are available on the
 Group’s webpage www.f-secure.com  About F-Secure  Investors.

Financial calendar for 2013
Financial Statements Bulletin 	   February 1
Annual Report 	                   Latest week 11 in March
Q1 Interim Report	                April 26
Q2 Interim Report 	               July 26
Q3 Interim Report 	               October 25

F-Secure share facts
Listing since (1999) 	            NASDAQ OMX Helsinki Ltd.
Trading symbol 	                  FSC 1V
Number of shares 	                158,798,739

IR Contacts
For any inquiries on F-Secure as an investment target, please contact:
investor-relations@f-secure.com
content F-Secure  design and layout Kreab Gavin Anderson photographs Antti Ahtiluoto print Lönnberg Print  Promo 2013
F-Secure Corporation
Tammasaarenkatu 7
P.O. Box 24
00181 Helsinki
Tel. +358 9 2520 0700
helsinki@f-secure.com
                        Karmina, Senior Analyst, Response Services
www.f-secure.com

F-Secure's Annual Report 2012

  • 1.
  • 2.
    F-Secure has beenprotecting the digital lives of consumers and businesses for Contents 25 years. Our Internet security and content cloud services are available through reseller partners, through over 200 operators in more than 40 countries and directly to consumers. 01 Key figures 2012 . . . . . . . . . . . . . . . . . . 01 In 2012, the company’s revenues were EUR 157 million and it has over 900 F-Secure in brief . . . . . . . . . . . . . . . . . . 02 employees in more than 20 offices worldwide. F-Secure Corporation is listed on CEO letter . . . . . . . . . . . . . . . . . . . . . . 04 the NASDAQ OMX Helsinki. 02 Board of Directors’ Report 2012 . . . . . . . . . 06 03 FINANCIAL STATEMENTS F-SECURE CONSOLIDATED . . . . . . . . . . . . 12 Statement of comprehensive income . . . . . 12 Statement of financial position . . . . . . . . . 13 Statement of cash flows . . . . . . . . . . . . . 14 Statement of changes in equity . . . . . . . . . 15 Notes to the financial statements . . . . . . . . 16 Calculation of key ratios . . . . . . . . . . . . . . 35 F-SECURE CORPORATION . . . . . . . . . . . . 36 Income statement . . . . . . . . . . . . . . . . . 36 Balance sheet . . . . . . . . . . . . . . . . . . . . 37 Cash flow statement . . . . . . . . . . . . . . . . 38 Notes to the financial statements . . . . . . . . 39 Auditor’s report (translation) . . . . . . . . . . . 47 04 Corporate Governance Statement . . . . . . . 48 Board of Directors . . . . . . . . . . . . . . . . . 52 Leadership Team . . . . . . . . . . . . . . . . . . 53 Sarogini, Quality Engineer, Labs 05 Information for shareholders . . . . . . . . . . 54
  • 3.
    F-Secure 2012 01 01 Key figures 2012 Revenues and operating profit Revenues by the operator business 2008–2012, MEUR 2001–2012, MEUR 95.4 157.2 84.8 146.0 17% 125.1 130.1 67.1 157.2 113.0 60.3 12% 11% 48.3 Revenues MEUR 8% 35.9 Operating Profit MEUR 20.3 4% 26.0 16.6 24.3 24.0 21.8* 23.6 27.3* 8.5 Earnings per share EUR 0.09 0.5 1.4 3.5 2008 2009 2010 2011 2012 01 02 03 04 05 06 07 08 09 10 11 12 Dividend per share EUR 0.06 l Revenues  l  Operating profit l  Revenue growth * excluding one-offs R&D investments 31% of revenues Regional revenue split Personnel by function 2012, % 2012, % Equity ratio 73% 14% 14% 30% 10% Personnel 931 44% 42% 46% l  Nordic countries 30% l  Sales & Marketing 44% l  Rest of Europe 46% l  Research & Development 42% l  North America 10% l  Administration 14% l  Rest of the world 14%
  • 4.
    F-Secure 2012 01 02 F-Secure in brief Protecting the Irreplaceable F-Secure’s promise ‘Protecting the irreplaceable’ captures the essence of what we do. We protect people’s valuable digital content and their online interactions. As our customers’ on-the-go digital lives flow between smart- phones, tablets, and PCs, they can be confident that their content is backed up and secure and their devices and data are protected from digital threats. So what’s personal stays personal and safe, anywhere. People are going online for business, leisure, and everything in between. Our job at F-Secure is to make all of this safe and secure – to protect people’s lives online. Strategy F-Secure’s first priority is to seek growth and market expansion. We will increasingly promote our converged security and content cloud portfolio, services which meet today’s needs for protection and privacy of devices, content and personal data. Simultaneously we will continue to bring innovative new products to the market, products whose development is being determined by key trends such as soaring mobile adoption, takeoff of personal cloud services, and ubiquitous consumerization. By addressing these trends we will remain competitive, meeting the needs of the mass market. F-Secure has been protecting the digital lives of consumers and businesses for 25 years. Two very strong assets give us a solid foundation for our future success: our award-winning, competitive technology and our channels. We sell through operators, broadband and mobile providers, work together with resellers as well as sell directly to consumers through our eStore, app stores and selected retail partners. Dmitriy, Director, New Concepts & Technology
  • 5.
    F-Secure 2012 01 03 Market Trends Products and services The role of security and privacy is increasing exponentially. This means F-Secure’s long history of expertise in online security and portfolio of F-Secure has a growing role to play in people’s lives. Most of us know that award-winning security products are complemented by its innovation in we need to protect our computers. But as we use more and more devices cloud services. to go online, we face the same security threats on our other devices too. All Being constantly connected brings its own risks, and today’s sophisti- devices and their precious user generated content need to be protected. cated malware requires advanced protection. F-Secure Internet Security and Security software revenues in 2012 are estimated to be $19.2 billion, a Mobile Security provide complete protection for computers, smartphones growth of 8.4% from the previous year (Gartner, August 2012). The fore- and tablets. casted growth for the overall global security software market remains solid at F-Secure’s personal content cloud product enables consumers to store, around 8.2% until 2016 (CAGR). The growth of the security market is mostly sync, access and share their photos, videos, documents and other files organic and is derived from emerging markets, such as APAC, China and safely anywhere, from any device. Users’ content stays 100 percent private, Latin America (Gartner, August 2012). safe and under their control as content is scanned only for malware, not for Users create and share content constantly. The volume of user-generated marketing analytics or profiling. digital content is expected to continue to increase rapidly in the coming years, driven by digital photos, videos and music. 89% of people (F-Secure Broadband Consumer Survey, 2012) want all their content to be available on all their devices and look for services to share, store and control their Unique business model BUSINESSES personal data. Parks Associates forecasts that operators providing security, storage and sharing value-added services have a revenue opportunity of We have the best corporate $1.03 billion in 2012, increasing to $4.82 billion in 2015. security strategy. CONSUMERS Customers We have the best protec- People and companies are online 24/7, storing data in multiple systems tion in the world and we PARTNERS and locations. There is a growing need and challenge to protect the truly irreplaceable for people in work and private life: identity and reputation, securely store PETABYTES We are the leader with over digital memories, IPR and privacy. F-Secure protects tens of millions of of content for millions of 200 operator partnerships customers’ irreplaceable digital content and online interactions. Anytime, customers. in over 40 countries. anywhere, on any device. Behind our over 200 operator partners in more than 40 countries there are currently more than 250 million broadband and mobile end users. We also serve consumers directly through our e-Store and retailers in select markets, and corporate customers through our global network of resellers. Our services help customers enjoy a digital lifestyle to the fullest, whether it’s surfing, sharing content, social networking or at work.
  • 6.
    F-Secure 2012 01 04 Your Security – Our Pride CEO letter My first year as CEO at F-Secure was very inspiring. Now, after one year and after meeting hundreds of F-Secure employees and many customers in various different countries I am more convinced than ever that this company has great assets to become a truly meaningful global player. In my opinion we have vast opportunities in the security and content cloud businesses to clearly change these areas as an innovator and thought leader. Over the past year we have made good operative progress. We have renewed our Leadership Team and organizational structure and have started to change our way of working to improve our productivity and operational efficiency as well as time-to-market and customer-centricity. We wanted to better focus our resources on areas important for our future and eliminate work which was not moving us towards our goals. The changes were successful; we now get more important development done with less costs. Our main goal is to seek revenue growth while gradually improving our profitability. We have now taken positive steps in this direction. Our journey to more growth and profitability will be accompanied by a few key trends. It’s hardly news that mobile adoption is soaring and creating a growing awareness and need for mobile security. And while the personal cloud is finally taking off as users start seeing the advantage of having content accessible from anywhere at any time, ubiquitous consumerization will change the dynamics of the industry. We are responding to and evolving with all three of these trends. Internet Security portfolio continues to evolve with success Over the year we launched several new Internet security products for consumers and corporate users for both PC and mobile environments. We introduced a unique Banking Protection feature for our flagship consumer PC product, F-Secure Internet Security 2013, and are now able to support all major mobile operating systems with F-Secure Mobile Security. The new version of F-Secure Protection Service for Business lifted the product to the next level of best-of-breed business security solutions. We are proud of our solutions, and independent test organizations proved that we provide state-of-the-art products. Our corporate security strategy was recognized as top-ranked in The Forrester Wave, Endpoint Security report. In January 2013, we received the award from AV-TEST for Best Protection in the Home Christian Fredrikson, President and CEO User category – just to name the highlight among many other awards our flagship consumer product has received.
  • 7.
    F-Secure 2012 01 05 The growth in mobile device usage is opening new largest operators, launched their content cloud service last development. By addressing these trends we are preserving opportunities and our mobile security sales are picking up. At autumn and it is progressing well. These launches, together our product competitiveness and will be able to introduce the same time the slower growth of PC shipments is causing with growing interest among service providers, fuel our innovative products designed to meet the needs of the mass challenges in one of our traditionally strongest business areas. excitement for our next-generation content cloud offering. market. Simultaneously, we will increasingly promote our Nonetheless, last year our Internet security business performed converged security and content cloud portfolio. We are also very well especially through our main channel, operators and Consumerization is changing the game seeking further growth by expanding our geographical reach, Internet service providers, and again achieved double-digit We live in exciting times. People have become multi-screeners especially in Latin America and Asia Pacific. subscriber and revenue growth overall. During the year we who use smartphones, tablets, computers, even TVs or gaming To succeed in our efforts we will employ one of our launched several new partnerships. Our latest entry into the consoles to get online. Over 65% of people have more than greatest assets: our channel with more than 200 operators, Latin American continent contributed to a strong performance. one device. Many activities are performed either sequentially service providers and cable operators worldwide. F-Secure Traditional channels, corporate and direct to consumer, were or in parallel on various devices, which defines new require- is the global leader in providing security as a service through doing better than expected at the beginning of the year, ments for software. We have and we will continue to create new operators addressing a customer base of more than 250 million showing once again the competiveness of our products. products to address the rising need for safety and protecting subscribers. Additionally, we now aim to grow through our two the most private content in an environment where the other solid channels, direct consumer and resellers. Breakthrough in our new content cloud importance of PCs is diminishing, and mobile or other devices We are building further success on solid ground. This year A competitive portfolio is also needed in the content cloud connected to the Internet are on the rise. marks the 25th anniversary of F-Secure with a great track business. It’s a fast moving, highly competitive market that However, we see one mega-trend: consumerization. BYOD record in the security business. F-Secure has been protecting sees many start-up and mature companies driving innovations. (Bring Your Own Device) and BYOA (Bring Your Own App) the digital lives of consumers and businesses since late 80’s. Tens of millions of cloud subscribers are needed to build up a are part of this trend and offer individuals and companies Today we provide Internet security and content cloud services sustainable business and be established as a big player. A lot new opportunities to increase productivity and reduce IT in more than 40 countries around the world. We are the trusted of companies have difficulties monetizing their content cloud infrastructure costs. At the same time this trend generates partner in data protection for millions of homes and businesses. offerings and in the end many won’t make it. While content new challenges for protecting content, privacy, reputation and As the story continues, I wish to thank our personnel for cloud business models are still evolving we are pleased with intellectual property. For us, consumerization will significantly their great contribution, and our customers and partners for our progress in that area. We securely store billions of photos, impact the development of our products, go-to-market strate- their excellent cooperation last year. I would also like to extend videos, documents, and other files for millions of consumers gies and last but not least our way of working. We see ourselves my warmest thanks to our shareholders for their continued globally. Located in five data centers on three continents, well placed for this shift, with our strong focus on providing trust in F-Secure. F-Secure’s ever-increasing cloud content has grown to make security and content cloud products for people – whether in up several petabytes of data. What makes our personal content a business or leisure context. We have a great asset to build cloud so different from many other products? The answer on: we serve both businesses and consumers. Working with is simple: security. With F-Secure, consumers’ content stays each group increases our insight and expertise and benefits 100 percent private, safe and under their control. Content is the other. The consumer-led change of how people use the scanned only for malware, not for marketing analytics and internet is at our fingertips and we know that in the future it Christian Fredrikson profiling as with some other companies. will be the user’s behavior – not the device, not the app – that President & CEO Our new productized content cloud solution is highly drives technology development. scalable, enables a much faster time to market and strengthens our competitive position in the emerging content cloud We are investing in growth business. Our latest launch at BT – one of the major European The mentioned industry trends such as mobility and the operators – once again proves the excellence of our products need for mobile security, the growth of the personal content and our ability to deliver on time. AT&T, one of the world’s cloud, and consumerization are determining our product
  • 8.
    F-Secure 2012 02 06 Board of Directors’ Report 2012 In 2012, F-Secure’s overall performance was solid. The Company continued its profitable growth while the revenue growth has been below the target level. During the year, the Company made organizational changes to improve its operational efficiency, time-to- market capabilities and market-centricity. These changes combined with an award- winning Internet Security portfolio and Content Cloud products are expected to support the Company’s aim back to high growth in the coming years. Financial performance and key figures Total revenues in 2012 were 157.2 million, representing a growth of 8% (146m). Revenue growth through the operator channel remained solid, with a growth of 12% from the previous year and reaching revenues of 95.2 million (84.8m). Revenues through the other channels grew over 1%, totaling 61.9 million (61.2m). EBIT was 20.3 million (23.6m), representing 13% of revenues (16%). EBIT excluding one-offs due to restructuring in the French subsidiary were 27.3 million, representing 17% of revenues. Earnings per share were EUR 0.09 (EUR 0.11). Cash flow from operations was 25.6 million positive (20.8m positive). Deferred revenues were 37.7 million at the end of December (38.3m). Total fixed costs were 131.2 million (115.9m), 13% higher than in the previous year. The increases in operational costs were allocated to geographic expansion in Latin America and to R&D to improve the competitiveness of the products. The cost level was impacted by increased depreciations from past capitalized R&D-expenses and other investments (R&D activations, software, and hardware); 7.9 million (6.5m) in total. F-Secure capitalized less develop- ment costs than in the previous year, 4.9 million (7.8m) in total. The one-offs due to restructuring of the French subsidiary were approximately 7 million. These were based on redundancies of 41 employees and related costs, 2.5 million (final costs were a bit higher than the 2.1m estimated in October) and write-offs of 4.5 million from the related technology and customer assets. The negotiations related to restructuring at F-Secure SDC (France) were concluded in November. In addition, there was a write-off of 0.8 million from obsolete Content Cloud development, booked in Q4, and a write-off of 0.8 million from Esa, Product Manager, Product Management an obsolete sales tool, booked in Q2. All one-off costs during the year, including restructuring costs and all write-offs, amounted to 8.6 million in
  • 9.
    F-Secure 2012 02 07 total. The total fixed costs excluding these one-offs were 122.6 Cloud business. The development of the previous version of security and Content Cloud services for PC and mobile devices. million (114.9m), 7% higher than in the previous year. the Content Cloud product has been stopped in France and The Corporate channel serves customers globally mainly In the beginning of the year 2012, F-Secure gave guidance this will improve the Company’s financial performance. through the reseller and Managed Services Partner network. for company revenues and profitability, which was further One of Europe’s major operators, BT, is now taking the The Consumer channel works globally through the eStore, defined in connection with the publication of interim reports. final steps to the launch of its Content Cloud service, and is AppStores and retailers in selected markets. The company’s revenues and profitability were in accordance planning to make it publicly available during Q1 2013. Powered F-Secure’s corporate products received the highest with the given guidance (latest guidance: revenue growth by F-Secure’s latest Content Cloud technology, the operator’s score in strategy among top endpoint security vendors in 5–10% from previous year; EBIT around 15% excluding one-offs consumer customers will now get more out of their digital an independent study (The Forrester Wave™; January 2013). in France). content while safely accessing and sharing it from virtually Forrester Research acknowledged F-Secure’s service-enabling At the end of the year, the geographical breakdown of anywhere. business approach as it is well aligned with the great shift in revenues was as follows: Finland and Scandinavia 31% (32%), rest The Company’s co-operation with AT&T is also progressing the software industry towards services. Additionally, F-Secure’s of Europe 45% (45%), North America 10% (11%) and rest of the well. F-Secure has delivered the digital content and cloud score was among the highest in the antimalware category,once world 14% (12%). storage platform for AT&T’s mobile device users to let them again demonstrating the strength of the Company’s protection Further information on the key financial data is presented in synchronize and share data in one safe, convenient location. features. note 29 to the financial statements. AT&T launched their Content Cloud service in Q3 2012 and has Sales in traditional channels continued slightly better invested in various marketing campaigns to push the service in than anticipated. Customer satisfaction in security services Operator channel the market. remained high, which was visible in healthy license and renewal The Operator channel, which includes Internet service In 2012, F-Secure entered into partnerships with several new sales.The new version of the Company’s flagship consumer providers, mobile operators and cable operators, is the operators. In Europe these operator partners were e.g. VOO product, Internet Security 2013, sold very well. Annual revenues main channel through which F-Secure services are delivered. (Belgium) and Primacom (Germany). In Latin America F-Secure showed growth of over 1% and totaled 61.9 million (61.2m), and F-Secure has more than 200 partners in over 40 countries, with entered into partnership with Telefonica Movistar operators 39% (42%) of the Company’s total revenues. an addressable market of over 250 million fixed and mobile in Chile, Mexico and Panama. In addition, some partners broadband customers. The total number of F-Secure’s operator expanded their offering to support both PC and mobile Product announcements partners is significantly larger than that of any other security Internet security. These operators include MTS (India), KPN net F-Secure develops and sells Internet Security and Content service vendor. Through operators, F-Secure provides easy and (Netherlands), Vectra (Poland), Play (Poland), TDC (Denmark) Cloud products that support personal computers, servers and intuitive to use Internet security and Content Cloud products and PCCW (Hong Kong). This demonstrates that the competi- an increasing set of major smartphone, tablet and other mobile for computers and mobile devices. tiveness of our comprehensive Internet Security offering is device operating systems. Services include a wide range of F-Secure securely stores billions of photos, videos, docu- meeting the requirements of converging online life. Internet Security products like anti-virus, anti-theft, browsing ments, and other files for millions of consumers globally. In Latin America, F-Secure is also opening two new sales protection and parental control as well as Content Cloud Located in five data centers on three continents, F-Secure’s offices, Chile and Colombia, to take advantage of the rapidly products like online backup, synchronization and sharing. ever-increasing cloud content currently makes up several growing business opportunity in the area and to support the petabytes of data. F-Secure Cloud Services, online backup partnership with Telefonica outside Brazil. In 2012 the key product announcements were as follows: and sync & share, are trusted by many of the world’s largest Annual revenues by the operator channel showed growth of telecom companies and serve more than 100 operators around 12% and totaled 95.2 million (84.8m), representing 61% (58%) of ●● In November, F-Secure introduced Banking Protection, a the world. the Company’s total revenues. new feature for F-Secure’s Internet Security 2013 product. The Company has developed a new productized, highly- Banking Protection is designed especially to protect scalable Content Cloud offering and streamlined its project Corporate and Direct to Consumer channels consumers’ online banking sessions from malicious attacks delivery to provide a shorter time to market. This new product Corporate and Direct to Consumer channels mainly provide and to protect online banking sessions against trojans by strengthens the competitive position in the emerging Content new license and renewal sales for a wide range of Internet adding an extra layer of security. It works unobtrusively
  • 10.
    F-Secure 2012 02 08 without interrupting the banking session, while still allowing and tablets.The release is a solution for today’s workplace, Risks and uncertainties access to sites that are verified as safe by F-Secure. where mobile devices are increasingly used to access Uncertainty in the economic environment may impact the e-mail and other business-sensitive information. F-Secure’s growth of broadband connections, operators’ willingness to ●● In October, F-Secure introduced patch management as a Protection Service for Business provides protection against invest in new services and may create pricing pressure. These business security feature. The debut of Software Updater malware specifically designed for smartphones, for example may have a negative impact on F-Secure’s security and Content breaks new ground for small and medium-sized businesses billing scams or spy-tools that steal contacts for spam Cloud sales. as proactive patch management software that is part of a lists. F-Secure protection can also track lost devices, giving F-Secure’s risks and uncertainties are related to, among comprehensive SMB security solution. Software Updater businesses the power to remotely lock the device or delete other things, the competitiveness of F-Secure’s product ensures that an organization’s operating systems and all confidential information. portfolio, competitive dynamics in the industry, pricing models third-party applications are up-to-date. It proactively scans (e.g. free services, cost of Content Cloud services), impact of computers for missing security updates and patches and ●● In March, F-Secure introduced Safe Infinity, which is offered changes in technology, timely and successful commercializa- deploys them automatically, displaying the results. through operator partners. F-Secure Safe Infinity safeguards tion of complex technologies and new products and solutions, ●● In September, F-Secure launched the newest version of its irreplaceable content while enabling a secure online life. the ability to protect intellectual property (IPR) in F-Secure’s flagship PC product, F-Secure Internet Security 2013, which The solution covers all the functionalities available from solutions as well as the use of third party technologies on gives consumers the best protection for their computers F-Secure’s Internet security service such as anti-virus, reasonable commercial terms, subcontracting relationships, and online identity when browsing the web. Among firewall, spam protection and parental control as well as regional development in new growth markets, sustainability key improvements, F-Secure Internet Security 2013 now backup and restore functionality via the cloud. of partner relationships, compromising stored personal data, supports all popular browsers, including Google Chrome. ●● In March, F-Secure also launched Safe Anywhere, a unique service quality related penalties, risk exposure from increasing A redesigned firewall comes with additional filters and offering which allows consumers to obtain full ­protection contractual liability requirements and forming of the new works seamlessly in home and public networks. F-Secure for their computers, smartphones and tablets in a single business areas. Internet Security users will also receive automatic updates service through their local operators. The solution includes The completion schedules during the early stages of for new beneficial features throughout the year, such as the F-Secure’s protection from viruses, spam, phishing and projects in the Content Cloud and storage business are more Banking Protection feature that was launched in November. other kinds of malware and cyber attacks. F-Secure Safe prone to changes than the schedules in the traditional security F-Secure Internet Security 2013 also supports the Windows 8 Anywhere combines F-Secure Protection Service for services business. This may result in delivery delay penalties operating system. Consumers and F-Secure Mobile Security, and it supports and variation in revenue forecasts. ●● Also in September, F-Secure released a new version PCs, Macs and mobile devices running on Android, Events after period-end of F-Secure Mobile Security, which features universal ­Blackberry, iOS and Symbian operating systems. No material changes regarding the Company’s business or support for all Android devices including smartphones, ●● In February, F-Secure introduced its entry into the Content financial position have materialized after the end of December TVs and set-top boxes. The new version also comes with Cloud space: F-Secure Content Anywhere. F-Secure 2012. a completely revamped user experience and a renewed Content Anywhere synchronizes a user’s content in the commitment to family protection measures. The release Personnel and organization cloud, making it accessible on any device, including PCs, arrived as Android threats were intensifying. F-Secure smartphones, tablets and connected digital TVs, anywhere F-Secure’s personnel totaled 931 at the end of December (942). Mobile Security is available through F-Secure’s eStore, and anytime. Consumers’ ease of use is paramount when The number of personnel has decreased, especially in the R&D global mobile operators and channel partners, and is also accessing their content from more than one device and function, due to reductions of 41 employees in the French distributed via Google Play . therefore the user interface will be uniform across all subsidiary. ●● In May, F-Secure released an updated version of its security- connected devices. Operators will be able to offer a safe F-Secure revised its organizational structure as of July 1, 2012. as-a-service solution, F-Secure Protection Service for personal cloud to their customers to save, synchronize and With this organizational change, F-Secure aims to improve Business, which now includes protection for smartphones share their digital content. its operational efficiency as well as time-to-market and
  • 11.
    F-Secure 2012 02 09 market-centricity. The main sales channels are the operator The objective of F-Secure’s capital management is to web pages. F-Secure will publish its corporate governance channel with Internet Security and Content Cloud services, and achieve an efficient capital structure that ensures the func- statement for 2012 in the Annual Report and on the Company other channels with traditional license sales to businesses and tioning of business operations and promotes the increase of website in March 2013. consumers. shareholder value. Pirkka Palomäki acted as an interim CEO of the Company Annual General Meeting between November 1, 2011 - January 15, 2012. Christian Shares, shareholders’ equity, own shares The Annual General Meeting of F-Secure Corporation was held Fredrikson started as President and CEO as of January 16, 2012. and option programs on April 3, 2012. The Meeting confirmed the financial state- Mr. Fredrikson joined F-Secure from Nokia Siemens Networks, The total number of Company shares is currently 158,798,739. ments for the financial year 2011. The members of the Board where he worked in several international executive positions The corresponding number of shares diluted is 159,115,294. The and the President and CEO were granted a discharge from from 1994. In the recruiting process, the Board especially Company’s registered shareholders’ equity is EUR 1,551,311.18. liability. The Annual General Meeting decided to distribute valued Mr.Fredrikson’s strong experience in the operator The total number of own shares held at the end of December a dividend of EUR 0.06 per share, which was paid to those business as well as his international experience. 2012 was 3,732,390 shares, corresponding to approximately shareholders that on the record date of April 10, 2012 were Currently, the Leadership Team consists of the following 2.4% of the Company’s shares and voting rights. Own shares registered in the Register of Shareholders held by Euroclear persons: Christian Fredrikson (President and CEO), Ari will be purchased to be used in the incentive compensation Finland Ltd. The dividend was paid on April 17, 2012. Alakiuttu (Human Resources & Facilities), Samu Konttinen plans, to improve the Company’s financial structure, to be used The Annual General Meeting decided that the annual (Customer and Market Operations), Timo Laaksonen (Content for making acquisitions or implementing other arrangements compensation remain on the previous year’s level; for the Cloud Business), Maria Nordgren (Consumer Security related to the Company’s business, or otherwise assigning or chairman it is EUR 55,000, for the chairmen of Executive and ­Business), Pirkka Palomäki (Chief Strategy Office), Jari Still cancelling the shares. Audit Committee EUR 40,000 and for members EUR 30,000. (R&D Operations), Pekka Usva (Corporate Security Business) The subscription period of F-Secure shares with F-Secure Approximately 40% of the annual remuneration will be paid as and Taneli Virtanen (Chief Financial Officer). 2005 warrant program ended on November 30, 2012. Currently, company shares. the Company does not have any warrant program. It was decided that the number of Board members would Finance and capital structure In November 2012, the Board of Directors established a new be six. The following members were re-elected: Jussi Arovaara, Cash flow from operations in 2012 was 25.6 million positive synthetic option-based incentive program, earning period Sari Baldauf, Pertti Ervi, Juho Malmberg, Anu Nissinen and (20.8m positive). The net financial income was slightly negative 2012–2014, for its key employees excluding the management. Risto Siilasmaa. The Board elected in the first meeting Mr. at 0.3 million (negative 0.1m), impacted by low interest income The purpose of the program is to increase the value of the Siilasmaa as the Chairman of the Board. The Board nominated and exchange rates losses. company and to commit the key employees to the company. Ms. Baldauf as the Chairman of the Executive Committee and The Company’s cash position has developed according to In January 2013, the company assigned a total of 316,555 Mr. Siilasmaa and Ms.Nissinen as members of the Executive the longer term efficient capital management objectives. The shares to 19 participants of the F-Secure share-based incentive Committee. Mr. Ervi was nominated as the Chairman of the market value of F-Secure’s liquid assets on December 31, 2012 program as a reward payment based on the 2009 earning Audit Committee and Mr. Arovaara and Mr. Malmberg were was 33.1 million (28.1m). Dividends of 9.3m were paid in April. period (share-based incentive program 2008–13). After the nominated as members of the Audit Committee. Changes in exchange rates had a slight positive impact on transfer, F-Secure Corporation holds a total of 3,415,835 of its It was decided that the auditors fee will be paid against an profitability. own shares. approved invoice. Ernst & Young Oy was elected as the Groups F-Secure’s capital expenditure in 2012 was 10.3 million auditors. APA, Mr. Erkka Talvinko is acting as the responsible (18.7m), consisting mainly of IT hardware and software as well Corporate Governance partner. as capitalization of development expenses amounting to 4.9 F-Secure complies with the Corporate Governance recommen- It was decided that the Board of Directors may pass a million (7.8m). dations for public listed companies published by the Securities resolution to purchase a maximum of 10,000,000 shares of F-Secure’s financial position remained solid. F-Secure’s Market Association, a body established by the Confederation the Company. The amount represents approximately 6.3% of equity ratio at the end of December was 73% (68%) and the of Finnish Industries EK, the Central Chamber of Commerce all the shares issued by the Company. The authorization would gearing ratio was 51% negative (47% negative). and NASDAQ OMX Helsinki Ltd., as explained on F-Secure’s be valid for one year. The authorization covers the purchase of
  • 12.
    F-Secure 2012 02 10 shares through public trading on the NASDAQ OMX Helsinki shares may be carried out in deviation from the shareholders’ device. The choice of device depends on the place, context Ltd. in accordance with its rules or through a public tender offer pre-emptive rights (directed issue). The authorization is valid and time people have on their hands. Many activities are made to the shareholders of the Company. The consideration for 18 months. In connection with registering this authorization, performed either sequentially or in parallel on various devices payable for the shares shall be based on the market price. the authorization by the AGM 2011 for a directed share issue which defines new requirements for software. In purchasing of the Company’s own shares derivative, was reversed. Users create and share content 24/7. The volume of share lending and other contracts customary to the capital user-generated digital content is expected to continue to markets may be concluded pursuant to law and applicable legal Market view increase rapidly during coming years, driven by digital photos, provisions. The authorization entitles the Board of Directors to The long-term market opportunities are attractive for F-Secure. videos and music. According to F-Secure Broadband Consumer pass a resolution to purchase the shares by deviating from the Malware threats and targeted attacks to private users and Survey, 2012 89% of people want access all their content on all shareholders’ pre-emptive rights (directed purchase) subject businesses in both PC and mobile operating environments are their devices and look for services to share, store and control to the provisions of the applicable law. Own shares will be still evolving. Every day, F-Secure’s Labs automation handles their personal data. Parks Associates forecasts that operators purchased to be used for making acquisitions or implementing and makes decisions on hundreds of thousands of executables providing security, storage and sharing value-added services other arrangements related to the Company’s business, to and handles many millions of queries to the backend about have a revenue opportunity of $1.03 billion in 2012, increasing improve the Company’s financial structure, to be used as URLs and binaries. to $4.82 billion by 2015. part of the incentive compensation plan or for the purpose The security software revenues in 2012 are estimated to The majority of people do not trust the safety of cloud of otherwise assigning or cancelling the shares. The Board be $19.2 billion, growing 8.4% from the previous year (Gartner, services according to F-Secure’s Broadband Consumer Survey. of Directors shall have the right to decide on other matters August 2012). The forecasted growth for the overall global However, the need for Internet security and different kinds related to the purchase of the Company’s own shares. security software market remains solid at around 8.2% until 2016 of safe content cloud services is increasing. It opens new The Annual General Meeting authorized the Board of Direc- (Gartner). The growth of the security market is mostly organic opportunities for security and safe content cloud service tors to decide on a transfer of a maximum of 13,732,390 own and is derived from emerging markets, such as APAC, China providers who have built trust over years and have a solid track shares of the Company either against consideration or without and Latin America (Gartner, August 2012). record. payment. The authorization would be valid for one year. The At the same time as threats are emerging, the number of New players in the Internet security area are entering the Board of Directors is authorized to transfer the shares in Internet users is growing and is close to 2.5 billion, reaching market, especially focused on mobile operating systems. There deviation from the shareholders’ pre-emptive rights (directed a global Internet penetration of close to 35%; in Asia close are a lot of new vendors in the emerging Content Cloud busi- transfer) subject to the provisions of the applicable law. The to 30%, in Europe over 60%, and in North America close to ness. However, during the last quarter there were no significant shares may be transferred as a consideration to finance 80% (Internet World Stats, U.S. Census Bureau, estimated in changes in the competitive landscape or pricing levels for acquisitions or in other arrangements and used as part of the June 2012). The growth of smartphones and other Internet Internet Security. F-Secure’s competitive position in general equity-based incentive plans of the Company as decided by the connected devices is expected to accelerate to tens of billions and especially in the Operator channel has remained strong Board of Directors. The Board of Directors shall also have the during next ten years (gigaom/Ericson). By 2016, the total based on innovative products with a great user experience and right to sell the shares through public trading on the NASDAQ installed base of mobile devices will grow threefold to 3.7 billion, award-winning technical performance. OMX Helsinki Oy. The Board of Directors shall have the right to whereas desktops and notebooks will see a drastic slowdown Based on several industry analyst estimates, the Software decide on other matters related to the transfer of own shares. growing only 30% from 1.5 billion to 2 billion devices (Gartner, as a Service (SaaS) business model is expected to continue to It was decided by the Annual General Meeting that the October 2012). grow strongly and to gain more market share over traditional Board of Directors is authorized to decide on the issuance People have become multi-screeners who use smartphones, license sales. For Operators, the Software as a Service model of shares. The amount of shares to be issued based on this tablets, computers or even TVs to get online. According is a natural expansion to their other service offerings. The authorization shall not exceed 40,000,000 shares. The Board to F-Secure’s Consumer Broadband Survey 2012 (6,400 SaaS business offers operators an opportunity to replace of Directors decides on all the conditions of the issuance of broadband subscribers from France, the UK, Germany, Sweden, revenues lost from the provision of commoditized services shares. The authorization concerns both the issuance of new Finland, Italy, Spain, the Netherlands, Belgium, USA, Canada, and to increase loyalty in the face of competitive threats from shares as well as the transfer of treasury shares. The issuance of Brazil, India and Japan) 65% of people have more than one over-the-counter providers and third parties.
  • 13.
    F-Secure 2012 02 11 Long-term objectives and strategy subscriber base. Profitability is targeted to develop towards the distributable shareholders’ equity. The suggested dividend summary for 2012–2014 25% level at the end of the strategy period. F-Secure’s longer- record date is April 8, 2013 and the payment date April 16, 2013. The Board approved F-Secure’s long-term objectives and term profitability level continues to be driven by revenue The dividend payout ratio is 66%. strategy for 2012 - 2014. F-Secure’s first priority is to drive growth and scalable operations. On December 31, 2012, the parent company distributable growth and market expansion. Based on the Company’s strong equity totaled EUR 43,9 million. No material changes have technology assets in security products, cloud computing and Outlook for 2013 taken place in the company’s financial position after the Content Cloud services, F-Secure continues to create new The long-term business opportunity with Internet Security and balance sheet date and the proposed dividend does not innovative offerings to augment traditional security services, Content Cloud products for multiple devices and platforms compromise the company’s financial standing. especially in the Content Cloud space. is attractive. The Company is looking for ways to increase its The Company sells its products globally through three revenue growth and to improve its profit margin. Helsinki, February 14, 2013 channels; Direct to Consumer channel (eStore, App Stores, The Operator channel is expected to continue to drive retail), Corporate channel (reseller network) and Operator the revenue growth powered by Internet security sales and F-Secure Corporation channel (SaaS). supported by a productized, highly-scalable Content Cloud Board of Directors Operators, including Internet service providers, mobile service. However, the short-term revenue growth remains operators and cable operators, are the main channel for at a lower level due to contractual changes and decreased Risto Siilasmaa F-Secure services. F-Secure provides, through operators, Content Cloud project revenues as the project sizes are Jussi Arovaara award-winning security and Content Cloud services and utilizes smaller. The Company also estimates good progress from the Sari Baldauf the local presence and brand of operators to reach millions of Corporate and Direct to Consumer channels. To meet the Pertti Ervi consumers in a cost-efficient and scalable way. evolving threat level and to open new business opportunities Juho Malmberg F-Secure’s competitive advantage derives from existing for Internet Security services, F-Secure will continuously launch Anu Nissinen operator network and relationships built over the years. Key new security features with a shorter time to market over the assets include security research, scalable products optimized upcoming quarters. President and CEO for the mass-market, experience in service provisioning in the The actual operational cost increase is fairly limited, and Christian Fredrikson operator network environment and the growing user base of is targeted at driving product portfolio competitiveness and operators. F-Secure stands out in its ability to combine security supporting geographical expansion. with safe Content Cloud services for both computers and Management’s estimation for the year: the annual revenue mobile devices and its understanding of the Operator channel growth is estimated to be over 5% compared to 2012. The as a whole. annual profitability is estimated to be over 15% of revenues. The During the strategy period, the Company is aiming for revenue estimate is based on the sales pipeline at the time of double-digit revenue growth, driven by the Operator channel publishing, existing subscriptions and support contracts as well and supported by the Corporate and Direct to Consumer as current exchange rates. The Company continues to priori- channels. The growth is expected to come from the western tize growth over short-term profitability and plans to invest the hemisphere and some emerging markets like Latin America majority of the improved earnings in growth opportunities in and APAC. its core business, while aiming to improve profitability. The Company will continue its investments in new services around the Content Cloud and Internet security products with Proposal for dividend distribution emphasis on end-customer focus. These investments ensure The Board of Directors is proposing to the Annual General the scalability and competiveness of the services and drive Meeting 2012, to be held on Wednesday, April 3, 2013, that F-Secure service ramp-up, both PC and mobile, for a wide a dividend of EUR 0.06 per share is to be paid from the
  • 14.
    F-Secure 2012 03 12 Statement of comprehensive income Financial Statements Jan 1–Dec 31, 2012 F-Secure consolidated Consolidated, Consolidated, EUR 1,000 Note IFRS 2012 IFRS 2011 NET SALES (1) 157,172 146,028 Material and service –7,438 –7,955 GROSS MARGIN 149,734 138,073 Other operating income (2) 1,756 1,417 Sales and marketing (3, 4) –70,936 –64,674 Research and development (3, 4) –49,311 –39,319 Administration (3, 4) –10,973 –11,899 OPERATING RESULT 20,270 23,598 Financial income and expenses (7) –327 –130 Share of profit of associate (11) –47 28 PROFIT (LOSS) BEFORE TAXES 19,896 23,496 Income taxes (8) –5,835 –7,125 RESULT FOR THE FINANCIAL YEAR 14,061 16,370 Other comprehensive income Exchange difference on translation of foreign operations 183 –21 Available-for-sale financial assets (7) 104 120 Taxes related to components of other comprehensive income (8) –25 –31 COMPREHENSIVE INCOME FOR THE YEAR 14,323 16,438 Result of the financial year is attributable to: Equity holders of the parent 14,061 16,370 Comprehensive income for the year is attributable to: Equity holders of the parent 14,323 16,438 Earnings per share Edward, Marketing Manager, Operator Activities – basic (9) 0.09 0.11 – diluted 0.09 0.10
  • 15.
    F-Secure 2012 03 13 Statement of financial position Dec 31, 2012 Consolidated, Consolidated, Consolidated, Consolidated, EUR 1,000 Note IFRS 2012 IFRS 2011 EUR 1,000 Note IFRS 2012 IFRS 2011 ASSETS SHAREHOLDERS’ EQUITY AND LIABILITIES NON-CURRENT ASSETS SHAREHOLDERS’ EQUITY (18) Tangible assets (10) 9,767 9,072 Share capital 1,551 1,551 Intangible assets (10) 20,847 25,256 Share premium 165 165 Goodwill (12) 19,398 19,398 Treasury shares –8,419 –9,002 Investments in associated companies (11) 94 155 Fair value reserve 195 116 Deferred tax assets (13) 5,035 5,034 Translation differences 14 –169 Other financial assets 308 Reserve for invested unrestricted equity 5,051 5,051 Total non-current assets 55,141 59,223 Retained earnings 66,547 61,845 Equity attributable to equity holders of the parent 65,105 59,557 CURRENT ASSETS Inventories (14) 235 350 NON-CURRENT LIABILITIES Trade and other receivables (15) 36,008 36,741 Deferred tax liabilities (13) 446 1,617 Income tax receivables (15) 2,688 1,160 Provisions (20) 130 Available-for-sale financial assets (16) 16,793 15,993 Other non-current liabilities (21) 8,497 8,442 Cash and bank accounts (17) 16,480 12,205 Total non-current liabilities 9,073 10,059 Total current assets 72,204 66,450 TOTAL ASSETS 127,345 125,673 CURRENT LIABILITIES (21) Trade and other payables 23,289 25,484 Income tax liabilities 627 739 Other current liabilities 29,252 29,833 Total current liabilities 53,167 56,057 TOTAL SHAREHOLDERS’ EQUITY AND LIABILITIES 127,345 125,673
  • 16.
    F-Secure 2012 03 14 Statement of cash flows Dec 31, 2012 Consolidated, Consolidated, Consolidated, Consolidated, EUR 1,000 Note IFRS 2012 IFRS 2011 EUR 1,000 Note IFRS 2012 IFRS 2011 Cash flow from operations Cash flow from investments Result for the financial year 14,061 16,370 Investments in intangible and tangible assets –11,120 –16,686 Adjustments (24) 19,867 16,491 Proceeds from sale of intangible and tangible Cash flow from operations before change in assets 1 working capital 33,927 32,861 Proceeds from sale of other investments 1 5 Change in net working capital Cash flow from investments –11,120 –16,680 Current receivables, increase (–), decrease (+) 658 –7,586 Cash flow from financing activities Inventories, increase (–), decrease (+) 115 43 Increase in share capital 1,864 Non-interest bearing debt, increase (+), decrease (–) –399 2,389 Treasury shares –1,509 Provisions, increase (+), decrease (–) 130 –1 Dividends paid –9,304 –9,254 Decrease in short term liabilities –200 Cash flow from operations before financial items Cash flow from financing activities –9,304 –9,099 and taxes 34,432 27,707 Change in cash 5,176 –4,981 Interest expenses paid –7 –8 Interest income received 15 42 Cash and bank at the beginning of the period 28,051 32,831 Other financial income and expenses –217 –69 Income taxes paid –8,623 –6,874 Translation difference –205 81 Cash flow from operations 25,599 20,798 Change in net fair value of current available-for-sale assets 105 120 Cash and bank at period end 33,127 28,051
  • 17.
    F-Secure 2012 03 15 Statement of changes in equity Dec 31, 2012 Attributable to the equity holders of the parent Share premium Treasury Available Unrestricted Retained EUR 1,000 Share capital fund shares for sale Transl. diff. equity reserve earnings Total equity Equity Dec 31, 2010 1,551 169 –7,493 27 –148 3,186 54,141 51,432 Available-for-sale financial assets, net 89 89 Translation difference –21 –21 Result of the financial year 16,370 16,370 Total comprehensive income for the year 89 –21 16,370 16,438 Dividends –9,254 –9,254 Acquisition of treasury shares –1,509 –1,509 Exercise of options 1,864 1,864 Cost of share based payments 586 586 Equity Dec 31, 2011 1,551 169 –9,002 116 –169 5,050 61,843 59,557 Available-for-sale financial assets, net 80 80 Translation difference 184 184 Result of the financial year 14,061 14,061 Total comprehensive income for the year 80 184 14,061 14,324 Dividends –9,304 –9,304 Cost of share based payments 583 –55 528 Equity Dec 31, 2012 1,551 169 –8,419 195 15 5,050 66,545 65,105
  • 18.
    F-Secure 2012 03 16 Notes to the financial statements Group information Revised IFRS 1 First Time Adoption of IFRS regarding a the discount rate.The key assumption used to determine F-Secure produces software protection and Internet security severe Hyperinflation and Removal of Fixed Dates for First-time the recoverable amount for goodwill, including sensitivity services for consumers and businesses against computer Adopters: The adoption of the standard had no affect on the analysis, are further explained in note 12; viruses and other threats coming through the Internet or Group’s Financial Statement. ●● deferred tax assets: the Group has assessed how much mobile networks, as well as online backup services preventing Amendment to IAS 12 Deferred tax: Recovery of Underlying unused tax losses can be utilized in the future and has loss of valuable content and enabling sharing of important files. Assets: The amendment relates to the booking of deferred tax recognized these tax losses as deferred tax assets. Further The parent company of the Group is F-Secure Corporation assets investments in real estates. The adoption of the standard details are disclosed in note 13; incorporated in Finland and domiciled in Helsinki. Company’s had no affect on the Group’s Financial Statement. registrant address is Tammasaarenkatu 7, 00180 Helsinki. A ●● development expenditures carried forward: initial capi- copy of consolidated financial statement can be received on Management judgment on significant accounting talization of cost is based on management’s judgment on the Internet address www.f-secure.com or from the parent principals and use of estimates and assumptions technological and economical feasibility. The Group has company’s registrant address. made assumptions regarding the expected future cash The preparation of the consolidated financial statements In their meeting on 14 February 2013 the Board of Directors generation of the projects. Further details are disclosed in requires the use of estimates and assumptions as well as use of F-Secure Corporation has agreed to permit the publication note 10. of judgment when applying accounting principles that affect of the consolidated financial statements of F-Secure Corpora- the reported amount of assets and liabilities, and the reported ●● used arguments when recognizing share-based payment tion for the year 2012. According to the Finnish Companies amounts of revenues and expenses during reporting periods. It transactions: the cost of share-based payment transactions Act, the Annual General Meeting can confirm or reject the is possible that actual results may differ from these estimates. are based on to the fair value at the date at which they were consolidated financial statement after publication. The General The estimates are based on management’s best knowledge granted. The cost of cash-settled transactions is measured Annual Meeting can also decide to change the financial at the reporting date. Estimates and assumptions are based by reference to the fair value at the date of balance sheet. statement. upon past experience, as well as information available relating The assumptions and models used for estimating fair value to the Group’s expected development of the economic for share-based payment transactions are disclosed in ACCOUNTING PRINCIPLES environment. Possible changes in estimates and assumptions note 19. Basis for presentation are recognized in the period when they occur. The key judgments and assumptions concerning the future Principles of consolidation The consolidated financial statements of F-Secure Corporation and other key sources of estimation uncertainty at the reporting of 2011 have been prepared in accordance with International Subsidiaries in which F-Secure Corporation’s holding exceeds date, that have a significant risk a material adjustment are Financial Reporting Standards (IFRS) and IAS- and IFRS- stan- 50 percent are consolidated in the financial statements. following: dards as well as SIC- and IFRIC- interpretations valid 31st of Subsidiaries are consolidated from the date on which control December 2011 has been followed as adopted by the EU. The ●● revenue recognition: service based project deliveries are is transferred to the Group and cease to be consolidated from disclosures also conform to Finnish Accounting legislation. recognized with the percentage of completion method, the date on which control is transferred out of the Group. The The Group has adopted the following new or amended Stan- when the outcome is reliably estimated. Company’s holding in the associated companies is also consoli- dards and Interpretations during the year. dated. The Group’s investment in its associate is accounted for ●● assessment of assets: at each reporting date, the Group Amendments to IFRS 7 Financial Instruments: Disclosures– under the equity method of accounting. The income statement assesses whether there is any indication that an asset may Transfers of Financial Assets: The amendments improve the reflects the share of the results of operations of the associate. be impaired. transparency of presentation of the business transactions Equity accounting is discontinued when the carrying amount of regarding the transfers of the financing instruments. The ●● impairment of assets: the recoverable amount is deter- the investment in an associated company reaches zero, unless adoption of the standard had no affect on the Group’s Financial mined based on value in use calculations. The key variables the Group has incurred or guaranteed obligations in respect Statement. used in the calculations are profitability, growth rate and of the associated company. The Group’s share of profit or loss
  • 19.
    F-Secure 2012 03 17 of an associate is shown as a separate line after the operating undertaken at the date of acquisition plus costs directly straight-line basis over the estimated useful life of an asset. The result. attributable to the acquisition. The excess cost of acquisition estimated useful lives of tangible assets are as follows: All intra-group transactions and balances, including unreal- over the fair value of the net assets of the subsidiary acquired Machinery and equipment 3–8 years ized profits arising from intra-group transactions, have been is recorded as goodwill. Goodwill represents the excess of Other tangible assets 5–10 years eliminated on consolidation. Where necessary, the accounting purchase cost over the fair value of separately identifiable Ordinary repairs and maintenance costs are charged to the policies of subsidiaries have been adjusted to ensure consis- assets less liabilities of acquired companies. Following initial income statement during the financial period in which they tency with the policies adopted by the Group. recognition, goodwill is measured at cost less any accumulated are incurred. The cost of major renovations is included in the impairment losses. Goodwill is reviewed for impairment, annu- assets’ carrying amount when it is probable that the Group Segment reporting ally or more frequently if events or changes in circumstances will derive future economic benefits in excess of the originally The Group has one segment; data security. The segment is indicate that the carrying value may be impaired. assessed standard or performance of the existing asset. Any reported in a manner consistent with the internal reporting gain or loss arising on derecognition of the asset (calculated provided with the chief operating decision maker. The chief Research and development costs as the difference between the net disposal proceeds and operating decision maker, who is responsible for the allocating Research costs are expensed as incurred. Development the carrying amount of the asset) is included in the income resources and assessing performance, has been identified as expenditures incurred on individual projects of totally new statement in the year the asset is derecognized. Gains or losses the Executive Team that makes strategic decisions. products or product versions with significant new features are on de-recognition are shown in other operating income or carried forward when they are technically feasible and their expenses. Foreign currency translation future recoverability can reasonably be regarded as assured. The presentation currency of F-Secure Group is the euro, which Depreciation is recorded on a straight-line basis over the Government grants is the measurement currency of the parent. For purposes estimated useful life of an asset. The estimated useful life of Government grants are recognized at their fair value where of inclusion in the consolidated financial statements, the these assets is 3 years. there is reasonable assurance that the grant will be received balance sheet of each foreign entity is translated into euros at and all attaching conditions will be complied with. When the the exchange rates prevailing at the balance sheet date. The Other intangible assets grant relates to an expense item, it is recognized as income income statement of each foreign entity is translated at the Intangible assets recognized separately from goodwill in over the period necessary to match the grant on a systematic average exchange rates for the financial year. The resulting net acquisitions consist of technology-based intangible assets and basis to the costs that it is intended to compensate. These translation difference is recorded in the shareholders’ equity customer-based intangible assets. The fair value was measured grants are recognized as other operating income in the and the change in the other comprehensive income. by using Multi-Period Excess Earnings model. Depreciation is income statement. Government grants related to an asset are The Consolidated Statement of Cash Flows has been recorded on a straight-line basis over the estimated useful life deducted from the acquisition cost of the asset and recognized prepared by translating each subsidiary’s individual cash flow of an asset. The estimated useful life of these assets is 8 years. as income by reducing the depreciation charge of the asset statements at the average exchange rates for the financial Other intangible assets include intangible rights and they relate to. year. software licenses. Assets with finite useful life are recorded at Foreign currencies are translated into the local currency historical cost less accumulated depreciation. Depreciation Inventories using fixed monthly exchange rates. At the balance sheet of intangible rights is recorded on a progressive basis over Inventories are valued at the lower of cost and net realizable date, assets and liabilities denominated in foreign currencies the estimated useful life of an asset. Depreciation of software value with cost being determined by first-in first-out method. are translated at the rates of exchange prevailing at that date. licenses is recorded on straight-line basis over the estimated Net realizable value is the estimated selling price in the Exchange rate gains and losses of financial transactions are useful life of an asset. The estimated useful lives of other ordinary course of business, less estimated costs of completion recognized in the income statement under financial items. intangible assets are as follows: and the estimated costs necessary to make the sale. Intangible rights 5 years INTANGIBLE ASSETS Other intangible assets 5–10 years Leases Leases where the lessor retains substantially all the risks and Goodwill Tangible assets benefits of ownership of the asset are classified as operating Mutual ownership of shares has been accounted using the Other tangible assets include renovation costs of rented leases. The Group has only operating leases. Operating lease acquisition method. The cost of an acquisition is measured at office space. Tangible assets are recorded at historical cost payments are recognized as an expense in the income state- the fair value of the assets given up, shares issued or liabilities less accumulated depreciation. Depreciation is recorded on a ment on a straight-line basis over the lease term.
  • 20.
    F-Secure 2012 03 18 Impairment of assets together with a corresponding entry in equity and liability, over tax basis of assets and liabilities, use the enacted tax rates in At each reporting date, the Group assesses whether there the period in which the performance conditions are fulfilled, effect in the years in which the differences are expected to is any indication that an asset may be impaired. Where an ending on the date on which the relevant employees become reverse. Deferred tax assets are recognized to the extent that it indicator of impairment exists, the Group makes a formal fully entitled to the award (vesting date). If the holder of the is probable that future taxable profit will be available. estimate of recoverable amount. Where the carrying amount of warrant leaves company before vesting the warrant is forfeited. an asset exceeds its recoverable amount the asset is considered The cumulative expense recognized for transactions at each Revenue recognition impaired and written down to its recoverable amount. Recover- reporting date until the vesting date reflects the extent to Revenue is primarily derived from monthly software as a service able amount is the higher of an asset’s or cash-generating unit’s which the vesting period has expired and the number of awards sale, software license agreement sales and operator’s system fair value less costs to sell and its value in use and is determined that, in the opinion of the directors of the Group at that date, integration and maintenance sales. License agreements consist for an individual asset, unless the asset does not generate cash based on the best available estimate of the number of equity of initial license agreements and periodic maintenance agree- inflows that are largely independent of those from other assets instruments that will ultimately vest. ments covering product updates and customer support. The or groups of assets. A previously recognized impairment loss is The share-based incentive program has been established revenue recognition policy of F-Secure Group recognizes the reversed only if there has been a change in the estimates used as part of the key employee incentive and retention system service revenue at the time of delivery, the license agreement’s to determine the asset’s recoverable amount since the last inside F‑Secure Group. Reward will be settled in two phases so license fee revenues as the product is delivered, the license impairment loss was recognized. The increased amount cannot that one part is settled as equity-settled payment and one part agreement’s maintenance revenues are recognized over the exceed the carrying amount that would have been determined, as cash-settled payment. Cost of equity-settled transactions maintenance period, and service based project deliveries net of depreciation, had no impairment loss been recognized is measured by reference to the fair value by using market are recognized with the percentage of completion method, for the asset in prior years. Impairment losses relating to price of F-Secure Corporation share at the date on which they when the outcome can be reliably estimated. The degree of Goodwill cannot be reversed in future periods. are granted and cost of cash-settled by using market price completion is determined by relation of project costs incurred of F-Secure Corporation on the date of balance sheet. The for work performed to date bear the estimated total project Pensions cost is recognized over the period in which the performance costs. If total project costs will exceed total project revenue, All of F-Secure Group’s pension arrangements are in accor- conditions are fulfilled, ending on the date on which the the expected loss is recognized as an expense immediately. dance with local statutory arrangements and defined contribu- relevant employees become fully entitled to the reward (end Indirect taxes, discounts granted and exchange rate differences tion plans. Contributions to defined contribution plans are of lock-up period). The cost of equity-settle corresponding are excluded from net sales. recognized in the income statement in the period to which the entry is recognized in equity and cost of cash-settle in liabilities. contributions relate. The Group recognizes disability commit- If relevant employee leaves company before fully entitled to Other operating income ment of Finnish TYEL pension plan when disability appears. the reward, the reward is forfeited. The cumulative expense Other operating income includes profits from the sales of fixed recognized for share-based incentive program transactions at assets, rental revenue, and government grants received for Share-based payment transactions each reporting date is based on the best available estimate of research and development projects. In the Company’s industry it is common practice internation- the number of equity instruments that will ultimately fulfill. ally that incentives are provided to employees in the form of Presentation of expenses equity-settled share-based instruments. Company has three Provisions Classification of the functionally presented expenses has kinds of incentive programs; warrant-based program, synthetic Provisions are recognized when the Group has a present been made as follows: various types of expenses in different warrant-based program and a share-based program. obligation (legal or constructive) as a result of a past event, it geographical locations have been allocated to the various The Company’s warrant programs cover key personnel. The is probable that an outflow of resources embodying economic functions by allocating to directly allocable expenses to the warrant program reward is settled as equity-settled payment benefits will be required to settle the obligation and a reliable respective function, and other operating expenses have been and synthetic warrant-based program as cash-settled payment. estimate can be made of the amount of the obligation. allocated to functions on the basis of average headcount in The cost of equity-settled transactions with employees is each location. measured by reference to the fair value at the date on which Income taxes they are granted. The cost of cash-settled transactions with Direct current taxes are calculated on the results of all Group Operating results employees is measured by reference to the fair value at the companies in accordance with the local tax and accounting IAS 1 Presentation of Financial Statements standard does date of balance sheet. The fair value is determined by using rules in each country. Deferred taxes, resulting from temporary not define the concept of operating result. The Group has the Binomial model. The cost of transactions is recognized, differences between the financial statement and the income defined it as follows: operating result is the net amount, which
  • 21.
    F-Secure 2012 03 19 consists of the net sales and other operating income less When financial assets recognized as available-for-sale is sold, initial adoption. The amended standard becomes effective for cost of purchase which is adjusted for changes in inventories, the accumulated fair value changes are released from equity the financial years beginning on or after 1 January 2013. The and reduced employee benefit costs, depreciation, possible and recognized in the income statement. standard is adopted by the EU. impairment losses and other operating expenses. Cash and cash equivalents in the Consolidated Statement of IFRS 9 Financial Instruments: The Group expects that Financial position comprise cash at bank and in hand and other adoption of the revised standard will have an impact on the Non-recurring items highly liquid short-term investments. disclosures of Group’s financial statements in the period of One-off items include mainly income and expenses related to For the purpose of the Consolidated Statement of Cash initial application. Amended standard becomes effective restructurings, non-current impairment of assets and other Flows, cash and cash equivalents consist of cash and cash for financial years beginning on or after 1 January 2015. The non-recurring items which are not based on the Group’s equivalents as defined above. standard is not adopted by the EU. normal activities and which distort the comparability of the IFRS 10 Consolidated Financial Statements: The Group groups underlying profitability. Derivative financial instruments and hedging expects that the adoption of the revised standard will have The Group uses derivative financial instruments such as forward an impact on the Group’s financial statements in the period Treasury shares currency contracts to hedge its risks associated with foreign of initial adoption. The amended standard becomes effective Parent company has acquired treasury shares. The cost of currency fluctuations. Such derivative financial instruments are for financial years beginning on or after 1 January 2014. The acquisition is recognized as a deduction in the shareholders’ initially recognized at fair value on the date on which a deriva- standard is adopted by the EU. equity. tive contract is entered into and are subsequently recognized IFRS 11 Joint Arrangements: The Group expects that the at fair value. Any gains and losses arising from changes in fair revised standard will not have an impact on the Group’s finan- Financial assets value on derivatives that do not qualify for hedge accounting cial statements in the period of initial application. The amended According to IAS 39 standard, financial assets have been are taken directly to net profit or loss for the year. The fair standard becomes effective for financial years beginning on or classified into financial assets at fair value through profit or value of forward currency contracts is calculated by reference after 1 January 2014. The standard is adopted by the EU. loss, held-to-maturity, loans and receivables originated by the to current forward exchange rates for contracts with similar IFRS 12 Disclosures of Interests of Other Entities: The Group enterprise and available-for-sale financial assets. The classifica- maturity profiles. expects that the revised standard will have an impact on the tion is dependent on the purpose for which the assets were Group’s financial statements in the period of initial application. acquired. Purchases and sales of financial assets are recognized Adoption of new and revised standards The amended standard becomes effective for financial years on the trade date i.e. the date that the Group commits to The Group has not applied the following new or revised beginning on or after 1 January 2014. The standard is adopted purchase the asset. The cost of purchase includes transaction Standards and Interpretations that have been issued, but are by the EU. costs. Financial assets are currently classified as loans and not yet effective. IFRS 13 Fair Value Measurement: The Group expects that receivables and available-for-sale financial asset. Amendment to IAS 1 Presentation of Items of Other the revised standard will have impact on the Group’s financial Loans and receivables originated by the enterprise are Comprehensive Income: The Group expects that the revised statements in the period of initial application. The amended measured at amortized cost. Trade receivables are carried standard will have impact on the Group’s financial statements standard becomes effective for financial years beginning on or at the original invoice amount to customers less an estimate in the period of initial application. Amended standard becomes after 1 January 2013. The standard is adopted by the EU. made for doubtful receivables. Outstanding receivables are effective for financial years beginning on or after 1 July 2012. IAS 27 Separate Financial Statements: The Group expects reviewed periodically and bad debts are written off when The standard is adopted by the EU. that the adoption of the revised standard will have no impact identified. Amendment to IFRS 7 Disclosures-Offsetting Financial on the Group’s financial statements in the period of initial Available-for-sale financial assets consist of interest-bearing Assets Financial Liabilities: The Group expects that the adoption adoption. The amended standard becomes effective for debt securities and shares in mutual funds invested in similar of the revised standard might have an impact on the Group’s financial years beginning on or after 1 January 2014. The instruments. For assets that are actively traded in organized financial statements in the period of initial adoption. The standard is adopted by the EU. financial markets, fair value is determined by reference to Stock amended standard becomes effective for the financial years IAS 28 Investments in Associates and Joint Ventures: The Exchange quoted market bid prices at the close of business on beginning on of after 1 January 2013. The standard is adopted Group expects that the revised standard will have an impact on the balance sheet date. Assets, the fair value of which cannot by the EU. the Group’s financial statements in the period of initial applica- be measured reliably, are recognized at cost less impairment. Amendment to IAS 19 Employee Benefits: The Group tion. The amended standard becomes effective for financial The fair value changes of available-for-sale financial assets are expects that the adoption of the revised standard will have no years beginning on or after 1 January 2014. The standard is recognized in shareholders’ equity under fair value reserve. impact on the Group’s financial statements in the period of adopted by the EU.
  • 22.
    F-Secure 2012 03 20 Amendment IAS 32 Financing instruments: Presentation: 1. Segment information The amendment will have no significant effect on the Group’s financial statements. The amended standard becomes effective The Group has one business segment; data and content security. The chief operating decision for financial years beginning on or after 1 January 2014. The maker i.e. the leadership team gets financial information on a monthly basis of the revenue of standard is adopted by the EU. the sales channels. The revenues of different geographical areas are presented by the location of Improvements to IFRSs 2009–2011, May 2012: The adoption the customers and the long-term assets by the location of the assets. of the improvements will have no significant effect on the Group’s financial statements in the period of initial applica- Sales channels tion. The amendments become effective for financial years Operator Other Consolidated Dec 31, 2012 Channel Channels Group beginning on or after 1 January 2013. The improvements have not been adopted by EU. Revenue from external customers 95,236 61,936 157,172 Amendment IFRS 1 Government Loans: The adoption of Operator Other the amendment will have no effect on the Group’s financial Consolidated Dec 31, 2011 Channel Channels Group statements in the period of initial application. The amendments Revenue from external customers 84,806 61,222 146,028 become effective for financial years beginning on or after 1 January 2013. The improvements have not been adopted by EU. IFRIC 20 Stripping Costs in the Production Phase of a Surface Geographical information Finland Mine: The interpretation will not have an effect on the Group’s and Rest financial statements. The interpretation becomes effective Scandi- Rest of North of the Consolidated Dec 31, 2012 navia Europe America world Group for financial years beginning on or after 1 January 2013. The standard is adopted by the EU. Revenue from external customers 47,930 71,225 15,855 22,161 157,172 Segment long-term assets 24,663 23,647 698 1,097 50,106 Finland and Rest Scandi- Rest of North of the Consolidated Dec 31, 2011 navia Europe America world Group Revenue from external customers 47,291 65,111 16,413 17,213 146,028 Segment long-term assets 23,663 28,387 487 1,652 54,189
  • 23.
    F-Secure 2012 03 21 2. Other operating income 4. Personnel expenses EUR 1,000 Consolidated 2012 Consolidated 2011 EUR 1,000 Consolidated 2012 Consolidated 2011 Rental revenue 156 144 Personnel expenses Government grants 1,583 1,187 Wages and salaries –56,079 –48,332 Other 18 86 Pension expenses – defined contribution plan –7,345 –6,681 Total 1,756 1,417 Share-based payments –745 –1,100 Other social expenses –5,509 –4,951 3. Depreciation and reduction in value Total –69,678 –61,064 EUR 1,000 Consolidated 2012 Consolidated 2011 Employee benefits of Management are stated in disclosure 27. Related party transactions Depreciations from non-current assets Share-based payments are stated in disclosure 19. Share-based payment transactions Other capitalized expenditure –2,903 –2,783 Capitalized development –503 Average number of personnel 970 878 –1,121 Intangible assets –3,286 Personnel by function Dec 31 –4,024 Sales and marketing 409 410 Machinery and equipment –2,884 Research and development 389 406 –3,511 Other tangible assets –339 Administration 133 126 –405 –3,222 Total 931 942 Tangible assets –3,916 Total depreciation –7,940 –6,508 5. Non-recurring items Reduction in value from non-current assets EUR 1,000 Consolidated 2012 Consolidated 2011 Other cap. expenditure –5,000 –154 Capitalized development –810 Non-recurring items Total reduction in value –964 Reduction in value –5,000 –964 –5,000 Personnel expenses –2,238 Total depreciation and reduction in value –7,472 Other operating expenses –1,394 –12,940 Total –8,632 –964 Depreciations and reduction in value by function Sales and marketing –2,370 Non-recurring items by function –5,464 Research and development –4,942 Sales and marketing –2,429 –6,996 Administration –160 Research and development –5,538 –964 –480 Total depreciation and reduction in value –7,472 Administration –666 –12,940 Total –8,632 –964
  • 24.
    F-Secure 2012 03 22 6. Audit fees 7. Financial income and expenses EUR 1,000 Consolidated 2012 Consolidated 2011 EUR 1,000 Consolidated 2012 Consolidated 2011 Group auditor Interest income 14 43 Audit fees –124 –131 Interest expense –5 –5 Tax consulting –24 –32 Other financial income 671 81 Other consulting –16 –102 Exchange gains and losses –883 –143 Total –163 –265 Other financial expenses –124 –106 Others Total financial income and expenses –328 –130 Audit fees –21 –18 Tax consulting –62 –11 Financial income and expenses from loans and receivables Total –83 –29 Interest income 14 43 Interest expense 5 –5 Exchange gains and losses –990 –108 Total –971 –70 Financial income and expenses from Available- for-sale financial assets Other financial income 662 74 Total 662 74 Components of other comprehensive income available-for-sale financial assets Gains/(losses) arising during the year 361 172 Reclassification adjustements included in the income statement –256 –52 Total 105 120
  • 25.
    F-Secure 2012 03 23 8. Income taxes 9. Earnings per share EUR 1,000 Consolidated 2012 Consolidated 2011 EUR 1,000 Consolidated 2012 Consolidated 2011 Income taxes of the business activity –6,901 –7,261 Basic earnings per share amounts are calculated by dividing net profit for the year attributable Income taxes from previous years 140 on ordinary equity holders of the parent by the weighted average number of ordinary shares –129 outstanding during the year. Diluted earnings per share amounts are calculated by dividing the Deferred tax 1,194 –3 net profit attributable to ordinary shareholders by the weighted average number of ordinary Total –5,835 –7,125 shares outstanding during the year adjusted for the effects of dilutive options. Components of other comprehensive income Net profit attributable to equity holders from Available-for-sale financial assests –25 –31 continuing operations 14,061 16,370 A reconciliation of income tax expense applicable to accounting profit before income tax at the Weighted average number of statutory income tax rate to income tax expense at the Groups’ effective income tax rate for the ordinary shares (1,000) 155,057 154,433 years ended 31 December 2012 and 2011 is as follows: Adjusted weighted average number of ordinary shares for diluted earning per share 156,774 157,499 Result before taxes 19,896 23,496 Basic earnings per share (EUR/share) 0.09 0.11 Diluted earnings per share (EUR/share) 0.09 0.10 Income taxes at statutory rate of 24.5%/26% –4,874 –6,109 Taxes on foreign subsidiaries’ net income in The weighted average number of shares take into account the effect of change in treasury excess of income taxes at statutory rates –334 –1,727 shares. The change in tax rates 85 Non-deductible expenses –358 –581 Unrecognised tax losses –93 958 Income taxes from previous years –129 140 Other –48 108 Total –5,835 –7,126
  • 26.
    F-Secure 2012 03 24 10. Non-current assets INTANGIBLE ASSETS TANGIBLE ASSETS Other cap. Capitalized Machinery Consolidated expenditure development Goodwill Total equip. Other Tangible Total Acquisition cost Jan 1, 2011 19,044 7,676 19,398 46,118 18,010 3,366 21,376 Translation difference 23 23 37 –6 31 Additions 5,736 7,827 13,563 4,660 302 4,962 Disposals –446 –1,176 –1,622 –115 –115 Acquisition cost Dec 31, 2011 24,357 14,327 19,398 58,082 22,592 3,662 26,254 Translation difference –36 –36 –28 7 –21 Additions 706 4,882 5,588 4,314 357 4,671 Disposals –441 –828 –1,269 –169 –32 –201 Acquisition cost Dec 31, 2012 24,586 18,382 19,398 62,366 26,709 3,994 30,703 Acc. depreciations Jan 1, 2011 –7,583 –3,129 –10,712 –11,883 –2,028 –13,912 Translation difference –22 –22 –29 2 –27 Depreciation of the financial year –2,786 –503 –3,290 –2,850 –396 –3,246 Depreciation of decreases 383 1,177 1,560 3 3 Reduction in value –154 –811 –965 Acc. depreciations Dec 31, 2011 –10,163 –3,267 –13,428 –14,761 –2,422 –17,183 Translation difference 36 36 14 –8 6 Depreciation of the financial year –2,901 –1,121 –4,022 –3,514 –386 –3,900 Depreciation of decreases 292 292 122 18 140 Reduction in value –5,000 –5,000 Acc. depreciations Dec 31, 2012 –17,735 –4,388 –22,122 –18,139 –2,797 –20,936 Book value as at Dec 31, 2011 14,194 11,061 19,398 44,654 7,831 1,240 9,071 Book value as at Dec 31, 2012 6,851 13,994 19,398 40,244 8,569 1,198 9,767
  • 27.
    F-Secure 2012 03 25 11. Investments in associate 13. Deferred tax EUR 1,000 Consolidated 2012 Consolidated 2011 EUR 1,000 Consolidated 2012 Consolidated 2011 Book value as at Jan 1 155 163 Deferred tax assets Share of associated companies’ results –61 –8 Other temporary differences 4,430 4,522 Book value as at Dec 31 94 155 Losses carried forward 605 512 Total 5,035 5,034 Associate’s balance sheet, revenue and profit Assets 449 768 Deferred tax assets, changes in year: Liabilities 179 324 Recognized in profit or loss 1 –451 Revenue 1,386 1,745 Profit –134 81 Deferred tax liability Other temporary differencies 283 185 Associated companies Group (%) Group (%) Fair value adjustments on acquisition 98 1,391 Vineyard International Ltd, Helsinki Finland 34,83 34,83 Change in fair value, available-for-sale 65 40 Total 446 1,617 12. Impairment testing of goodwill Deferred tax liabilities, changes in year: Recognized in profit or loss –1,196 –433 In impairment testing the Group’s assets are tested against the Group’s total generated cash flow. Recognized in other comprehensive income 27 25 The cash flow estimates have been reviewed by the management and cover the next five At December 31, 2012 the Group had 6.4 million euro losses carried forward that are available years. The estimates are based on 2013 planning and after that revenue growth of 7% during indefinitely for offset against future taxable profits in the companies in which the losses arose. 2013–2017, and after that terminal growth of 1%. The CAGR of 7% growth is based on Gartner’s Deferred tax assets have been recognized of 1.5 million losses as at the minimum that amount estimation of revenues for the consumer and enterprise antivirus business globally. (source: may be used to offset future taxable profits. Gartner, 2012). The profitability is based on past years’ profitability level, 2013 planning and longer term communicated profitability target level. The used discount rate is 13.8% before taxes. The 14. Inventories impairment test, based on these assumptions, show no need to impair assets and/or goodwill. EUR 1,000 Consolidated 2012 Consolidated 2011 Sensitivity to changes in assumptions Other inventories 235 350 The main parameters in the calculations are profitability, growth rate and discount rate. If the revenue growth was as calculated and the profitability would decline below 8%, or if the No impairment was recognized from inventories in years 2012 and 2011. profitability level remained the same, and the revenue would decline by 13% compared to previous year (year after year) in 2013–2017, the discounted amount would meet the book value. Test is not practically sensitive to discount rate.
  • 28.
    F-Secure 2012 03 26 15. Receivables EUR 1,000 Consolidated 2012 Consolidated 2011 EUR 1,000 Consolidated 2012 Consolidated 2011 Fair value as at Jan 1 15,993 16,819 Current receivables Additions/deductions, net 539 –981 Trade receivables 30,466 31,542 Change in fair value 260 155 Loan receivables 18 16 Fair value as at Dec 31 16,792 15,993 Other receivables 1,157 1,357 Prepaid expenses and accrued income 4,366 4,135 Shares – unlisted 145 146 Accrued income tax 2,688 1,160 Maturity date less than 3 months 16,647 15,847 Total 38,696 38,210 Fair value as at Dec 31 16,792 15,993 Acquisition value as at Dec 31 16,532 15,837 Trade receivables As at 31 December 2012, trade receivables at nominal value of 1 135 thousand eur (2011: 628 17. Cash and short-term deposits thousand eur) were impaired and fully provided for. EUR 1,000 Consolidated 2012 Consolidated 2011 Book value as at Jan 1 628 508 Charge for the year 700 270 Cash at bank and in hand 12 205 16 480 Utilised –193 –151 Book value as at Dec 31 1,135 628 Available-for-sale financial assets are recognized as liquid short-term investments and are held as part of the Group’s ongoing cash management activities. See note 23. Financial risk management Ageing analysis of trade receivables total not due past due objectives and policies  90  90 days days For the purposes of the Consolidated Statement of Cash Flows, cash and cash equivalents As at Dec 31, 2012 30,466 22,514 7,503 449 comprise the following at December 31: As at Dec 31, 2011 31,542 25,053 5,945 544 Cash at bank and in hand 16,480 12,205 Material items included in prepaid expenses and accrued income Available-for-sale 16,647 15,847 Prepaid expenses 2,479 2,221 Total 33,127 28,051 Prepaid expenses, royalty 1,887 1,914 Total 4,366 4,135 16. Available-for-sale financial assets Available-for-sale financial assets consist of interest-bearing debt securities and shares in funds invested in similar instruments. For assets that are actively traded in organized financial markets, fair value is determined by reference to Stock Exchange quoted market bid prices at the close of business on the balance sheet date. Assets, which fair value cannot be measured reliably, are recognized at cost less impairment. The fair value changes of available-for-sale financial assets are recognized in shareholders’ equity under fair value reserve.
  • 29.
    F-Secure 2012 03 27 18. Shareholders’ Equity Treasury shares The cost of acquistion is recognised as a deduction in the shareholders’ equity. The shares were During the year, ordinary shares were subscibed with warrants attached to F-Secure option acquired through public trading on NASDAQ OMX Helsinki in accordance with its rules and at programs and converted as follows. market price. The parent company has not acquired treasury shares during the period. Issued and fully paid The total number of acquired treasury shares was 3,732,390 at the end of the year 2012. This Share Unrestricted represent 2,4 percent of the Company’s voting power on December 31, 2012. Number of Share premium equity Treasury EUR 1,000 shares capital fund reserve shares Fair value reserve 31 Dec, 2010 154,231,930 1,551 169 3,187 –7,492 The reserve is used to record increments and decrements in the fair value of available-for-sale Exercise of options 1,259,496 1,864 financial assets. Acquisition of FAIR VALUE, AVAILABLE-FOR-SALE treasury shares –700,000 –1,509 EUR 1,000 Before tax Tax After tax Total 31 Dec, 2011 154,791,426 1,551 169 5,051 –9,001 Equity Dec 31, 2010 36 –10 26 26 Exercise of share Available-for-sale, net 137 –35 102 102 based incentive 274,923 0 583 Fair value gains/losses to PL –17 4 –13 –13 31 Dec, 2012 155,066,349 1,551 169 5,051 –8,418 Equity Dec 31, 2011 155 –41 115 115 Available-for-sale, net 244 –59 185 185 The share capital amounted to 1,551,311 euro and the number of shares was 158,798,739 (including own shares 3,732,390) at the end of the year 2012. A share has no nominal value. Accountable par Fair value gains/losses to PL –139 34 –105 –105 value is EUR 0,01. Equity Dec 31, 2012 259 –65 195 195 Share premium fund Proceeds from exercised warrants were recognized under the share capital and share premium 19. Share-based payment transactions fund until March 26, 2008. During the period the Group have had five different incentive plans which cover the key personnel. Unrestricted equity reserve On March 20, 2007, the shareholders’ meeting decided to decrease the share premium fund. The Warrant programs decreased amount of 33,582 thousand euro was transferred to unrestricted equity reserve. On The Company has had warrant programs since April 1998. During the period the Group had three March 26, 2008, the shareholders’ meeting decided that the total amount of the subscription warrant programs. The Company’s warrant programs cover the key personnel. If the holder of prices paid for new shares issued after the date of the meeting, based on stock options under the the warrant leaves the company before vesting, the warrant is forfeited. F-Secure Stock Option Plan 2005, be recorded in companys’ unrestricted equity reserve. The Group has applied IFRS 2 to equity-settled awards granted after November 7, 2002 that had not vested on or before January 1, 2005. Translation differences The translation difference is used to record exchange difference arising from the translation of Option scheme 2005 the financial statements of foreign subsidiaries. On March 23, 2005, the shareholders’ meeting decided to issue a total of 4,500,000 warrants. Each warrant entitled the holder to subscribe for one share. The subscription period of 2005A Dividends proposed and paid expired on November 30, 2009. The subscription period of 2005B expired on November 30, 2010. Proposed for approval at AGM for year 2012 0.06 euro per share. The subscription period of 2005C expired on November 30, 2011. The subscription period of Final dividend for year 2011 0.06 euro per share, paid during the year 2012: 9,303,981 euro 2005D expired on November 30, 2012. The subscription in full would have increased the capital Final dividend for year 2010 0.06 euro per share, paid during the year 2011: 9,253,916 euro stock by 45,000 euro. A total of 2,028,332 shares were subscribed, which represent 1.3 percent of the Company’s share capital and voting power on December 31, 2012. The subscription price of a share in each series is the trade volume weighted average price of the Company’s share
  • 30.
    F-Secure 2012 03 28 quoted on the OMX The Nordic Exchange, Helsinki as follows: 2005A on March 2005; 2005B on The options outstanding by range of exercise prices March 2006; 2005C on March 2007 and 2005D on March 2008, rounded off to the nearest cent. December 31, 2011 The subscription price of the stock options was, as per the dividend recorded date, reduced by Weighted average remaining the amount of dividend per share. However, only such dividends whose distribution has been contractual life in Weighted average agreed upon after of the period for determination of the share subscription price and which Exercise price euro Number of options years exercise price euro have been distributed prior to the share subscription are deducted from the subscription price. 1.43–1.60 Pursuant to the Companies Act, the share subscription price was, nevertheless, always at least 2.09–2.78 410,000 0.92 2.03 the accounting equivalent value per share. 410,000 Expense arising from share-based payment transactions in year 2011 was 27 thousand euro. Plan Issued Category Start End Exercise price 2005A 1. 3. 2008 30. 11. 2009 1.43 Synthetic option-based incentive programs 2005B 1. 3. 2009 30. 11. 2010 2.72 The synthetic option-based incentive programs have been established on February 2009 and 2005C 1. 3. 2010 30. 11. 2011 1.48 November 2012 as part of the key employee incentive and retention system within F-Secure 2005D 1. 3. 2011 30. 11. 2012 1.97 Group. The programs offer for the participants a possibility to receive synthetic options of 2005 4,500,000 F-Secure Corporation as a long-term incentive compensation. No reward can be given to any participating employee, whose employment has terminated before the end of the vesting period. The shares subscribed for on the basis of the warrants entitled the holder to dividend for the The synthetic option-based incentive programs will last five years. Both comprises three financial period in which the subscription took place. Other shareholder rights commenced granting periods and subsequent vesting period of two years after each granting year. The upon the entry into the Trade Register of increase of the share capital. program 2009–2011 ends on December 31, 2013. The programm 2012–2014 ends on December 31, 2016. Within the framework of each program, the aggregate number of options to be given as Options outstanding and weighted average exercise price reward cannot exceed 5 million. The actual compensation is the difference of subscription price and the vesting price, and will be paid to the participatingemployees as a cash-settled payment. Jan 1–Dec 31, 2012 Jan 1–Dec 31, 2011 The subscription price of the synthetic option is the weighted average share price in the Weighted Weighted average average period of October to December prior to the granting year. The vesting price is the weighted Number of exercise price Number of exercise price average share price in period of September to November prior to the payment month. The EUR 1,000 options euro options euro subscription price for the granting period of 2009 is 2.17 euro. The subscirtion price for the granting period of 2010 is 2.27 by Board decision on November 30, 2010. The subscription price Outstanding Jan 1 410,000 2.03 1,725,000 1.67 for the granting period of 2011 is 2.10. The subscirtion price for the granting period of 2012 is 1.85 Forfeited 5,000 1.48 by Board decision on November 22, 2012. Exercised 1,259,496 1.48 Expired 410,000 1.97 50,504 1.48 Outstanding Dec 31 410,000 2.03 Exercisable Dec 31 410,000 2.03 For options exercised in year 2011 the weighted average share price was 2.11 euro. In year 2011 the Group received 1,864 thousand euro for exercised option, which was recorded to unrestricted equity reserve.
  • 31.
    F-Secure 2012 03 29 Options outstanding The share-based incentive program 2011–2013 has been established on March 2011. The Jan 1–Dec 31, Jan 01–Dec 31, program will last five years. It comprises three earning and lock-up periods. The program ends 2012 2011 on December 31, 2015. The rewards will be settled in two phases so that one part is settled as Outstanding Jan 01 1,820,000 Outstanding Jan 1 1,535,000 equity-settled payment and one part as cash-settled payment. The participants in the share- Granted 950,000 Granted 910,000 based incentive program are recommended not to sell more than 50% of the received shares Forfeited 15,000 Forfeited 55,000 and to cumulate the shares received from the share program equals the annual gross base salary Expired 910,000 Expired 570,000 of the employee. On the basis of the program maximum total of 2,500,000 shares and a cash payment corresponding the registration date value of the shares shall be given as reward. Outstanding Dec 31 1,845,000 Outstanding Dec 31 1,820,000 The participating employee shall be entitled to the shareholder rights of to the reward shares Expense arising from share-based payment transactions during the period was –30 thousand from the moment the shares have been entered into the participating employee’s book-entry euro (–10 thousand euro in year 2011). The carrying amount of liability at December 31, 2012 was account. 18 thousand euro. There were no settlements for granting periods 2009–2010. Expense arising from the share-based payment transactions during the period was 775 thousand euro (1,062 thousand euro in year 2011). During the period F-Secure has assigned a The fair value of options granted during the period was determined by using the Binomial model. total of 274,923 shares and cash payment payment corresponding the registration date value of the share to the participants as a reward for the 2008 earning period. The costs of the equity- Used arguments: Synthetic option program settled transactions are measured by reference to the fair value of the F-Secure Corporation share at the date on which they are granted. The costs of cash-settled transactions are measured 2012 2011 by reference to the fair value of the F-Secure Corporation share on the date of balance sheet. Weighted average share price euro 1.51 2.02 Weighted average exercise price euro – – Expected volatility 23.72% 25.02% 20. Provisions Option life in years 2.0 2.0 EUR 1,000 Consolidated 2012 Consolidated 2011 Risk-free interest rate 0.35% 1.32% Expected dividends – – A provision is recognized for the vacant premises. The provision is expected be realized during 2013. Expected volatility reflects the assumption that the historical volatility is indicative of future trends, which may also not necessarily be the actual outcome. Based on previous years, the Book value as at Jan 1 company has estimated that 2–3% of granted options will be forfeited. Arising during the year 130 Book value as at Dec 31 130 Share-based incentive programs Other 130 During the period the Group had two share-based incentive programs. The share-based incentive program has been established as part of the key employee incentive and retention system within F-Secure Group. The programs will offer for the participants a possibility to receive shares of F-Secure Corporation as an incentive reward if the Company’s financial targets set for the earning period have been achieved. No reward can be given to any participating employee, whose employment has terminated before the end of the lock-up period. The share-based incentive program 2008–2010 has been established on May 2008. The program will last six years. It comprises three earning and lock-up periods. The participating employee may not sell or transfer the shares received before the end of the lock-up period on each earnings period. The program ends on December 31, 2013. The rewards will be settled in two phases so that one part is settled as equity-settled payment and one part as cash-settled payment. Within the framework of the program, the aggregate number of shares to be given as reward cannot exceed 5 million shares.
  • 32.
    F-Secure 2012 03 30 21. Liabilities Level 3: techinques which use inputs which have a significant effect on the recorded fair value that are not based on observable market data EUR 1,000 Consolidated 2012 Consolidated 2011 Assets measured at fair value Total Level 1 Level 2 Level 3 Non-current liabilities Available-for-sale financial assets Dec 31, 2012 16,792 16,647 – 145 Deferred revenues 8,497 8,442 Available-for-sale financial assets Dec 31, 2011 15,993 15,847 – 146 Total 8,497 8,442 During the reporting period ending 31 December 2012, there were no transfers between levels. Current liabilities Deferred revenues 29,252 29,833 Trade payables 4,371 7,674 23. Financial risk management objectives and policies Other liabilities 2,370 1,457 General Accrued expenses 16,548 16,353 The goal of risk management is to identify risks that may hinder the group from achieving its Income tax liabilities 627 739 business objectives. The responsibility for the company’s risk management lies with CEO, the Total 53,167 56,057 management and finally with the Board of Directors. The risks related to the Group’s financial instruments are mainly related to credit risks and foreign currency fluctuations. The Group’s Material amounts shown under accruals and available-for-sale assets are also exposed to interest rate fluctuations. deferred income Accrued personnel expenses 12,230 11,839 Credit risk Deferred royalty 1,018 999 The Group trades only with recognized, creditworthy third parties. Receivable balances are Accrued expenses 3,300 3,515 monitored and collected on an ongoing basis. The maximum exposure to credit risk at the Total 16,548 16,353 reporting date is the carrying value of financial assets. There are no significant concentrations of credit risk within the Group. See notes 15. Receivables and 22. Financial assets and liabilities 22. Financial assets and liabilities Foreign currency risk EUR 1,000 Consolidated 2012 Consolidated 2011 The Group invoices mainly in Euros. However, there are some transactional currency exposures that arise from sales or purchasing in other currencies. The other main measurement currencies Loans and other receivables 18 324 are USD, JPY, SEK and GBP. In order to minimize the impact of the fluctuation of the exchange Trade receivables 30,466 31,542 rates, the goal is to use forward currency contracts to eliminate the currency exposure of the Available-for-sale financial assets 16,792 15,993 estimated cash flow of these currencies for a period of six months. Cash and bank accounts 16,480 12,205 Trade payables –4,371 –7,674 Derivatives Total 59,386 52,390 Currency instruments – Currency forward contract EUR 1,000 Consolidated 2012 Consolidated 2011 The carrying amounts of the Group’s financial instruments are equivalent to fair values. Nominal value 3,278 3,008 Fair value 61 –95 Fair value hierarchy The Group uses the following hierarchy for determining and disclosing the fair value of financial intruments by valuation technique Level 1: quouted prices in active markets for indentical assets or liabilities Level 2: other techniques for which all inputs which have a significant effect on the recorded fair value are observable, either directly or indirectly
  • 33.
    F-Secure 2012 03 31 F-Secure Corporation has hedged receivables denominated in USD, JPY, SEK and GBP with a Capital management forward rate contract. The forward rate contracts expires on January 24 and April 25, 2013. The The objective of the Group’s capital management is to maintain an efficient capital structure company does not have other derivatives. that ensures the functioning of business operations and promotes the increase of shareholder F-Secure Corporation does not hedge investements made in its subsidiaries because the value. Reviewing the capital structure of the Group is part of the process for monitoring financial impact of changes of exchange rates would not be relevant in the Group’s balance sheet. performance. The objective of the Group is to improve its current capital structure. AGM 2007 made a decision to decrease the share premium to distributable equity. This Sales in different currencies % % enabled the Group to employ various actions to improve the efficiency of the equity; and/or to EUR 63 65 return the equity to shareholders. EGM 2008 made a decision that assets from the distributable equity will be distributed to shareholders EUR 0.23 per share totalling 35,719 thousand euro. SEK, GBP 12 12 According to the dividend policy of F-Secure Corporation, approximately half of its annual USD, JPY 19 18 profit is paid as dividend. Subject to circumstances, the company may deviate from this policy. Other currencies 6 6 100 100 24. Notes to cash flow statement The risk involved in the sales in foreign currency is notabaly diminished by the operational EUR 1,000 Consolidated 2012 Consolidated 2011 expenses in subsidiaries that use the same currency. Adjustments Financial assets and liablilities Deferred income –72 704 in different currencies % % Depreciation and amortization 12,940 6,503 EUR 68 67 Profit / loss on sale of fixed assets 210 1,190 SEK, GBP 9 7 Other adjustments 627 838 USD, JPY 17 20 Financial income and expenses 327 130 Other currencies 7 6 Income taxes 5,835 7,125 100 100 Total 19,867 16,491 The table below demonstrates how sensitive the Group’s profit before taxes is to reasonably possible changes in the USD, JPY, SEK and GBP exchange rate, assuming that all other variables 25. Operating lease commitments are held constant. The analysis is based +/– 10% exchange rate change, on trade receivables and includes forward currency contracts. The Group has entered into commercial leases on office space and on motor vechicles. Motor vechicle leases have an average life of three years and office space between two and five years with renewal terms included in the contracts. USD, JPY +194/–194 +445/–445 GBP, SEK +274/–274 +378/–378 Future minimum rentals payable under non-cancellable operating leases as at December 31 are as follows: Interest rate risk As lessee The Group does not have any interest bearing liabilities. Based on the Group’s conservative EUR 1,000 Consolidated 2012 Consolidated 2011 investment policy, it invests its cash mainly in short term and low risk funds. Investments are Within one year 5,642 5,846 made in creditworthy funds. These available-for-sale investments are exposed to market risk for After one year but not more than five years 12,656 10,121 changes in interest risks. Total 15,763 18,502 The Group’s objective is to maintain a balance between continuity of funding and flexibility through the use of cash and available-for-sale financial assets. See note 16. Rents during the period 5,096 4,596
  • 34.
    F-Secure 2012 03 32 26. Contingent liabilities The managing director’s retirement age and the determination of his pension conform to the standard rules specified by Finland’s Employee Pension Act (TYEL). The period of notice for the EUR 1,000 Consolidated 2012 Consolidated 2011 managing director is six (6) months both ways and managing director is entitled to severance Other liabilities payment equivalent of six (6) months’ salary. Others 106 237 The consolidated financial statements include the financial statements of corporations listed in the following table. 27. Related party disclosures Country of Name incorporation Group (%) The Group’s related parties include parent company, subsidiaries and associate, as well as members of the Board, managing director and members of the Leadership Team. Parent F-Secure Corporation, Helsinki Finland DF-Data Oy, Helsinki Finland 100 Compensation of key management personnel of the Group F-Secure Inc., San Jose United States 100 EUR 1,000 Consolidated 2012 Consolidated 2011 F-Secure (UK) Ltd, London Great-Britain 100 Wages and other short-term employee benefits 2,055 2,734 F-Secure KK, Tokyo Japan 100 Share-based payments 359 589 F-Secure GmbH, München Germany 100 Total 2,414 3,324 F-Secure eStore GmbH, München Germany 100 F-Secure SARL, Maisons-Laffitte France 100 Wages and other short-term employee benefits F-Secure SDC SAS, Bordeaux France 100 EUR 1,000 Consolidated 2012 Consolidated 2011 F-Secure France SARL, Maisons-Laffitte France 100 Managing directors 262 827 F-Secure BVBA, Heverlee-Leuven Belgium 100 Members of the boards of directors 225 225 F-Secure AB, Stockholm Sweden 100 F-Secure Srl, Milano Italy 100 Board of directors 2012 and managing director F-Secure SP z.o.o.,Warsaw Poland 100 Incentive Other com- F-Secure Corporation (M) Sdn Bhd, Kuala Lumpur Malaysia 100 Wages Fees reward penstions F-Secure Pvt Ltd, Hyderabad India 100 Christian Fredrikson, managing director 262 – 105 – F-Secure Pte Ltd, Singapore Singapore 100 Risto Siilasmaa, chairman of the board – 55 – – F-Secure B.V., Utrecht The Netherlands 100 Jussi Arovaara – 30 – – F-Secure Limited, Hong Kong Hong Kong 100 Sari Baldauf – 40 – – F-Secure Pty Limited, Sydney Australia 100 Pertti Ervi – 40 – – F-Secure Iberia SL, Barcelona Spain 100 Juho Malmberg – 30 – – F-Secure do Brasil Tecnologia da Informãcao Ltda Brazil 100 Anu Nissinen – 30 – – F-Secure Chile Limitada, Santiago Chile 100 Total 262 225 105 – F-Secure Colombia SAS, Bogota D.C. Columbia 100 Incentive reward granted to managing director is measured as following; the equity-settled part Associate company information see note 11 to the fair value of the F-Secure Corporation share at the date which it was granted and cash- settled part to the fair value of the share on the date of balance sheet. The cost is recognized over the period in which the performance conditions are fullfilled 22. 11. 2012–31. 12. 2014.
  • 35.
    F-Secure 2012 03 33 28. Shares and shareholders, December 31, 2012 Administrative register Skandinaviska Enskilda Banken 4,409,789 2.78% 2.84% Shares and share ownership distribution, December 31, 2012 Nordea Pankki Suomi Oyj 3,444,031 2.17% 2.22% Number of Percentage of Percentage Svenska Handelsbanken AB 1,340,622 0.84% 0.86% Shares shareholders shareholders Total shares of shares Other registers 280,607 0.18% 0.18% 1–100 3,268 13.58% 213,300 0.13% 101–1,000 15,463 64.24% 5,865,333 3.69% Other shareholders 36,605,697 23.05% 23.61% 1,001–10,000 4,953 20.58% 14,489,458 9.12% Total 155,066,349 100.00% 10,001–50,000 313 1.30% 6,275,196 3.95% 50,001–100,000 30 0.12% 2,111,752 1.33% Own shares F-Secure Corporation 3,732,390 2.35% 100,001– 44 0.18% 129,843,700 81.77% Total 158,798,739 100.00% Total 24,071 100.00% 158,798,739 100.00% Ownership of management Shareholder category, December 31, 2012 Percentage Total shares of shares Corporations 8,552,516 5.39% Board of Directors Shares % shares Financial and insurance institutions 23,458,891 14.77% Risto Siilasmaa 63,099,454 39.74% General government 28,747,156 18.10% Jussi Arovaara 16,818 0.01% Non-profit organizations 1,248,793 0.79% Sari Baldauf 109,264 0.07% Households 96,412,792 60.71% Pertti Ervi 25,264 0.02% Other countries and international organizations 378,591 0.24% Juho Malmberg 36,449 0.02% Total 158,798,739 100.00% Anu Nissinen 16,818 0.01% Total 63,304,067 39.86% Largest shareholders and administrative register Leadership Team Shares % shares Owner Shares % shares % votes Ari Alakiuttu 16,954 0.01% Risto Siilasmaa 63,099,454 39.74% 40.69% Samu Konttinen 16,954 0.01% Varma Mutual Pension Maria Nordgren 8,476 0.01% Insurance Company 13,659,874 8.60% 8.81% Ilmarinen Mutual Pension Pirkka Palomäki 28,918 0.02% Insurance Company 8,839,432 5.57% 5.70% Jari Still 70,359 0.04% Mandatum Life Insurance Company 6,674,081 4.20% 4.30% Taneli Virtanen 31,954 0.02% The State Pension Fund 5,000,000 3.15% 3.22% Total 173,615 0.11% Ari Hyppönen 3,843,332 2.42% 2.48% Ismo Bergroth 3,000,000 1.89% 1.93% Ownership of management Kaleva Mutual Insurance Company 2,036,000 1.28% 1.31% The Board of Directors owned a total of 63,304,067 shares on December 31, 2012. This represents 39.9 percent of the Company’s shares and 40.8 percent of votes. Nordea Nordic Small Cap Fund 1,833,430 1.15% 1.18% Aktia Capital Fund 1,000,000 0.63% 0.64%
  • 36.
    F-Secure 2012 03 34 29. Key ratios IFRS IFRS IFRS IFRS IFRS IFRS IFRS IFRS IFRS IFRS Economic indicators 2012 2011 2010 2009 2008 Key ratios 2012 2011 2010 2009 2008 Net sales (MEUR) 157.2 146.0 130.1 125.1 113.0 Earnings / share (EUR) 0.09 0.11 0.10 0.12 0.13 Net sales growth % 8% 12% 4% 11% 17% Earnings / share diluted 0.09 0.10 0.10 0.12 0.12 Operating result (MEUR) 20.3 23.6 19,8 24.0 24.3 Shareholders’ equity per share 0.41 0.38 0.33 0.31 0.26 % of net sales 12.9% 16.2% 15,2% 19.2% 21.5% Dividend per share * 0.06 0.06 0.06 0.06 0.07 Result before taxes 19.9 23.5 19.9 25.2 26.4 Dividend per earnings (%) 66.7% 54.5% 60.0% 50.0% 53.8% % of net sales 12.7% 16.1% 15.3% 20.1% 23.4% Effective dividends (%) 3.9% 3.0% 3.0% 2.2% 3.7% ROE (%) 22.6% 29.5% 30.3% 32.2% 36.0% P/E ratio 17.1 19.0 23.1 22.8 14.9 ROI (%) 34.9% 44.3% 42.5% 45.0% 51.5% Share price, lowest (EUR) 1.32 1.88 1.97 1.86 1.73 Equity ratio (%) 72.7% 68.1% 69.1% 69.8% 71.3% Share price, highest (EUR) 2.14 2.66 2.93 3.14 3.05 Investments (MEUR) 10.3 18.7 10.4 37.2 3.1 Mean share price (EUR) 1.79 2.26 2.27 2.43 2.39 % of net sales 6.6% 12.8% 8.0% 29.7% 2.7% Share price Dec 31 1.55 2.01 2.00 2.74 1.88 RD costs (MEUR) 49.3 39.3 34.5 28.0 25.5 Market capitalization (MEUR) 246.1 319.2 315.1 431.5 293.4 % of net sales 31.4% 26.9% 26.5% 22.4% 22.6% Trading volume (millions) 23.0 42.6 65.9 55.5 64.5 Capitalized development (MEUR) 4.9 7.8 2.3 1.7 0.5 Trading volume (%) 14.9% 27.6% 42.5% 35.6% 41.5% Gearing % –50.9% –47.1% –63.2% –68.5% –148.5% * Board proposal Wages and salaries (MEUR) 56.1 48.3 45.9 39.7 35.8 Personnel on average 970 878 835 770 652 Personnel on Dec 31 931 942 812 826 718 Turnover and average share price per month Adjusted number of shares IFRS 2012 IFRS 2011 IFRS 2010 IFRS 2009 IFRS 2008 average during the period 155,056,557 154,432,955 154,967,615 155,770,113 155,301,688 10 million EUR 2.5 average during the period, diluted 156,774,495 157,499,090 158,893,701 160,248,717 161,464,443 Dec 31 158,798,739 158,798,739 157,539,243 157,469,243 156,077,161 8 2.0 Dec 31, diluted 159,115,294 160,940,348 160,990,852 161,269,612 161,270,407 6 1.5 4 1.0 2 0.5 0 0.0 01 02 03 04 05 06 07 08 09 10 11 12 l  Turnover EUR l  Average price
  • 37.
    F-Secure 2012 03 35 Calculation of key ratios Shareholders’ equity + minority interest Equity ratio, % � 100 Balance total – received advance payments Result before taxes + financial expenses ROI, % � 100 Balance total – non-interest bearing liabilities (average) Result before taxes – taxes ROE, % � 100 Shareholders’ equity + minority items (average) Interest bearing liabilities – cash and bank accounts, liquid financial assets Gearing, % � 100 Shareholders’ equity + minority items Result before taxes – taxes +/– minority interest Earnings per share, euro Adjusted number of shares (average) Shareholders’ equity Shareholders’ equity per share, euro Adjusted number of shares, Dec 31 Share price closing, Dec 31 P/E ratio Earnings per share Dividend per share Dividend per earnings, % � 100 Earnings per share Dividend per share Effective dividends, % � 100 Share price closing, Dec 31
  • 38.
    F-Secure 2012 03 36 Income statement Financial Statements Jan 1–Dec 31, 2012 F-Secure Corporation EUR 1,000 FAS 2012 FAS 2011 NET SALES (1) 135,906 128,694 Material and service –7,503 –8,565 Gross margin 128,402 120,128 Other operating income (2) 3,182 2,368 Sales and marketing (3, 4) –58,773 –55,466 Research and development (3, 4) –40,687 –31,685 Administration (3, 4) –9,162 –34,266 OPERATING RESULT 22,962 1,080 Financial income and expenses (6) 94 –183 PROFIT (LOSS) BEFORE APPROPRIATIONS AND TAXES 23,055 897 Change in depreciation reserve –411 –729 Income taxes (7) –5,989 –6,390 RESULT FOR THE FINANCIAL YEAR 16,656 –6,222 Sami, Product Manager, Consumer Security
  • 39.
    F-Secure 2012 03 37 Balance sheet Dec 31, 2012 EUR 1,000 FAS 2012 FAS 2011 EUR 1,000 FAS 2012 FAS 2011 ASSETS SHAREHOLDERS’ EQUITY AND LIABILITIES NON-CURRENT ASSETS SHAREHOLDERS’ EQUITY (15, 16) Intangible assets (8) 30,519 30,986 Share capital 1,551 1,551 Tangible assets (8) 4,119 4,173 Share premium 165 165 Investments in associated companies (9) 42 42 Treasury shares –8,419 –9,002 Investments in group companies (9) 25,894 10,244 Fair value reserve 162 101 Total non-current assets 60,574 45,444 Reserve for invested unrestricted equity 5,051 5,051 Retained earnings 30,615 46,157 CURRENT ASSETS Profit for the financial year 16,656 –6,222 Inventories (11) 235 350 Total shareholders’ equity 45,780 37,801 Long-term receivables (12) 5,247 719 Short-term receivables (12) 36,223 34,772 APPROPRIATIONS Short-term investments (13) 15,447 14,674 Depreciation reserve 1,139 729 Cash and bank accounts (14) 9,357 6,598 Total current assets 66,508 57,113 LIABILITIES TOTAL ASSETS 127,083 102,558 Deferred tax liabilities (10) 53 36 Long-term liabilities (18) 6,427 6,641 Short-term liabilities (18) 73,684 57,351 Total liabilities 80,163 64,028 TOTAL SHAREHOLDERS’ EQUITY AND LIABILITIES 127,083 102,558
  • 40.
    F-Secure 2012 03 38 Cash flow statement Dec 31, 2012 EUR 1,000 FAS 2012 FAS 2011 EUR 1,000 FAS 2012 FAS 2011 Cash flow from operations Cash flow from investments Result for the financial year 16,656 –6,222 Investments in intangible and tangible assets –8,290 –26,505 Adjustments 13,816 37,908 Investments in subsidiary shares –15,650 Cash flow from operations before change in Other investments 6 working capital 30,472 31,686 Proceeds from sale of intangible and tangible assets 1 Change in net working capital Dividends received 15 38 Current receivables, increase (–), decrease (+) –4,297 1,173 Inventories, increase (–), decrease (+) 115 43 Cash flow from investments –23,925 –26,460 Non-interest bearing debt, increase (+), decrease (–) 18,198 5,642 Cash flow from financing activities Increase in share capital 1,864 Cash flow from operations before financial items and taxes 44,489 38,545 Treasury shares –1,509 Dividends paid –9,304 –9,254 Interest expenses paid –2 –2 Interest income received 11 94 Cash flow from financing activities –9,304 –8,899 Other financial income and expenses –6 61 Income taxes paid –7,807 –6,610 Change in cash 3,455 –3,270 Cash and bank at the beginning of the period 21,126 24,295 Cash flow from operations 36,684 32,088 Change in net fair value of current available-for-sale assets 77 101 Cash and bank at period end 24,658 21,126
  • 41.
    F-Secure 2012 03 39 Notes to the financial statements Corporate information Machinery and equipment 3–8 years Pensions F-Secure produces services and software protection to Capitalized development costs 3 years Pension arrangement is of local statutory arrangement and individuals and businesses against computer viruses and other Intangible rights 5 years defined contribution plans. Contributions to defined contribu- threats coming through the Internet or mobile networks. Intangible assets 5–10 years tion plans are recognized in income statement in the period to The parent company of the Group is F-Secure Corporation Ordinary repairs and maintenance costs are charged to the which the contributions relate. The Company recognizes the incorporated in Finland and domiciled in Helsinki. Company’s income statement during the financial period in which they disability commitment of TYEL pension plan when disability registrant address is Tammasaarenkatu 7, 00180 Helsinki. Copy are incurred. The cost of major renovations is included in the appears. of consolidated financial statement can be received from assets’ carrying amount when it is probable that the Company Internet address www.f-secure.com or the parent company’s will derive future economic benefits in excess of the originally Share-based payment transactions registrant address. assessed standard or performance of the existing asset. Any In the Company’s industry it is common practice internation- gain or loss arising on derecognition of the asset (calculated ally that incentives are provided to employees in the form of ACCOUNTING PRINCIPLES as the difference between the net disposal proceeds and equity-settled share-based instruments. Company has three The financial statement of F-Secure Corporation has been the carrying amount of the asset) is included in the income kinds of incentive programs; warrant-based program, synthetic prepared in accordance with Finnish Accounting Standards statement in the year the asset is derecognized. warrant-based program and a share-based program. (FAS). The Company’s warrant programs cover key personnel. The Research and development costs synthetic warrant-based program is settled as cash-settled Foreign currency translation Research costs are expensed as incurred. Development payment. The cost of cash-settled transactions with employees Foreign currencies are translated into the local currency using expenditures incurred on individual projects of totally new is measured by reference to the fair value at the date of balance fixed monthly exchange rates. At the balance sheet date, assets products or product versions with significant new features are sheet. The fair value is determined by using the Binomial and liabilities denominated in foreign currencies are translated carried forward when they are technically feasible and their model. The cost of transactions is recognized, together with at the rates of exchange prevailing at that date. Exchange future recoverability can reasonably be regarded as assured. a corresponding entry in liability, over the period in which rate gains and losses of financial transactions are recognized the performance conditions are fulfilled, ending on the date in the income statement under financial items. Forward Inventories on which the relevant employees become fully entitled to rate contracts for hedging purposes are recorded using the Inventories are valued at the lower of cost and net realizable the award (vesting date). If the holder of the warrant leaves exchange rate prevailing at the balance sheet date. value with cost being determined by method first-in first-out company before vesting the warrant is forfeited. The cumula- method. Net realizable value is the estimated selling price tive expense recognized for transactions at each reporting Tangible and intangible assets in the ordinary course of business, less estimated costs of date until the vesting date reflects the extent to which the Intangible assets include intangible rights and software completion and the estimated costs necessary to make the vesting period has expired and the number of awards that, in licenses. Intangible assets recognized on merger consist of sale. the opinion of the directors of the Group at that date, based on technology-based intangible assets. Tangible and intangible the best available estimate of the number of equity instruments assets are recorded at historical cost less accumulated Leases that will ultimately vest. depreciation. Depreciation of intangible rights is recorded on a Leases where the lessor retains substantially all the risks and The share-based incentive program has been established progressive basis over the the estimated useful life of an asset. benefits of ownership of the asset are classified as operating as part of the key employee incentive and retention system Other depreciation is recorded on a straight-line basis over the leases. The Company has only operating leases. Operating inside F‑Secure. Reward will be settled in two phases so that estimated useful life of an asset. The estimated useful lives of lease payments are recognized as an expense in the income one part is settled as equity-settled payment and one part as tangible and intangible assets are as follows: statement on a straight-line basis over the lease term. cash-settled payment. Cost of cash-settled transactions is measured by reference to the fair value by using market price of F‑Secure Corporation share on the date of balance sheet.
  • 42.
    F-Secure 2012 03 40 The cost is recognized over the period in which the perfor- Other operating income mance conditions are fulfilled, ending on the date on which the Other operating income includes profits from the sales of fixed relevant employees become fully entitled to the reward (end of assets, rental revenue, and government grants received for lock-up period). The cost of cash-settle corresponding entry is research and development projects. recognized in liabilities. If relevant employee leaves company before fully entitled to the reward, the reward is forfeited. The Presentation of expenses cumulative expense recognized for share-based incentive Classification of the functionally presented expenses has program transactions at each reporting date is based on the been made as follows: various types of expenses in different best available estimate of the number of equity instruments geographical locations have been allocated to the various that will ultimately fulfill. functions by allocating directly to allocable expenses to the respective function, and other operating expenses have been Income taxes allocated to functions on the basis of average headcount in Direct current taxes are calculated in accordance with the each location. local tax and accounting rules. Deferred taxes, resulting from temporary differences between the financial statement and Treasury shares the income tax basis of assets and liabilities, use the enacted Company has acquired treasury shares. The cost of acquisition tax rates in effect in the years in which the differences are is recognized as a deduction in the shareholders’ equity. expected to reverse. Deferred tax assets are recognized to the extent that it is Financial assets probable that future taxable profit will be available. Short-term investments are measured at fair value. Short-term investments consist of interest-bearing debt securities and Revenue recognition shares in mutual funds invested in similar instruments. For Revenue is primarily derived from monthly software as a service assets that are actively traded in organized financial markets, sale, software license agreement sales and operator’s system fair value is determined by reference to Stock Exchange quoted integration and maintenance sales. License agreements consist market bid prices at the close of business on the balance of initial license agreements and periodic maintenance agree- sheet date. Assets, the fair value of which cannot be measured ments covering product updates and customer support. The reliably, are recognized at cost less impairment. The fair value revenue recognition policy of F-Secure Group recognizes the changes of short-term investments are recognized in share- service revenue at the time of delivery, the license agreement’s holders’ equity under fair value reserve. When financial assets license fee revenues as the product is delivered, the license recognized as available-for-sale are sold, the accumulated fair agreement’s maintenance revenues are recognized over the value changes are released from equity and recognized in the maintenance period, and service based project deliveries income statement. are recognized with the percentage of completion method, Cash and cash equivalents in the balance sheet comprise when the outcome can be reliably estimated. The degree of cash at bank and in hand and other highly liquid short-term completion is determined by relation of project costs incurred investments. for work performed to date bear the estimated total project costs. If total project costs will exceed total project revenue, the expected loss is recognized as an expense immediately. Indirect taxes, discounts granted and exchange rate differences are excluded from net sales.
  • 43.
    F-Secure 2012 03 41 1. Net Sales Depreciations by function EUR 1,000 FAS 2012 FAS 2011 Sales and marketing –2,715 –2,337 Geographical information Research and development –3,497 –2,105 Finland and Scandinavia 45,680 45,227 Administration –122 –160 Rest of Europe 64,435 60,731 Total depreciation –6,334 –4,602 North America 8,287 10,483 Rest of the world 17,504 12,253 Total 135,906 128,694 4. Personnel expenses EUR 1,000 FAS 2012 FAS 2011 Personnel expenses 2. Other operating income Wages and salaries –31,015 –26,968 EUR 1,000 FAS 2012 FAS 2011 Pension expenses –5,612 –4,993 Rental revenue 37 36 Other social expenses –1,804 –1,603 Government grants 1,583 778 Total –38,431 –33,563 Other 1,562 1,554 Total 3,182 2,368 Compensation of key management personnel Wages and other short-term employee benefits –1,659 –2,381 Total –1,659 –2,381 3. Depreciation and reduction in value EUR 1,000 FAS 2012 FAS 2011 Wages and other short-term employee benefits Depreciations from non-current assets Managing director –262 –626 Other capital expenditure –3,314 –2,532 Members of the boards of directors –225 –225 Capitalized development –962 –278 Intangible assets –4,276 –2,810 Wages and other short-term employee benefits of the board of directors and managing director: The managing director’s retirement age and the determination of his pension conform to the Machinery and equipment –2,058 –1,792 standard rules specified by Finland’s Employee Pension Act (TYEL). The period of notice for the Tangible assets –2,058 –1,792 managing director is six (6) months both ways and managing director is entitled to severance payment equivalent of six (6) months’ salary. Total depreciation –6,334 –4,602 EUR 1,000 FAS 2012 FAS 2011 Reduction in value from non-current assets Average number of personnel 498 428 Other capital expenditure –754 –154 Personnel by function Dec 31 Capitalized development –810 Sales and marketing 165 173 Total reduction in value –754 –964 Research and development 290 254 Administration 39 40 Total depreciation and reduction in value –7,088 –5,566 Total 494 467
  • 44.
    F-Secure 2012 03 42 5. Audit fees 7. Income taxes EUR 1,000 FAS 2012 FAS 2011 EUR 1,000 FAS 2012 FAS 2011 Audit fees –99 –97 Income taxes of the business activity –5,891 –6,505 Tax consulting –24 –32 Income taxes from previous years –98 115 Other consulting –15 –102 Total –5,989 –6,390 Total –137 –231 Result before taxes 23,055 897 Income taxes at statutory rate of 24.5%/26% –5,649 –233 Non-deductible expenses –242 –6,272 6. Financial income and expenses Income taxes from previous years –98 115 EUR 1,000 FAS 2012 FAS 2011 Total –5,989 –6,390 Interest income 21 95 Interest expense –68 –93 Other financial income 662 76 Dividends 15 38 Exchange gains and losses –468 –237 Other financial expenses –69 –61 Total 94 –183 8. Non-current assets Intangible assets Tangible assets Other cap. Capitalized expenditure development Total Machinery equip. Other Tangible Total Acquisition cost Jan 1, 2011 11,374 6,366 17,740 13,154 5 13,159 Additions 18,284 7,827 26,111 2,287 2,287 Decreases –154 –1,176 –1,330 –111 –111 Acquisition cost Dec 31, 2011 29,504 13,017 42,521 15,330 5 15,335 Additions 509 4,882 5,391 2,015 2,015 Decreases –828 –828 –36 –36 Acquisition cost Dec 31, 2012 30,013 17,071 47,084 17,309 5 17,314 Acc. depreciations Jan 1, 2011 –6,815 –2,277 –9,092 –9,370 –9,370 Depreciation of the financial year –2,531 –278 –2,809 –1,792 –1,792 Reduction of value –154 –811 –965 Acc. depreciations of decreases 154 1,176 1,330 Acc. depreciations Dec 31, 2011 –9,346 –2,190 –11,536 –11,162 –11,162 Depreciation of the financial year –3,314 –962 –4,276 –2,058 –2,058 Reduction of value –754 –754 Acc. depreciations of decreases 25 25 Acc. depreciations Dec 31, 2012 –13,413 –3,152 –16,566 –13,195 –13,195 Book value as at Dec 31, 2011 20,158 10,827 30,985 4,168 5 4,173 Book value as at Dec 31, 2012 16,599 13,919 30,518 4,114 5 4,119
  • 45.
    F-Secure 2012 03 43 9. Investments 10. Deferred tax Group comp. Associated shares comp. shares Total EUR 1,000 FAS 2012 FAS 2011 Book value as at Jan 1 10,244 42 10,286 Deferred tax liability Additions 15,650 15,650 Tax charged to shareholders’ equity Book value as at Dec 31 25,894 42 25,936 Change in fair value, available-for-sale 53 36 Total 53 36 Country of Share of Name incorporation ownership (%) 11. Inventories Parent F-Secure Corporation, Helsinki Finland EUR 1,000 FAS 2012 FAS 2011 DF-Data Oy, Helsinki Finland 100 Other inventories 235 350 F-Secure Inc., San Jose United States 100 F-Secure (UK) Ltd, London Great-Britain 100 F-Secure KK, Tokyo Japan 100 F-Secure GmbH, München Germany 100 F-Secure eStore GmbH, München Germany 100 F-Secure SARL, Maisons-Laffitte France 98 F-Secure France SARL, Maisons-Laffitte France 100 F-Secure BVBA, Heverlee-Leuven Belgium 100 F-Secure AB, Stockholm Sweden 100 F-Secure Srl, Milano Italy 100 F-Secure SP z.o.o.,Warsaw Poland 100 F-Secure Corporation (M) Sdn Bhd, Kuala Lumpur Malaysia 100 F-Secure Pvt Ltd, Hyderabad India 100 F-Secure Pte Ltd, Singapore Singapore 100 F-Secure B.V., Utrecht The Netherlands 100 F-Secure Limited, Hong Kong Hong Kong 100 F-Secure Pty Limited, Sydney Australia 100 F-Secure Iberia SL, Barcelona Spain 100 F-Secure Chile Limitada, Santiago Chile 99 F-Secure Colombia SAS, Bogota D.C. Colombia 100 Share of Associated companies ownership (%) Vineyard International Ltd, Helsinki Finland 34.8
  • 46.
    F-Secure 2012 03 44 12. Receivables EUR 1,000 FAS 2012 FAS 2011 13. Short-term investments Non-current Short-term investments consist of interest-bearing debt securities and shares in funds invested Receivables from group companies 4,500 in similar instruments. For assets that are actively traded in organized financial markets, fair value Other receivables 747 719 is determined by reference to Stock Exchange quoted market bid prices at the close of business Total 5,247 719 on the balance sheet date. Assets, which fair value cannot be measured reliably, are recognized at cost less impairment. The fair value changes of short-term investments are recognized in Current receivables shareholders’ equity under fair value reserve. Trade receivables 22,207 23,477 Loan receivables 18 16 EUR 1,000 FAS 2012 FAS 2011 Other receivables 39 41 Fair value as at Jan 1 14,674 16,817 Prepaid expenses and accrued income 6,358 4,186 Additions/deductions, net 558 –2,280 Total 28,622 27,720 Change in fair value 215 137 Fair value as at Dec 31 15,447 14,674 Receivables from group companies Trade receivables 7,601 7,047 Shares – unlisted 146 146 Other receivables 5 Maturity date less than 3 months 15,301 14,528 Total 7,601 7,052 Fair value as at Dec 31 15,447 14,674 Book value as at Dec 31 15,232 14,537 Current receivables total 36,223 34,772 Material items included in prepaid 14. Cash and short-term deposits expenses and accrued income Prepaid expenses 2,080 1,698 For the purposes of the cash flow statement, cash and cash equivalents comprise the following Prepaid expenses, royalty 1,887 1,914 as at December 31: Accrued interest 1 Accrued tax 2,391 573 EUR 1,000 FAS 2012 FAS 2011 4,186 Cash at bank and in hand 9,357 6,598 Total 6,358 Available-for-sale 15,301 14,528 Total 24,658 21,126
  • 47.
    F-Secure 2012 03 45 15. Statement of changes in shareholders’ equity Unrestricted Share premium Treasury Fair value equity Retained Parent Company, FAS Share capital fund shares reserve reserve earnings Total equity Equity Dec 31, 2010 1,551 165 –7,493 27 3,187 55,411 52,847 Available-for-sale financial assets, net 75 75 Result of the financial year –6,222 –6,222 Dividend –9,254 –9,254 Acquisition of treasury shares –1,509 –1,509 Exercise of options 1,864 1,864 Equity Dec 31, 2011 1,551 165 –9,002 102 5,051 39,935 37,801 Available-for-sale financial assets, net 61 61 Result of the financial year 16,656 16,656 Dividend –9,304 –9,304 Cost of share based payments 583 –16 566 Equity Dec 31, 2012 1,551 165 –8,419 163 5,051 47,271 45,780 16. Shareholders’ Equity The Company’s share capital amounted to 1,551,311 euro and the number of shares was 158,798,739 at the end of the year 2012. See group disclosure 18. Shareholders’ Equity. Treasury shares See group disclosure 18. Shareholders’ Equity Distributable shareholders’ equity on December 31, 2012 EUR 1,000 Unrestricted equity reserve 5,051 Retained earnings 22,212 Result of the financial year 16,656 Distributable shareholders’ equity on December 31, 2012 43,918 17. Share-based payment transactions See group disclosure 19. Share-based payment transactions
  • 48.
    F-Secure 2012 03 46 18. Liabilities 20. Notes to cash flow statement EUR 1,000 FAS 2012 FAS 2011 EUR 1,000 FAS 2012 FAS 2011 Non-current liabilities Adjustments Deferred revenues 6,427 6,641 Deferred income –406 420 Deferred tax liabilites 53 36 Depreciation and amortization 7,088 4,602 Total 6,479 6,676 Profit / loss on sale of fixed asset 11 24,968 Other adjustments 817 617 Current liabilities Financial income and expenses 317 911 Deferred revenues 23,729 23,942 Income taxes 5,989 6,390 Trade payables 3,501 6,524 Total 13,816 37,908 Other liabilities 1,174 779 Accrued expenses 11,464 11,987 21. Operating lease commitments Total 39,868 43,233 The Group has entered into commercial leases on office space and on motor vehicles. Motor vehicle leases have an average life of three years and office space between two and five years with renewal terms included in the contracts. Liabilities to the group companies Future minimum rentals payable under non-cancellable operating leases as at 31 December are Advance payments 3,797 3,845 as follows: Trade payables 7,825 7,696 As lessee Other liabilities 22,194 2,578 EUR 1,000 FAS 2012 FAS 2011 Total 33,816 14,118 Within one year 3,092 3,373 After one year but not more than five years 6,847 9,401 Total current liabilities 73,684 57,351 Total 12,492 10,221 Material amounts shown under accruals and deferred income 22. Contingent liabilities Accrued personnel expenses 8,619 8,170 EUR 1,000 FAS 2012 FAS 2011 Deferred royalty 1,018 999 Guarantees for other group companies 40 Accrued expenses 1,826 2,818 Total 11,464 11,987 Other liabilities Others 67 238 19. Financial risk management objectives and policies See Group disclosure 23. Financial risk management objectives and policies Derivatives see Group disclosure 23. Financial risk management objectives and policies 23. Shares and shareholders See Group disclosure 28. Shares and shareholders 24. Key ratios See Group disclosure 29. Key ratios
  • 49.
    F-Secure 2012 03 47 Auditor’s report (translation) To the Annual General Meeting reasonable assurance about whether the financial statements Opinion on the company’s financial statements of F-Secure Corporation and the report of the Board of Directors are free from material and the report of the Board of Directors We have audited the accounting records, the financial misstatement, and whether the members of the Board of In our opinion, the financial statements and the report of statements, the report of the Board of Directors, and the Directors of the parent company or the Managing Director the Board of Directors give a true and fair view of both the administration of F-Secure Corporation for the financial are guilty of an act or negligence which may result in liability consolidated and the parent company’s financial performance period 1. 1.–31. 12. 2012. The financial statements comprise in damages towards the company or have violated the Limited and financial position in accordance with the laws and regula- the consolidated statement of financial position, statement Liability Companies Act or the articles of association of the tions governing the preparation of the financial statements and of comprehensive income, statement of changes in equity company. the report of the Board of Directors in Finland. The information and statement of cash flows, and notes to the consolidated An audit involves performing procedures to obtain audit in the report of the Board of Directors is consistent with the financial statements, as well as the parent company’s balance evidence about the amounts and disclosures in the financial information in the financial statements. sheet, income statement, cash flow statement and notes to the statements and the report of the Board of Directors. The financial statements. procedures selected depend on the auditor’s judgment, Helsinki, February 14, 2013 including the assessment of the risks of material misstatement, Responsibility of the Board of Directors whether due to fraud or error. In making those risk assessments, Ernst Young Oy and the Managing Director the auditor considers internal control relevant to the entity’s Authorized Public Accountant Firm The Board of Directors and the Managing Director are respon- preparation of financial statements and report of the Board of sible for the preparation of consolidated financial statements Directors that give a true and fair view in order to design audit Erkka Talvinko that give a true and fair view in accordance with International procedures that are appropriate in the circumstances, but not Authorized Public Accountant Financial Reporting Standards (IFRS) as adopted by the EU, as for the purpose of expressing an opinion on the effectiveness well as for the preparation of financial statements and the of the company’s internal control. An audit also includes evalu- report of the Board of Directors that give a true and fair view in ating the appropriateness of accounting policies used and the accordance with the laws and regulations governing the prepa- reasonableness of accounting estimates made by management, ration of the financial statements and the report of the Board as well as evaluating the overall presentation of the financial of Directors in Finland. The Board of Directors is responsible for statements and the report of the Board of Directors. the appropriate arrangement of the control of the company’s We believe that the audit evidence we have obtained is accounts and finances, and the Managing Director shall see to sufficient and appropriate to provide a basis for our audit it that the accounts of the company are in compliance with the opinion. law and that its financial affairs have been arranged in a reliable manner. Opinion on the consolidated financial statements In our opinion, the consolidated financial statements Auditor’s Responsibility give a true and fair view of the financial position, financial Our responsibility is to express an opinion on the financial performance, and cash flows of the group in accordance with statements, on the consolidated financial statements and on International Financial Reporting Standards (IFRS) as adopted the report of the Board of Directors based on our audit. The by the EU. Auditing Act requires that we comply with the requirements of professional ethics. We conducted our audit in accordance with good auditing practice in Finland. Good auditing practice requires that we plan and perform the audit to obtain
  • 50.
    F-Secure 2012 04 48 Corporate Governance Statement General principles F-Secure Corporation applies principles of corporate governance and follows high ethical standards in all its operations. F-Secure’s corporate governance practices comply with Finnish laws and regulations, F-Secure’s Articles of Association, the rules of the Helsinki stock exchange as well as with Finnish Corporate Governance Code issued by the Securities Market Association of Finland in 2010. The code is publicly available at www.cgfinland.com. The key elements of the Corporate Governance practices of F-Secure Corporation are described briefly below. In addition, in 2012 the most essential tasks and responsibilities of the Board of Directors, Board Committees and the other main governing bodies are described. This statement also includes the description of the main features of internal control and risk management pertaining to the financial reporting process. More information on corporate governance practices of the company is available on F-Secure Corporation’s website. Annual General Meeting of Shareholders (AGM) The highest governing body of the corporation is the General Meeting of Shareholders. The AGM’s tasks are defined in detail by the Finnish Companies Act, Articles of Association of F-Secure Corporation and other regulations. The AGM shall decide on the number of members of the Board of Directors, confirm remunerations to the Board members and auditors, appoint Board members, approve financial statements, determine dividends and select auditor and determine other issues defined by the Articles of Association and the Finnish Companies Act. The AGM shall be held after the end of the financial year within a period determined by the Board of Directors and as defined by the Companies Act. F-Secure Corporation has only one class of shares and thus all shares have equal voting power at the General Meetings of Shareholders. In 2012, the Annual General Meeting was held in Helsinki, HTC Ruoholahti on April, 3. The decisions made by the AGM 2012 are presented in detail in the Board of Directors’ report for 2012. The main tasks of the Board of Directors The objective of the Board of Directors is to direct the company with the aim Veli-Jussi, Director, Security Products of achieving the best possible return on invested capital for shareholders in the long term. The Board of Directors represents all shareholders. The Board
  • 51.
    F-Secure 2012 04 49 of Directors shall always work to the best advantage of the The Board of Directors shall convene at least five times the members are Jussi Arovaara and Juho Malmberg. The company and all of its shareholders. during its term. The Board shall conduct an annual self- Chairman of the Executive Committee is Sari Baldauf and the The Board of Directors is responsible for making sure assessment of its operations. members are Risto Siilasmaa and Anu Nissinen. that supervision of th e company’s accounting and financial The charters of both Committees are available on the management is duly organized. The meetings of the Board Board of Directors in 2012 Company’s web pages under About F-Secure Investors shall regularly discuss reports presented by the CEO of the According to the decision of the Annual General Meeting 2012, Governance. Company on the financial status and operations of the company. the Board has six (6) members. The members of the Board Furthermore, it is the duty of the Board to prepare matters to are Risto Siilasmaa (Chairman), Jussi Arovaara, Sari Baldauf, Audit Committee be handled by the shareholders’ meeting, to decide on the Pertti Ervi, Juho Malmberg and Anu Nissinen. All members The Audit Committee prepares, instructs and evaluates the convening of the shareholders’ meeting and to make sure that were re-elected. Risto Siilasmaa continued as a Chairman of the Corporation’s risk management, internal supervision systems, the decisions made at the shareholders’ meeting are executed. Board. IT strategy and practices, financial reporting, external auditing Any matters that are significant or far-reaching from the The majority of F-Secure Corporation’s Board of Directors, of the accounts and internal control. During 2012, the Audit company’s point of view shall be dealt with by the Board. These Pertti Ervi, Sari Baldauf, Juho Malmberg, Anu Nissinen and Jussi Committee held five meetings and the attendance was close include strategic outlines, approval of budgets and operating Arovaara, have no dependence neither on the company nor to 100%. plans and supervision of how these are put into effect, acquisi- the significant shareholders. The Chairman of the Board, Mr. In 2012, the Audit Committee covered topics widely within tions and corporate structure, any major investments with Siilasmaa, is a major shareholder of the company. the charter focusing on internal and external IT (hosting). regard to the operation of the company, organization of the During 2012, the Board of Directors held 10 meetings and Furthermore, the Committee assessed efficiency of internal supervision of accounting and financial management, internal the attendance was close to 100%. The Board of Directors control systems and risk management process and practices monitoring systems and risk management as well as personnel focused, besides their ongoing duties, especially on the including financial and legal risks. The Committee also policies and reward systems. execution of the Company’s growth strategy,introduction of reviewed the interim reports and all other relevant stock The duties and responsibilities of the Board are more the new CEO, restructuring of the organization, new leadership exchange releases before their publication. thoroughly defined in the Articles of Association of the nominations and product creation capabilities. According to company, the Finnish Companies Act and other applicable laws the strategy, F-Secure’s first priority is to drive growth and Executive Committee and regulations. The Articles of Association and the charter market expansion by continuing to create new innovative The Executive Committee prepares material and provides of the Board, including a more complete list of its main duties offerings to augment traditional security services, especially in instructions on issues related to the composition and compen- and tasks and its committees, are presented in detail on the the content cloud space. The Company has three channels for sation of the Board of Directors and remuneration of the company’s Investor web pages. its products, while Operators are currently the biggest channel. other members of the executive management. The Executive According to the Articles of Association, the Board shall The Company’s strategy is described in more detail in the Board Committee held five meetings in 2012 and the attendance was have a minimum of three and maximum of seven ordinary of Director’s report for 2012. close to 100%. members, whose term ends at the end of the next AGM Other significant tasks and responsibilities of the Board In 2012, the Executive Committee focused especially on following the election of members. The Annual General comprised a general overview of the company’s financials, the re-organization of the Company and new leadership Meeting of Shareholders shall decide the number of Board budget approval, setting the target levels for executive level nominations. Other tasks comprised of e.g. long and short- members and elect the Board members. The Board shall elect and deciding on the incentive program for the Leadership term incentive programs for the top management and other the Chairman of the Board from among its members. The Team and other key employees. key personnel, discussion on employee satisfaction surveys, Board shall also elect a secretary, who may be a non-member and follow-up of improvement actions. The Committee also of the Board. The term of each Board member is one year. The Board Committees prepared proposals for the Board composition and remunera- majority of the Board members shall be independent of the The Board has two committees; Audit Committee and tion for the Annual General Meeting of Shareholders. company. More detailed information about other terms of Executive Committee (nomination and remuneration issues). Board membership can be found in the Articles of Association. The Chairman of the Audit Committee is Pertti Ervi and
  • 52.
    F-Secure 2012 04 50 President and CEO statements. More details on the remuneration and option the activities and financial situation of the company. Actual The President and CEO is responsible for the day-to-day programs are also available in the Remuneration Statement performance against sales and cost targets and comparison management of the company. The CEO’s duties include published on the Company’s investor web pages under period is constantly followed up by operative reporting managing the business according to the instructions issued by Corporate Governance. systems on a daily, weekly or monthly basis. the Board of Directors, presenting the matters to be dealt with CEO and the Leadership Team are presented later as a part The company constantly monitors its cost efficiency and in the Board of Directors’ meeting, implementing the matters of this report. profitability as well as incoming and outgoing payment transac- resolved by the Board of Directors and other issues determined tions. If any inconsistencies appear, the issues are handled in the Companies Act. The Board of Directors shall appoint the Auditors without delay. The company’s controlling function works in CEO and decide upon his/her remuneration and other benefits. The auditor is elected by the Annual General Meeting for one close cooperation with CFO and business units, providing The Interim CEO of the Company was Pirkka Palomäki year’s term of service. The auditor is responsible for auditing relevant data for business planning purposes and sales during November 1, 2011–January 15, 2012. Christian Fredrikson the consolidated and parent company’s financial statements estimates. Estimates and revenue recognition are constantly started as President and CEO as of January 16, 2012. and accounting. The auditor will report to the Board of Direc- monitored with various follow-up methods. The Company’s tors at least once a year. controlling team is responsible for consistency and reliability Leadership Team For 2012, F-Secure Corporation’s auditor was Ernst Young of internal control methods. The controlling team meets The Leadership Team supports the CEO in daily operative Oy, an auditing company of Authorized Public Accountant business management and key personnel in order to assess the management and development of the Company. The CEO authorized by the Central Chamber of Commerce. APA Erkka reliability of estimates on continuous basis. appoints the Leadership Team members and decides upon Talvinko acts as responsible partner for the direction and During 2012, the controlling team focused especially on the terms and conditions of their employment. The Board coordination of the audit work. During 2012, the Company the financial management of the new organization structure. of Directors approves the compensation for the Leadership paid for auditing services a total of EUR 123,920 (2011: EUR Another focus area continued to be financial support for the Team. The bonuses and granting of stock options are based 130,810) and EUR 39,100 (2011: EUR 133,956) for other services. Content Cloud business and its restructuring. Furthermore, on the performance of the Company and the individual. The Ernst Young Oy has been F-Secure ­Corporation’s auditor other important focus areas were financial monitoring of Leadership Team meets regularly once a month and separately since 1999. market expansion to Latin America as well as activation and as needed. write-off occurrence of RD projects. The Leadership Team currently consists of the following DESCRIPTION OF THE MAIN FEATURES persons: Christian Fredrikson (President and CEO), Pirkka OF INTERNAL CONTROL AND RISK Internal audit Palomäki (Chief Strategy Officer), Ari Alakiuttu (Vice President, MANAGEMENT PERTAINING TO THE The principles of internal audit are embedded in written Human Resources), Taneli Virtanen (Chief Financial Officer), FINANCIAL REPORTING PROCESS guidelines and policies concerning accounting, risk manage- Pekka Usva (Vice President, Corporate Security), Samu ment and controlling. These guidelines and policies in F-Secure Konttinen (Executive Vice President, Customer and Market Internal Control are coordinated by the company’s Finance department. The Operations), Jari Still (Vice President, Research Develop- The purpose of Internal Control is to ensure that operations are company guidelines cover accounting, reporting, documenta- ment), Maria Nordgren (Vice President, Consumer Security) effective and aligned with the strategy, financial reporting and tion, authorization as well as other relevant issues. F-Secure and Timo Laaksonen (Vice President, Content Cloud). that management information is reliable and in compliance has no separate internal audit function, and therefore this has with applicable regulations and operating principles. been taken into account when defining the scope of external Remuneration Internal control consists of all the guidelines, policies, audit. The financial management team meets with the auditors The remuneration paid to the Board of Directors and the processes, practices and organizational structure that help several times a year. Leadership Team as well as their holdings of F-Secure shares ensure that the business conduct is in compliance with all appli- and options are described in notes 27 and 28 to the financial cable regulations, and that all financial reporting is correct. The Risk management statements. The general principles of remuneration of the guidelines and instructions are made to ensure that accounting Risk management is an integrated part of F-Secure’s President and CEO are described in note 27 to the financial and financial information is a true and accurate reflection of governance and management. The goal is to support the
  • 53.
    F-Secure 2012 04 51 achievement of the Company’s objectives and continuity of the committees approve and monitor the reporting procedures, as information on a regular basis, and (3) project-based insiders. operations by ensuring that the Company: well as the adequacy, appropriateness and effectiveness of the The company maintains its public insider registers in the company’s business and administrative processes. Euroclear Finland Ltd’s SIRE system. The trading of F-Secure ●● has comprehensive understanding of major risks, both Weekly and monthly financial reporting that covers the shares and options of permanent public insiders is public. opportunities and threats entire company is used to monitor how well financial targets Permanent public insiders and permanent company- ●● takes proactive action to manage opportunities and threats are being met. The reports include actual figures, plans and specific insiders or their interest parties defined in the Finnish up-to-date forecasts. The company has sought to manage Securities Markets Act are not entitled to trade shares, options ●● has systematic means to identify, analyze, evaluate and the risks relating to its business operations by developing its or other securities 21 days prior to publication of interim finan- control risks operating processes and control systems. The Board has set cial statements or company accounts. Project-based insiders ●● has clear understanding of roles and responsibilities certain appropriate authorization limits to the management, are not entitled to trade shares, options or other securities regarding risk management and if these limits are exceeded, the decisions shall be handled until the termination of the project. Up-to-date information by the Board of Directors. on the holdings of F-Secure’s permanent insiders with a duty to ●● has systematic means to collect, analyze and learn from The invoicing is mainly in euros. In order to minimize the declare can be found on the company’s website. occurred risks. impact of the fluctuation of the exchange rates, the goal is The person in charge of F-Secure’s insider issues is the The foundation for risk management is defined in the Compa- to hedge the estimated cash flow of affected currencies. The IR-function of the company. ny’s Risk Management Policy. It expresses the mandate and Company does not provide financing outside the industry commitment for F-Secure Risk Management and the processes standard payment terms. The Company’s investment policy Silent Period and practices that are in place to identify, communicate and for cash reserves is conservative. Cash and cash equivalent The company observes a silent period of 21 days before each manage material risks across the company. The policy also are mainly invested in short-term funds and other low-risk quarterly report announcement. During the silent period, the ensures that responsibilities have been appropriately delegated investments. company will arrange neither meetings nor conference calls for Risk Management. During 2012, the most significant risks were related to with the investor community. The Board of Directors is responsible for approval of the the competitiveness of F-Secure’s product portfolio in the Risk Management Policy and determines the company’s overall changing market situation, the ability to protect the intel- Communications risk attitude. The Board of Directors and its Audit Committee lectual property (IPR) in F-Secure’s solutions, risk exposure The aim of the Company’s communications is to support the are responsible for monitoring the company’s top risks and from increasing contractual liability requirements, regional correct valuation of the company by providing the markets related controls and the effective implementation of the policy. development in new growth markets, sustainability of partner with sufficient information on F-Secure’s financial position, The Audit Committee annually conducts a top risk review and relationships, forming of new business areas, continuous strategy and objectives. The Board of Directors has approved evaluates the effectiveness of the risk management system. change in the storage and content cloud services markets, and the disclosure policy that defines the guidelines in communica- The CEO and the Leadership Team are accountable to potential security threats targeted to these services. tions to financial markets and investors and other parties. the Board for approving the Company’s risk management F-Secure’s web site contains all information made public standards and ensuring they are applied in a constant manner OTHER GOVERNANCE ISSUES according to the disclosure requirements for listed companies. across the organization. The corporate Risk Management function provides and Management of insider issues maintains a process to identify, analyze, evaluate and treat The company follows the insider regulations of the NASDAQ of risks. Risk assessments are conducted twice a year as part OMX Helsinki Ltd. Insiders are divided into three categories: of the biannual company planning cycle. The company level (1) permanent public insiders including the members of the risk profile is approved by the Leadership Team. Leadership Board, the auditors, and the Leadership Team of the company, Team conducts a company level risk review biannually in sync (2) permanent company-specific non-public insiders including with the operational planning. The Board of Directors and its persons who by virtue of their position or tasks learn inside
  • 54.
    F-Secure 2012 04 52 Board of Directors Risto Siilasmaa Sari Baldauf Main board memberships and public duties: Chairman of the Board of Directors since 2006 Board member since 2005 Chairman of the Board of Directors of Inventure Oy Board member since 1988 Chairman of the Executive Committee Chairman of the Board of Directors Nevtor Oy b. 1966, M.Sc. (Engineering) b. 1955, M.Sc. (Bus. Adm.) Chairman of the Board of Directors Efecte Corporation Main employment history: Main employment history: Chairman of the Board of Directors Ixonos Plc Currently Chairman of the Board, F-Secure Corporation Worked for more than twenty years at Nokia Corporation e.g. Chairman of the Board of Directors Comptel Corporation Founder, F-Secure Corporation Member of the Group Executive Board, 1994–2005 Member of the Board of Directors of Teleste Corporation President and CEO, F-Secure Corporation, 1988–2006 Executive Vice President and General Manager of Networks, Holdings: number of shares 27,616. Main board memberships and public duties: 1998–2005 Chairman of the Board of Directors of Nokia Corporation Main board memberships and public duties: Juho Malmberg Member of the Board of Directors of Mendor Oy Chairman of the Board of Directors of Fortum Corporation Board member since 2008 Vice Chairman of the Board of Federation of Finnish Member of the supervisory Board of AkzoNobel N.V. b. 1962, M.Sc. (Computer Science) Technology Industries Member of the supervisory Board Daimler AG Main employment history: Member of the Board of Directors of Confederation of Finnish Member of the supervisory Board Deutsche Telekom AG Currently CEO of ZenRobotics Ltd Industries, EK Vice Chairman of the Board of Finnish Business and Policy Executive Vice President, Development and a Member of Member the Tsinghua SEM Advisory Board, Tsinghua University Forum EVA Executive Board of KONE Corporation, 2006–2012 Holdings: number of shares 63,102,689, holding 39.74% Member of Steering Group for Finland’s external economic Managing Director of Accenture Finland, 2002–2005 relations Director, Nordic Outsourcing of Accenture, 2005 Jussi Arovaara Chairman of the Board of Savonlinna Opera Festival Deputy Managing Director of Accenture, 1999–2002 Board member since 2010 Member of the Board of Muuvit Health and Learning Oy Technology Director of Accenture, 1992–1999 b. 1966 Member of the Board of the Finnish Children and Youth Holdings: number of shares 38,213. Main employment history: foundation Currently Vice President, Global Operations in Corel Member of the Board of the Tukikummit foundation Anu Nissinen Corporation (UK) Member of the Board of John Nurminen foundation Board member since 2010 Senior Director, International Sales and Marketing Operations, Holdings: number of shares 111,616. b. 1963, M.Sc. (Economics) 2005–2009 Corel Corporation (UK) Main employment history: Director, International Product Marketing, 2004–2005 Corel Pertti Ervi Currently CEO of Sanoma Media Finland Oy and a Member of Corporation (UK) Board member since 2003 the Executive Management Group of Sanoma Vice President, EMEA Sales, 2002–2004 Corel Corporation (UK) Chairman of The Audit Committee President of Sanoma Entertainment Ltd, 2008–2011 Vice President, Sales Operations, 1999–2001 Corel Corporation b. 1957, B.Sc. (Electronics) President of SW Television Oy/ Welho, 2004–2008 (Canada) Main employment history: Marketing Director of Helsinki Televisio Oy, 2001–2004 Previously worked in several sales and marketing positions in Currently an independent management consultant Marketing Manager of Oy Sinebrychoff Ab, 1998–2000 computer wholesale. Co-founder, Managing Director, Computer 2000 Finland Oy, Holdings: number of shares 18,582. Holdings: number of shares 18,582. 1983–1995 Co-President, Member of the Executive Board, Computer 2000 AG, 1995–2000 Has worked at international management level with major IT vendors such as Cisco, IBM, Intel, HP and Microsoft.
  • 55.
    F-Secure 2012 04 53 Leadership Team Christian Fredrikson management and product development. Jari Still President and CEO Holdings: number of shares: 41,633 Vice President, Research Development Operations b.1964, M.Sc. (Engineering) b. 1965, B.Sc.(Information processing sciences) Main employment history: Taneli Virtanen Main employment history: Joined F-Secure in January, 2012. Was previously responsible Chief Financial Officer Member of the Leadership Team since April 2012. Has worked e.g. for global sales for of Network Systems business unit at Nokia b. 1965, M.Sc. (Economics) as a head of research and development of Mobile Business Unit. Siemens Networks. Furthermore, past positions at Nokia Siemens Main employment history: Prior to joining F-Secure in 2000, worked as co-founder and Chief Networks include Head of Asia Pacific Region and Head of OBS Member of Leadership Team since 2002. Prior to joining Executive Officer in Modera Point Oy and in its subsidiary in San Business Unit (Operations and Business Software), including RD F- Secure in 1999, worked for Santasalo-JOT Group as Group Jose, CA. Has worked for Finnish telecommunication and software and sales. Joined Nokia in 1994, and has held several executive Controller. companies in product development and management positions. level positions in the company, including RD and sales. Holdings: number of shares: 56,633 Has also had several Chairman positions in the Oulu area software Christian Fredrikson is a member of the Communications and business forums. Administration Committee of Ministry of Transport and Pekka Usva Holdings: number of shares: 82,698 Communications in Finland as well as a member of the Steering Vice President, Corporate Security Board of the European Cloud Partnership under the European born 1969, Vocational Qualification (Bus.Adm.) Maria Nordgren Commission. Main employment history: Vice President, Consumer Security Holdings: – Member of the Leadership Team since July 2012. Joined b. 1964, M.Sc. F-Secure in 1995 and has served in various positions including Main employment history: Pirkka Palomäki Director in Corporate Business Solutions, Director of Product Member of the Leadership Team since 2010. Has previously served Chief Strategy Officer Management and Development in Corporate Business and as Vice President, Channel Business, Vice President and Corporate b. 1970, M.Sc. (Industrial Management) Director of Solution Management in Corporate Business. Business. Joined F-Secure’s International Sales unit in 2005. Has Main employment history: Holdings: – held management positions in Finnish software companies such Member of the Leadership Team since 2001. Joined F-Secure as DeskArtes which she co-founded and later headed. in 1997 and has previously headed Product Management, Samu Konttinen Holdings: 20,815 Marketing and RD in F-Secure. Prior to F-Secure worked Executive Vice President, Customer and Market Operations for Telecom Finland (currently TeliaSonera) in the field of b. 1973, studies in Haaga-Helia university of Applied Sciences Timo Laaksonen marketing, business development and development manage- (Bus.Adm.) Vice President, Content Cloud ment for data communication services. Main employment history: born 1961, M.Sc. (Economics) Holdings: number of shares 53,597 Member of the Leadership Team since 2009. Has previously Main employment history: served as Executive Vice President, Sales and Marketing, Vice Member of the Leadership Team since October 2012. Prior Ari Alakiuttu President of Sales and Geographical Operations and Vice to joining F-Secure, worked as Chief Commercial Officer in Vice President, Human Resources President of Mobile Business Unit. Prior to that, worked in sales Tecnotree Corporation. Started his career in enterprise IT sales b. 1967, M.Sc. (Engineering) and channel management, including Director of Regional and marketing management in Nokia Data and Teamware Group Main employment history: Operations, covering F-Secure operations in +20 countries in (Fujitsu). Then moved on to drive and manage a number of Member of the Leadership Team since 2007. Joined F-Secure EMEA. Before joining F-Secure in 2005 held a Vice President international growth business ventures in the telecom, internet in 2000 and served as Vice President, Products Services and position at Valimo Wireless Ltd 2001–2005. and mobile arena, as Executive VP in Sonera SmartTrust and as held positions in Product Management, Product Marketing Main Board Memberships taken: member of the Board in CEO of First Hop and Xtract. and Channel Development until 2008. Prior to joining F-Secure Ixonos Plc. Holdings: – worked for Tellabs and for Nokia in the fields of product Holdings: number of shares: 41,633
  • 56.
    F-Secure 2012 05 54 Information for shareholders The main goal of F-Secure’s investor communications is to make F-Secure Corporation available correct, up-to-date information about F-Secure and its opera- Corporate Headquarters tions – impartially and simultaneously to all interest groups. All published Tammasaarenkatu 7 investor information including annual reports, interim reports, as well as P.O. Box 24 stock exchange and press releases are available on the Group’s website 00181 Helsinki www.f-secure.com About F-Secure Investors. All investor information Finland is published in English and in Finnish. Subscriptions for the emailing list for Tel. +358 9 2520 0700 stock exchange releases can be made by sending your contact details to E-mail: helsinki@f-secure.com investor-relations@f-secure.com. www.f-secure.com F-Secure publishes a financial statement bulletin and three interim reports during 2013, and arranges news conferences for media and analysts at the time of publishing the quarterly reports. F-Secure observes a three- week silent period before the publishing of each quarterly report. During this time, F-Secure does arranges neither meetings nor phone conferences with investors or analysts. Annual General Meeting The Annual General Meeting of F-Secure Corporation is scheduled to be held on Wednesday, April 3, 2013 at 3.30 p.m. (Finnish time) at F-Secure ­Corporation, Tammasaarenkatu 7, 00180 Helsinki. More information on how to attend as well as the documents for the meeting are available on the Group’s webpage www.f-secure.com About F-Secure Investors. Financial calendar for 2013 Financial Statements Bulletin February 1 Annual Report Latest week 11 in March Q1 Interim Report April 26 Q2 Interim Report July 26 Q3 Interim Report October 25 F-Secure share facts Listing since (1999) NASDAQ OMX Helsinki Ltd. Trading symbol FSC 1V Number of shares 158,798,739 IR Contacts For any inquiries on F-Secure as an investment target, please contact: investor-relations@f-secure.com
  • 57.
    content F-Secure  designand layout Kreab Gavin Anderson photographs Antti Ahtiluoto print Lönnberg Print Promo 2013
  • 58.
    F-Secure Corporation Tammasaarenkatu 7 P.O.Box 24 00181 Helsinki Tel. +358 9 2520 0700 helsinki@f-secure.com Karmina, Senior Analyst, Response Services www.f-secure.com