
Recommended
Recommended
More Related Content
What's hot
Similar to ForwardPaths4-25-16
Similar to ForwardPaths4-25-16 (20)
Recently uploaded
Recently uploaded (20)
ForwardPaths4-25-16
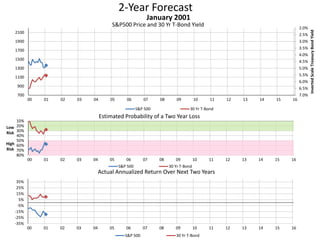
- 1. 2-Year Forecast S&P500 Price and 30 Yr T-Bond Yield 2.0% 2.5% 3.0% 3.5% 4.0% 4.5% 5.0% 5.5% 6.0% 6.5% 7.0%700 900 1100 1300 1500 1700 1900 2100 00 01 02 03 04 05 06 07 08 09 10 11 12 13 14 15 16 InvertedScaleTreasuryBondYield January 2001 S&P 500 30 Yr T-Bond -35% -25% -15% -5% 5% 15% 25% 35% 00 01 02 03 04 05 06 07 08 09 10 11 12 13 14 15 16 Actual Annualized Return Over Next Two Years S&P 500 30 Yr T-Bond 10% 20% 30% 40% 50% 60% 70% 80% 00 01 02 03 04 05 06 07 08 09 10 11 12 13 14 15 16 Low Risk High Risk Estimated Probability of a Two Year Loss S&P 500 30 Yr T-Bond
- 2. 2-Year Forecast S&P500 Price and 30 Yr T-Bond Yield 2.0% 2.5% 3.0% 3.5% 4.0% 4.5% 5.0% 5.5% 6.0% 6.5% 7.0%700 900 1100 1300 1500 1700 1900 2100 00 01 02 03 04 05 06 07 08 09 10 11 12 13 14 15 16 InvertedScaleTreasuryBondYield February 2001 S&P 500 30 Yr T-Bond -35% -25% -15% -5% 5% 15% 25% 35% 00 01 02 03 04 05 06 07 08 09 10 11 12 13 14 15 16 Actual Annualized Return Over Next Two Years S&P 500 30 Yr T-Bond 10% 20% 30% 40% 50% 60% 70% 80% 00 01 02 03 04 05 06 07 08 09 10 11 12 13 14 15 16 Low Risk High Risk Estimated Probability of a Two Year Loss S&P 500 30 Yr T-Bond
- 3. 2-Year Forecast S&P500 Price and 30 Yr T-Bond Yield 2.0% 2.5% 3.0% 3.5% 4.0% 4.5% 5.0% 5.5% 6.0% 6.5% 7.0%700 900 1100 1300 1500 1700 1900 2100 00 01 02 03 04 05 06 07 08 09 10 11 12 13 14 15 16 InvertedScaleTreasuryBondYield March 2001 S&P 500 30 Yr T-Bond -35% -25% -15% -5% 5% 15% 25% 35% 00 01 02 03 04 05 06 07 08 09 10 11 12 13 14 15 16 Actual Annualized Return Over Next Two Years S&P 500 30 Yr T-Bond 10% 20% 30% 40% 50% 60% 70% 80% 00 01 02 03 04 05 06 07 08 09 10 11 12 13 14 15 16 Low Risk High Risk Estimated Probability of a Two Year Loss S&P 500 30 Yr T-Bond
- 4. 2-Year Forecast S&P500 Price and 30 Yr T-Bond Yield 2.0% 2.5% 3.0% 3.5% 4.0% 4.5% 5.0% 5.5% 6.0% 6.5% 7.0%700 900 1100 1300 1500 1700 1900 2100 00 01 02 03 04 05 06 07 08 09 10 11 12 13 14 15 16 InvertedScaleTreasuryBondYield April 2001 S&P 500 30 Yr T-Bond -35% -25% -15% -5% 5% 15% 25% 35% 00 01 02 03 04 05 06 07 08 09 10 11 12 13 14 15 16 Actual Annualized Return Over Next Two Years S&P 500 30 Yr T-Bond 10% 20% 30% 40% 50% 60% 70% 80% 00 01 02 03 04 05 06 07 08 09 10 11 12 13 14 15 16 Low Risk High Risk Estimated Probability of a Two Year Loss S&P 500 30 Yr T-Bond
- 5. 2-Year Forecast S&P500 Price and 30 Yr T-Bond Yield 2.0% 2.5% 3.0% 3.5% 4.0% 4.5% 5.0% 5.5% 6.0% 6.5% 7.0%700 900 1100 1300 1500 1700 1900 2100 00 01 02 03 04 05 06 07 08 09 10 11 12 13 14 15 16 InvertedScaleTreasuryBondYield May 2001 S&P 500 30 Yr T-Bond -35% -25% -15% -5% 5% 15% 25% 35% 00 01 02 03 04 05 06 07 08 09 10 11 12 13 14 15 16 Actual Annualized Return Over Next Two Years S&P 500 30 Yr T-Bond 10% 20% 30% 40% 50% 60% 70% 80% 00 01 02 03 04 05 06 07 08 09 10 11 12 13 14 15 16 Low Risk High Risk Estimated Probability of a Two Year Loss S&P 500 30 Yr T-Bond
- 6. 2-Year Forecast S&P500 Price and 30 Yr T-Bond Yield 2.0% 2.5% 3.0% 3.5% 4.0% 4.5% 5.0% 5.5% 6.0% 6.5% 7.0%700 900 1100 1300 1500 1700 1900 2100 00 01 02 03 04 05 06 07 08 09 10 11 12 13 14 15 16 InvertedScaleTreasuryBondYield June 2001 S&P 500 30 Yr T-Bond -35% -25% -15% -5% 5% 15% 25% 35% 00 01 02 03 04 05 06 07 08 09 10 11 12 13 14 15 16 Actual Annualized Return Over Next Two Years S&P 500 30 Yr T-Bond 10% 20% 30% 40% 50% 60% 70% 80% 00 01 02 03 04 05 06 07 08 09 10 11 12 13 14 15 16 Low Risk High Risk Estimated Probability of a Two Year Loss S&P 500 30 Yr T-Bond
- 7. 2-Year Forecast S&P500 Price and 30 Yr T-Bond Yield 2.0% 2.5% 3.0% 3.5% 4.0% 4.5% 5.0% 5.5% 6.0% 6.5% 7.0%700 900 1100 1300 1500 1700 1900 2100 00 01 02 03 04 05 06 07 08 09 10 11 12 13 14 15 16 InvertedScaleTreasuryBondYield July 2001 S&P 500 30 Yr T-Bond -35% -25% -15% -5% 5% 15% 25% 35% 00 01 02 03 04 05 06 07 08 09 10 11 12 13 14 15 16 Actual Annualized Return Over Next Two Years S&P 500 30 Yr T-Bond 10% 20% 30% 40% 50% 60% 70% 80% 00 01 02 03 04 05 06 07 08 09 10 11 12 13 14 15 16 Low Risk High Risk Estimated Probability of a Two Year Loss S&P 500 30 Yr T-Bond
- 8. 2-Year Forecast S&P500 Price and 30 Yr T-Bond Yield 2.0% 2.5% 3.0% 3.5% 4.0% 4.5% 5.0% 5.5% 6.0% 6.5% 7.0%700 900 1100 1300 1500 1700 1900 2100 00 01 02 03 04 05 06 07 08 09 10 11 12 13 14 15 16 InvertedScaleTreasuryBondYield August 2001 S&P 500 30 Yr T-Bond -35% -25% -15% -5% 5% 15% 25% 35% 00 01 02 03 04 05 06 07 08 09 10 11 12 13 14 15 16 Actual Annualized Return Over Next Two Years S&P 500 30 Yr T-Bond 10% 20% 30% 40% 50% 60% 70% 80% 00 01 02 03 04 05 06 07 08 09 10 11 12 13 14 15 16 Low Risk High Risk Estimated Probability of a Two Year Loss S&P 500 30 Yr T-Bond
- 9. 2-Year Forecast S&P500 Price and 30 Yr T-Bond Yield 2.0% 2.5% 3.0% 3.5% 4.0% 4.5% 5.0% 5.5% 6.0% 6.5% 7.0%700 900 1100 1300 1500 1700 1900 2100 00 01 02 03 04 05 06 07 08 09 10 11 12 13 14 15 16 InvertedScaleTreasuryBondYield September 2001 S&P 500 30 Yr T-Bond -35% -25% -15% -5% 5% 15% 25% 35% 00 01 02 03 04 05 06 07 08 09 10 11 12 13 14 15 16 Actual Annualized Return Over Next Two Years S&P 500 30 Yr T-Bond 10% 20% 30% 40% 50% 60% 70% 80% 00 01 02 03 04 05 06 07 08 09 10 11 12 13 14 15 16 Low Risk High Risk Estimated Probability of a Two Year Loss S&P 500 30 Yr T-Bond
- 10. 2-Year Forecast S&P500 Price and 30 Yr T-Bond Yield 2.0% 2.5% 3.0% 3.5% 4.0% 4.5% 5.0% 5.5% 6.0% 6.5% 7.0%700 900 1100 1300 1500 1700 1900 2100 00 01 02 03 04 05 06 07 08 09 10 11 12 13 14 15 16 InvertedScaleTreasuryBondYield October 2001 S&P 500 30 Yr T-Bond -35% -25% -15% -5% 5% 15% 25% 35% 00 01 02 03 04 05 06 07 08 09 10 11 12 13 14 15 16 Actual Annualized Return Over Next Two Years S&P 500 30 Yr T-Bond 10% 20% 30% 40% 50% 60% 70% 80% 00 01 02 03 04 05 06 07 08 09 10 11 12 13 14 15 16 Low Risk High Risk Estimated Probability of a Two Year Loss S&P 500 30 Yr T-Bond
- 11. 2-Year Forecast S&P500 Price and 30 Yr T-Bond Yield 2.0% 2.5% 3.0% 3.5% 4.0% 4.5% 5.0% 5.5% 6.0% 6.5% 7.0%700 900 1100 1300 1500 1700 1900 2100 00 01 02 03 04 05 06 07 08 09 10 11 12 13 14 15 16 InvertedScaleTreasuryBondYield November 2001 S&P 500 30 Yr T-Bond -35% -25% -15% -5% 5% 15% 25% 35% 00 01 02 03 04 05 06 07 08 09 10 11 12 13 14 15 16 Actual Annualized Return Over Next Two Years S&P 500 30 Yr T-Bond 10% 20% 30% 40% 50% 60% 70% 80% 00 01 02 03 04 05 06 07 08 09 10 11 12 13 14 15 16 Low Risk High Risk Estimated Probability of a Two Year Loss S&P 500 30 Yr T-Bond
- 12. 2-Year Forecast S&P500 Price and 30 Yr T-Bond Yield 2.0% 2.5% 3.0% 3.5% 4.0% 4.5% 5.0% 5.5% 6.0% 6.5% 7.0%700 900 1100 1300 1500 1700 1900 2100 00 01 02 03 04 05 06 07 08 09 10 11 12 13 14 15 16 InvertedScaleTreasuryBondYield December 2001 S&P 500 30 Yr T-Bond -35% -25% -15% -5% 5% 15% 25% 35% 00 01 02 03 04 05 06 07 08 09 10 11 12 13 14 15 16 Actual Annualized Return Over Next Two Years S&P 500 30 Yr T-Bond 10% 20% 30% 40% 50% 60% 70% 80% 00 01 02 03 04 05 06 07 08 09 10 11 12 13 14 15 16 Low Risk High Risk Estimated Probability of a Two Year Loss S&P 500 30 Yr T-Bond
- 13. 2-Year Forecast S&P500 Price and 30 Yr T-Bond Yield 2.0% 2.5% 3.0% 3.5% 4.0% 4.5% 5.0% 5.5% 6.0% 6.5% 7.0%700 900 1100 1300 1500 1700 1900 2100 00 01 02 03 04 05 06 07 08 09 10 11 12 13 14 15 16 InvertedScaleTreasuryBondYield January 2002 S&P 500 30 Yr T-Bond -35% -25% -15% -5% 5% 15% 25% 35% 00 01 02 03 04 05 06 07 08 09 10 11 12 13 14 15 16 Actual Annualized Return Over Next Two Years S&P 500 30 Yr T-Bond 10% 20% 30% 40% 50% 60% 70% 80% 00 01 02 03 04 05 06 07 08 09 10 11 12 13 14 15 16 Low Risk High Risk Estimated Probability of a Two Year Loss S&P 500 30 Yr T-Bond
- 14. 2-Year Forecast S&P500 Price and 30 Yr T-Bond Yield 2.0% 2.5% 3.0% 3.5% 4.0% 4.5% 5.0% 5.5% 6.0% 6.5% 7.0%700 900 1100 1300 1500 1700 1900 2100 00 01 02 03 04 05 06 07 08 09 10 11 12 13 14 15 16 InvertedScaleTreasuryBondYield February 2002 S&P 500 30 Yr T-Bond -35% -25% -15% -5% 5% 15% 25% 35% 00 01 02 03 04 05 06 07 08 09 10 11 12 13 14 15 16 Actual Annualized Return Over Next Two Years S&P 500 30 Yr T-Bond 10% 20% 30% 40% 50% 60% 70% 80% 00 01 02 03 04 05 06 07 08 09 10 11 12 13 14 15 16 Low Risk High Risk Estimated Probability of a Two Year Loss S&P 500 30 Yr T-Bond
- 15. 2-Year Forecast S&P500 Price and 30 Yr T-Bond Yield 2.0% 2.5% 3.0% 3.5% 4.0% 4.5% 5.0% 5.5% 6.0% 6.5% 7.0%700 900 1100 1300 1500 1700 1900 2100 00 01 02 03 04 05 06 07 08 09 10 11 12 13 14 15 16 InvertedScaleTreasuryBondYield March 2002 S&P 500 30 Yr T-Bond -35% -25% -15% -5% 5% 15% 25% 35% 00 01 02 03 04 05 06 07 08 09 10 11 12 13 14 15 16 Actual Annualized Return Over Next Two Years S&P 500 30 Yr T-Bond 10% 20% 30% 40% 50% 60% 70% 80% 00 01 02 03 04 05 06 07 08 09 10 11 12 13 14 15 16 Low Risk High Risk Estimated Probability of a Two Year Loss S&P 500 30 Yr T-Bond
- 16. 2-Year Forecast S&P500 Price and 30 Yr T-Bond Yield 2.0% 2.5% 3.0% 3.5% 4.0% 4.5% 5.0% 5.5% 6.0% 6.5% 7.0%700 900 1100 1300 1500 1700 1900 2100 00 01 02 03 04 05 06 07 08 09 10 11 12 13 14 15 16 InvertedScaleTreasuryBondYield April 2002 S&P 500 30 Yr T-Bond -35% -25% -15% -5% 5% 15% 25% 35% 00 01 02 03 04 05 06 07 08 09 10 11 12 13 14 15 16 Actual Annualized Return Over Next Two Years S&P 500 30 Yr T-Bond 10% 20% 30% 40% 50% 60% 70% 80% 00 01 02 03 04 05 06 07 08 09 10 11 12 13 14 15 16 Low Risk High Risk Estimated Probability of a Two Year Loss S&P 500 30 Yr T-Bond
- 17. 2-Year Forecast S&P500 Price and 30 Yr T-Bond Yield 2.0% 2.5% 3.0% 3.5% 4.0% 4.5% 5.0% 5.5% 6.0% 6.5% 7.0%700 900 1100 1300 1500 1700 1900 2100 00 01 02 03 04 05 06 07 08 09 10 11 12 13 14 15 16 InvertedScaleTreasuryBondYield May 2002 S&P 500 30 Yr T-Bond -35% -25% -15% -5% 5% 15% 25% 35% 00 01 02 03 04 05 06 07 08 09 10 11 12 13 14 15 16 Actual Annualized Return Over Next Two Years S&P 500 30 Yr T-Bond 10% 20% 30% 40% 50% 60% 70% 80% 00 01 02 03 04 05 06 07 08 09 10 11 12 13 14 15 16 Low Risk High Risk Estimated Probability of a Two Year Loss S&P 500 30 Yr T-Bond
- 18. 2-Year Forecast S&P500 Price and 30 Yr T-Bond Yield 2.0% 2.5% 3.0% 3.5% 4.0% 4.5% 5.0% 5.5% 6.0% 6.5% 7.0%700 900 1100 1300 1500 1700 1900 2100 00 01 02 03 04 05 06 07 08 09 10 11 12 13 14 15 16 InvertedScaleTreasuryBondYield June 2002 S&P 500 30 Yr T-Bond -35% -25% -15% -5% 5% 15% 25% 35% 00 01 02 03 04 05 06 07 08 09 10 11 12 13 14 15 16 Actual Annualized Return Over Next Two Years S&P 500 30 Yr T-Bond 10% 20% 30% 40% 50% 60% 70% 80% 00 01 02 03 04 05 06 07 08 09 10 11 12 13 14 15 16 Low Risk High Risk Estimated Probability of a Two Year Loss S&P 500 30 Yr T-Bond
- 19. 2-Year Forecast S&P500 Price and 30 Yr T-Bond Yield 2.0% 2.5% 3.0% 3.5% 4.0% 4.5% 5.0% 5.5% 6.0% 6.5% 7.0%700 900 1100 1300 1500 1700 1900 2100 00 01 02 03 04 05 06 07 08 09 10 11 12 13 14 15 16 InvertedScaleTreasuryBondYield July 2002 S&P 500 30 Yr T-Bond -35% -25% -15% -5% 5% 15% 25% 35% 00 01 02 03 04 05 06 07 08 09 10 11 12 13 14 15 16 Actual Annualized Return Over Next Two Years S&P 500 30 Yr T-Bond 10% 20% 30% 40% 50% 60% 70% 80% 00 01 02 03 04 05 06 07 08 09 10 11 12 13 14 15 16 Low Risk High Risk Estimated Probability of a Two Year Loss S&P 500 30 Yr T-Bond
- 20. 2-Year Forecast S&P500 Price and 30 Yr T-Bond Yield 2.0% 2.5% 3.0% 3.5% 4.0% 4.5% 5.0% 5.5% 6.0% 6.5% 7.0%700 900 1100 1300 1500 1700 1900 2100 00 01 02 03 04 05 06 07 08 09 10 11 12 13 14 15 16 InvertedScaleTreasuryBondYield August 2002 S&P 500 30 Yr T-Bond -35% -25% -15% -5% 5% 15% 25% 35% 00 01 02 03 04 05 06 07 08 09 10 11 12 13 14 15 16 Actual Annualized Return Over Next Two Years S&P 500 30 Yr T-Bond 10% 20% 30% 40% 50% 60% 70% 80% 00 01 02 03 04 05 06 07 08 09 10 11 12 13 14 15 16 Low Risk High Risk Estimated Probability of a Two Year Loss S&P 500 30 Yr T-Bond
- 21. 2-Year Forecast S&P500 Price and 30 Yr T-Bond Yield 2.0% 2.5% 3.0% 3.5% 4.0% 4.5% 5.0% 5.5% 6.0% 6.5% 7.0%700 900 1100 1300 1500 1700 1900 2100 00 01 02 03 04 05 06 07 08 09 10 11 12 13 14 15 16 InvertedScaleTreasuryBondYield September 2002 S&P 500 30 Yr T-Bond -35% -25% -15% -5% 5% 15% 25% 35% 00 01 02 03 04 05 06 07 08 09 10 11 12 13 14 15 16 Actual Annualized Return Over Next Two Years S&P 500 30 Yr T-Bond 10% 20% 30% 40% 50% 60% 70% 80% 00 01 02 03 04 05 06 07 08 09 10 11 12 13 14 15 16 Low Risk High Risk Estimated Probability of a Two Year Loss S&P 500 30 Yr T-Bond
- 22. 2-Year Forecast S&P500 Price and 30 Yr T-Bond Yield 2.0% 2.5% 3.0% 3.5% 4.0% 4.5% 5.0% 5.5% 6.0% 6.5% 7.0%700 900 1100 1300 1500 1700 1900 2100 00 01 02 03 04 05 06 07 08 09 10 11 12 13 14 15 16 InvertedScaleTreasuryBondYield October 2002 S&P 500 30 Yr T-Bond -35% -25% -15% -5% 5% 15% 25% 35% 00 01 02 03 04 05 06 07 08 09 10 11 12 13 14 15 16 Actual Annualized Return Over Next Two Years S&P 500 30 Yr T-Bond 10% 20% 30% 40% 50% 60% 70% 80% 00 01 02 03 04 05 06 07 08 09 10 11 12 13 14 15 16 Low Risk High Risk Estimated Probability of a Two Year Loss S&P 500 30 Yr T-Bond
- 23. 2-Year Forecast S&P500 Price and 30 Yr T-Bond Yield 2.0% 2.5% 3.0% 3.5% 4.0% 4.5% 5.0% 5.5% 6.0% 6.5% 7.0%700 900 1100 1300 1500 1700 1900 2100 00 01 02 03 04 05 06 07 08 09 10 11 12 13 14 15 16 InvertedScaleTreasuryBondYield November 2002 S&P 500 30 Yr T-Bond -35% -25% -15% -5% 5% 15% 25% 35% 00 01 02 03 04 05 06 07 08 09 10 11 12 13 14 15 16 Actual Annualized Return Over Next Two Years S&P 500 30 Yr T-Bond 10% 20% 30% 40% 50% 60% 70% 80% 00 01 02 03 04 05 06 07 08 09 10 11 12 13 14 15 16 Low Risk High Risk Estimated Probability of a Two Year Loss S&P 500 30 Yr T-Bond
- 24. 2-Year Forecast S&P500 Price and 30 Yr T-Bond Yield 2.0% 2.5% 3.0% 3.5% 4.0% 4.5% 5.0% 5.5% 6.0% 6.5% 7.0%700 900 1100 1300 1500 1700 1900 2100 00 01 02 03 04 05 06 07 08 09 10 11 12 13 14 15 16 InvertedScaleTreasuryBondYield December 2002 S&P 500 30 Yr T-Bond -35% -25% -15% -5% 5% 15% 25% 35% 00 01 02 03 04 05 06 07 08 09 10 11 12 13 14 15 16 Actual Annualized Return Over Next Two Years S&P 500 30 Yr T-Bond 10% 20% 30% 40% 50% 60% 70% 80% 00 01 02 03 04 05 06 07 08 09 10 11 12 13 14 15 16 Low Risk High Risk Estimated Probability of a Two Year Loss S&P 500 30 Yr T-Bond
- 25. 2-Year Forecast S&P500 Price and 30 Yr T-Bond Yield 2.0% 2.5% 3.0% 3.5% 4.0% 4.5% 5.0% 5.5% 6.0% 6.5% 7.0%700 900 1100 1300 1500 1700 1900 2100 00 01 02 03 04 05 06 07 08 09 10 11 12 13 14 15 16 InvertedScaleTreasuryBondYield January 2003 S&P 500 30 Yr T-Bond -35% -25% -15% -5% 5% 15% 25% 35% 00 01 02 03 04 05 06 07 08 09 10 11 12 13 14 15 16 Actual Annualized Return Over Next Two Years S&P 500 30 Yr T-Bond 10% 20% 30% 40% 50% 60% 70% 80% 00 01 02 03 04 05 06 07 08 09 10 11 12 13 14 15 16 Low Risk High Risk Estimated Probability of a Two Year Loss S&P 500 30 Yr T-Bond
- 26. 2-Year Forecast S&P500 Price and 30 Yr T-Bond Yield 2.0% 2.5% 3.0% 3.5% 4.0% 4.5% 5.0% 5.5% 6.0% 6.5% 7.0%700 900 1100 1300 1500 1700 1900 2100 00 01 02 03 04 05 06 07 08 09 10 11 12 13 14 15 16 InvertedScaleTreasuryBondYield February 2003 S&P 500 30 Yr T-Bond -35% -25% -15% -5% 5% 15% 25% 35% 00 01 02 03 04 05 06 07 08 09 10 11 12 13 14 15 16 Actual Annualized Return Over Next Two Years S&P 500 30 Yr T-Bond 10% 20% 30% 40% 50% 60% 70% 80% 00 01 02 03 04 05 06 07 08 09 10 11 12 13 14 15 16 Low Risk High Risk Estimated Probability of a Two Year Loss S&P 500 30 Yr T-Bond
- 27. 2-Year Forecast S&P500 Price and 30 Yr T-Bond Yield 2.0% 2.5% 3.0% 3.5% 4.0% 4.5% 5.0% 5.5% 6.0% 6.5% 7.0%700 900 1100 1300 1500 1700 1900 2100 00 01 02 03 04 05 06 07 08 09 10 11 12 13 14 15 16 InvertedScaleTreasuryBondYield March 2003 S&P 500 30 Yr T-Bond -35% -25% -15% -5% 5% 15% 25% 35% 00 01 02 03 04 05 06 07 08 09 10 11 12 13 14 15 16 Actual Annualized Return Over Next Two Years S&P 500 30 Yr T-Bond 10% 20% 30% 40% 50% 60% 70% 80% 00 01 02 03 04 05 06 07 08 09 10 11 12 13 14 15 16 Low Risk High Risk Estimated Probability of a Two Year Loss S&P 500 30 Yr T-Bond
- 28. 2-Year Forecast S&P500 Price and 30 Yr T-Bond Yield 2.0% 2.5% 3.0% 3.5% 4.0% 4.5% 5.0% 5.5% 6.0% 6.5% 7.0%700 900 1100 1300 1500 1700 1900 2100 00 01 02 03 04 05 06 07 08 09 10 11 12 13 14 15 16 InvertedScaleTreasuryBondYield April 2003 S&P 500 30 Yr T-Bond -35% -25% -15% -5% 5% 15% 25% 35% 00 01 02 03 04 05 06 07 08 09 10 11 12 13 14 15 16 Actual Annualized Return Over Next Two Years S&P 500 30 Yr T-Bond 10% 20% 30% 40% 50% 60% 70% 80% 00 01 02 03 04 05 06 07 08 09 10 11 12 13 14 15 16 Low Risk High Risk Estimated Probability of a Two Year Loss S&P 500 30 Yr T-Bond
- 29. 2-Year Forecast S&P500 Price and 30 Yr T-Bond Yield 2.0% 2.5% 3.0% 3.5% 4.0% 4.5% 5.0% 5.5% 6.0% 6.5% 7.0%700 900 1100 1300 1500 1700 1900 2100 00 01 02 03 04 05 06 07 08 09 10 11 12 13 14 15 16 InvertedScaleTreasuryBondYield May 2003 S&P 500 30 Yr T-Bond -35% -25% -15% -5% 5% 15% 25% 35% 00 01 02 03 04 05 06 07 08 09 10 11 12 13 14 15 16 Actual Annualized Return Over Next Two Years S&P 500 30 Yr T-Bond 10% 20% 30% 40% 50% 60% 70% 80% 00 01 02 03 04 05 06 07 08 09 10 11 12 13 14 15 16 Low Risk High Risk Estimated Probability of a Two Year Loss S&P 500 30 Yr T-Bond
- 30. 2-Year Forecast S&P500 Price and 30 Yr T-Bond Yield 2.0% 2.5% 3.0% 3.5% 4.0% 4.5% 5.0% 5.5% 6.0% 6.5% 7.0%700 900 1100 1300 1500 1700 1900 2100 00 01 02 03 04 05 06 07 08 09 10 11 12 13 14 15 16 InvertedScaleTreasuryBondYield June 2003 S&P 500 30 Yr T-Bond -35% -25% -15% -5% 5% 15% 25% 35% 00 01 02 03 04 05 06 07 08 09 10 11 12 13 14 15 16 Actual Annualized Return Over Next Two Years S&P 500 30 Yr T-Bond 10% 20% 30% 40% 50% 60% 70% 80% 00 01 02 03 04 05 06 07 08 09 10 11 12 13 14 15 16 Low Risk High Risk Estimated Probability of a Two Year Loss S&P 500 30 Yr T-Bond
- 31. 2-Year Forecast S&P500 Price and 30 Yr T-Bond Yield 2.0% 2.5% 3.0% 3.5% 4.0% 4.5% 5.0% 5.5% 6.0% 6.5% 7.0%700 900 1100 1300 1500 1700 1900 2100 00 01 02 03 04 05 06 07 08 09 10 11 12 13 14 15 16 InvertedScaleTreasuryBondYield July 2003 S&P 500 30 Yr T-Bond -35% -25% -15% -5% 5% 15% 25% 35% 00 01 02 03 04 05 06 07 08 09 10 11 12 13 14 15 16 Actual Annualized Return Over Next Two Years S&P 500 30 Yr T-Bond 10% 20% 30% 40% 50% 60% 70% 80% 00 01 02 03 04 05 06 07 08 09 10 11 12 13 14 15 16 Low Risk High Risk Estimated Probability of a Two Year Loss S&P 500 30 Yr T-Bond
- 32. 2-Year Forecast S&P500 Price and 30 Yr T-Bond Yield 2.0% 2.5% 3.0% 3.5% 4.0% 4.5% 5.0% 5.5% 6.0% 6.5% 7.0%700 900 1100 1300 1500 1700 1900 2100 00 01 02 03 04 05 06 07 08 09 10 11 12 13 14 15 16 InvertedScaleTreasuryBondYield August 2003 S&P 500 30 Yr T-Bond -35% -25% -15% -5% 5% 15% 25% 35% 00 01 02 03 04 05 06 07 08 09 10 11 12 13 14 15 16 Actual Annualized Return Over Next Two Years S&P 500 30 Yr T-Bond 10% 20% 30% 40% 50% 60% 70% 80% 00 01 02 03 04 05 06 07 08 09 10 11 12 13 14 15 16 Low Risk High Risk Estimated Probability of a Two Year Loss S&P 500 30 Yr T-Bond
- 33. 2-Year Forecast S&P500 Price and 30 Yr T-Bond Yield 2.0% 2.5% 3.0% 3.5% 4.0% 4.5% 5.0% 5.5% 6.0% 6.5% 7.0%700 900 1100 1300 1500 1700 1900 2100 00 01 02 03 04 05 06 07 08 09 10 11 12 13 14 15 16 InvertedScaleTreasuryBondYield September 2003 S&P 500 30 Yr T-Bond -35% -25% -15% -5% 5% 15% 25% 35% 00 01 02 03 04 05 06 07 08 09 10 11 12 13 14 15 16 Actual Annualized Return Over Next Two Years S&P 500 30 Yr T-Bond 10% 20% 30% 40% 50% 60% 70% 80% 00 01 02 03 04 05 06 07 08 09 10 11 12 13 14 15 16 Low Risk High Risk Estimated Probability of a Two Year Loss S&P 500 30 Yr T-Bond
- 34. 2-Year Forecast S&P500 Price and 30 Yr T-Bond Yield 2.0% 2.5% 3.0% 3.5% 4.0% 4.5% 5.0% 5.5% 6.0% 6.5% 7.0%700 900 1100 1300 1500 1700 1900 2100 00 01 02 03 04 05 06 07 08 09 10 11 12 13 14 15 16 InvertedScaleTreasuryBondYield October 2003 S&P 500 30 Yr T-Bond -35% -25% -15% -5% 5% 15% 25% 35% 00 01 02 03 04 05 06 07 08 09 10 11 12 13 14 15 16 Actual Annualized Return Over Next Two Years S&P 500 30 Yr T-Bond 10% 20% 30% 40% 50% 60% 70% 80% 00 01 02 03 04 05 06 07 08 09 10 11 12 13 14 15 16 Low Risk High Risk Estimated Probability of a Two Year Loss S&P 500 30 Yr T-Bond
- 35. 2-Year Forecast S&P500 Price and 30 Yr T-Bond Yield 2.0% 2.5% 3.0% 3.5% 4.0% 4.5% 5.0% 5.5% 6.0% 6.5% 7.0%700 900 1100 1300 1500 1700 1900 2100 00 01 02 03 04 05 06 07 08 09 10 11 12 13 14 15 16 InvertedScaleTreasuryBondYield November 2003 S&P 500 30 Yr T-Bond -35% -25% -15% -5% 5% 15% 25% 35% 00 01 02 03 04 05 06 07 08 09 10 11 12 13 14 15 16 Actual Annualized Return Over Next Two Years S&P 500 30 Yr T-Bond 10% 20% 30% 40% 50% 60% 70% 80% 00 01 02 03 04 05 06 07 08 09 10 11 12 13 14 15 16 Low Risk High Risk Estimated Probability of a Two Year Loss S&P 500 30 Yr T-Bond
- 36. 2-Year Forecast S&P500 Price and 30 Yr T-Bond Yield 2.0% 2.5% 3.0% 3.5% 4.0% 4.5% 5.0% 5.5% 6.0% 6.5% 7.0%700 900 1100 1300 1500 1700 1900 2100 00 01 02 03 04 05 06 07 08 09 10 11 12 13 14 15 16 InvertedScaleTreasuryBondYield December 2003 S&P 500 30 Yr T-Bond -35% -25% -15% -5% 5% 15% 25% 35% 00 01 02 03 04 05 06 07 08 09 10 11 12 13 14 15 16 Actual Annualized Return Over Next Two Years S&P 500 30 Yr T-Bond 10% 20% 30% 40% 50% 60% 70% 80% 00 01 02 03 04 05 06 07 08 09 10 11 12 13 14 15 16 Low Risk High Risk Estimated Probability of a Two Year Loss S&P 500 30 Yr T-Bond
- 37. 2-Year Forecast S&P500 Price and 30 Yr T-Bond Yield 2.0% 2.5% 3.0% 3.5% 4.0% 4.5% 5.0% 5.5% 6.0% 6.5% 7.0%700 900 1100 1300 1500 1700 1900 2100 00 01 02 03 04 05 06 07 08 09 10 11 12 13 14 15 16 InvertedScaleTreasuryBondYield January 2004 S&P 500 30 Yr T-Bond -35% -25% -15% -5% 5% 15% 25% 35% 00 01 02 03 04 05 06 07 08 09 10 11 12 13 14 15 16 Actual Annualized Return Over Next Two Years S&P 500 30 Yr T-Bond 10% 20% 30% 40% 50% 60% 70% 80% 00 01 02 03 04 05 06 07 08 09 10 11 12 13 14 15 16 Low Risk High Risk Estimated Probability of a Two Year Loss S&P 500 30 Yr T-Bond
- 38. 2-Year Forecast S&P500 Price and 30 Yr T-Bond Yield 2.0% 2.5% 3.0% 3.5% 4.0% 4.5% 5.0% 5.5% 6.0% 6.5% 7.0%700 900 1100 1300 1500 1700 1900 2100 00 01 02 03 04 05 06 07 08 09 10 11 12 13 14 15 16 InvertedScaleTreasuryBondYield February 2004 S&P 500 30 Yr T-Bond -35% -25% -15% -5% 5% 15% 25% 35% 00 01 02 03 04 05 06 07 08 09 10 11 12 13 14 15 16 Actual Annualized Return Over Next Two Years S&P 500 30 Yr T-Bond 10% 20% 30% 40% 50% 60% 70% 80% 00 01 02 03 04 05 06 07 08 09 10 11 12 13 14 15 16 Low Risk High Risk Estimated Probability of a Two Year Loss S&P 500 30 Yr T-Bond
- 39. 2-Year Forecast S&P500 Price and 30 Yr T-Bond Yield 2.0% 2.5% 3.0% 3.5% 4.0% 4.5% 5.0% 5.5% 6.0% 6.5% 7.0%700 900 1100 1300 1500 1700 1900 2100 00 01 02 03 04 05 06 07 08 09 10 11 12 13 14 15 16 InvertedScaleTreasuryBondYield March 2004 S&P 500 30 Yr T-Bond -35% -25% -15% -5% 5% 15% 25% 35% 00 01 02 03 04 05 06 07 08 09 10 11 12 13 14 15 16 Actual Annualized Return Over Next Two Years S&P 500 30 Yr T-Bond 10% 20% 30% 40% 50% 60% 70% 80% 00 01 02 03 04 05 06 07 08 09 10 11 12 13 14 15 16 Low Risk High Risk Estimated Probability of a Two Year Loss S&P 500 30 Yr T-Bond
- 40. 2-Year Forecast S&P500 Price and 30 Yr T-Bond Yield 2.0% 2.5% 3.0% 3.5% 4.0% 4.5% 5.0% 5.5% 6.0% 6.5% 7.0%700 900 1100 1300 1500 1700 1900 2100 00 01 02 03 04 05 06 07 08 09 10 11 12 13 14 15 16 InvertedScaleTreasuryBondYield April 2004 S&P 500 30 Yr T-Bond -35% -25% -15% -5% 5% 15% 25% 35% 00 01 02 03 04 05 06 07 08 09 10 11 12 13 14 15 16 Actual Annualized Return Over Next Two Years S&P 500 30 Yr T-Bond 10% 20% 30% 40% 50% 60% 70% 80% 00 01 02 03 04 05 06 07 08 09 10 11 12 13 14 15 16 Low Risk High Risk Estimated Probability of a Two Year Loss S&P 500 30 Yr T-Bond
- 41. 2-Year Forecast S&P500 Price and 30 Yr T-Bond Yield 2.0% 2.5% 3.0% 3.5% 4.0% 4.5% 5.0% 5.5% 6.0% 6.5% 7.0%700 900 1100 1300 1500 1700 1900 2100 00 01 02 03 04 05 06 07 08 09 10 11 12 13 14 15 16 InvertedScaleTreasuryBondYield May 2004 S&P 500 30 Yr T-Bond -35% -25% -15% -5% 5% 15% 25% 35% 00 01 02 03 04 05 06 07 08 09 10 11 12 13 14 15 16 Actual Annualized Return Over Next Two Years S&P 500 30 Yr T-Bond 10% 20% 30% 40% 50% 60% 70% 80% 00 01 02 03 04 05 06 07 08 09 10 11 12 13 14 15 16 Low Risk High Risk Estimated Probability of a Two Year Loss S&P 500 30 Yr T-Bond
- 42. 2-Year Forecast S&P500 Price and 30 Yr T-Bond Yield 2.0% 2.5% 3.0% 3.5% 4.0% 4.5% 5.0% 5.5% 6.0% 6.5% 7.0%700 900 1100 1300 1500 1700 1900 2100 00 01 02 03 04 05 06 07 08 09 10 11 12 13 14 15 16 InvertedScaleTreasuryBondYield June 2004 S&P 500 30 Yr T-Bond -35% -25% -15% -5% 5% 15% 25% 35% 00 01 02 03 04 05 06 07 08 09 10 11 12 13 14 15 16 Actual Annualized Return Over Next Two Years S&P 500 30 Yr T-Bond 10% 20% 30% 40% 50% 60% 70% 80% 00 01 02 03 04 05 06 07 08 09 10 11 12 13 14 15 16 Low Risk High Risk Estimated Probability of a Two Year Loss S&P 500 30 Yr T-Bond
- 43. 2-Year Forecast S&P500 Price and 30 Yr T-Bond Yield 2.0% 2.5% 3.0% 3.5% 4.0% 4.5% 5.0% 5.5% 6.0% 6.5% 7.0%700 900 1100 1300 1500 1700 1900 2100 00 01 02 03 04 05 06 07 08 09 10 11 12 13 14 15 16 InvertedScaleTreasuryBondYield July 2004 S&P 500 30 Yr T-Bond -35% -25% -15% -5% 5% 15% 25% 35% 00 01 02 03 04 05 06 07 08 09 10 11 12 13 14 15 16 Actual Annualized Return Over Next Two Years S&P 500 30 Yr T-Bond 10% 20% 30% 40% 50% 60% 70% 80% 00 01 02 03 04 05 06 07 08 09 10 11 12 13 14 15 16 Low Risk High Risk Estimated Probability of a Two Year Loss S&P 500 30 Yr T-Bond
- 44. 2-Year Forecast S&P500 Price and 30 Yr T-Bond Yield 2.0% 2.5% 3.0% 3.5% 4.0% 4.5% 5.0% 5.5% 6.0% 6.5% 7.0%700 900 1100 1300 1500 1700 1900 2100 00 01 02 03 04 05 06 07 08 09 10 11 12 13 14 15 16 InvertedScaleTreasuryBondYield August 2004 S&P 500 30 Yr T-Bond -35% -25% -15% -5% 5% 15% 25% 35% 00 01 02 03 04 05 06 07 08 09 10 11 12 13 14 15 16 Actual Annualized Return Over Next Two Years S&P 500 30 Yr T-Bond 10% 20% 30% 40% 50% 60% 70% 80% 00 01 02 03 04 05 06 07 08 09 10 11 12 13 14 15 16 Low Risk High Risk Estimated Probability of a Two Year Loss S&P 500 30 Yr T-Bond
- 45. 2-Year Forecast S&P500 Price and 30 Yr T-Bond Yield 2.0% 2.5% 3.0% 3.5% 4.0% 4.5% 5.0% 5.5% 6.0% 6.5% 7.0%700 900 1100 1300 1500 1700 1900 2100 00 01 02 03 04 05 06 07 08 09 10 11 12 13 14 15 16 InvertedScaleTreasuryBondYield September 2004 S&P 500 30 Yr T-Bond -35% -25% -15% -5% 5% 15% 25% 35% 00 01 02 03 04 05 06 07 08 09 10 11 12 13 14 15 16 Actual Annualized Return Over Next Two Years S&P 500 30 Yr T-Bond 10% 20% 30% 40% 50% 60% 70% 80% 00 01 02 03 04 05 06 07 08 09 10 11 12 13 14 15 16 Low Risk High Risk Estimated Probability of a Two Year Loss S&P 500 30 Yr T-Bond
- 46. 2-Year Forecast S&P500 Price and 30 Yr T-Bond Yield 2.0% 2.5% 3.0% 3.5% 4.0% 4.5% 5.0% 5.5% 6.0% 6.5% 7.0%700 900 1100 1300 1500 1700 1900 2100 00 01 02 03 04 05 06 07 08 09 10 11 12 13 14 15 16 InvertedScaleTreasuryBondYield October 2004 S&P 500 30 Yr T-Bond -35% -25% -15% -5% 5% 15% 25% 35% 00 01 02 03 04 05 06 07 08 09 10 11 12 13 14 15 16 Actual Annualized Return Over Next Two Years S&P 500 30 Yr T-Bond 10% 20% 30% 40% 50% 60% 70% 80% 00 01 02 03 04 05 06 07 08 09 10 11 12 13 14 15 16 Low Risk High Risk Estimated Probability of a Two Year Loss S&P 500 30 Yr T-Bond
- 47. 2-Year Forecast S&P500 Price and 30 Yr T-Bond Yield 2.0% 2.5% 3.0% 3.5% 4.0% 4.5% 5.0% 5.5% 6.0% 6.5% 7.0%700 900 1100 1300 1500 1700 1900 2100 00 01 02 03 04 05 06 07 08 09 10 11 12 13 14 15 16 InvertedScaleTreasuryBondYield November 2004 S&P 500 30 Yr T-Bond -35% -25% -15% -5% 5% 15% 25% 35% 00 01 02 03 04 05 06 07 08 09 10 11 12 13 14 15 16 Actual Annualized Return Over Next Two Years S&P 500 30 Yr T-Bond 10% 20% 30% 40% 50% 60% 70% 80% 00 01 02 03 04 05 06 07 08 09 10 11 12 13 14 15 16 Low Risk High Risk Estimated Probability of a Two Year Loss S&P 500 30 Yr T-Bond
- 48. 2-Year Forecast S&P500 Price and 30 Yr T-Bond Yield 2.0% 2.5% 3.0% 3.5% 4.0% 4.5% 5.0% 5.5% 6.0% 6.5% 7.0%700 900 1100 1300 1500 1700 1900 2100 00 01 02 03 04 05 06 07 08 09 10 11 12 13 14 15 16 InvertedScaleTreasuryBondYield December 2004 S&P 500 30 Yr T-Bond -35% -25% -15% -5% 5% 15% 25% 35% 00 01 02 03 04 05 06 07 08 09 10 11 12 13 14 15 16 Actual Annualized Return Over Next Two Years S&P 500 30 Yr T-Bond 10% 20% 30% 40% 50% 60% 70% 80% 00 01 02 03 04 05 06 07 08 09 10 11 12 13 14 15 16 Low Risk High Risk Estimated Probability of a Two Year Loss S&P 500 30 Yr T-Bond
- 49. 2-Year Forecast S&P500 Price and 30 Yr T-Bond Yield 2.0% 2.5% 3.0% 3.5% 4.0% 4.5% 5.0% 5.5% 6.0% 6.5% 7.0%700 900 1100 1300 1500 1700 1900 2100 00 01 02 03 04 05 06 07 08 09 10 11 12 13 14 15 16 InvertedScaleTreasuryBondYield January 2005 S&P 500 30 Yr T-Bond -35% -25% -15% -5% 5% 15% 25% 35% 00 01 02 03 04 05 06 07 08 09 10 11 12 13 14 15 16 Actual Annualized Return Over Next Two Years S&P 500 30 Yr T-Bond 10% 20% 30% 40% 50% 60% 70% 80% 00 01 02 03 04 05 06 07 08 09 10 11 12 13 14 15 16 Low Risk High Risk Estimated Probability of a Two Year Loss S&P 500 30 Yr T-Bond
- 50. 2-Year Forecast S&P500 Price and 30 Yr T-Bond Yield 2.0% 2.5% 3.0% 3.5% 4.0% 4.5% 5.0% 5.5% 6.0% 6.5% 7.0%700 900 1100 1300 1500 1700 1900 2100 00 01 02 03 04 05 06 07 08 09 10 11 12 13 14 15 16 InvertedScaleTreasuryBondYield February 2005 S&P 500 30 Yr T-Bond -35% -25% -15% -5% 5% 15% 25% 35% 00 01 02 03 04 05 06 07 08 09 10 11 12 13 14 15 16 Actual Annualized Return Over Next Two Years S&P 500 30 Yr T-Bond 10% 20% 30% 40% 50% 60% 70% 80% 00 01 02 03 04 05 06 07 08 09 10 11 12 13 14 15 16 Low Risk High Risk Estimated Probability of a Two Year Loss S&P 500 30 Yr T-Bond
- 51. 2-Year Forecast S&P500 Price and 30 Yr T-Bond Yield 2.0% 2.5% 3.0% 3.5% 4.0% 4.5% 5.0% 5.5% 6.0% 6.5% 7.0%700 900 1100 1300 1500 1700 1900 2100 00 01 02 03 04 05 06 07 08 09 10 11 12 13 14 15 16 InvertedScaleTreasuryBondYield March 2005 S&P 500 30 Yr T-Bond -35% -25% -15% -5% 5% 15% 25% 35% 00 01 02 03 04 05 06 07 08 09 10 11 12 13 14 15 16 Actual Annualized Return Over Next Two Years S&P 500 30 Yr T-Bond 10% 20% 30% 40% 50% 60% 70% 80% 00 01 02 03 04 05 06 07 08 09 10 11 12 13 14 15 16 Low Risk High Risk Estimated Probability of a Two Year Loss S&P 500 30 Yr T-Bond
- 52. 2-Year Forecast S&P500 Price and 30 Yr T-Bond Yield 2.0% 2.5% 3.0% 3.5% 4.0% 4.5% 5.0% 5.5% 6.0% 6.5% 7.0%700 900 1100 1300 1500 1700 1900 2100 00 01 02 03 04 05 06 07 08 09 10 11 12 13 14 15 16 InvertedScaleTreasuryBondYield April 2005 S&P 500 30 Yr T-Bond -35% -25% -15% -5% 5% 15% 25% 35% 00 01 02 03 04 05 06 07 08 09 10 11 12 13 14 15 16 Actual Annualized Return Over Next Two Years S&P 500 30 Yr T-Bond 10% 20% 30% 40% 50% 60% 70% 80% 00 01 02 03 04 05 06 07 08 09 10 11 12 13 14 15 16 Low Risk High Risk Estimated Probability of a Two Year Loss S&P 500 30 Yr T-Bond
- 53. 2-Year Forecast S&P500 Price and 30 Yr T-Bond Yield 2.0% 2.5% 3.0% 3.5% 4.0% 4.5% 5.0% 5.5% 6.0% 6.5% 7.0%700 900 1100 1300 1500 1700 1900 2100 00 01 02 03 04 05 06 07 08 09 10 11 12 13 14 15 16 InvertedScaleTreasuryBondYield May 2005 S&P 500 30 Yr T-Bond -35% -25% -15% -5% 5% 15% 25% 35% 00 01 02 03 04 05 06 07 08 09 10 11 12 13 14 15 16 Actual Annualized Return Over Next Two Years S&P 500 30 Yr T-Bond 10% 20% 30% 40% 50% 60% 70% 80% 00 01 02 03 04 05 06 07 08 09 10 11 12 13 14 15 16 Low Risk High Risk Estimated Probability of a Two Year Loss S&P 500 30 Yr T-Bond
- 54. 2-Year Forecast S&P500 Price and 30 Yr T-Bond Yield 2.0% 2.5% 3.0% 3.5% 4.0% 4.5% 5.0% 5.5% 6.0% 6.5% 7.0%700 900 1100 1300 1500 1700 1900 2100 00 01 02 03 04 05 06 07 08 09 10 11 12 13 14 15 16 InvertedScaleTreasuryBondYield June 2005 S&P 500 30 Yr T-Bond -35% -25% -15% -5% 5% 15% 25% 35% 00 01 02 03 04 05 06 07 08 09 10 11 12 13 14 15 16 Actual Annualized Return Over Next Two Years S&P 500 30 Yr T-Bond 10% 20% 30% 40% 50% 60% 70% 80% 00 01 02 03 04 05 06 07 08 09 10 11 12 13 14 15 16 Low Risk High Risk Estimated Probability of a Two Year Loss S&P 500 30 Yr T-Bond
- 55. 2-Year Forecast S&P500 Price and 30 Yr T-Bond Yield 2.0% 2.5% 3.0% 3.5% 4.0% 4.5% 5.0% 5.5% 6.0% 6.5% 7.0%700 900 1100 1300 1500 1700 1900 2100 00 01 02 03 04 05 06 07 08 09 10 11 12 13 14 15 16 InvertedScaleTreasuryBondYield July 2005 S&P 500 30 Yr T-Bond -35% -25% -15% -5% 5% 15% 25% 35% 00 01 02 03 04 05 06 07 08 09 10 11 12 13 14 15 16 Actual Annualized Return Over Next Two Years S&P 500 30 Yr T-Bond 10% 20% 30% 40% 50% 60% 70% 80% 00 01 02 03 04 05 06 07 08 09 10 11 12 13 14 15 16 Low Risk High Risk Estimated Probability of a Two Year Loss S&P 500 30 Yr T-Bond
- 56. 2-Year Forecast S&P500 Price and 30 Yr T-Bond Yield 2.0% 2.5% 3.0% 3.5% 4.0% 4.5% 5.0% 5.5% 6.0% 6.5% 7.0%700 900 1100 1300 1500 1700 1900 2100 00 01 02 03 04 05 06 07 08 09 10 11 12 13 14 15 16 InvertedScaleTreasuryBondYield August 2005 S&P 500 30 Yr T-Bond -35% -25% -15% -5% 5% 15% 25% 35% 00 01 02 03 04 05 06 07 08 09 10 11 12 13 14 15 16 Actual Annualized Return Over Next Two Years S&P 500 30 Yr T-Bond 10% 20% 30% 40% 50% 60% 70% 80% 00 01 02 03 04 05 06 07 08 09 10 11 12 13 14 15 16 Low Risk High Risk Estimated Probability of a Two Year Loss S&P 500 30 Yr T-Bond
- 57. 2-Year Forecast S&P500 Price and 30 Yr T-Bond Yield 2.0% 2.5% 3.0% 3.5% 4.0% 4.5% 5.0% 5.5% 6.0% 6.5% 7.0%700 900 1100 1300 1500 1700 1900 2100 00 01 02 03 04 05 06 07 08 09 10 11 12 13 14 15 16 InvertedScaleTreasuryBondYield September 2005 S&P 500 30 Yr T-Bond -35% -25% -15% -5% 5% 15% 25% 35% 00 01 02 03 04 05 06 07 08 09 10 11 12 13 14 15 16 Actual Annualized Return Over Next Two Years S&P 500 30 Yr T-Bond 10% 20% 30% 40% 50% 60% 70% 80% 00 01 02 03 04 05 06 07 08 09 10 11 12 13 14 15 16 Low Risk High Risk Estimated Probability of a Two Year Loss S&P 500 30 Yr T-Bond
- 58. 2-Year Forecast S&P500 Price and 30 Yr T-Bond Yield 2.0% 2.5% 3.0% 3.5% 4.0% 4.5% 5.0% 5.5% 6.0% 6.5% 7.0%700 900 1100 1300 1500 1700 1900 2100 00 01 02 03 04 05 06 07 08 09 10 11 12 13 14 15 16 InvertedScaleTreasuryBondYield October 2005 S&P 500 30 Yr T-Bond -35% -25% -15% -5% 5% 15% 25% 35% 00 01 02 03 04 05 06 07 08 09 10 11 12 13 14 15 16 Actual Annualized Return Over Next Two Years S&P 500 30 Yr T-Bond 10% 20% 30% 40% 50% 60% 70% 80% 00 01 02 03 04 05 06 07 08 09 10 11 12 13 14 15 16 Low Risk High Risk Estimated Probability of a Two Year Loss S&P 500 30 Yr T-Bond
- 59. 2-Year Forecast S&P500 Price and 30 Yr T-Bond Yield 2.0% 2.5% 3.0% 3.5% 4.0% 4.5% 5.0% 5.5% 6.0% 6.5% 7.0%700 900 1100 1300 1500 1700 1900 2100 00 01 02 03 04 05 06 07 08 09 10 11 12 13 14 15 16 InvertedScaleTreasuryBondYield November 2005 S&P 500 30 Yr T-Bond -35% -25% -15% -5% 5% 15% 25% 35% 00 01 02 03 04 05 06 07 08 09 10 11 12 13 14 15 16 Actual Annualized Return Over Next Two Years S&P 500 30 Yr T-Bond 10% 20% 30% 40% 50% 60% 70% 80% 00 01 02 03 04 05 06 07 08 09 10 11 12 13 14 15 16 Low Risk High Risk Estimated Probability of a Two Year Loss S&P 500 30 Yr T-Bond
- 60. 2-Year Forecast S&P500 Price and 30 Yr T-Bond Yield 2.0% 2.5% 3.0% 3.5% 4.0% 4.5% 5.0% 5.5% 6.0% 6.5% 7.0%700 900 1100 1300 1500 1700 1900 2100 00 01 02 03 04 05 06 07 08 09 10 11 12 13 14 15 16 InvertedScaleTreasuryBondYield December 2005 S&P 500 30 Yr T-Bond -35% -25% -15% -5% 5% 15% 25% 35% 00 01 02 03 04 05 06 07 08 09 10 11 12 13 14 15 16 Actual Annualized Return Over Next Two Years S&P 500 30 Yr T-Bond 10% 20% 30% 40% 50% 60% 70% 80% 00 01 02 03 04 05 06 07 08 09 10 11 12 13 14 15 16 Low Risk High Risk Estimated Probability of a Two Year Loss S&P 500 30 Yr T-Bond
- 61. 2-Year Forecast S&P500 Price and 30 Yr T-Bond Yield 2.0% 2.5% 3.0% 3.5% 4.0% 4.5% 5.0% 5.5% 6.0% 6.5% 7.0%700 900 1100 1300 1500 1700 1900 2100 00 01 02 03 04 05 06 07 08 09 10 11 12 13 14 15 16 InvertedScaleTreasuryBondYield January 2006 S&P 500 30 Yr T-Bond -35% -25% -15% -5% 5% 15% 25% 35% 00 01 02 03 04 05 06 07 08 09 10 11 12 13 14 15 16 Actual Annualized Return Over Next Two Years S&P 500 30 Yr T-Bond 10% 20% 30% 40% 50% 60% 70% 80% 00 01 02 03 04 05 06 07 08 09 10 11 12 13 14 15 16 Low Risk High Risk Estimated Probability of a Two Year Loss S&P 500 30 Yr T-Bond
- 62. 2-Year Forecast S&P500 Price and 30 Yr T-Bond Yield 2.0% 2.5% 3.0% 3.5% 4.0% 4.5% 5.0% 5.5% 6.0% 6.5% 7.0%700 900 1100 1300 1500 1700 1900 2100 00 01 02 03 04 05 06 07 08 09 10 11 12 13 14 15 16 InvertedScaleTreasuryBondYield February 2006 S&P 500 30 Yr T-Bond -35% -25% -15% -5% 5% 15% 25% 35% 00 01 02 03 04 05 06 07 08 09 10 11 12 13 14 15 16 Actual Annualized Return Over Next Two Years S&P 500 30 Yr T-Bond 10% 20% 30% 40% 50% 60% 70% 80% 00 01 02 03 04 05 06 07 08 09 10 11 12 13 14 15 16 Low Risk High Risk Estimated Probability of a Two Year Loss S&P 500 30 Yr T-Bond
- 63. 2-Year Forecast S&P500 Price and 30 Yr T-Bond Yield 2.0% 2.5% 3.0% 3.5% 4.0% 4.5% 5.0% 5.5% 6.0% 6.5% 7.0%700 900 1100 1300 1500 1700 1900 2100 00 01 02 03 04 05 06 07 08 09 10 11 12 13 14 15 16 InvertedScaleTreasuryBondYield March 2006 S&P 500 30 Yr T-Bond -35% -25% -15% -5% 5% 15% 25% 35% 00 01 02 03 04 05 06 07 08 09 10 11 12 13 14 15 16 Actual Annualized Return Over Next Two Years S&P 500 30 Yr T-Bond 10% 20% 30% 40% 50% 60% 70% 80% 00 01 02 03 04 05 06 07 08 09 10 11 12 13 14 15 16 Low Risk High Risk Estimated Probability of a Two Year Loss S&P 500 30 Yr T-Bond
- 64. 2-Year Forecast S&P500 Price and 30 Yr T-Bond Yield 2.0% 2.5% 3.0% 3.5% 4.0% 4.5% 5.0% 5.5% 6.0% 6.5% 7.0%700 900 1100 1300 1500 1700 1900 2100 00 01 02 03 04 05 06 07 08 09 10 11 12 13 14 15 16 InvertedScaleTreasuryBondYield April 2006 S&P 500 30 Yr T-Bond -35% -25% -15% -5% 5% 15% 25% 35% 00 01 02 03 04 05 06 07 08 09 10 11 12 13 14 15 16 Actual Annualized Return Over Next Two Years S&P 500 30 Yr T-Bond 10% 20% 30% 40% 50% 60% 70% 80% 00 01 02 03 04 05 06 07 08 09 10 11 12 13 14 15 16 Low Risk High Risk Estimated Probability of a Two Year Loss S&P 500 30 Yr T-Bond
- 65. 2-Year Forecast S&P500 Price and 30 Yr T-Bond Yield 2.0% 2.5% 3.0% 3.5% 4.0% 4.5% 5.0% 5.5% 6.0% 6.5% 7.0%700 900 1100 1300 1500 1700 1900 2100 00 01 02 03 04 05 06 07 08 09 10 11 12 13 14 15 16 InvertedScaleTreasuryBondYield May 2006 S&P 500 30 Yr T-Bond -35% -25% -15% -5% 5% 15% 25% 35% 00 01 02 03 04 05 06 07 08 09 10 11 12 13 14 15 16 Actual Annualized Return Over Next Two Years S&P 500 30 Yr T-Bond 10% 20% 30% 40% 50% 60% 70% 80% 00 01 02 03 04 05 06 07 08 09 10 11 12 13 14 15 16 Low Risk High Risk Estimated Probability of a Two Year Loss S&P 500 30 Yr T-Bond
- 66. 2-Year Forecast S&P500 Price and 30 Yr T-Bond Yield 2.0% 2.5% 3.0% 3.5% 4.0% 4.5% 5.0% 5.5% 6.0% 6.5% 7.0%700 900 1100 1300 1500 1700 1900 2100 00 01 02 03 04 05 06 07 08 09 10 11 12 13 14 15 16 InvertedScaleTreasuryBondYield June 2006 S&P 500 30 Yr T-Bond -35% -25% -15% -5% 5% 15% 25% 35% 00 01 02 03 04 05 06 07 08 09 10 11 12 13 14 15 16 Actual Annualized Return Over Next Two Years S&P 500 30 Yr T-Bond 10% 20% 30% 40% 50% 60% 70% 80% 00 01 02 03 04 05 06 07 08 09 10 11 12 13 14 15 16 Low Risk High Risk Estimated Probability of a Two Year Loss S&P 500 30 Yr T-Bond
- 67. 2-Year Forecast S&P500 Price and 30 Yr T-Bond Yield 2.0% 2.5% 3.0% 3.5% 4.0% 4.5% 5.0% 5.5% 6.0% 6.5% 7.0%700 900 1100 1300 1500 1700 1900 2100 00 01 02 03 04 05 06 07 08 09 10 11 12 13 14 15 16 InvertedScaleTreasuryBondYield July 2006 S&P 500 30 Yr T-Bond -35% -25% -15% -5% 5% 15% 25% 35% 00 01 02 03 04 05 06 07 08 09 10 11 12 13 14 15 16 Actual Annualized Return Over Next Two Years S&P 500 30 Yr T-Bond 10% 20% 30% 40% 50% 60% 70% 80% 00 01 02 03 04 05 06 07 08 09 10 11 12 13 14 15 16 Low Risk High Risk Estimated Probability of a Two Year Loss S&P 500 30 Yr T-Bond
- 68. 2-Year Forecast S&P500 Price and 30 Yr T-Bond Yield 2.0% 2.5% 3.0% 3.5% 4.0% 4.5% 5.0% 5.5% 6.0% 6.5% 7.0%700 900 1100 1300 1500 1700 1900 2100 00 01 02 03 04 05 06 07 08 09 10 11 12 13 14 15 16 InvertedScaleTreasuryBondYield August 2006 S&P 500 30 Yr T-Bond -35% -25% -15% -5% 5% 15% 25% 35% 00 01 02 03 04 05 06 07 08 09 10 11 12 13 14 15 16 Actual Annualized Return Over Next Two Years S&P 500 30 Yr T-Bond 10% 20% 30% 40% 50% 60% 70% 80% 00 01 02 03 04 05 06 07 08 09 10 11 12 13 14 15 16 Low Risk High Risk Estimated Probability of a Two Year Loss S&P 500 30 Yr T-Bond
- 69. 2-Year Forecast S&P500 Price and 30 Yr T-Bond Yield 2.0% 2.5% 3.0% 3.5% 4.0% 4.5% 5.0% 5.5% 6.0% 6.5% 7.0%700 900 1100 1300 1500 1700 1900 2100 00 01 02 03 04 05 06 07 08 09 10 11 12 13 14 15 16 InvertedScaleTreasuryBondYield September 2006 S&P 500 30 Yr T-Bond -35% -25% -15% -5% 5% 15% 25% 35% 00 01 02 03 04 05 06 07 08 09 10 11 12 13 14 15 16 Actual Annualized Return Over Next Two Years S&P 500 30 Yr T-Bond 10% 20% 30% 40% 50% 60% 70% 80% 00 01 02 03 04 05 06 07 08 09 10 11 12 13 14 15 16 Low Risk High Risk Estimated Probability of a Two Year Loss S&P 500 30 Yr T-Bond
- 70. 2-Year Forecast S&P500 Price and 30 Yr T-Bond Yield 2.0% 2.5% 3.0% 3.5% 4.0% 4.5% 5.0% 5.5% 6.0% 6.5% 7.0%700 900 1100 1300 1500 1700 1900 2100 00 01 02 03 04 05 06 07 08 09 10 11 12 13 14 15 16 InvertedScaleTreasuryBondYield October 2006 S&P 500 30 Yr T-Bond -35% -25% -15% -5% 5% 15% 25% 35% 00 01 02 03 04 05 06 07 08 09 10 11 12 13 14 15 16 Actual Annualized Return Over Next Two Years S&P 500 30 Yr T-Bond 10% 20% 30% 40% 50% 60% 70% 80% 00 01 02 03 04 05 06 07 08 09 10 11 12 13 14 15 16 Low Risk High Risk Estimated Probability of a Two Year Loss S&P 500 30 Yr T-Bond
- 71. 2-Year Forecast S&P500 Price and 30 Yr T-Bond Yield 2.0% 2.5% 3.0% 3.5% 4.0% 4.5% 5.0% 5.5% 6.0% 6.5% 7.0%700 900 1100 1300 1500 1700 1900 2100 00 01 02 03 04 05 06 07 08 09 10 11 12 13 14 15 16 InvertedScaleTreasuryBondYield November 2006 S&P 500 30 Yr T-Bond -35% -25% -15% -5% 5% 15% 25% 35% 00 01 02 03 04 05 06 07 08 09 10 11 12 13 14 15 16 Actual Annualized Return Over Next Two Years S&P 500 30 Yr T-Bond 10% 20% 30% 40% 50% 60% 70% 80% 00 01 02 03 04 05 06 07 08 09 10 11 12 13 14 15 16 Low Risk High Risk Estimated Probability of a Two Year Loss S&P 500 30 Yr T-Bond
- 72. 2-Year Forecast S&P500 Price and 30 Yr T-Bond Yield 2.0% 2.5% 3.0% 3.5% 4.0% 4.5% 5.0% 5.5% 6.0% 6.5% 7.0%700 900 1100 1300 1500 1700 1900 2100 00 01 02 03 04 05 06 07 08 09 10 11 12 13 14 15 16 InvertedScaleTreasuryBondYield December 2006 S&P 500 30 Yr T-Bond -35% -25% -15% -5% 5% 15% 25% 35% 00 01 02 03 04 05 06 07 08 09 10 11 12 13 14 15 16 Actual Annualized Return Over Next Two Years S&P 500 30 Yr T-Bond 10% 20% 30% 40% 50% 60% 70% 80% 00 01 02 03 04 05 06 07 08 09 10 11 12 13 14 15 16 Low Risk High Risk Estimated Probability of a Two Year Loss S&P 500 30 Yr T-Bond
- 73. 2-Year Forecast S&P500 Price and 30 Yr T-Bond Yield 2.0% 2.5% 3.0% 3.5% 4.0% 4.5% 5.0% 5.5% 6.0% 6.5% 7.0%700 900 1100 1300 1500 1700 1900 2100 00 01 02 03 04 05 06 07 08 09 10 11 12 13 14 15 16 InvertedScaleTreasuryBondYield January 2007 S&P 500 30 Yr T-Bond -35% -25% -15% -5% 5% 15% 25% 35% 00 01 02 03 04 05 06 07 08 09 10 11 12 13 14 15 16 Actual Annualized Return Over Next Two Years S&P 500 30 Yr T-Bond 10% 20% 30% 40% 50% 60% 70% 80% 00 01 02 03 04 05 06 07 08 09 10 11 12 13 14 15 16 Low Risk High Risk Estimated Probability of a Two Year Loss S&P 500 30 Yr T-Bond
- 74. 2-Year Forecast S&P500 Price and 30 Yr T-Bond Yield 2.0% 2.5% 3.0% 3.5% 4.0% 4.5% 5.0% 5.5% 6.0% 6.5% 7.0%700 900 1100 1300 1500 1700 1900 2100 00 01 02 03 04 05 06 07 08 09 10 11 12 13 14 15 16 InvertedScaleTreasuryBondYield February 2007 S&P 500 30 Yr T-Bond -35% -25% -15% -5% 5% 15% 25% 35% 00 01 02 03 04 05 06 07 08 09 10 11 12 13 14 15 16 Actual Annualized Return Over Next Two Years S&P 500 30 Yr T-Bond 10% 20% 30% 40% 50% 60% 70% 80% 00 01 02 03 04 05 06 07 08 09 10 11 12 13 14 15 16 Low Risk High Risk Estimated Probability of a Two Year Loss S&P 500 30 Yr T-Bond
- 75. 2-Year Forecast S&P500 Price and 30 Yr T-Bond Yield 2.0% 2.5% 3.0% 3.5% 4.0% 4.5% 5.0% 5.5% 6.0% 6.5% 7.0%700 900 1100 1300 1500 1700 1900 2100 00 01 02 03 04 05 06 07 08 09 10 11 12 13 14 15 16 InvertedScaleTreasuryBondYield March 2007 S&P 500 30 Yr T-Bond -35% -25% -15% -5% 5% 15% 25% 35% 00 01 02 03 04 05 06 07 08 09 10 11 12 13 14 15 16 Actual Annualized Return Over Next Two Years S&P 500 30 Yr T-Bond 10% 20% 30% 40% 50% 60% 70% 80% 00 01 02 03 04 05 06 07 08 09 10 11 12 13 14 15 16 Low Risk High Risk Estimated Probability of a Two Year Loss S&P 500 30 Yr T-Bond
- 76. 2-Year Forecast S&P500 Price and 30 Yr T-Bond Yield 2.0% 2.5% 3.0% 3.5% 4.0% 4.5% 5.0% 5.5% 6.0% 6.5% 7.0%700 900 1100 1300 1500 1700 1900 2100 00 01 02 03 04 05 06 07 08 09 10 11 12 13 14 15 16 InvertedScaleTreasuryBondYield April 2007 S&P 500 30 Yr T-Bond -35% -25% -15% -5% 5% 15% 25% 35% 00 01 02 03 04 05 06 07 08 09 10 11 12 13 14 15 16 Actual Annualized Return Over Next Two Years S&P 500 30 Yr T-Bond 10% 20% 30% 40% 50% 60% 70% 80% 00 01 02 03 04 05 06 07 08 09 10 11 12 13 14 15 16 Low Risk High Risk Estimated Probability of a Two Year Loss S&P 500 30 Yr T-Bond
- 77. 2-Year Forecast S&P500 Price and 30 Yr T-Bond Yield 2.0% 2.5% 3.0% 3.5% 4.0% 4.5% 5.0% 5.5% 6.0% 6.5% 7.0%700 900 1100 1300 1500 1700 1900 2100 00 01 02 03 04 05 06 07 08 09 10 11 12 13 14 15 16 InvertedScaleTreasuryBondYield May 2007 S&P 500 30 Yr T-Bond -35% -25% -15% -5% 5% 15% 25% 35% 00 01 02 03 04 05 06 07 08 09 10 11 12 13 14 15 16 Actual Annualized Return Over Next Two Years S&P 500 30 Yr T-Bond 10% 20% 30% 40% 50% 60% 70% 80% 00 01 02 03 04 05 06 07 08 09 10 11 12 13 14 15 16 Low Risk High Risk Estimated Probability of a Two Year Loss S&P 500 30 Yr T-Bond
- 78. 2-Year Forecast S&P500 Price and 30 Yr T-Bond Yield 2.0% 2.5% 3.0% 3.5% 4.0% 4.5% 5.0% 5.5% 6.0% 6.5% 7.0%700 900 1100 1300 1500 1700 1900 2100 00 01 02 03 04 05 06 07 08 09 10 11 12 13 14 15 16 InvertedScaleTreasuryBondYield June 2007 S&P 500 30 Yr T-Bond -35% -25% -15% -5% 5% 15% 25% 35% 00 01 02 03 04 05 06 07 08 09 10 11 12 13 14 15 16 Actual Annualized Return Over Next Two Years S&P 500 30 Yr T-Bond 10% 20% 30% 40% 50% 60% 70% 80% 00 01 02 03 04 05 06 07 08 09 10 11 12 13 14 15 16 Low Risk High Risk Estimated Probability of a Two Year Loss S&P 500 30 Yr T-Bond
- 79. 2-Year Forecast S&P500 Price and 30 Yr T-Bond Yield 2.0% 2.5% 3.0% 3.5% 4.0% 4.5% 5.0% 5.5% 6.0% 6.5% 7.0%700 900 1100 1300 1500 1700 1900 2100 00 01 02 03 04 05 06 07 08 09 10 11 12 13 14 15 16 InvertedScaleTreasuryBondYield July 2007 S&P 500 30 Yr T-Bond -35% -25% -15% -5% 5% 15% 25% 35% 00 01 02 03 04 05 06 07 08 09 10 11 12 13 14 15 16 Actual Annualized Return Over Next Two Years S&P 500 30 Yr T-Bond 10% 20% 30% 40% 50% 60% 70% 80% 00 01 02 03 04 05 06 07 08 09 10 11 12 13 14 15 16 Low Risk High Risk Estimated Probability of a Two Year Loss S&P 500 30 Yr T-Bond
- 80. 2-Year Forecast S&P500 Price and 30 Yr T-Bond Yield 2.0% 2.5% 3.0% 3.5% 4.0% 4.5% 5.0% 5.5% 6.0% 6.5% 7.0%700 900 1100 1300 1500 1700 1900 2100 00 01 02 03 04 05 06 07 08 09 10 11 12 13 14 15 16 InvertedScaleTreasuryBondYield August 2007 S&P 500 30 Yr T-Bond -35% -25% -15% -5% 5% 15% 25% 35% 00 01 02 03 04 05 06 07 08 09 10 11 12 13 14 15 16 Actual Annualized Return Over Next Two Years S&P 500 30 Yr T-Bond 10% 20% 30% 40% 50% 60% 70% 80% 00 01 02 03 04 05 06 07 08 09 10 11 12 13 14 15 16 Low Risk High Risk Estimated Probability of a Two Year Loss S&P 500 30 Yr T-Bond
- 81. 2-Year Forecast S&P500 Price and 30 Yr T-Bond Yield 2.0% 2.5% 3.0% 3.5% 4.0% 4.5% 5.0% 5.5% 6.0% 6.5% 7.0%700 900 1100 1300 1500 1700 1900 2100 00 01 02 03 04 05 06 07 08 09 10 11 12 13 14 15 16 InvertedScaleTreasuryBondYield September 2007 S&P 500 30 Yr T-Bond -35% -25% -15% -5% 5% 15% 25% 35% 00 01 02 03 04 05 06 07 08 09 10 11 12 13 14 15 16 Actual Annualized Return Over Next Two Years S&P 500 30 Yr T-Bond 10% 20% 30% 40% 50% 60% 70% 80% 00 01 02 03 04 05 06 07 08 09 10 11 12 13 14 15 16 Low Risk High Risk Estimated Probability of a Two Year Loss S&P 500 30 Yr T-Bond
- 82. 2-Year Forecast S&P500 Price and 30 Yr T-Bond Yield 2.0% 2.5% 3.0% 3.5% 4.0% 4.5% 5.0% 5.5% 6.0% 6.5% 7.0%700 900 1100 1300 1500 1700 1900 2100 00 01 02 03 04 05 06 07 08 09 10 11 12 13 14 15 16 InvertedScaleTreasuryBondYield October 2007 S&P 500 30 Yr T-Bond -35% -25% -15% -5% 5% 15% 25% 35% 00 01 02 03 04 05 06 07 08 09 10 11 12 13 14 15 16 Actual Annualized Return Over Next Two Years S&P 500 30 Yr T-Bond 10% 20% 30% 40% 50% 60% 70% 80% 00 01 02 03 04 05 06 07 08 09 10 11 12 13 14 15 16 Low Risk High Risk Estimated Probability of a Two Year Loss S&P 500 30 Yr T-Bond
- 83. 2-Year Forecast S&P500 Price and 30 Yr T-Bond Yield 2.0% 2.5% 3.0% 3.5% 4.0% 4.5% 5.0% 5.5% 6.0% 6.5% 7.0%700 900 1100 1300 1500 1700 1900 2100 00 01 02 03 04 05 06 07 08 09 10 11 12 13 14 15 16 InvertedScaleTreasuryBondYield November 2007 S&P 500 30 Yr T-Bond -35% -25% -15% -5% 5% 15% 25% 35% 00 01 02 03 04 05 06 07 08 09 10 11 12 13 14 15 16 Actual Annualized Return Over Next Two Years S&P 500 30 Yr T-Bond 10% 20% 30% 40% 50% 60% 70% 80% 00 01 02 03 04 05 06 07 08 09 10 11 12 13 14 15 16 Low Risk High Risk Estimated Probability of a Two Year Loss S&P 500 30 Yr T-Bond
- 84. 2-Year Forecast S&P500 Price and 30 Yr T-Bond Yield 2.0% 2.5% 3.0% 3.5% 4.0% 4.5% 5.0% 5.5% 6.0% 6.5% 7.0%700 900 1100 1300 1500 1700 1900 2100 00 01 02 03 04 05 06 07 08 09 10 11 12 13 14 15 16 InvertedScaleTreasuryBondYield December 2007 S&P 500 30 Yr T-Bond -35% -25% -15% -5% 5% 15% 25% 35% 00 01 02 03 04 05 06 07 08 09 10 11 12 13 14 15 16 Actual Annualized Return Over Next Two Years S&P 500 30 Yr T-Bond 10% 20% 30% 40% 50% 60% 70% 80% 00 01 02 03 04 05 06 07 08 09 10 11 12 13 14 15 16 Low Risk High Risk Estimated Probability of a Two Year Loss S&P 500 30 Yr T-Bond
- 85. 2-Year Forecast S&P500 Price and 30 Yr T-Bond Yield 2.0% 2.5% 3.0% 3.5% 4.0% 4.5% 5.0% 5.5% 6.0% 6.5% 7.0%700 900 1100 1300 1500 1700 1900 2100 00 01 02 03 04 05 06 07 08 09 10 11 12 13 14 15 16 InvertedScaleTreasuryBondYield January 2008 S&P 500 30 Yr T-Bond -35% -25% -15% -5% 5% 15% 25% 35% 00 01 02 03 04 05 06 07 08 09 10 11 12 13 14 15 16 Actual Annualized Return Over Next Two Years S&P 500 30 Yr T-Bond 10% 20% 30% 40% 50% 60% 70% 80% 00 01 02 03 04 05 06 07 08 09 10 11 12 13 14 15 16 Low Risk High Risk Estimated Probability of a Two Year Loss S&P 500 30 Yr T-Bond
- 86. 2-Year Forecast S&P500 Price and 30 Yr T-Bond Yield 2.0% 2.5% 3.0% 3.5% 4.0% 4.5% 5.0% 5.5% 6.0% 6.5% 7.0%700 900 1100 1300 1500 1700 1900 2100 00 01 02 03 04 05 06 07 08 09 10 11 12 13 14 15 16 InvertedScaleTreasuryBondYield February 2008 S&P 500 30 Yr T-Bond -35% -25% -15% -5% 5% 15% 25% 35% 00 01 02 03 04 05 06 07 08 09 10 11 12 13 14 15 16 Actual Annualized Return Over Next Two Years S&P 500 30 Yr T-Bond 10% 20% 30% 40% 50% 60% 70% 80% 00 01 02 03 04 05 06 07 08 09 10 11 12 13 14 15 16 Low Risk High Risk Estimated Probability of a Two Year Loss S&P 500 30 Yr T-Bond
- 87. 2-Year Forecast S&P500 Price and 30 Yr T-Bond Yield 2.0% 2.5% 3.0% 3.5% 4.0% 4.5% 5.0% 5.5% 6.0% 6.5% 7.0%700 900 1100 1300 1500 1700 1900 2100 00 01 02 03 04 05 06 07 08 09 10 11 12 13 14 15 16 InvertedScaleTreasuryBondYield March 2008 S&P 500 30 Yr T-Bond -35% -25% -15% -5% 5% 15% 25% 35% 00 01 02 03 04 05 06 07 08 09 10 11 12 13 14 15 16 Actual Annualized Return Over Next Two Years S&P 500 30 Yr T-Bond 10% 20% 30% 40% 50% 60% 70% 80% 00 01 02 03 04 05 06 07 08 09 10 11 12 13 14 15 16 Low Risk High Risk Estimated Probability of a Two Year Loss S&P 500 30 Yr T-Bond
- 88. 2-Year Forecast S&P500 Price and 30 Yr T-Bond Yield 2.0% 2.5% 3.0% 3.5% 4.0% 4.5% 5.0% 5.5% 6.0% 6.5% 7.0%700 900 1100 1300 1500 1700 1900 2100 00 01 02 03 04 05 06 07 08 09 10 11 12 13 14 15 16 InvertedScaleTreasuryBondYield April 2008 S&P 500 30 Yr T-Bond -35% -25% -15% -5% 5% 15% 25% 35% 00 01 02 03 04 05 06 07 08 09 10 11 12 13 14 15 16 Actual Annualized Return Over Next Two Years S&P 500 30 Yr T-Bond 10% 20% 30% 40% 50% 60% 70% 80% 00 01 02 03 04 05 06 07 08 09 10 11 12 13 14 15 16 Low Risk High Risk Estimated Probability of a Two Year Loss S&P 500 30 Yr T-Bond
- 89. 2-Year Forecast S&P500 Price and 30 Yr T-Bond Yield 2.0% 2.5% 3.0% 3.5% 4.0% 4.5% 5.0% 5.5% 6.0% 6.5% 7.0%700 900 1100 1300 1500 1700 1900 2100 00 01 02 03 04 05 06 07 08 09 10 11 12 13 14 15 16 InvertedScaleTreasuryBondYield May 2008 S&P 500 30 Yr T-Bond -35% -25% -15% -5% 5% 15% 25% 35% 00 01 02 03 04 05 06 07 08 09 10 11 12 13 14 15 16 Actual Annualized Return Over Next Two Years S&P 500 30 Yr T-Bond 10% 20% 30% 40% 50% 60% 70% 80% 00 01 02 03 04 05 06 07 08 09 10 11 12 13 14 15 16 Low Risk High Risk Estimated Probability of a Two Year Loss S&P 500 30 Yr T-Bond
- 90. 2-Year Forecast S&P500 Price and 30 Yr T-Bond Yield 2.0% 2.5% 3.0% 3.5% 4.0% 4.5% 5.0% 5.5% 6.0% 6.5% 7.0%700 900 1100 1300 1500 1700 1900 2100 00 01 02 03 04 05 06 07 08 09 10 11 12 13 14 15 16 InvertedScaleTreasuryBondYield June 2008 S&P 500 30 Yr T-Bond -35% -25% -15% -5% 5% 15% 25% 35% 00 01 02 03 04 05 06 07 08 09 10 11 12 13 14 15 16 Actual Annualized Return Over Next Two Years S&P 500 30 Yr T-Bond 10% 20% 30% 40% 50% 60% 70% 80% 00 01 02 03 04 05 06 07 08 09 10 11 12 13 14 15 16 Low Risk High Risk Estimated Probability of a Two Year Loss S&P 500 30 Yr T-Bond
- 91. 2-Year Forecast S&P500 Price and 30 Yr T-Bond Yield 2.0% 2.5% 3.0% 3.5% 4.0% 4.5% 5.0% 5.5% 6.0% 6.5% 7.0%700 900 1100 1300 1500 1700 1900 2100 00 01 02 03 04 05 06 07 08 09 10 11 12 13 14 15 16 InvertedScaleTreasuryBondYield July 2008 S&P 500 30 Yr T-Bond -35% -25% -15% -5% 5% 15% 25% 35% 00 01 02 03 04 05 06 07 08 09 10 11 12 13 14 15 16 Actual Annualized Return Over Next Two Years S&P 500 30 Yr T-Bond 10% 20% 30% 40% 50% 60% 70% 80% 00 01 02 03 04 05 06 07 08 09 10 11 12 13 14 15 16 Low Risk High Risk Estimated Probability of a Two Year Loss S&P 500 30 Yr T-Bond
- 92. 2-Year Forecast S&P500 Price and 30 Yr T-Bond Yield 2.0% 2.5% 3.0% 3.5% 4.0% 4.5% 5.0% 5.5% 6.0% 6.5% 7.0%700 900 1100 1300 1500 1700 1900 2100 00 01 02 03 04 05 06 07 08 09 10 11 12 13 14 15 16 InvertedScaleTreasuryBondYield August 2008 S&P 500 30 Yr T-Bond -35% -25% -15% -5% 5% 15% 25% 35% 00 01 02 03 04 05 06 07 08 09 10 11 12 13 14 15 16 Actual Annualized Return Over Next Two Years S&P 500 30 Yr T-Bond 10% 20% 30% 40% 50% 60% 70% 80% 00 01 02 03 04 05 06 07 08 09 10 11 12 13 14 15 16 Low Risk High Risk Estimated Probability of a Two Year Loss S&P 500 30 Yr T-Bond
- 93. 2-Year Forecast S&P500 Price and 30 Yr T-Bond Yield 2.0% 2.5% 3.0% 3.5% 4.0% 4.5% 5.0% 5.5% 6.0% 6.5% 7.0%700 900 1100 1300 1500 1700 1900 2100 00 01 02 03 04 05 06 07 08 09 10 11 12 13 14 15 16 InvertedScaleTreasuryBondYield September 2008 S&P 500 30 Yr T-Bond -35% -25% -15% -5% 5% 15% 25% 35% 00 01 02 03 04 05 06 07 08 09 10 11 12 13 14 15 16 Actual Annualized Return Over Next Two Years S&P 500 30 Yr T-Bond 10% 20% 30% 40% 50% 60% 70% 80% 00 01 02 03 04 05 06 07 08 09 10 11 12 13 14 15 16 Low Risk High Risk Estimated Probability of a Two Year Loss S&P 500 30 Yr T-Bond
- 94. 2-Year Forecast S&P500 Price and 30 Yr T-Bond Yield 2.0% 2.5% 3.0% 3.5% 4.0% 4.5% 5.0% 5.5% 6.0% 6.5% 7.0%700 900 1100 1300 1500 1700 1900 2100 00 01 02 03 04 05 06 07 08 09 10 11 12 13 14 15 16 InvertedScaleTreasuryBondYield October 2008 S&P 500 30 Yr T-Bond -35% -25% -15% -5% 5% 15% 25% 35% 00 01 02 03 04 05 06 07 08 09 10 11 12 13 14 15 16 Actual Annualized Return Over Next Two Years S&P 500 30 Yr T-Bond 10% 20% 30% 40% 50% 60% 70% 80% 00 01 02 03 04 05 06 07 08 09 10 11 12 13 14 15 16 Low Risk High Risk Estimated Probability of a Two Year Loss S&P 500 30 Yr T-Bond
- 95. 2-Year Forecast S&P500 Price and 30 Yr T-Bond Yield 2.0% 2.5% 3.0% 3.5% 4.0% 4.5% 5.0% 5.5% 6.0% 6.5% 7.0%700 900 1100 1300 1500 1700 1900 2100 00 01 02 03 04 05 06 07 08 09 10 11 12 13 14 15 16 InvertedScaleTreasuryBondYield November 2008 S&P 500 30 Yr T-Bond -35% -25% -15% -5% 5% 15% 25% 35% 00 01 02 03 04 05 06 07 08 09 10 11 12 13 14 15 16 Actual Annualized Return Over Next Two Years S&P 500 30 Yr T-Bond 10% 20% 30% 40% 50% 60% 70% 80% 00 01 02 03 04 05 06 07 08 09 10 11 12 13 14 15 16 Low Risk High Risk Estimated Probability of a Two Year Loss S&P 500 30 Yr T-Bond
- 96. 2-Year Forecast S&P500 Price and 30 Yr T-Bond Yield 2.0% 2.5% 3.0% 3.5% 4.0% 4.5% 5.0% 5.5% 6.0% 6.5% 7.0%700 900 1100 1300 1500 1700 1900 2100 00 01 02 03 04 05 06 07 08 09 10 11 12 13 14 15 16 InvertedScaleTreasuryBondYield December 2008 S&P 500 30 Yr T-Bond -35% -25% -15% -5% 5% 15% 25% 35% 00 01 02 03 04 05 06 07 08 09 10 11 12 13 14 15 16 Actual Annualized Return Over Next Two Years S&P 500 30 Yr T-Bond 10% 20% 30% 40% 50% 60% 70% 80% 00 01 02 03 04 05 06 07 08 09 10 11 12 13 14 15 16 Low Risk High Risk Estimated Probability of a Two Year Loss S&P 500 30 Yr T-Bond
- 97. 2-Year Forecast S&P500 Price and 30 Yr T-Bond Yield 2.0% 2.5% 3.0% 3.5% 4.0% 4.5% 5.0% 5.5% 6.0% 6.5% 7.0%700 900 1100 1300 1500 1700 1900 2100 00 01 02 03 04 05 06 07 08 09 10 11 12 13 14 15 16 InvertedScaleTreasuryBondYield January 2009 S&P 500 30 Yr T-Bond -35% -25% -15% -5% 5% 15% 25% 35% 00 01 02 03 04 05 06 07 08 09 10 11 12 13 14 15 16 Actual Annualized Return Over Next Two Years S&P 500 30 Yr T-Bond 10% 20% 30% 40% 50% 60% 70% 80% 00 01 02 03 04 05 06 07 08 09 10 11 12 13 14 15 16 Low Risk High Risk Estimated Probability of a Two Year Loss S&P 500 30 Yr T-Bond
- 98. 2-Year Forecast S&P500 Price and 30 Yr T-Bond Yield 2.0% 2.5% 3.0% 3.5% 4.0% 4.5% 5.0% 5.5% 6.0% 6.5% 7.0%700 900 1100 1300 1500 1700 1900 2100 00 01 02 03 04 05 06 07 08 09 10 11 12 13 14 15 16 InvertedScaleTreasuryBondYield February 2009 S&P 500 30 Yr T-Bond -35% -25% -15% -5% 5% 15% 25% 35% 00 01 02 03 04 05 06 07 08 09 10 11 12 13 14 15 16 Actual Annualized Return Over Next Two Years S&P 500 30 Yr T-Bond 10% 20% 30% 40% 50% 60% 70% 80% 00 01 02 03 04 05 06 07 08 09 10 11 12 13 14 15 16 Low Risk High Risk Estimated Probability of a Two Year Loss S&P 500 30 Yr T-Bond
- 99. 2-Year Forecast S&P500 Price and 30 Yr T-Bond Yield 2.0% 2.5% 3.0% 3.5% 4.0% 4.5% 5.0% 5.5% 6.0% 6.5% 7.0%700 900 1100 1300 1500 1700 1900 2100 00 01 02 03 04 05 06 07 08 09 10 11 12 13 14 15 16 InvertedScaleTreasuryBondYield March 2009 S&P 500 30 Yr T-Bond -35% -25% -15% -5% 5% 15% 25% 35% 00 01 02 03 04 05 06 07 08 09 10 11 12 13 14 15 16 Actual Annualized Return Over Next Two Years S&P 500 30 Yr T-Bond 10% 20% 30% 40% 50% 60% 70% 80% 00 01 02 03 04 05 06 07 08 09 10 11 12 13 14 15 16 Low Risk High Risk Estimated Probability of a Two Year Loss S&P 500 30 Yr T-Bond
- 100. 2-Year Forecast S&P500 Price and 30 Yr T-Bond Yield 2.0% 2.5% 3.0% 3.5% 4.0% 4.5% 5.0% 5.5% 6.0% 6.5% 7.0%700 900 1100 1300 1500 1700 1900 2100 00 01 02 03 04 05 06 07 08 09 10 11 12 13 14 15 16 InvertedScaleTreasuryBondYield April 2009 S&P 500 30 Yr T-Bond -35% -25% -15% -5% 5% 15% 25% 35% 00 01 02 03 04 05 06 07 08 09 10 11 12 13 14 15 16 Actual Annualized Return Over Next Two Years S&P 500 30 Yr T-Bond 10% 20% 30% 40% 50% 60% 70% 80% 00 01 02 03 04 05 06 07 08 09 10 11 12 13 14 15 16 Low Risk High Risk Estimated Probability of a Two Year Loss S&P 500 30 Yr T-Bond
- 101. 2-Year Forecast S&P500 Price and 30 Yr T-Bond Yield 2.0% 2.5% 3.0% 3.5% 4.0% 4.5% 5.0% 5.5% 6.0% 6.5% 7.0%700 900 1100 1300 1500 1700 1900 2100 00 01 02 03 04 05 06 07 08 09 10 11 12 13 14 15 16 InvertedScaleTreasuryBondYield May 2009 S&P 500 30 Yr T-Bond -35% -25% -15% -5% 5% 15% 25% 35% 00 01 02 03 04 05 06 07 08 09 10 11 12 13 14 15 16 Actual Annualized Return Over Next Two Years S&P 500 30 Yr T-Bond 10% 20% 30% 40% 50% 60% 70% 80% 00 01 02 03 04 05 06 07 08 09 10 11 12 13 14 15 16 Low Risk High Risk Estimated Probability of a Two Year Loss S&P 500 30 Yr T-Bond
- 102. 2-Year Forecast S&P500 Price and 30 Yr T-Bond Yield 2.0% 2.5% 3.0% 3.5% 4.0% 4.5% 5.0% 5.5% 6.0% 6.5% 7.0%700 900 1100 1300 1500 1700 1900 2100 00 01 02 03 04 05 06 07 08 09 10 11 12 13 14 15 16 InvertedScaleTreasuryBondYield June 2009 S&P 500 30 Yr T-Bond -35% -25% -15% -5% 5% 15% 25% 35% 00 01 02 03 04 05 06 07 08 09 10 11 12 13 14 15 16 Actual Annualized Return Over Next Two Years S&P 500 30 Yr T-Bond 10% 20% 30% 40% 50% 60% 70% 80% 00 01 02 03 04 05 06 07 08 09 10 11 12 13 14 15 16 Low Risk High Risk Estimated Probability of a Two Year Loss S&P 500 30 Yr T-Bond
- 103. 2-Year Forecast S&P500 Price and 30 Yr T-Bond Yield 2.0% 2.5% 3.0% 3.5% 4.0% 4.5% 5.0% 5.5% 6.0% 6.5% 7.0%700 900 1100 1300 1500 1700 1900 2100 00 01 02 03 04 05 06 07 08 09 10 11 12 13 14 15 16 InvertedScaleTreasuryBondYield July 2009 S&P 500 30 Yr T-Bond -35% -25% -15% -5% 5% 15% 25% 35% 00 01 02 03 04 05 06 07 08 09 10 11 12 13 14 15 16 Actual Annualized Return Over Next Two Years S&P 500 30 Yr T-Bond 10% 20% 30% 40% 50% 60% 70% 80% 00 01 02 03 04 05 06 07 08 09 10 11 12 13 14 15 16 Low Risk High Risk Estimated Probability of a Two Year Loss S&P 500 30 Yr T-Bond
- 104. 2-Year Forecast S&P500 Price and 30 Yr T-Bond Yield 2.0% 2.5% 3.0% 3.5% 4.0% 4.5% 5.0% 5.5% 6.0% 6.5% 7.0%700 900 1100 1300 1500 1700 1900 2100 00 01 02 03 04 05 06 07 08 09 10 11 12 13 14 15 16 InvertedScaleTreasuryBondYield August 2009 S&P 500 30 Yr T-Bond -35% -25% -15% -5% 5% 15% 25% 35% 00 01 02 03 04 05 06 07 08 09 10 11 12 13 14 15 16 Actual Annualized Return Over Next Two Years S&P 500 30 Yr T-Bond 10% 20% 30% 40% 50% 60% 70% 80% 00 01 02 03 04 05 06 07 08 09 10 11 12 13 14 15 16 Low Risk High Risk Estimated Probability of a Two Year Loss S&P 500 30 Yr T-Bond
- 105. 2-Year Forecast S&P500 Price and 30 Yr T-Bond Yield 2.0% 2.5% 3.0% 3.5% 4.0% 4.5% 5.0% 5.5% 6.0% 6.5% 7.0%700 900 1100 1300 1500 1700 1900 2100 00 01 02 03 04 05 06 07 08 09 10 11 12 13 14 15 16 InvertedScaleTreasuryBondYield September 2009 S&P 500 30 Yr T-Bond -35% -25% -15% -5% 5% 15% 25% 35% 00 01 02 03 04 05 06 07 08 09 10 11 12 13 14 15 16 Actual Annualized Return Over Next Two Years S&P 500 30 Yr T-Bond 10% 20% 30% 40% 50% 60% 70% 80% 00 01 02 03 04 05 06 07 08 09 10 11 12 13 14 15 16 Low Risk High Risk Estimated Probability of a Two Year Loss S&P 500 30 Yr T-Bond
- 106. 2-Year Forecast S&P500 Price and 30 Yr T-Bond Yield 2.0% 2.5% 3.0% 3.5% 4.0% 4.5% 5.0% 5.5% 6.0% 6.5% 7.0%700 900 1100 1300 1500 1700 1900 2100 00 01 02 03 04 05 06 07 08 09 10 11 12 13 14 15 16 InvertedScaleTreasuryBondYield October 2009 S&P 500 30 Yr T-Bond -35% -25% -15% -5% 5% 15% 25% 35% 00 01 02 03 04 05 06 07 08 09 10 11 12 13 14 15 16 Actual Annualized Return Over Next Two Years S&P 500 30 Yr T-Bond 10% 20% 30% 40% 50% 60% 70% 80% 00 01 02 03 04 05 06 07 08 09 10 11 12 13 14 15 16 Low Risk High Risk Estimated Probability of a Two Year Loss S&P 500 30 Yr T-Bond
- 107. 2-Year Forecast S&P500 Price and 30 Yr T-Bond Yield 2.0% 2.5% 3.0% 3.5% 4.0% 4.5% 5.0% 5.5% 6.0% 6.5% 7.0%700 900 1100 1300 1500 1700 1900 2100 00 01 02 03 04 05 06 07 08 09 10 11 12 13 14 15 16 InvertedScaleTreasuryBondYield November 2009 S&P 500 30 Yr T-Bond -35% -25% -15% -5% 5% 15% 25% 35% 00 01 02 03 04 05 06 07 08 09 10 11 12 13 14 15 16 Actual Annualized Return Over Next Two Years S&P 500 30 Yr T-Bond 10% 20% 30% 40% 50% 60% 70% 80% 00 01 02 03 04 05 06 07 08 09 10 11 12 13 14 15 16 Low Risk High Risk Estimated Probability of a Two Year Loss S&P 500 30 Yr T-Bond
- 108. 2-Year Forecast S&P500 Price and 30 Yr T-Bond Yield 2.0% 2.5% 3.0% 3.5% 4.0% 4.5% 5.0% 5.5% 6.0% 6.5% 7.0%700 900 1100 1300 1500 1700 1900 2100 00 01 02 03 04 05 06 07 08 09 10 11 12 13 14 15 16 InvertedScaleTreasuryBondYield December 2009 S&P 500 30 Yr T-Bond -35% -25% -15% -5% 5% 15% 25% 35% 00 01 02 03 04 05 06 07 08 09 10 11 12 13 14 15 16 Actual Annualized Return Over Next Two Years S&P 500 30 Yr T-Bond 10% 20% 30% 40% 50% 60% 70% 80% 00 01 02 03 04 05 06 07 08 09 10 11 12 13 14 15 16 Low Risk High Risk Estimated Probability of a Two Year Loss S&P 500 30 Yr T-Bond
- 109. 2-Year Forecast S&P500 Price and 30 Yr T-Bond Yield 2.0% 2.5% 3.0% 3.5% 4.0% 4.5% 5.0% 5.5% 6.0% 6.5% 7.0%700 900 1100 1300 1500 1700 1900 2100 00 01 02 03 04 05 06 07 08 09 10 11 12 13 14 15 16 InvertedScaleTreasuryBondYield January 2010 S&P 500 30 Yr T-Bond -35% -25% -15% -5% 5% 15% 25% 35% 00 01 02 03 04 05 06 07 08 09 10 11 12 13 14 15 16 Actual Annualized Return Over Next Two Years S&P 500 30 Yr T-Bond 10% 20% 30% 40% 50% 60% 70% 80% 00 01 02 03 04 05 06 07 08 09 10 11 12 13 14 15 16 Low Risk High Risk Estimated Probability of a Two Year Loss S&P 500 30 Yr T-Bond
- 110. 2-Year Forecast S&P500 Price and 30 Yr T-Bond Yield 2.0% 2.5% 3.0% 3.5% 4.0% 4.5% 5.0% 5.5% 6.0% 6.5% 7.0%700 900 1100 1300 1500 1700 1900 2100 00 01 02 03 04 05 06 07 08 09 10 11 12 13 14 15 16 InvertedScaleTreasuryBondYield February 2010 S&P 500 30 Yr T-Bond -35% -25% -15% -5% 5% 15% 25% 35% 00 01 02 03 04 05 06 07 08 09 10 11 12 13 14 15 16 Actual Annualized Return Over Next Two Years S&P 500 30 Yr T-Bond 10% 20% 30% 40% 50% 60% 70% 80% 00 01 02 03 04 05 06 07 08 09 10 11 12 13 14 15 16 Low Risk High Risk Estimated Probability of a Two Year Loss S&P 500 30 Yr T-Bond
- 111. 2-Year Forecast S&P500 Price and 30 Yr T-Bond Yield 2.0% 2.5% 3.0% 3.5% 4.0% 4.5% 5.0% 5.5% 6.0% 6.5% 7.0%700 900 1100 1300 1500 1700 1900 2100 00 01 02 03 04 05 06 07 08 09 10 11 12 13 14 15 16 InvertedScaleTreasuryBondYield March 2010 S&P 500 30 Yr T-Bond -35% -25% -15% -5% 5% 15% 25% 35% 00 01 02 03 04 05 06 07 08 09 10 11 12 13 14 15 16 Actual Annualized Return Over Next Two Years S&P 500 30 Yr T-Bond 10% 20% 30% 40% 50% 60% 70% 80% 00 01 02 03 04 05 06 07 08 09 10 11 12 13 14 15 16 Low Risk High Risk Estimated Probability of a Two Year Loss S&P 500 30 Yr T-Bond
- 112. 2-Year Forecast S&P500 Price and 30 Yr T-Bond Yield 2.0% 2.5% 3.0% 3.5% 4.0% 4.5% 5.0% 5.5% 6.0% 6.5% 7.0%700 900 1100 1300 1500 1700 1900 2100 00 01 02 03 04 05 06 07 08 09 10 11 12 13 14 15 16 InvertedScaleTreasuryBondYield April 2010 S&P 500 30 Yr T-Bond -35% -25% -15% -5% 5% 15% 25% 35% 00 01 02 03 04 05 06 07 08 09 10 11 12 13 14 15 16 Actual Annualized Return Over Next Two Years S&P 500 30 Yr T-Bond 10% 20% 30% 40% 50% 60% 70% 80% 00 01 02 03 04 05 06 07 08 09 10 11 12 13 14 15 16 Low Risk High Risk Estimated Probability of a Two Year Loss S&P 500 30 Yr T-Bond
- 113. 2-Year Forecast S&P500 Price and 30 Yr T-Bond Yield 2.0% 2.5% 3.0% 3.5% 4.0% 4.5% 5.0% 5.5% 6.0% 6.5% 7.0%700 900 1100 1300 1500 1700 1900 2100 00 01 02 03 04 05 06 07 08 09 10 11 12 13 14 15 16 InvertedScaleTreasuryBondYield May 2010 S&P 500 30 Yr T-Bond -35% -25% -15% -5% 5% 15% 25% 35% 00 01 02 03 04 05 06 07 08 09 10 11 12 13 14 15 16 Actual Annualized Return Over Next Two Years S&P 500 30 Yr T-Bond 10% 20% 30% 40% 50% 60% 70% 80% 00 01 02 03 04 05 06 07 08 09 10 11 12 13 14 15 16 Low Risk High Risk Estimated Probability of a Two Year Loss S&P 500 30 Yr T-Bond
- 114. 2-Year Forecast S&P500 Price and 30 Yr T-Bond Yield 2.0% 2.5% 3.0% 3.5% 4.0% 4.5% 5.0% 5.5% 6.0% 6.5% 7.0%700 900 1100 1300 1500 1700 1900 2100 00 01 02 03 04 05 06 07 08 09 10 11 12 13 14 15 16 InvertedScaleTreasuryBondYield June 2010 S&P 500 30 Yr T-Bond -35% -25% -15% -5% 5% 15% 25% 35% 00 01 02 03 04 05 06 07 08 09 10 11 12 13 14 15 16 Actual Annualized Return Over Next Two Years S&P 500 30 Yr T-Bond 10% 20% 30% 40% 50% 60% 70% 80% 00 01 02 03 04 05 06 07 08 09 10 11 12 13 14 15 16 Low Risk High Risk Estimated Probability of a Two Year Loss S&P 500 30 Yr T-Bond
- 115. 2-Year Forecast S&P500 Price and 30 Yr T-Bond Yield 2.0% 2.5% 3.0% 3.5% 4.0% 4.5% 5.0% 5.5% 6.0% 6.5% 7.0%700 900 1100 1300 1500 1700 1900 2100 00 01 02 03 04 05 06 07 08 09 10 11 12 13 14 15 16 InvertedScaleTreasuryBondYield July 2010 S&P 500 30 Yr T-Bond -35% -25% -15% -5% 5% 15% 25% 35% 00 01 02 03 04 05 06 07 08 09 10 11 12 13 14 15 16 Actual Annualized Return Over Next Two Years S&P 500 30 Yr T-Bond 10% 20% 30% 40% 50% 60% 70% 80% 00 01 02 03 04 05 06 07 08 09 10 11 12 13 14 15 16 Low Risk High Risk Estimated Probability of a Two Year Loss S&P 500 30 Yr T-Bond
- 116. 2-Year Forecast S&P500 Price and 30 Yr T-Bond Yield 2.0% 2.5% 3.0% 3.5% 4.0% 4.5% 5.0% 5.5% 6.0% 6.5% 7.0%700 900 1100 1300 1500 1700 1900 2100 00 01 02 03 04 05 06 07 08 09 10 11 12 13 14 15 16 InvertedScaleTreasuryBondYield August 2010 S&P 500 30 Yr T-Bond -35% -25% -15% -5% 5% 15% 25% 35% 00 01 02 03 04 05 06 07 08 09 10 11 12 13 14 15 16 Actual Annualized Return Over Next Two Years S&P 500 30 Yr T-Bond 10% 20% 30% 40% 50% 60% 70% 80% 00 01 02 03 04 05 06 07 08 09 10 11 12 13 14 15 16 Low Risk High Risk Estimated Probability of a Two Year Loss S&P 500 30 Yr T-Bond
- 117. 2-Year Forecast S&P500 Price and 30 Yr T-Bond Yield 2.0% 2.5% 3.0% 3.5% 4.0% 4.5% 5.0% 5.5% 6.0% 6.5% 7.0%700 900 1100 1300 1500 1700 1900 2100 00 01 02 03 04 05 06 07 08 09 10 11 12 13 14 15 16 InvertedScaleTreasuryBondYield September 2010 S&P 500 30 Yr T-Bond -35% -25% -15% -5% 5% 15% 25% 35% 00 01 02 03 04 05 06 07 08 09 10 11 12 13 14 15 16 Actual Annualized Return Over Next Two Years S&P 500 30 Yr T-Bond 10% 20% 30% 40% 50% 60% 70% 80% 00 01 02 03 04 05 06 07 08 09 10 11 12 13 14 15 16 Low Risk High Risk Estimated Probability of a Two Year Loss S&P 500 30 Yr T-Bond
- 118. 2-Year Forecast S&P500 Price and 30 Yr T-Bond Yield 2.0% 2.5% 3.0% 3.5% 4.0% 4.5% 5.0% 5.5% 6.0% 6.5% 7.0%700 900 1100 1300 1500 1700 1900 2100 00 01 02 03 04 05 06 07 08 09 10 11 12 13 14 15 16 InvertedScaleTreasuryBondYield October 2010 S&P 500 30 Yr T-Bond -35% -25% -15% -5% 5% 15% 25% 35% 00 01 02 03 04 05 06 07 08 09 10 11 12 13 14 15 16 Actual Annualized Return Over Next Two Years S&P 500 30 Yr T-Bond 10% 20% 30% 40% 50% 60% 70% 80% 00 01 02 03 04 05 06 07 08 09 10 11 12 13 14 15 16 Low Risk High Risk Estimated Probability of a Two Year Loss S&P 500 30 Yr T-Bond
- 119. 2-Year Forecast S&P500 Price and 30 Yr T-Bond Yield 2.0% 2.5% 3.0% 3.5% 4.0% 4.5% 5.0% 5.5% 6.0% 6.5% 7.0%700 900 1100 1300 1500 1700 1900 2100 00 01 02 03 04 05 06 07 08 09 10 11 12 13 14 15 16 InvertedScaleTreasuryBondYield November 2010 S&P 500 30 Yr T-Bond -35% -25% -15% -5% 5% 15% 25% 35% 00 01 02 03 04 05 06 07 08 09 10 11 12 13 14 15 16 Actual Annualized Return Over Next Two Years S&P 500 30 Yr T-Bond 10% 20% 30% 40% 50% 60% 70% 80% 00 01 02 03 04 05 06 07 08 09 10 11 12 13 14 15 16 Low Risk High Risk Estimated Probability of a Two Year Loss S&P 500 30 Yr T-Bond
- 120. 2-Year Forecast S&P500 Price and 30 Yr T-Bond Yield 2.0% 2.5% 3.0% 3.5% 4.0% 4.5% 5.0% 5.5% 6.0% 6.5% 7.0%700 900 1100 1300 1500 1700 1900 2100 00 01 02 03 04 05 06 07 08 09 10 11 12 13 14 15 16 InvertedScaleTreasuryBondYield December 2010 S&P 500 30 Yr T-Bond -35% -25% -15% -5% 5% 15% 25% 35% 00 01 02 03 04 05 06 07 08 09 10 11 12 13 14 15 16 Actual Annualized Return Over Next Two Years S&P 500 30 Yr T-Bond 10% 20% 30% 40% 50% 60% 70% 80% 00 01 02 03 04 05 06 07 08 09 10 11 12 13 14 15 16 Low Risk High Risk Estimated Probability of a Two Year Loss S&P 500 30 Yr T-Bond
- 121. 2-Year Forecast S&P500 Price and 30 Yr T-Bond Yield 2.0% 2.5% 3.0% 3.5% 4.0% 4.5% 5.0% 5.5% 6.0% 6.5% 7.0%700 900 1100 1300 1500 1700 1900 2100 00 01 02 03 04 05 06 07 08 09 10 11 12 13 14 15 16 InvertedScaleTreasuryBondYield January 2011 S&P 500 30 Yr T-Bond -35% -25% -15% -5% 5% 15% 25% 35% 00 01 02 03 04 05 06 07 08 09 10 11 12 13 14 15 16 Actual Annualized Return Over Next Two Years S&P 500 30 Yr T-Bond 10% 20% 30% 40% 50% 60% 70% 80% 00 01 02 03 04 05 06 07 08 09 10 11 12 13 14 15 16 Low Risk High Risk Estimated Probability of a Two Year Loss S&P 500 30 Yr T-Bond
- 122. 2-Year Forecast S&P500 Price and 30 Yr T-Bond Yield 2.0% 2.5% 3.0% 3.5% 4.0% 4.5% 5.0% 5.5% 6.0% 6.5% 7.0%700 900 1100 1300 1500 1700 1900 2100 00 01 02 03 04 05 06 07 08 09 10 11 12 13 14 15 16 InvertedScaleTreasuryBondYield February 2011 S&P 500 30 Yr T-Bond -35% -25% -15% -5% 5% 15% 25% 35% 00 01 02 03 04 05 06 07 08 09 10 11 12 13 14 15 16 Actual Annualized Return Over Next Two Years S&P 500 30 Yr T-Bond 10% 20% 30% 40% 50% 60% 70% 80% 00 01 02 03 04 05 06 07 08 09 10 11 12 13 14 15 16 Low Risk High Risk Estimated Probability of a Two Year Loss S&P 500 30 Yr T-Bond
- 123. 2-Year Forecast S&P500 Price and 30 Yr T-Bond Yield 2.0% 2.5% 3.0% 3.5% 4.0% 4.5% 5.0% 5.5% 6.0% 6.5% 7.0%700 900 1100 1300 1500 1700 1900 2100 00 01 02 03 04 05 06 07 08 09 10 11 12 13 14 15 16 InvertedScaleTreasuryBondYield March 2011 S&P 500 30 Yr T-Bond -35% -25% -15% -5% 5% 15% 25% 35% 00 01 02 03 04 05 06 07 08 09 10 11 12 13 14 15 16 Actual Annualized Return Over Next Two Years S&P 500 30 Yr T-Bond 10% 20% 30% 40% 50% 60% 70% 80% 00 01 02 03 04 05 06 07 08 09 10 11 12 13 14 15 16 Low Risk High Risk Estimated Probability of a Two Year Loss S&P 500 30 Yr T-Bond
- 124. 2-Year Forecast S&P500 Price and 30 Yr T-Bond Yield 2.0% 2.5% 3.0% 3.5% 4.0% 4.5% 5.0% 5.5% 6.0% 6.5% 7.0%700 900 1100 1300 1500 1700 1900 2100 00 01 02 03 04 05 06 07 08 09 10 11 12 13 14 15 16 InvertedScaleTreasuryBondYield April 2011 S&P 500 30 Yr T-Bond -35% -25% -15% -5% 5% 15% 25% 35% 00 01 02 03 04 05 06 07 08 09 10 11 12 13 14 15 16 Actual Annualized Return Over Next Two Years S&P 500 30 Yr T-Bond 10% 20% 30% 40% 50% 60% 70% 80% 00 01 02 03 04 05 06 07 08 09 10 11 12 13 14 15 16 Low Risk High Risk Estimated Probability of a Two Year Loss S&P 500 30 Yr T-Bond
- 125. 2-Year Forecast S&P500 Price and 30 Yr T-Bond Yield 2.0% 2.5% 3.0% 3.5% 4.0% 4.5% 5.0% 5.5% 6.0% 6.5% 7.0%700 900 1100 1300 1500 1700 1900 2100 00 01 02 03 04 05 06 07 08 09 10 11 12 13 14 15 16 InvertedScaleTreasuryBondYield May 2011 S&P 500 30 Yr T-Bond -35% -25% -15% -5% 5% 15% 25% 35% 00 01 02 03 04 05 06 07 08 09 10 11 12 13 14 15 16 Actual Annualized Return Over Next Two Years S&P 500 30 Yr T-Bond 10% 20% 30% 40% 50% 60% 70% 80% 00 01 02 03 04 05 06 07 08 09 10 11 12 13 14 15 16 Low Risk High Risk Estimated Probability of a Two Year Loss S&P 500 30 Yr T-Bond
- 126. 2-Year Forecast S&P500 Price and 30 Yr T-Bond Yield 2.0% 2.5% 3.0% 3.5% 4.0% 4.5% 5.0% 5.5% 6.0% 6.5% 7.0%700 900 1100 1300 1500 1700 1900 2100 00 01 02 03 04 05 06 07 08 09 10 11 12 13 14 15 16 InvertedScaleTreasuryBondYield June 2011 S&P 500 30 Yr T-Bond -35% -25% -15% -5% 5% 15% 25% 35% 00 01 02 03 04 05 06 07 08 09 10 11 12 13 14 15 16 Actual Annualized Return Over Next Two Years S&P 500 30 Yr T-Bond 10% 20% 30% 40% 50% 60% 70% 80% 00 01 02 03 04 05 06 07 08 09 10 11 12 13 14 15 16 Low Risk High Risk Estimated Probability of a Two Year Loss S&P 500 30 Yr T-Bond
- 127. 2-Year Forecast S&P500 Price and 30 Yr T-Bond Yield 2.0% 2.5% 3.0% 3.5% 4.0% 4.5% 5.0% 5.5% 6.0% 6.5% 7.0%700 900 1100 1300 1500 1700 1900 2100 00 01 02 03 04 05 06 07 08 09 10 11 12 13 14 15 16 InvertedScaleTreasuryBondYield July 2011 S&P 500 30 Yr T-Bond -35% -25% -15% -5% 5% 15% 25% 35% 00 01 02 03 04 05 06 07 08 09 10 11 12 13 14 15 16 Actual Annualized Return Over Next Two Years S&P 500 30 Yr T-Bond 10% 20% 30% 40% 50% 60% 70% 80% 00 01 02 03 04 05 06 07 08 09 10 11 12 13 14 15 16 Low Risk High Risk Estimated Probability of a Two Year Loss S&P 500 30 Yr T-Bond
- 128. 2-Year Forecast S&P500 Price and 30 Yr T-Bond Yield 2.0% 2.5% 3.0% 3.5% 4.0% 4.5% 5.0% 5.5% 6.0% 6.5% 7.0%700 900 1100 1300 1500 1700 1900 2100 00 01 02 03 04 05 06 07 08 09 10 11 12 13 14 15 16 InvertedScaleTreasuryBondYield August 2011 S&P 500 30 Yr T-Bond -35% -25% -15% -5% 5% 15% 25% 35% 00 01 02 03 04 05 06 07 08 09 10 11 12 13 14 15 16 Actual Annualized Return Over Next Two Years S&P 500 30 Yr T-Bond 10% 20% 30% 40% 50% 60% 70% 80% 00 01 02 03 04 05 06 07 08 09 10 11 12 13 14 15 16 Low Risk High Risk Estimated Probability of a Two Year Loss S&P 500 30 Yr T-Bond
- 129. 2-Year Forecast S&P500 Price and 30 Yr T-Bond Yield 2.0% 2.5% 3.0% 3.5% 4.0% 4.5% 5.0% 5.5% 6.0% 6.5% 7.0%700 900 1100 1300 1500 1700 1900 2100 00 01 02 03 04 05 06 07 08 09 10 11 12 13 14 15 16 InvertedScaleTreasuryBondYield September 2011 S&P 500 30 Yr T-Bond -35% -25% -15% -5% 5% 15% 25% 35% 00 01 02 03 04 05 06 07 08 09 10 11 12 13 14 15 16 Actual Annualized Return Over Next Two Years S&P 500 30 Yr T-Bond 10% 20% 30% 40% 50% 60% 70% 80% 00 01 02 03 04 05 06 07 08 09 10 11 12 13 14 15 16 Low Risk High Risk Estimated Probability of a Two Year Loss S&P 500 30 Yr T-Bond
- 130. 2-Year Forecast S&P500 Price and 30 Yr T-Bond Yield 2.0% 2.5% 3.0% 3.5% 4.0% 4.5% 5.0% 5.5% 6.0% 6.5% 7.0%700 900 1100 1300 1500 1700 1900 2100 00 01 02 03 04 05 06 07 08 09 10 11 12 13 14 15 16 InvertedScaleTreasuryBondYield October 2011 S&P 500 30 Yr T-Bond -35% -25% -15% -5% 5% 15% 25% 35% 00 01 02 03 04 05 06 07 08 09 10 11 12 13 14 15 16 Actual Annualized Return Over Next Two Years S&P 500 30 Yr T-Bond 10% 20% 30% 40% 50% 60% 70% 80% 00 01 02 03 04 05 06 07 08 09 10 11 12 13 14 15 16 Low Risk High Risk Estimated Probability of a Two Year Loss S&P 500 30 Yr T-Bond
- 131. 2-Year Forecast S&P500 Price and 30 Yr T-Bond Yield 2.0% 2.5% 3.0% 3.5% 4.0% 4.5% 5.0% 5.5% 6.0% 6.5% 7.0%700 900 1100 1300 1500 1700 1900 2100 00 01 02 03 04 05 06 07 08 09 10 11 12 13 14 15 16 InvertedScaleTreasuryBondYield November 2011 S&P 500 30 Yr T-Bond -35% -25% -15% -5% 5% 15% 25% 35% 00 01 02 03 04 05 06 07 08 09 10 11 12 13 14 15 16 Actual Annualized Return Over Next Two Years S&P 500 30 Yr T-Bond 10% 20% 30% 40% 50% 60% 70% 80% 00 01 02 03 04 05 06 07 08 09 10 11 12 13 14 15 16 Low Risk High Risk Estimated Probability of a Two Year Loss S&P 500 30 Yr T-Bond
- 132. 2-Year Forecast S&P500 Price and 30 Yr T-Bond Yield 2.0% 2.5% 3.0% 3.5% 4.0% 4.5% 5.0% 5.5% 6.0% 6.5% 7.0%700 900 1100 1300 1500 1700 1900 2100 00 01 02 03 04 05 06 07 08 09 10 11 12 13 14 15 16 InvertedScaleTreasuryBondYield December 2011 S&P 500 30 Yr T-Bond -35% -25% -15% -5% 5% 15% 25% 35% 00 01 02 03 04 05 06 07 08 09 10 11 12 13 14 15 16 Actual Annualized Return Over Next Two Years S&P 500 30 Yr T-Bond 10% 20% 30% 40% 50% 60% 70% 80% 00 01 02 03 04 05 06 07 08 09 10 11 12 13 14 15 16 Low Risk High Risk Estimated Probability of a Two Year Loss S&P 500 30 Yr T-Bond
- 133. 2-Year Forecast S&P500 Price and 30 Yr T-Bond Yield 2.0% 2.5% 3.0% 3.5% 4.0% 4.5% 5.0% 5.5% 6.0% 6.5% 7.0%700 900 1100 1300 1500 1700 1900 2100 00 01 02 03 04 05 06 07 08 09 10 11 12 13 14 15 16 InvertedScaleTreasuryBondYield January 2012 S&P 500 30 Yr T-Bond -35% -25% -15% -5% 5% 15% 25% 35% 00 01 02 03 04 05 06 07 08 09 10 11 12 13 14 15 16 Actual Annualized Return Over Next Two Years S&P 500 30 Yr T-Bond 10% 20% 30% 40% 50% 60% 70% 80% 00 01 02 03 04 05 06 07 08 09 10 11 12 13 14 15 16 Low Risk High Risk Estimated Probability of a Two Year Loss S&P 500 30 Yr T-Bond
- 134. 2-Year Forecast S&P500 Price and 30 Yr T-Bond Yield 2.0% 2.5% 3.0% 3.5% 4.0% 4.5% 5.0% 5.5% 6.0% 6.5% 7.0%700 900 1100 1300 1500 1700 1900 2100 00 01 02 03 04 05 06 07 08 09 10 11 12 13 14 15 16 InvertedScaleTreasuryBondYield February 2012 S&P 500 30 Yr T-Bond -35% -25% -15% -5% 5% 15% 25% 35% 00 01 02 03 04 05 06 07 08 09 10 11 12 13 14 15 16 Actual Annualized Return Over Next Two Years S&P 500 30 Yr T-Bond 10% 20% 30% 40% 50% 60% 70% 80% 00 01 02 03 04 05 06 07 08 09 10 11 12 13 14 15 16 Low Risk High Risk Estimated Probability of a Two Year Loss S&P 500 30 Yr T-Bond
- 135. 2-Year Forecast S&P500 Price and 30 Yr T-Bond Yield 2.0% 2.5% 3.0% 3.5% 4.0% 4.5% 5.0% 5.5% 6.0% 6.5% 7.0%700 900 1100 1300 1500 1700 1900 2100 00 01 02 03 04 05 06 07 08 09 10 11 12 13 14 15 16 InvertedScaleTreasuryBondYield March 2012 S&P 500 30 Yr T-Bond -35% -25% -15% -5% 5% 15% 25% 35% 00 01 02 03 04 05 06 07 08 09 10 11 12 13 14 15 16 Actual Annualized Return Over Next Two Years S&P 500 30 Yr T-Bond 10% 20% 30% 40% 50% 60% 70% 80% 00 01 02 03 04 05 06 07 08 09 10 11 12 13 14 15 16 Low Risk High Risk Estimated Probability of a Two Year Loss S&P 500 30 Yr T-Bond
- 136. 2-Year Forecast S&P500 Price and 30 Yr T-Bond Yield 2.0% 2.5% 3.0% 3.5% 4.0% 4.5% 5.0% 5.5% 6.0% 6.5% 7.0%700 900 1100 1300 1500 1700 1900 2100 00 01 02 03 04 05 06 07 08 09 10 11 12 13 14 15 16 InvertedScaleTreasuryBondYield April 2012 S&P 500 30 Yr T-Bond -35% -25% -15% -5% 5% 15% 25% 35% 00 01 02 03 04 05 06 07 08 09 10 11 12 13 14 15 16 Actual Annualized Return Over Next Two Years S&P 500 30 Yr T-Bond 10% 20% 30% 40% 50% 60% 70% 80% 00 01 02 03 04 05 06 07 08 09 10 11 12 13 14 15 16 Low Risk High Risk Estimated Probability of a Two Year Loss S&P 500 30 Yr T-Bond
- 137. 2-Year Forecast S&P500 Price and 30 Yr T-Bond Yield 2.0% 2.5% 3.0% 3.5% 4.0% 4.5% 5.0% 5.5% 6.0% 6.5% 7.0%700 900 1100 1300 1500 1700 1900 2100 00 01 02 03 04 05 06 07 08 09 10 11 12 13 14 15 16 InvertedScaleTreasuryBondYield May 2012 S&P 500 30 Yr T-Bond -35% -25% -15% -5% 5% 15% 25% 35% 00 01 02 03 04 05 06 07 08 09 10 11 12 13 14 15 16 Actual Annualized Return Over Next Two Years S&P 500 30 Yr T-Bond 10% 20% 30% 40% 50% 60% 70% 80% 00 01 02 03 04 05 06 07 08 09 10 11 12 13 14 15 16 Low Risk High Risk Estimated Probability of a Two Year Loss S&P 500 30 Yr T-Bond
- 138. 2-Year Forecast S&P500 Price and 30 Yr T-Bond Yield 2.0% 2.5% 3.0% 3.5% 4.0% 4.5% 5.0% 5.5% 6.0% 6.5% 7.0%700 900 1100 1300 1500 1700 1900 2100 00 01 02 03 04 05 06 07 08 09 10 11 12 13 14 15 16 InvertedScaleTreasuryBondYield June 2012 S&P 500 30 Yr T-Bond -35% -25% -15% -5% 5% 15% 25% 35% 00 01 02 03 04 05 06 07 08 09 10 11 12 13 14 15 16 Actual Annualized Return Over Next Two Years S&P 500 30 Yr T-Bond 10% 20% 30% 40% 50% 60% 70% 80% 00 01 02 03 04 05 06 07 08 09 10 11 12 13 14 15 16 Low Risk High Risk Estimated Probability of a Two Year Loss S&P 500 30 Yr T-Bond
- 139. 2-Year Forecast S&P500 Price and 30 Yr T-Bond Yield 2.0% 2.5% 3.0% 3.5% 4.0% 4.5% 5.0% 5.5% 6.0% 6.5% 7.0%700 900 1100 1300 1500 1700 1900 2100 00 01 02 03 04 05 06 07 08 09 10 11 12 13 14 15 16 InvertedScaleTreasuryBondYield July 2012 S&P 500 30 Yr T-Bond -35% -25% -15% -5% 5% 15% 25% 35% 00 01 02 03 04 05 06 07 08 09 10 11 12 13 14 15 16 Actual Annualized Return Over Next Two Years S&P 500 30 Yr T-Bond 10% 20% 30% 40% 50% 60% 70% 80% 00 01 02 03 04 05 06 07 08 09 10 11 12 13 14 15 16 Low Risk High Risk Estimated Probability of a Two Year Loss S&P 500 30 Yr T-Bond
- 140. 2-Year Forecast S&P500 Price and 30 Yr T-Bond Yield 2.0% 2.5% 3.0% 3.5% 4.0% 4.5% 5.0% 5.5% 6.0% 6.5% 7.0%700 900 1100 1300 1500 1700 1900 2100 00 01 02 03 04 05 06 07 08 09 10 11 12 13 14 15 16 InvertedScaleTreasuryBondYield August 2012 S&P 500 30 Yr T-Bond -35% -25% -15% -5% 5% 15% 25% 35% 00 01 02 03 04 05 06 07 08 09 10 11 12 13 14 15 16 Actual Annualized Return Over Next Two Years S&P 500 30 Yr T-Bond 10% 20% 30% 40% 50% 60% 70% 80% 00 01 02 03 04 05 06 07 08 09 10 11 12 13 14 15 16 Low Risk High Risk Estimated Probability of a Two Year Loss S&P 500 30 Yr T-Bond
- 141. 2-Year Forecast S&P500 Price and 30 Yr T-Bond Yield 2.0% 2.5% 3.0% 3.5% 4.0% 4.5% 5.0% 5.5% 6.0% 6.5% 7.0%700 900 1100 1300 1500 1700 1900 2100 00 01 02 03 04 05 06 07 08 09 10 11 12 13 14 15 16 InvertedScaleTreasuryBondYield September 2012 S&P 500 30 Yr T-Bond -35% -25% -15% -5% 5% 15% 25% 35% 00 01 02 03 04 05 06 07 08 09 10 11 12 13 14 15 16 Actual Annualized Return Over Next Two Years S&P 500 30 Yr T-Bond 10% 20% 30% 40% 50% 60% 70% 80% 00 01 02 03 04 05 06 07 08 09 10 11 12 13 14 15 16 Low Risk High Risk Estimated Probability of a Two Year Loss S&P 500 30 Yr T-Bond
- 142. 2-Year Forecast S&P500 Price and 30 Yr T-Bond Yield 2.0% 2.5% 3.0% 3.5% 4.0% 4.5% 5.0% 5.5% 6.0% 6.5% 7.0%700 900 1100 1300 1500 1700 1900 2100 00 01 02 03 04 05 06 07 08 09 10 11 12 13 14 15 16 InvertedScaleTreasuryBondYield October 2012 S&P 500 30 Yr T-Bond -35% -25% -15% -5% 5% 15% 25% 35% 00 01 02 03 04 05 06 07 08 09 10 11 12 13 14 15 16 Actual Annualized Return Over Next Two Years S&P 500 30 Yr T-Bond 10% 20% 30% 40% 50% 60% 70% 80% 00 01 02 03 04 05 06 07 08 09 10 11 12 13 14 15 16 Low Risk High Risk Estimated Probability of a Two Year Loss S&P 500 30 Yr T-Bond
- 143. 2-Year Forecast S&P500 Price and 30 Yr T-Bond Yield 2.0% 2.5% 3.0% 3.5% 4.0% 4.5% 5.0% 5.5% 6.0% 6.5% 7.0%700 900 1100 1300 1500 1700 1900 2100 00 01 02 03 04 05 06 07 08 09 10 11 12 13 14 15 16 InvertedScaleTreasuryBondYield November 2012 S&P 500 30 Yr T-Bond -35% -25% -15% -5% 5% 15% 25% 35% 00 01 02 03 04 05 06 07 08 09 10 11 12 13 14 15 16 Actual Annualized Return Over Next Two Years S&P 500 30 Yr T-Bond 10% 20% 30% 40% 50% 60% 70% 80% 00 01 02 03 04 05 06 07 08 09 10 11 12 13 14 15 16 Low Risk High Risk Estimated Probability of a Two Year Loss S&P 500 30 Yr T-Bond
- 144. 2-Year Forecast S&P500 Price and 30 Yr T-Bond Yield 2.0% 2.5% 3.0% 3.5% 4.0% 4.5% 5.0% 5.5% 6.0% 6.5% 7.0%700 900 1100 1300 1500 1700 1900 2100 00 01 02 03 04 05 06 07 08 09 10 11 12 13 14 15 16 InvertedScaleTreasuryBondYield December 2012 S&P 500 30 Yr T-Bond -35% -25% -15% -5% 5% 15% 25% 35% 00 01 02 03 04 05 06 07 08 09 10 11 12 13 14 15 16 Actual Annualized Return Over Next Two Years S&P 500 30 Yr T-Bond 10% 20% 30% 40% 50% 60% 70% 80% 00 01 02 03 04 05 06 07 08 09 10 11 12 13 14 15 16 Low Risk High Risk Estimated Probability of a Two Year Loss S&P 500 30 Yr T-Bond
- 145. 2-Year Forecast S&P500 Price and 30 Yr T-Bond Yield 2.0% 2.5% 3.0% 3.5% 4.0% 4.5% 5.0% 5.5% 6.0% 6.5% 7.0%700 900 1100 1300 1500 1700 1900 2100 00 01 02 03 04 05 06 07 08 09 10 11 12 13 14 15 16 InvertedScaleTreasuryBondYield January 2013 S&P 500 30 Yr T-Bond -35% -25% -15% -5% 5% 15% 25% 35% 00 01 02 03 04 05 06 07 08 09 10 11 12 13 14 15 16 Actual Annualized Return Over Next Two Years S&P 500 30 Yr T-Bond 10% 20% 30% 40% 50% 60% 70% 80% 00 01 02 03 04 05 06 07 08 09 10 11 12 13 14 15 16 Low Risk High Risk Estimated Probability of a Two Year Loss S&P 500 30 Yr T-Bond
- 146. 2-Year Forecast S&P500 Price and 30 Yr T-Bond Yield 2.0% 2.5% 3.0% 3.5% 4.0% 4.5% 5.0% 5.5% 6.0% 6.5% 7.0%700 900 1100 1300 1500 1700 1900 2100 00 01 02 03 04 05 06 07 08 09 10 11 12 13 14 15 16 InvertedScaleTreasuryBondYield February 2013 S&P 500 30 Yr T-Bond -35% -25% -15% -5% 5% 15% 25% 35% 00 01 02 03 04 05 06 07 08 09 10 11 12 13 14 15 16 Actual Annualized Return Over Next Two Years S&P 500 30 Yr T-Bond 10% 20% 30% 40% 50% 60% 70% 80% 00 01 02 03 04 05 06 07 08 09 10 11 12 13 14 15 16 Low Risk High Risk Estimated Probability of a Two Year Loss S&P 500 30 Yr T-Bond
- 147. 2-Year Forecast S&P500 Price and 30 Yr T-Bond Yield 2.0% 2.5% 3.0% 3.5% 4.0% 4.5% 5.0% 5.5% 6.0% 6.5% 7.0%700 900 1100 1300 1500 1700 1900 2100 00 01 02 03 04 05 06 07 08 09 10 11 12 13 14 15 16 InvertedScaleTreasuryBondYield March 2013 S&P 500 30 Yr T-Bond -35% -25% -15% -5% 5% 15% 25% 35% 00 01 02 03 04 05 06 07 08 09 10 11 12 13 14 15 16 Actual Annualized Return Over Next Two Years S&P 500 30 Yr T-Bond 10% 20% 30% 40% 50% 60% 70% 80% 00 01 02 03 04 05 06 07 08 09 10 11 12 13 14 15 16 Low Risk High Risk Estimated Probability of a Two Year Loss S&P 500 30 Yr T-Bond
- 148. 2-Year Forecast S&P500 Price and 30 Yr T-Bond Yield 2.0% 2.5% 3.0% 3.5% 4.0% 4.5% 5.0% 5.5% 6.0% 6.5% 7.0%700 900 1100 1300 1500 1700 1900 2100 00 01 02 03 04 05 06 07 08 09 10 11 12 13 14 15 16 InvertedScaleTreasuryBondYield April 2013 S&P 500 30 Yr T-Bond -35% -25% -15% -5% 5% 15% 25% 35% 00 01 02 03 04 05 06 07 08 09 10 11 12 13 14 15 16 Actual Annualized Return Over Next Two Years S&P 500 30 Yr T-Bond 10% 20% 30% 40% 50% 60% 70% 80% 00 01 02 03 04 05 06 07 08 09 10 11 12 13 14 15 16 Low Risk High Risk Estimated Probability of a Two Year Loss S&P 500 30 Yr T-Bond
- 149. 2-Year Forecast S&P500 Price and 30 Yr T-Bond Yield 2.0% 2.5% 3.0% 3.5% 4.0% 4.5% 5.0% 5.5% 6.0% 6.5% 7.0%700 900 1100 1300 1500 1700 1900 2100 00 01 02 03 04 05 06 07 08 09 10 11 12 13 14 15 16 InvertedScaleTreasuryBondYield May 2013 S&P 500 30 Yr T-Bond -35% -25% -15% -5% 5% 15% 25% 35% 00 01 02 03 04 05 06 07 08 09 10 11 12 13 14 15 16 Actual Annualized Return Over Next Two Years S&P 500 30 Yr T-Bond 10% 20% 30% 40% 50% 60% 70% 80% 00 01 02 03 04 05 06 07 08 09 10 11 12 13 14 15 16 Low Risk High Risk Estimated Probability of a Two Year Loss S&P 500 30 Yr T-Bond
- 150. 2-Year Forecast S&P500 Price and 30 Yr T-Bond Yield 2.0% 2.5% 3.0% 3.5% 4.0% 4.5% 5.0% 5.5% 6.0% 6.5% 7.0%700 900 1100 1300 1500 1700 1900 2100 00 01 02 03 04 05 06 07 08 09 10 11 12 13 14 15 16 InvertedScaleTreasuryBondYield June 2013 S&P 500 30 Yr T-Bond -35% -25% -15% -5% 5% 15% 25% 35% 00 01 02 03 04 05 06 07 08 09 10 11 12 13 14 15 16 Actual Annualized Return Over Next Two Years S&P 500 30 Yr T-Bond 10% 20% 30% 40% 50% 60% 70% 80% 00 01 02 03 04 05 06 07 08 09 10 11 12 13 14 15 16 Low Risk High Risk Estimated Probability of a Two Year Loss S&P 500 30 Yr T-Bond
- 151. 2-Year Forecast S&P500 Price and 30 Yr T-Bond Yield 2.0% 2.5% 3.0% 3.5% 4.0% 4.5% 5.0% 5.5% 6.0% 6.5% 7.0%700 900 1100 1300 1500 1700 1900 2100 00 01 02 03 04 05 06 07 08 09 10 11 12 13 14 15 16 InvertedScaleTreasuryBondYield July 2013 S&P 500 30 Yr T-Bond -35% -25% -15% -5% 5% 15% 25% 35% 00 01 02 03 04 05 06 07 08 09 10 11 12 13 14 15 16 Actual Annualized Return Over Next Two Years S&P 500 30 Yr T-Bond 10% 20% 30% 40% 50% 60% 70% 80% 00 01 02 03 04 05 06 07 08 09 10 11 12 13 14 15 16 Low Risk High Risk Estimated Probability of a Two Year Loss S&P 500 30 Yr T-Bond
- 152. 2-Year Forecast S&P500 Price and 30 Yr T-Bond Yield 2.0% 2.5% 3.0% 3.5% 4.0% 4.5% 5.0% 5.5% 6.0% 6.5% 7.0%700 900 1100 1300 1500 1700 1900 2100 00 01 02 03 04 05 06 07 08 09 10 11 12 13 14 15 16 InvertedScaleTreasuryBondYield August 2013 S&P 500 30 Yr T-Bond -35% -25% -15% -5% 5% 15% 25% 35% 00 01 02 03 04 05 06 07 08 09 10 11 12 13 14 15 16 Actual Annualized Return Over Next Two Years S&P 500 30 Yr T-Bond 10% 20% 30% 40% 50% 60% 70% 80% 00 01 02 03 04 05 06 07 08 09 10 11 12 13 14 15 16 Low Risk High Risk Estimated Probability of a Two Year Loss S&P 500 30 Yr T-Bond
- 153. 2-Year Forecast S&P500 Price and 30 Yr T-Bond Yield 2.0% 2.5% 3.0% 3.5% 4.0% 4.5% 5.0% 5.5% 6.0% 6.5% 7.0%700 900 1100 1300 1500 1700 1900 2100 00 01 02 03 04 05 06 07 08 09 10 11 12 13 14 15 16 InvertedScaleTreasuryBondYield September 2013 S&P 500 30 Yr T-Bond -35% -25% -15% -5% 5% 15% 25% 35% 00 01 02 03 04 05 06 07 08 09 10 11 12 13 14 15 16 Actual Annualized Return Over Next Two Years S&P 500 30 Yr T-Bond 10% 20% 30% 40% 50% 60% 70% 80% 00 01 02 03 04 05 06 07 08 09 10 11 12 13 14 15 16 Low Risk High Risk Estimated Probability of a Two Year Loss S&P 500 30 Yr T-Bond
- 154. 2-Year Forecast S&P500 Price and 30 Yr T-Bond Yield 2.0% 2.5% 3.0% 3.5% 4.0% 4.5% 5.0% 5.5% 6.0% 6.5% 7.0%700 900 1100 1300 1500 1700 1900 2100 00 01 02 03 04 05 06 07 08 09 10 11 12 13 14 15 16 InvertedScaleTreasuryBondYield October 2013 S&P 500 30 Yr T-Bond -35% -25% -15% -5% 5% 15% 25% 35% 00 01 02 03 04 05 06 07 08 09 10 11 12 13 14 15 16 Actual Annualized Return Over Next Two Years S&P 500 30 Yr T-Bond 10% 20% 30% 40% 50% 60% 70% 80% 00 01 02 03 04 05 06 07 08 09 10 11 12 13 14 15 16 Low Risk High Risk Estimated Probability of a Two Year Loss S&P 500 30 Yr T-Bond
- 155. 2-Year Forecast S&P500 Price and 30 Yr T-Bond Yield 2.0% 2.5% 3.0% 3.5% 4.0% 4.5% 5.0% 5.5% 6.0% 6.5% 7.0%700 900 1100 1300 1500 1700 1900 2100 00 01 02 03 04 05 06 07 08 09 10 11 12 13 14 15 16 InvertedScaleTreasuryBondYield November 2013 S&P 500 30 Yr T-Bond -35% -25% -15% -5% 5% 15% 25% 35% 00 01 02 03 04 05 06 07 08 09 10 11 12 13 14 15 16 Actual Annualized Return Over Next Two Years S&P 500 30 Yr T-Bond 10% 20% 30% 40% 50% 60% 70% 80% 00 01 02 03 04 05 06 07 08 09 10 11 12 13 14 15 16 Low Risk High Risk Estimated Probability of a Two Year Loss S&P 500 30 Yr T-Bond
- 156. 2-Year Forecast S&P500 Price and 30 Yr T-Bond Yield 2.0% 2.5% 3.0% 3.5% 4.0% 4.5% 5.0% 5.5% 6.0% 6.5% 7.0%700 900 1100 1300 1500 1700 1900 2100 00 01 02 03 04 05 06 07 08 09 10 11 12 13 14 15 16 InvertedScaleTreasuryBondYield December 2013 S&P 500 30 Yr T-Bond -35% -25% -15% -5% 5% 15% 25% 35% 00 01 02 03 04 05 06 07 08 09 10 11 12 13 14 15 16 Actual Annualized Return Over Next Two Years S&P 500 30 Yr T-Bond 10% 20% 30% 40% 50% 60% 70% 80% 00 01 02 03 04 05 06 07 08 09 10 11 12 13 14 15 16 Low Risk High Risk Estimated Probability of a Two Year Loss S&P 500 30 Yr T-Bond
- 157. 2-Year Forecast S&P500 Price and 30 Yr T-Bond Yield 2.0% 2.5% 3.0% 3.5% 4.0% 4.5% 5.0% 5.5% 6.0% 6.5% 7.0%700 900 1100 1300 1500 1700 1900 2100 00 01 02 03 04 05 06 07 08 09 10 11 12 13 14 15 16 InvertedScaleTreasuryBondYield January 2014 S&P 500 30 Yr T-Bond -35% -25% -15% -5% 5% 15% 25% 35% 00 01 02 03 04 05 06 07 08 09 10 11 12 13 14 15 16 Actual Annualized Return Over Next Two Years S&P 500 30 Yr T-Bond 10% 20% 30% 40% 50% 60% 70% 80% 00 01 02 03 04 05 06 07 08 09 10 11 12 13 14 15 16 Low Risk High Risk Estimated Probability of a Two Year Loss S&P 500 30 Yr T-Bond
- 158. 2-Year Forecast S&P500 Price and 30 Yr T-Bond Yield 2.0% 2.5% 3.0% 3.5% 4.0% 4.5% 5.0% 5.5% 6.0% 6.5% 7.0%700 900 1100 1300 1500 1700 1900 2100 00 01 02 03 04 05 06 07 08 09 10 11 12 13 14 15 16 InvertedScaleTreasuryBondYield February 2014 S&P 500 30 Yr T-Bond -35% -25% -15% -5% 5% 15% 25% 35% 00 01 02 03 04 05 06 07 08 09 10 11 12 13 14 15 16 Actual Annualized Return Over Next Two Years S&P 500 30 Yr T-Bond 10% 20% 30% 40% 50% 60% 70% 80% 00 01 02 03 04 05 06 07 08 09 10 11 12 13 14 15 16 Low Risk High Risk Estimated Probability of a Two Year Loss S&P 500 30 Yr T-Bond
- 159. 2-Year Forecast S&P500 Price and 30 Yr T-Bond Yield 2.0% 2.5% 3.0% 3.5% 4.0% 4.5% 5.0% 5.5% 6.0% 6.5% 7.0%700 900 1100 1300 1500 1700 1900 2100 00 01 02 03 04 05 06 07 08 09 10 11 12 13 14 15 16 InvertedScaleTreasuryBondYield March 2014 S&P 500 30 Yr T-Bond -35% -25% -15% -5% 5% 15% 25% 35% 00 01 02 03 04 05 06 07 08 09 10 11 12 13 14 15 16 Actual Annualized Return Over Next Two Years S&P 500 30 Yr T-Bond 10% 20% 30% 40% 50% 60% 70% 80% 00 01 02 03 04 05 06 07 08 09 10 11 12 13 14 15 16 Low Risk High Risk Estimated Probability of a Two Year Loss S&P 500 30 Yr T-Bond
- 160. 2-Year Forecast S&P500 Price and 30 Yr T-Bond Yield 2.0% 2.5% 3.0% 3.5% 4.0% 4.5% 5.0% 5.5% 6.0% 6.5% 7.0%700 900 1100 1300 1500 1700 1900 2100 00 01 02 03 04 05 06 07 08 09 10 11 12 13 14 15 16 InvertedScaleTreasuryBondYield April 2014 S&P 500 30 Yr T-Bond -35% -25% -15% -5% 5% 15% 25% 35% 00 01 02 03 04 05 06 07 08 09 10 11 12 13 14 15 16 Actual Annualized Return Over Next Two Years S&P 500 30 Yr T-Bond 10% 20% 30% 40% 50% 60% 70% 80% 00 01 02 03 04 05 06 07 08 09 10 11 12 13 14 15 16 Low Risk High Risk Estimated Probability of a Two Year Loss S&P 500 30 Yr T-Bond
- 161. 2-Year Forecast S&P500 Price and 30 Yr T-Bond Yield 2.0% 2.5% 3.0% 3.5% 4.0% 4.5% 5.0% 5.5% 6.0% 6.5% 7.0%700 900 1100 1300 1500 1700 1900 2100 00 01 02 03 04 05 06 07 08 09 10 11 12 13 14 15 16 InvertedScaleTreasuryBondYield May 2014 S&P 500 30 Yr T-Bond -35% -25% -15% -5% 5% 15% 25% 35% 00 01 02 03 04 05 06 07 08 09 10 11 12 13 14 15 16 Actual Annualized Return Over Next Two Years S&P 500 30 Yr T-Bond 10% 20% 30% 40% 50% 60% 70% 80% 00 01 02 03 04 05 06 07 08 09 10 11 12 13 14 15 16 Low Risk High Risk Estimated Probability of a Two Year Loss S&P 500 30 Yr T-Bond
- 162. 2-Year Forecast S&P500 Price and 30 Yr T-Bond Yield 2.0% 2.5% 3.0% 3.5% 4.0% 4.5% 5.0% 5.5% 6.0% 6.5% 7.0%700 900 1100 1300 1500 1700 1900 2100 00 01 02 03 04 05 06 07 08 09 10 11 12 13 14 15 16 InvertedScaleTreasuryBondYield June 2014 S&P 500 30 Yr T-Bond -35% -25% -15% -5% 5% 15% 25% 35% 00 01 02 03 04 05 06 07 08 09 10 11 12 13 14 15 16 Actual Annualized Return Over Next Two Years S&P 500 30 Yr T-Bond 10% 20% 30% 40% 50% 60% 70% 80% 00 01 02 03 04 05 06 07 08 09 10 11 12 13 14 15 16 Low Risk High Risk Estimated Probability of a Two Year Loss S&P 500 30 Yr T-Bond
- 163. 2-Year Forecast S&P500 Price and 30 Yr T-Bond Yield 2.0% 2.5% 3.0% 3.5% 4.0% 4.5% 5.0% 5.5% 6.0% 6.5% 7.0%700 900 1100 1300 1500 1700 1900 2100 00 01 02 03 04 05 06 07 08 09 10 11 12 13 14 15 16 InvertedScaleTreasuryBondYield July 2014 S&P 500 30 Yr T-Bond -35% -25% -15% -5% 5% 15% 25% 35% 00 01 02 03 04 05 06 07 08 09 10 11 12 13 14 15 16 Actual Annualized Return Over Next Two Years S&P 500 30 Yr T-Bond 10% 20% 30% 40% 50% 60% 70% 80% 00 01 02 03 04 05 06 07 08 09 10 11 12 13 14 15 16 Low Risk High Risk Estimated Probability of a Two Year Loss S&P 500 30 Yr T-Bond