Effective Technical Report Writing 14 - 15 January 2015 Kuala Lumpur / 19 - 2...
Excel Dashboard Master Class Aug 20-21
1. Interactive Dashboard using Excel & VBA: from Zero to Master | Aug 20-21, 2015 | Intercontinental Hotel
Contact Magdalena: 0815 86727350 or Justinus: 0812 87731711| www.essencesius.com | Email to: info@essencesius.com
www.essencesius.com
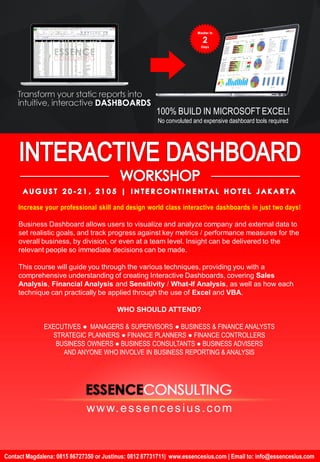
Increase your professional skill and design world class interactive dashboards in just two days!
100% BUILD IN MICROSOFT EXCEL!
No convoluted and expensive dashboard tools required
Business Dashboard allows users to visualize and analyze company and external data to
set realistic goals, and track progress against key metrics / performance measures for the
overall business, by division, or even at a team level. Insight can be delivered to the
relevant people so immediate decisions can be made.
This course will guide you through the various techniques, providing you with a
comprehensive understanding of creating Interactive Dashboards, covering Sales
Analysis, Financial Analysis and Sensitivity / What-If Analysis, as well as how each
technique can practically be applied through the use of Excel and VBA.
WHO SHOULD ATTEND?
EXECUTIVES ● MANAGERS & SUPERVISORS ● BUSINESS & FINANCE ANALYSTS
STRATEGIC PLANNERS ● FINANCE PLANNERS ● FINANCE CONTROLLERS
BUSINESS OWNERS ● BUSINESS CONSULTANTS ● BUSINESS ADVISERS
AND ANYONE WHO INVOLVE IN BUSINESS REPORTING & ANALYSIS
2. Interactive Dashboard using Excel & VBA: from Zero to Master | Aug 20-21, 2015 | Intercontinental Hotel
Contact Magdalena: 0815 86727350 or Justinus: 0812 87731711| www.essencesius.com | Email to: info@essencesius.com
Your Presenters
Tri Gunawan Bayu Aji Mohamad Yamin
Bayu is a practitioner in Business Development,
Corporate Finance, Management Accounting, Business
Planning and Budgeting with years of solid experience
in various industries such as manufacturing, distribution,
Financial Institution, Shipping Line and Port Operator.
He graduated from Accounting Department of UNPAD
and obtain MM Degree from LPPM Jakarta. He has
extensive experiences in giving public workshop; in-
house training and lectures specialized in Financial
Analysis and Financial Modeling. He learnt directly from
Financial Modeling Gurus Dr. Richard Capps, Dr.
Robert Graham and Dr. Ian Beamen. His team
members are also practitioners from the biggest
Beverages Company and Telecommunication
Company, and having many experience in giving
Financial Workshop.
Yamin is a practitioner in the areas of IT solutions
covering Business Intelligence, Data Warehouse,
Enterprise Data Integration, Data Mining, Web
Application, Web Design & Development, and Mobile
Solution with extensive experience of project deliveries
related to Finance, Sales & Marketing, HR,
Manufacturing, and Logistics & Distribution. He
graduated from Information Management of Gunadarma
University and obtained some certifications of Technical
and Management skills from training institutions in
Indonesia and Singapore. He has extensive hands on
experience in project deliveries related to Finance,
Sales & Marketing, Human Resources, Logistic and
Operation departments when he was working in the
biggest Beverages Company for more than thirteen
years, lastly as Technology Solutions Manager.
BENEFITS FROM ATTENDING THIS COURSE
• This course will help you become an expert at
working with Excel formulas & functions and you will
be able to create Interactive Dashboards that will
impress your boss, colleagues, and audience.
• This course will teach you the simple techniques you
can apply in Excel to make amazing Dashboards
that will set your skill level apart from the crowd and
take your career to the Next Level.
• Discover a range of sophisticated techniques that
will improve the usability and reliability of your Excel
reports.
• Learn how to properly incorporate big data sheets
into Interactive Dashboards for a better data
visualization and to support decision making.
• Make World-Class Dashboards like these
3. Interactive Dashboard using Excel & VBA: from Zero to Master | Aug 20-21, 2015 | Intercontinental Hotel
Contact Magdalena: 0815 86727350 or Justinus: 0812 87731711| www.essencesius.com | Email to: info@essencesius.com
DAY 1 | EXCEL DASHBOARD FUNDAMENTAL
Paste Picture Link Camera Tool Background Image Justify Label
Custom Number Format Style Transpose Elbow Formatting
Custom List Auto Complete Text Missing Titles Hiding Titles
YTD Formula
Create List using
Validation
Create List using Combo
Box
Create Report using
Option
Smart Table Auto Sum Consolidate Outline
Paste Shapes into a Chart In Cell Chart using REPT Thermometer Chart Dynamic Chart
Moving Chart Modified Axis Sparkline (2010) In Cell Chart Cell
Showing Forecasts with
Actuals
Side by Side Trending
Moving Chart using Smart
Table
Top and Bottom Displays
Highlight Top Value in
Charts
Using a Check Box Control Using a List Box Control
Using a List Option
Control
DAY 2 | BUILDING & PUBLISHING EXCEL DASHBOARD
Introduction: Building a
Case for Dashboard
Prepare Data using Smart
Tables
Data Summarization &
Calculation
Filtering Top n Data
Creating Gauges Creating Bullet Charts
Advanced Charting
Methods
Alerts using Conditional
Formatting
Recording Macro
Pivot Table Filtering using
Slicer
Working with Map
Working with Menu
Selections
Dynamic Visibility
Put it all together in One
Page
Dashboard Formatting
Adding Style and
Personality
Protecting your Excel
Dashboard
Export Excel Dashboard to
your Audience
Publishing Excel
Dashboard to Web
General Dashboard Advise
& Tips
Basic-Introduction to Xcelsius (SAP Crystal Dashboard Design) | Power Pivot | Presentation & Demo
WHAT WILL YOU LEARN ?
4. Interactive Dashboard using Excel & VBA: from Zero to Master | Aug 20-21, 2015 | Intercontinental Hotel
Contact Magdalena: 0815 86727350 or Justinus: 0812 87731711| www.essencesius.com | Email to: info@essencesius.com
Recent Attendee
• Coca-Cola Bottling Indonesia
• Coca-Cola Distribution Indonesia
• Novartis
• ExxonMobil
• PriceWaterhouseCoopers
• Cognis Indonesia
• Astra Honda Motor
• Kantor Kita
• Coca-Cola Indonesia
• Australian Development Scholarship
• PT HM Sampoerna
• Jakarta International Container
Terminal
• MCX Asia
• BNI 46
• PT Siemens Indonesia
• Jakarta Stock Exchange
• Goodyear
• Trocaire
• Medco Energi
• Abbott
• Elang Mahkota
• Exspan
• Aelindo
• Halin Marine
• Ramboll Telecom
• Hutchison Telco
• Danone
• Nusa Dua Graha
• Bank DKI
• Sari Husada
• Trakindo
• JICT
• GMF AeroAsia
• PNM Investment
• World Bank
• Kaltim Parna Industri (KPI)
• KPEI
• Premier Qualitas
• CIMB Niaga
• Indonesia Comnet Plus
• Persada Sukses Makmur
• Pertamina Hulu Energy
• Bank Kesawan
• Hotel Intercontinental
• Alfamart
• Ferrier Hodgson
• King Halim
• Pamitramas Mulia
• CMNP
• TNT
• Etc.
In-house Training
We will come to you !
If you have a team of 10 or
more why not hold a private
course?
We have successfully arranged
in house sessions.
We have various experience on in-
house trainings with positive
feedbacks and results !
Course materials
You receive full course notes, plus a USB full of practical
templates, exercises & solutions, reference guides, add-ins and
other useful tools that can be used to efficiently build effective and
robust interactive reports & dashboards.
Certificate of Completion
Upon completion of this course, you will receive a
Certificate of Completion, a recognition of your
accomplishment, skills and knowledge learned from this
course.
Laptops required
You will be required to bring along a laptop computer with
Microsoft Excel (2007 or 2010) pre-installed and YOU MUST
HAVE ADMIN ACCESS TO YOUR LAPTOP to install
applications required for this course. If you do not have access to
a laptop computer, please let us know when you register for the
course and we can provide you a quotation for laptop rentals.
COURSE SCHEDULE
Registration
8.30 am
Course Begins
9.00 am
Morning Break
10.30 am
Lunch
12.00 pm
Afternoon Break
3.30 pm
Close
5.30 pm
OUR COURSES
Weekend Class
We offer you weekend class
(Saturday and Sunday) in deepening
your Excel, Financial Modeling and
Interactive Dashboard skills, the class
will start with minimum 5 persons.
Venue: PPM Training Center, free Wi-
Fi, Lunch, and Coffee Break.
Contact Ms. Magdalena on:
Mobile: 0815-86727350
0896-40528375
info@essencesius.com
www.essencesius.com
Learn the most effective ways
to design, cross check and
Structure your Interactive
Reports & Dashboards.
Build robust and flexible models
so you can perform add-ins and
make amendments while
maintaining the integrity of your
spreadsheets.
Learn to create and compare
scenarios – actual vs. budget,
and actual vs. last year.
Save hours of reporting
manipulating time. Get the job
done faster and painlessly.
All the resources you need to do
your job better !
Practical hands-on case studies.
Take home the best practice templates
which you have used in the workshop.
These can be built on to help you
enhance your knowledge & skills.
Check us on:
5. Interactive Dashboard using Excel & VBA: from Zero to Master | Aug 20-21, 2015 | Intercontinental Hotel
Contact Magdalena: 0815 86727350 or Justinus: 0812 87731711| www.essencesius.com | Email to: info@essencesius.com
Delegate details
1 Name: Job Title:
Phone: Email:
2 Name: Job Title:
Phone: Email:
3 Name: Job Title:
Phone: Email:
4 Name: Job Title:
Phone: Email:
5 Name: Job Title:
Phone: Email:
Company details
Company Name: Industry
Address: Fax:
Postcode: Tel:
Limited Seats
This course is limited seats, to facilitate interaction between
you and the trainer, so seek approval and register as soon as possible.
Package Regular Two or more
delegates
In house
Registration Fee Rp. 6,000,000 Rp. 5,500,000 Contact Us
We’ll give you special discount for sending two or more delegates
Course Registration Form
COMPLETE AND RE-EMAIL this form to
info@essencesius.com or
financial.modelling.id@gmail.com