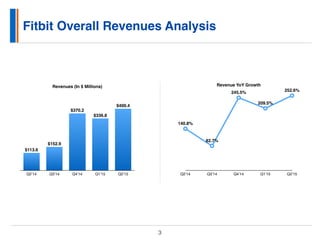
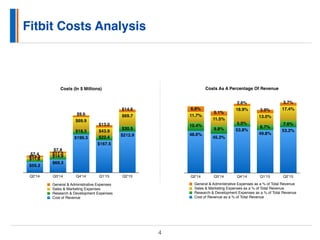
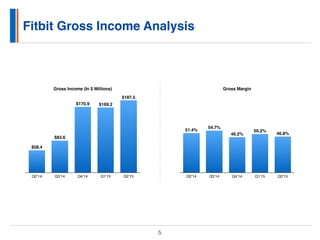
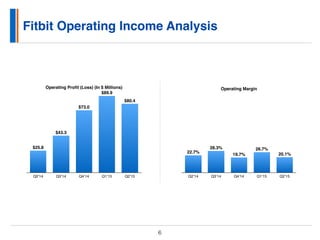
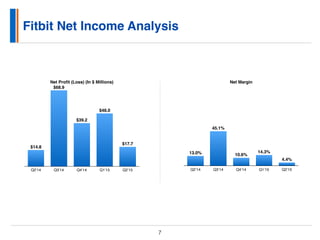
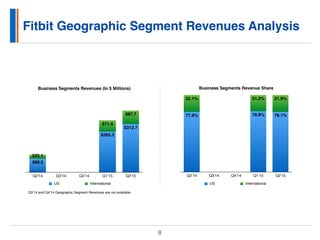
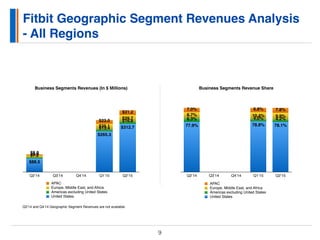
The presentations covers the following: GoDaddy Overall Revenues And Profits Analysis Q2'15; GoDaddy Business Segments Revenues Analysis Q2’15 - Domains, Hosting and Presence, Business Applications; GoDaddy Geographic Segments Revenues Analysis Q2'15 - US, International; GoDaddy Key Business Metrics Analysis Q2'15 - Total Bookings, Total Customers at the period end, Average Revenue Per User (ARPU).
This presentation provides: Twitter overall revenues and profits analysis, Twitter business and geographic segments revenue analysis, Twitter advertising revenues by device type - desktop vs mobile, Twitter monthly active users analysis
Solid finish to fiscal 2014
Core sales growth +4%
Adjusted net income +62%
Adjusted EBITDA margin of 21.0%
Adjusted EPS +56% year over year to $0.50
Water Management growth accelerating as expected
+6% core growth … strong momentum in both Zurn and VAG
Acquired Green Turtle in April … proprietary products expand Zurn portfolio
Process & Motion Control end markets stable/improving
+3% core growth with strong performance in U.S. OEM/Distribution
Adjusted EBITDA increases to 29.2% … 300 basis point improvement year over year
Fiscal 2015 guidance of +3% to +5% core sales growth … adjusted EPS growth
of +20% to +28%
A JOINT RESEARCH STUDY OF PAS AND MEDIABANK PAKISTAN
TV MONTHLY INDUSTRY REPORT gives the overall picture of advertising on TV during the month of January 2015. It covers top advertisers, categories and brands and their % share in total advertising in terms of minutes. The report also focuses on share of TV channels, share of each genre and ad-spend split over the time slots. The report also compares % advertising in minutes done by various advertisers on YOY basis
A powerpoint I created for a group project in my Integrated Marketing Communications class. The objective of the project was to create a new product line and create a marketing plan for it.
ESPN - Internal Social Media & New Technologies PresentationBrooke Hundley
Powerpoint presentation given to senior executives while at ESPN on the need for a social media strategy alongside and in conjunction with games and event broadcasts. Requested and given approval to start first ever internal team in remote production division to present and educate producers and execs on social media, new technology, and multi-platform outlets. (2009)
Facebook business analysis 2014 presentation provides an analysis of Facebook overall revenues and profits, Facebook business segment revenues, Facebook mobile ad revenues, Facebook geographic segment revenues, Facebook monthly and daily active users (MAUs and DAUs), and Facebook average revenue per user (ARPU) for the years 2010 to 2014.
These slides use concepts from my (Jeff Funk) course entitled analyzing hi-tech opportunities to analyze the increasing economic feasibility of wearable electronics in health care applications. Rapid improvements in sensors, integrated circuits, transceivers, displays, mobile phones, and wireless networks are causing the cost to fall and the performance to rise for wearable applications. These slides analyze hand, head, and body worn electronics in detail including smart watches, wrist and finger devices, smart glasses and textiles, patches, and foot and arm wear. They also analyze a wide variety of sensors for collecting healthcare information including inertial, bio, chemical, and haptic sensors.
Sensors for Wearable Electronics & Mobile Healthcare 2015 Report by Yole Deve...Yole Developpement
Yole;report;market;technology;application;research;trend;player;analysis;free;data
MEMS, Compound Semiconductors, LED, Image Sensors, Optoelectronics, Microfluidics & Medical, Photovoltaics, Advanced Packaging, Power Electronics
More information on that report at http://www.i-micronews.com/reports.html
Top 10 revenue interview questions with answersleahmurphy186
In this file, you can ref interview materials for revenue such as, revenue situational interview, revenue behavioral interview, revenue phone interview, revenue interview thank you letter, revenue interview tips …
Find pre-designed Disney World PowerPoint Background Templates to share your views and information about Disney world of aware the audience by creating a beautiful presentation.
In case you need to present economic status of your company then our content-ready financial statement analysis PowerPoint Presentation is ideal for you. This income statement PPT presentation having multiple slides such as financial projections, key financial ratios, liquidity ratios, cash flow statement KPIs, profitability ratios, activity ratios, solvency ratios, income statement overview and funding updates etc. This cash flow assessment PowerPoint template goes well with topics like profitability analysis, business impact analysis, financial health, and income statement, balance sheet, statement of cash flow, business performance analysis, financial health, and future prospects of an organization, project future performance, economic analysis, company analysis, business valuation, fundamental analysis. For successful business presentation, PowerPoint background is as important as the content in the slides. Our accounting statement PPT slide provides you both content rich as well as professional slides. Download our financial statement analysis presentation slides to project your business future performance. Elucidate on your ideas with our Financial Statement Analysis PowerPoint Presentation Slides. Drive your team to excellence.
L’IAB US a publié un rapport concernant les revenus de la publicité internet. Dans ce rapport, sont publiés les chiffres des investissements annuels de la pub online aux Etats-Unis en 2015.
Selon ce rapport, réalisé par PWC, les revenus de l’epub affichent une progression de +19% aux USA au premier semestre 2015 vs 2014 et se montent à 27,5 Mds$. Le mobile augmente de +54% et représente désormais 30% des revenus digitaux. Les revenus de la vidéo affichent une progression de +35%, et de +51% pour le social media. Le search reste le premier format investi (37%), en progression de +11%.
IAB internet advertising revenue report - October 2015Romain Fonnier
Q3 2015 Digital Ad Revenues Climb To $15 Billion, Marking All-Time Quarterly High
12.10.15
IAB Internet Advertising Revenue Report Shows 23% Increase Year-over-Year
NEW YORK, NY (December 10, 2015) — U.S. internet advertising revenues hit $15 billion in the third quarter of 2015, making it the highest quarter on record, according to the latest IAB Internet Advertising Revenue Report figures released today by the Interactive Advertising Bureau (IAB) and PwC US. This figure marks a significant 23 percent uptick over Q3 2014 and its then record-breaking total of $12.2 billion.
The latest numbers also represent a 5 percent increase from Q2 2015, which came in at $14.3 billion.
“These landmark figures confirm marketers’ confidence in using digital to reach consumers,” said Randall Rothenberg, President and CEO, IAB.
“Brands and agencies are focusing ever more attention on interactive screens, following consumers as they flock to digital platforms to be entertained, engaged, and informed,” said Sherrill Mane, Senior Vice President, Research, Analytics, and Measurement, IAB.
“These numbers demonstrate that digital is a critical part of the marketing mix,” said David Silverman, a partner at PwC US. “Brands understand that interactive provides the type of rich, immersive experiences that attract today’s audiences, no matter the environment or time of day.”
The following chart highlights quarterly ad revenue since 1996; dollar figures are rounded.
Q3 2015 Digital Ad Revenues Climb To $15 Billion, Marking All-Time Quarterly High
IAB sponsors the IAB Internet Advertising Revenue Report, which is conducted independently by the New Media Group of PwC. The results are considered the most accurate measurement of interactive advertising revenues because the data is compiled directly from information supplied by companies selling advertising on the internet. The survey includes data concerning online advertising revenues from web sites, commercial online services, free e-mail providers, and all other companies selling online advertising.
The full report is issued twice yearly for full and half-year data, and top-line quarterly estimates are issued for the first and third quarters. PwC does not audit the information and provides no opinion or other form of assurance with respect to the information. Past reports are available at www.iab.com/adrevenuereport.
In case you need to present economic status of your company then our content-ready financial statement analysis PowerPoint Presentation is ideal for you. This income statement PPT presentation having multiple slides such as financial projections, key financial ratios, liquidity ratios, cash flow statement KPIs, profitability ratios, activity ratios, solvency ratios, income statement overview and funding updates etc. This cash flow assessment PowerPoint template goes well with topics like profitability analysis, business impact analysis, financial health, and income statement, balance sheet, statement of cash flow, business performance analysis, financial health, and future prospects of an organization, project future performance, economic analysis, company analysis, business valuation, fundamental analysis. For successful business presentation, PowerPoint background is as important as the content in the slides. Our accounting statement PPT slide provides you both content rich as well as professional slides. Download our financial statement analysis presentation slides to project your business future performance. Elucidate on your ideas with our Financial Statement Analysis Powerpoint Presentation Slides. Drive your team to excellence. https://bit.ly/2VtddrR
A detailed appraisal of a company as far as company’s progress is concerned is a must and should be put together in the form of PPT presentation. There are many valuable steps that must be kept in mind while displaying the data in Sample Financial Analysis Report Manufacturing PowerPoint Presentation Slides. The core areas which need due and special attention in PPT layout include identification of economic characteristics, areas focusing on companies strategies, tracking the company’s financial statements along with its profitability and risks. Tabular form of data and bar graphs featured in the PPT templates focus on areas like revenue, net profit, operating profit and more. The different modes of showing data on balance sheets in slides of PowerPoint presentation makes your life so much easy as you just need to add the data and you are ready to go. All this composite form of data representation in financial analysis report manufacturing presentation slide helps you lead and take the right decisions well in time Brief them on first aid with our Sample Financial Analysis Report Manufacturing PowerPoint Presentation Slides. Enlighten folks on handling injuries.
Quarterly Business Review Framework PowerPoint Presentation SlidesSlideTeam
Here is a content ready quarterly business review framework PowerPoint presentation to benefit the professionals overcome restrictions to run a corporate. Highlighting the important facts of this business information review PPT slides, here we have come up with readymade presentation related to your topic. In this quarterly business overview PPT templates, we have included a firm overview, financial performance, CSR, competitor’s analysis, future roadmap, client & project updates etc. You can also use this complete company summary PowerPoint sample slide with related topics like economic assessment, company evaluation, organizational study, company information analysis, enterprise audit, enterprise assessment, organizational appraisal and many more. Organizational summary is required to ensure the challenges of economic and financial performance. This is the most suitable QBR PPT designs for middle and top-level management. This professionally pre-designed quarterly business review framework presentation graphics are available to download. Our Quarterly Business Review Framework PowerPoint Presentation Slides are truly out of this world. Even the MIB duo has been keeping tabs on our team.
Quarterly Business Review Framework Powerpoint Presentation SlidesSlideTeam
Here is a content ready quarterly business review framework PowerPoint presentation to benefit the professionals overcome restrictions to run a corporate. Highlighting the important facts of this business information review PPT slides, here we have come up with readymade presentation related to your topic. In this quarterly business overview PPT templates, we have included a firm overview, financial performance, CSR, competitor’s analysis, future roadmap, client & project updates etc. You can also use this complete company summary PowerPoint sample slide with related topics like economic assessment, company evaluation, organizational study, company information analysis, enterprise audit, enterprise assessment, organizational appraisal and many more. Organizational summary is required to ensure the challenges of economic and financial performance. This is the most suitable QBR PPT designs for middle and top-level management. This professionally pre-designed quarterly business review framework presentation graphics are available to download. Our Quarterly Business Review Framework Powerpoint Presentation Slides are truly out of this world. Even the MIB duo has been keeping tabs on our team. https://bit.ly/3jI3M1z
Corporate Due Dilaigence Powerpoint Presentation SlidesSlideTeam
Introducing Corporate Due Diligence PowerPoint Presentation Slides. This financial due diligence PPT theme gives you a layout to represent technological due diligence, customer due diligence, and other fundamentals. Utilize our readily available stunning infographics of Commercial Due Diligence Process Presentation Slides to consolidate factual information about any organization. Showcase financial reports like P&L, balance sheet, and cash flow statement by easily editing this financial due diligence PPT template. Compile data like highest revenue-generating customers, and customer satisfaction in moments with the help of our commercial analysis PowerPoint deck. Our operational diligence PowerPoint slideshow also offers a layout to emphasize questions that influence technical due diligence. Use this business diligence PowerPoint presentation’s KPI diagrams, line chart, area chart, etc. to present bland stats with visual distinction. Our PPT assists in mergers and acquisitions by addressing vital strategic fit components like business compatibility. You may even present legal highlights such as litigation, and taxation via layouts included in this financial analysis PowerPoint presentation. https://bit.ly/3g4AAjF
Financing Forecasting Process And Methods PowerPoint Presentation SlidesSlideTeam
Company’s investors will expect to see your financial forecast, profit, and loss statement and cash flow, etc. Therefore, we present our financing forecasting process and methods PowerPoint presentation slides. This budget forecasting PPT presentation will assess the effectiveness with which funds are employed and the profitability of its operations. We have included required templates like fiscal KPI’s like balance sheet, cash flow statements, financial projections, key funding ratios. It also covers ratio analysis, P&L overview, funding updates, etc., in this complete PowerPoint presentation. Using these financial prediction PPT slides, a middle-level manager can depict the company’s budget to top management. If you are planning to create a presentation on the financial forecast, demand forecast, cash flow prediction, economic forecasting, fiscal modeling, qualitative forecasting methods, etc., in future our demand forecast PowerPoint templates will be useful for you. The best thing about our financial prediction PPT designs is that they can be customized as per your needs. What are you waiting for? Download this amazing financing forecasting process and methods PowerPoint presentation template. Facilitate better coordination with our Financing Forecasting Process And Methods PowerPoint Presentation Slides. Create the desire to act cohesively.
Tata Group Dials Taiwan for Its Chipmaking Ambition in Gujarat’s DholeraAvirahi City Dholera
The Tata Group, a titan of Indian industry, is making waves with its advanced talks with Taiwanese chipmakers Powerchip Semiconductor Manufacturing Corporation (PSMC) and UMC Group. The goal? Establishing a cutting-edge semiconductor fabrication unit (fab) in Dholera, Gujarat. This isn’t just any project; it’s a potential game changer for India’s chipmaking aspirations and a boon for investors seeking promising residential projects in dholera sir.
Visit : https://www.avirahi.com/blog/tata-group-dials-taiwan-for-its-chipmaking-ambition-in-gujarats-dholera/
FIA officials brutally tortured innocent and snatched 200 Bitcoins of worth 4...jamalseoexpert1978
Farman Ayaz Khattak and Ehtesham Matloob are government officials in CTW Counter terrorism wing Islamabad, in Federal Investigation Agency FIA Headquarters. CTW and FIA kidnapped crypto currency owner from Islamabad and snatched 200 Bitcoins those worth of 4 billion rupees in Pakistan currency. There is not Cryptocurrency Regulations in Pakistan & CTW is official dacoit and stealing digital assets from the innocent crypto holders and making fake cases of terrorism to keep them silent.
Digital Transformation and IT Strategy Toolkit and TemplatesAurelien Domont, MBA
This Digital Transformation and IT Strategy Toolkit was created by ex-McKinsey, Deloitte and BCG Management Consultants, after more than 5,000 hours of work. It is considered the world's best & most comprehensive Digital Transformation and IT Strategy Toolkit. It includes all the Frameworks, Best Practices & Templates required to successfully undertake the Digital Transformation of your organization and define a robust IT Strategy.
Editable Toolkit to help you reuse our content: 700 Powerpoint slides | 35 Excel sheets | 84 minutes of Video training
This PowerPoint presentation is only a small preview of our Toolkits. For more details, visit www.domontconsulting.com
B2B payments are rapidly changing. Find out the 5 key questions you need to be asking yourself to be sure you are mastering B2B payments today. Learn more at www.BlueSnap.com.
Company Valuation webinar series - Tuesday, 4 June 2024FelixPerez547899
This session provided an update as to the latest valuation data in the UK and then delved into a discussion on the upcoming election and the impacts on valuation. We finished, as always with a Q&A
3 Simple Steps To Buy Verified Payoneer Account In 2024SEOSMMEARTH
Buy Verified Payoneer Account: Quick and Secure Way to Receive Payments
Buy Verified Payoneer Account With 100% secure documents, [ USA, UK, CA ]. Are you looking for a reliable and safe way to receive payments online? Then you need buy verified Payoneer account ! Payoneer is a global payment platform that allows businesses and individuals to send and receive money in over 200 countries.
If You Want To More Information just Contact Now:
Skype: SEOSMMEARTH
Telegram: @seosmmearth
Gmail: seosmmearth@gmail.com
3.0 Project 2_ Developing My Brand Identity Kit.pptxtanyjahb
A personal brand exploration presentation summarizes an individual's unique qualities and goals, covering strengths, values, passions, and target audience. It helps individuals understand what makes them stand out, their desired image, and how they aim to achieve it.
Anny Serafina Love - Letter of Recommendation by Kellen Harkins, MS.AnnySerafinaLove
This letter, written by Kellen Harkins, Course Director at Full Sail University, commends Anny Love's exemplary performance in the Video Sharing Platforms class. It highlights her dedication, willingness to challenge herself, and exceptional skills in production, editing, and marketing across various video platforms like YouTube, TikTok, and Instagram.
4. Fitbit Costs Analysis
4
Costs (In $ Millions)
Q2’14 Q3’14 Q4’14 Q1’15 Q2’15
$14.6
$13.0
$9.6
$7.8
$7.4
$69.7
$43.9
$69.9
$17.5
$13.3
$30.5
$22.4
$18.3
$14.9
$11.8
$212.9
$167.5
$199.3
$69.3
$55.2
Cost of Revenue
Research & Development Expenses
Sales & Marketing Expenses
General & Administrative Expenses
Costs As A Percentage Of Revenue
Q2’14 Q3’14 Q4’14 Q1’15 Q2’15
3.7%
3.9%
2.6%
5.1%
6.6% 17.4%
13.0%
18.9%
11.5%
11.7%
7.6%
6.7%
5.0%
9.8%
10.4%
53.2%
49.8%
53.8%
45.3%
48.6%
Cost of Revenue as a % of Total Revenue
Research & Development Expenses as a % of Total Revenue
Sales & Marketing Expenses as a % of Total Revenue
General & Administrative Expenses as a % of Total Revenue
7. Fitbit Net Income Analysis
7
Net Profit (Loss) (In $ Millions)
Q2’14 Q3’14 Q4’14 Q1’15 Q2’15
$17.7
$48.0
$39.2
$68.9
$14.8
Net Margin
Q2’14 Q3’14 Q4’14 Q1’15 Q2’15
4.4%
14.3%
10.6%
45.1%
13.0%
8. Fitbit Geographic Segment Revenues Analysis
8
Business Segments Revenues (In $ Millions)
Q2’14 Q3’14 Q4’14 Q1’15 Q2’15
$87.7
$71.4
$25.1
$312.7
$265.3
$88.5
US International
Business Segments Revenue Share
Q2’14 Q3’14 Q4’14 Q1’15 Q2’15
21.9%21.2%22.1%
78.1%78.8%77.9%
US International
Q3’14 and Q4’14 Geographic Segment Revenues are not available.
9. Fitbit Geographic Segment Revenues Analysis
- All Regions
9
Q3’14 and Q4’14 Geographic Segment Revenues are not available.
Business Segments Revenues (In $ Millions)
Q2’14 Q3’14 Q4’14 Q1’15 Q2’15
$31.2
$23.0
$8.0
$39.7
$35.1
$9.9
$16.8
$13.4
$7.2
$312.7
$265.3
$88.5
United States
Americas excluding United States
Europe, Middle East, and Africa
APAC
Business Segments Revenue Share
Q2’14 Q3’14 Q4’14 Q1’15 Q2’15
7.8%6.8%7.0%
9.9%10.4%8.7%
4.2%4.0%6.3%
78.1%78.8%77.9%
United States
Americas excluding United States
Europe, Middle East, and Africa
APAC
10. Fitbit Devices Sold Analysis
10
Devices Sold (In Thousands)
Q2’14 Q3’14 Q4’14 Q1’15 Q2’15
4,458
3,866
5,277
2,332
1,720
Devices Sold YoY Growth
Q2’14 Q3’14 Q4’14 Q1’15 Q2’15
130.9%
80.6%
175.0%
145.5%
159.2%
11. Thank You
Copyright - http://revenuesandprofits.com/copyright/
Disclaimer - http://revenuesandprofits.com/disclaimer/
Contact Us - http://revenuesandprofits.com/contact-us/