Download as PDF, PPTX
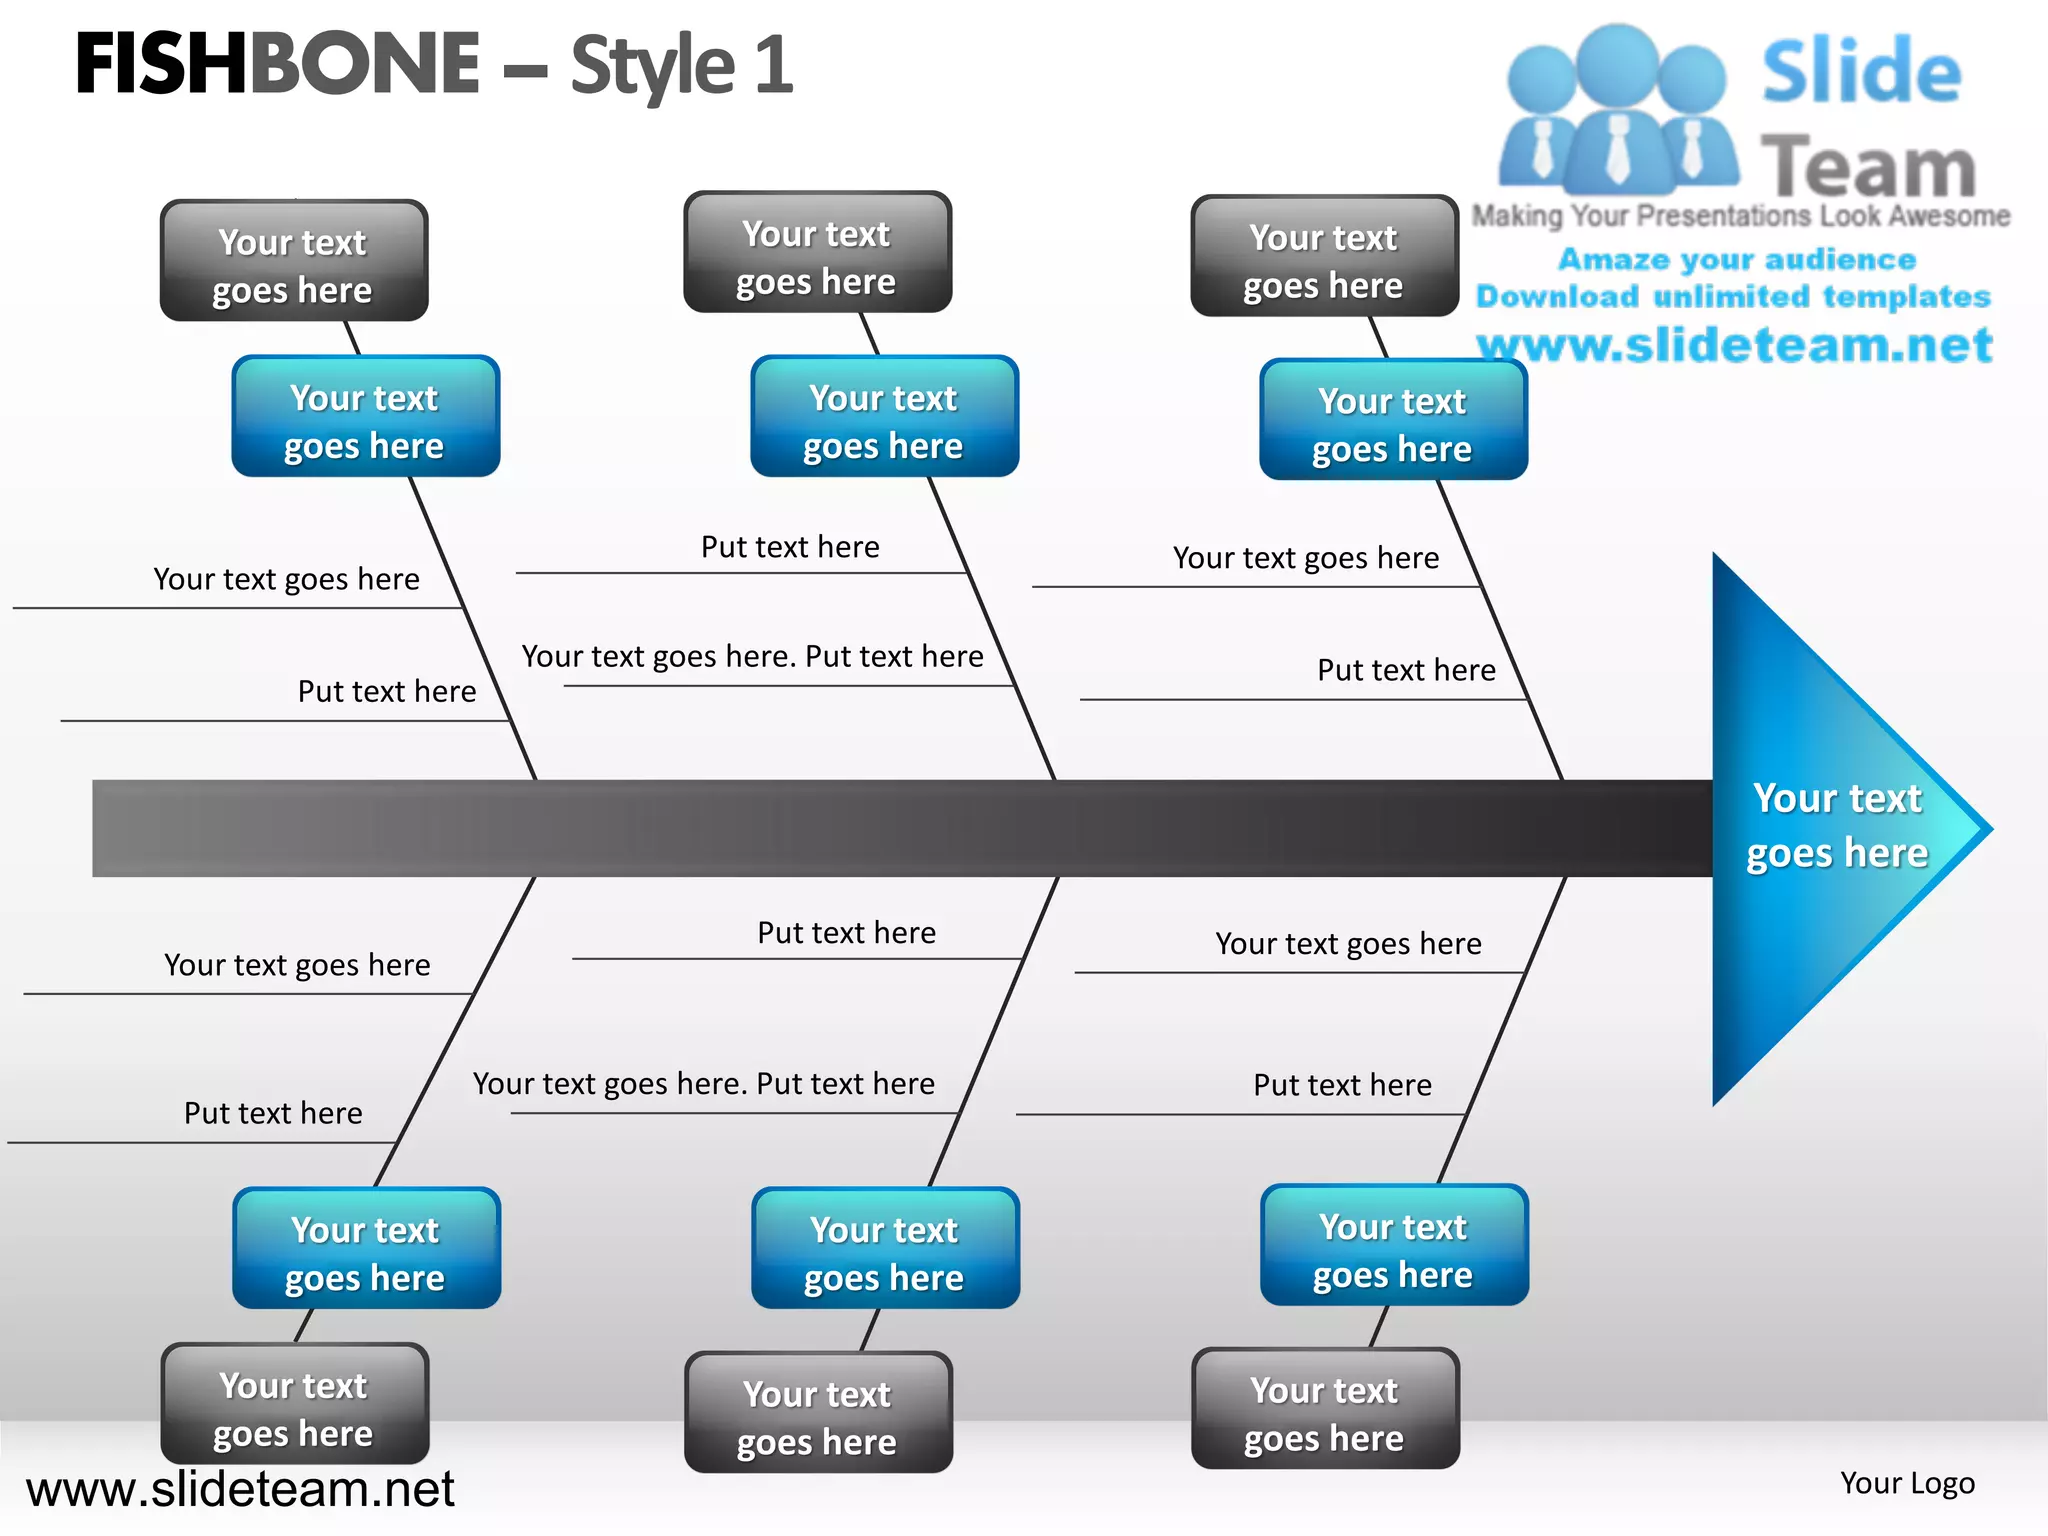
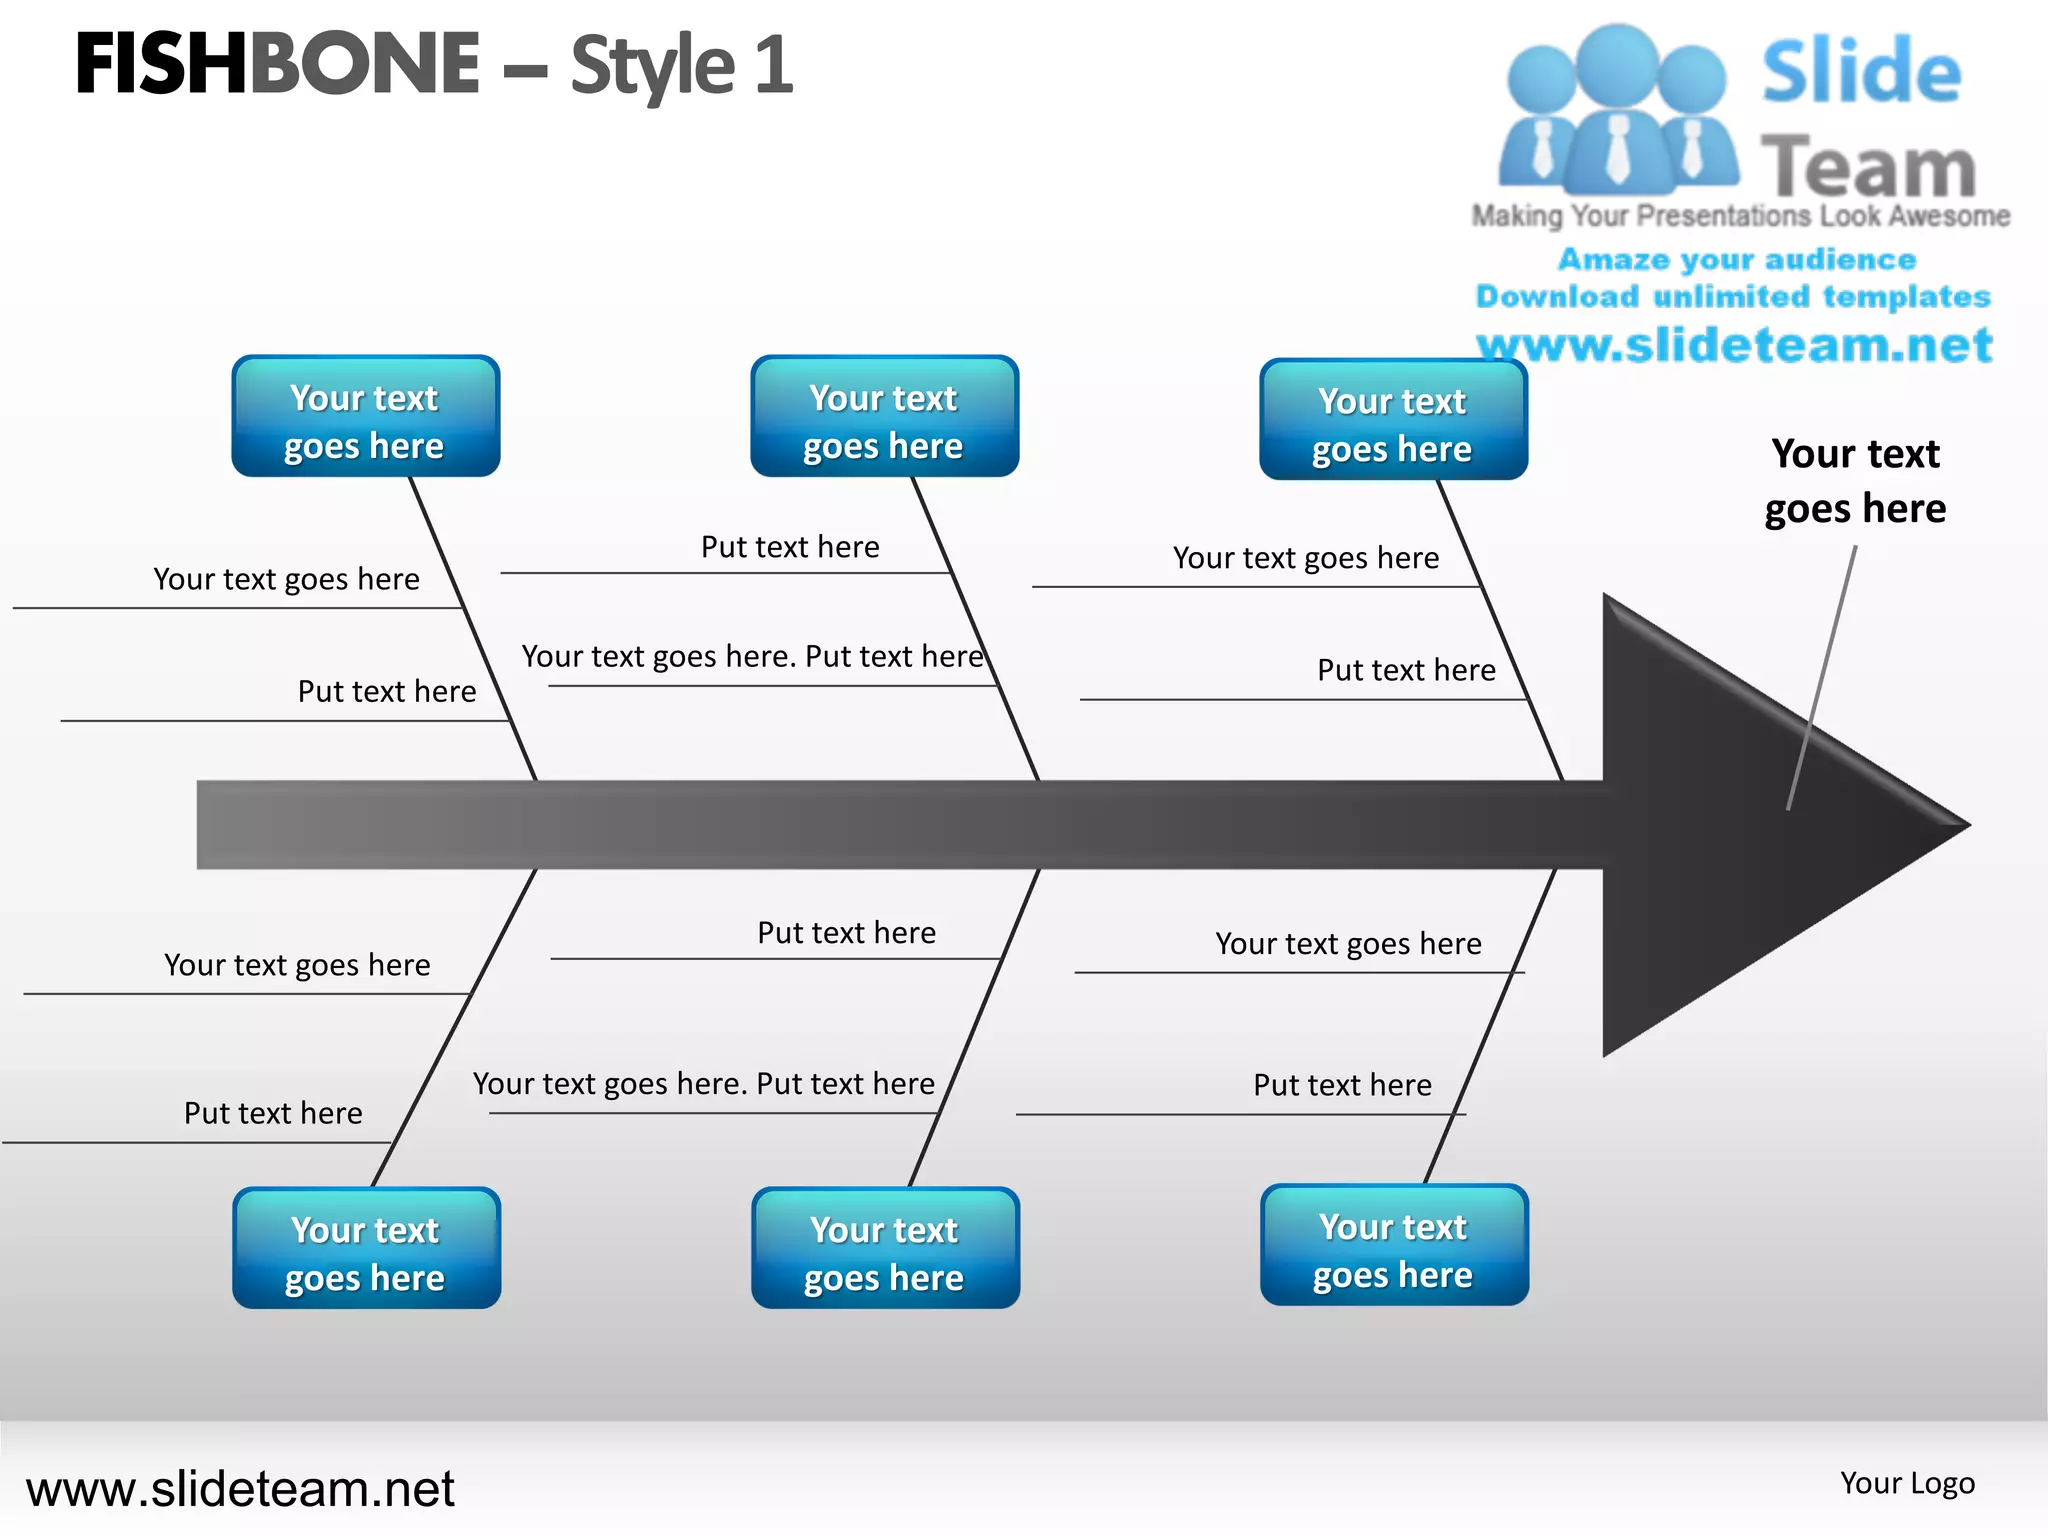
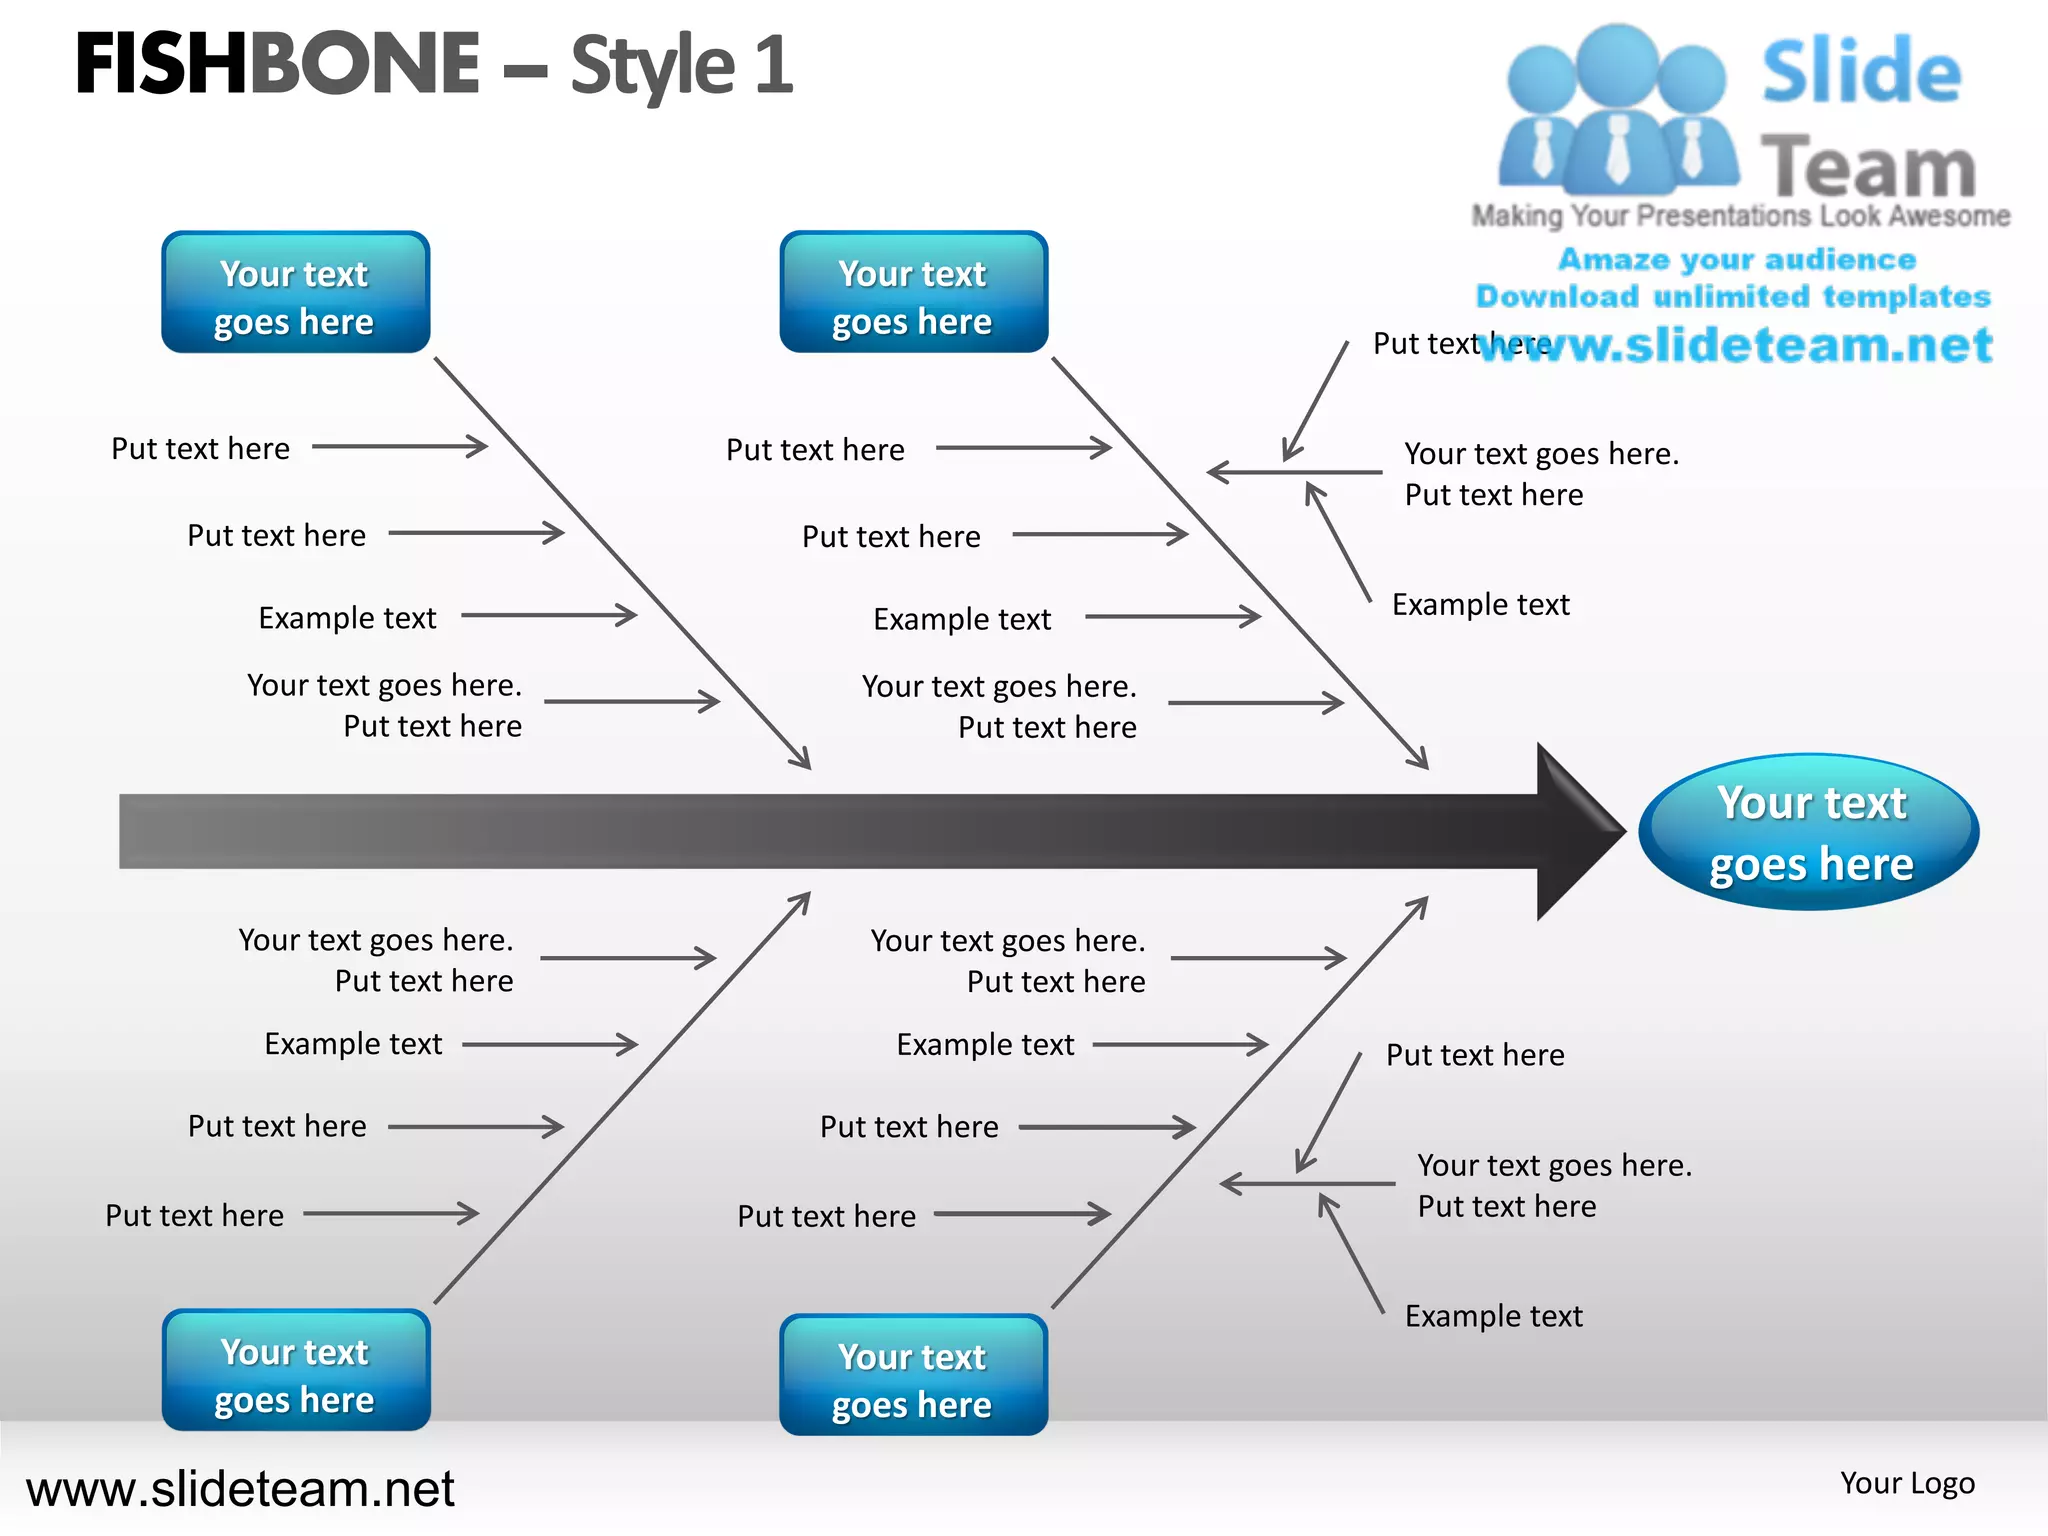
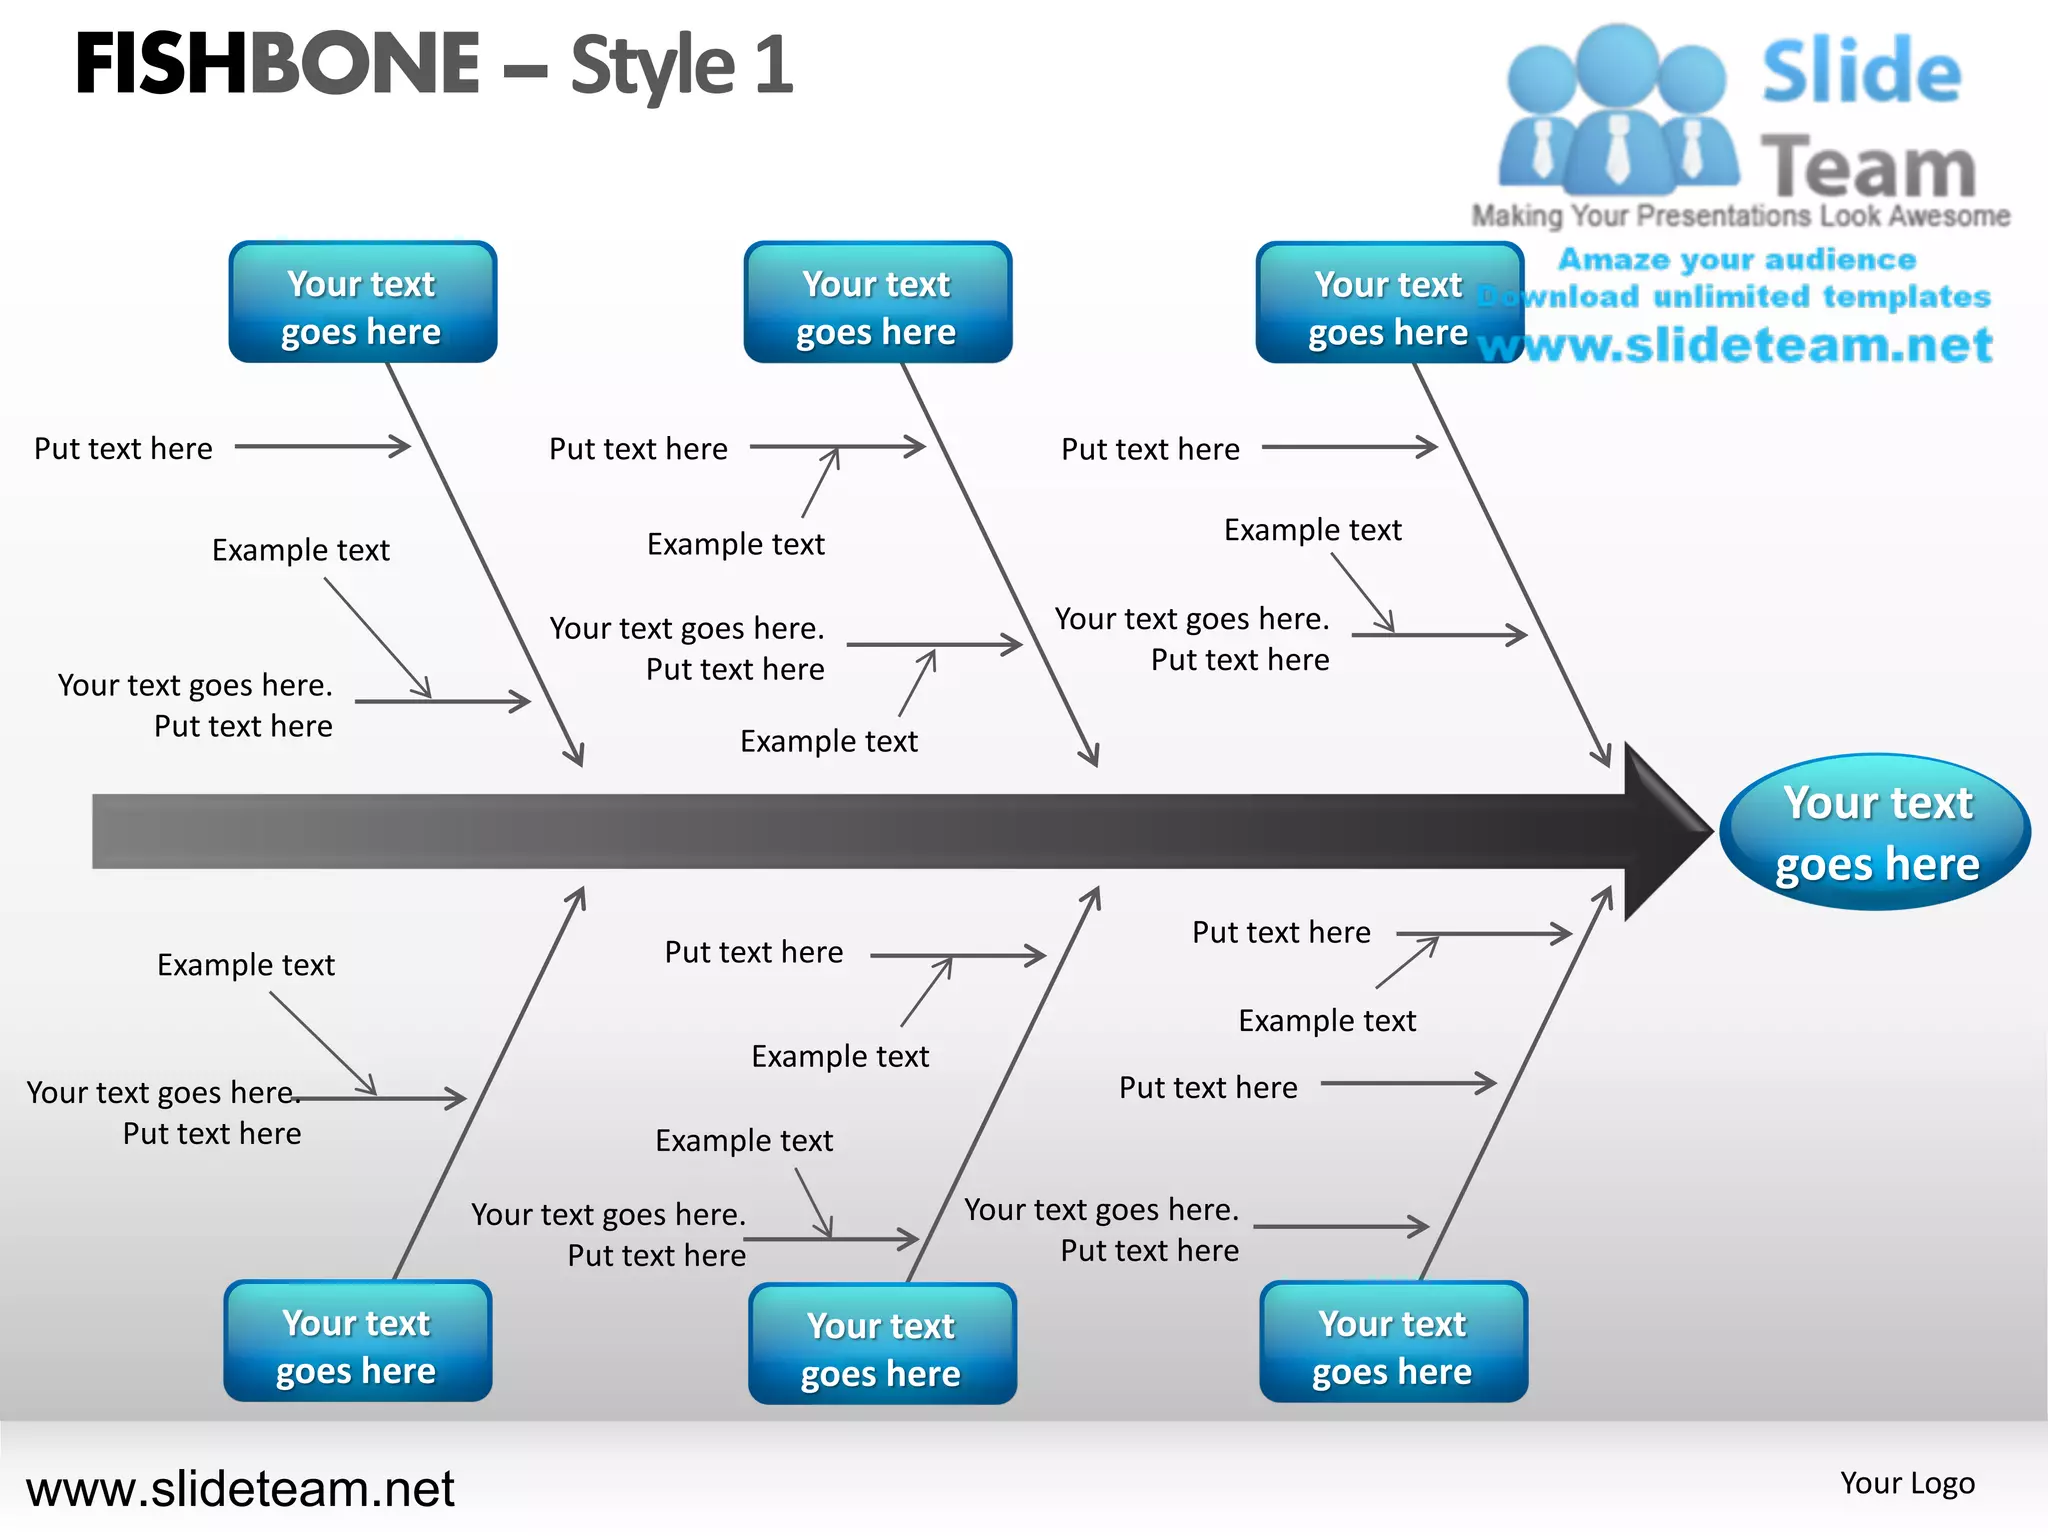
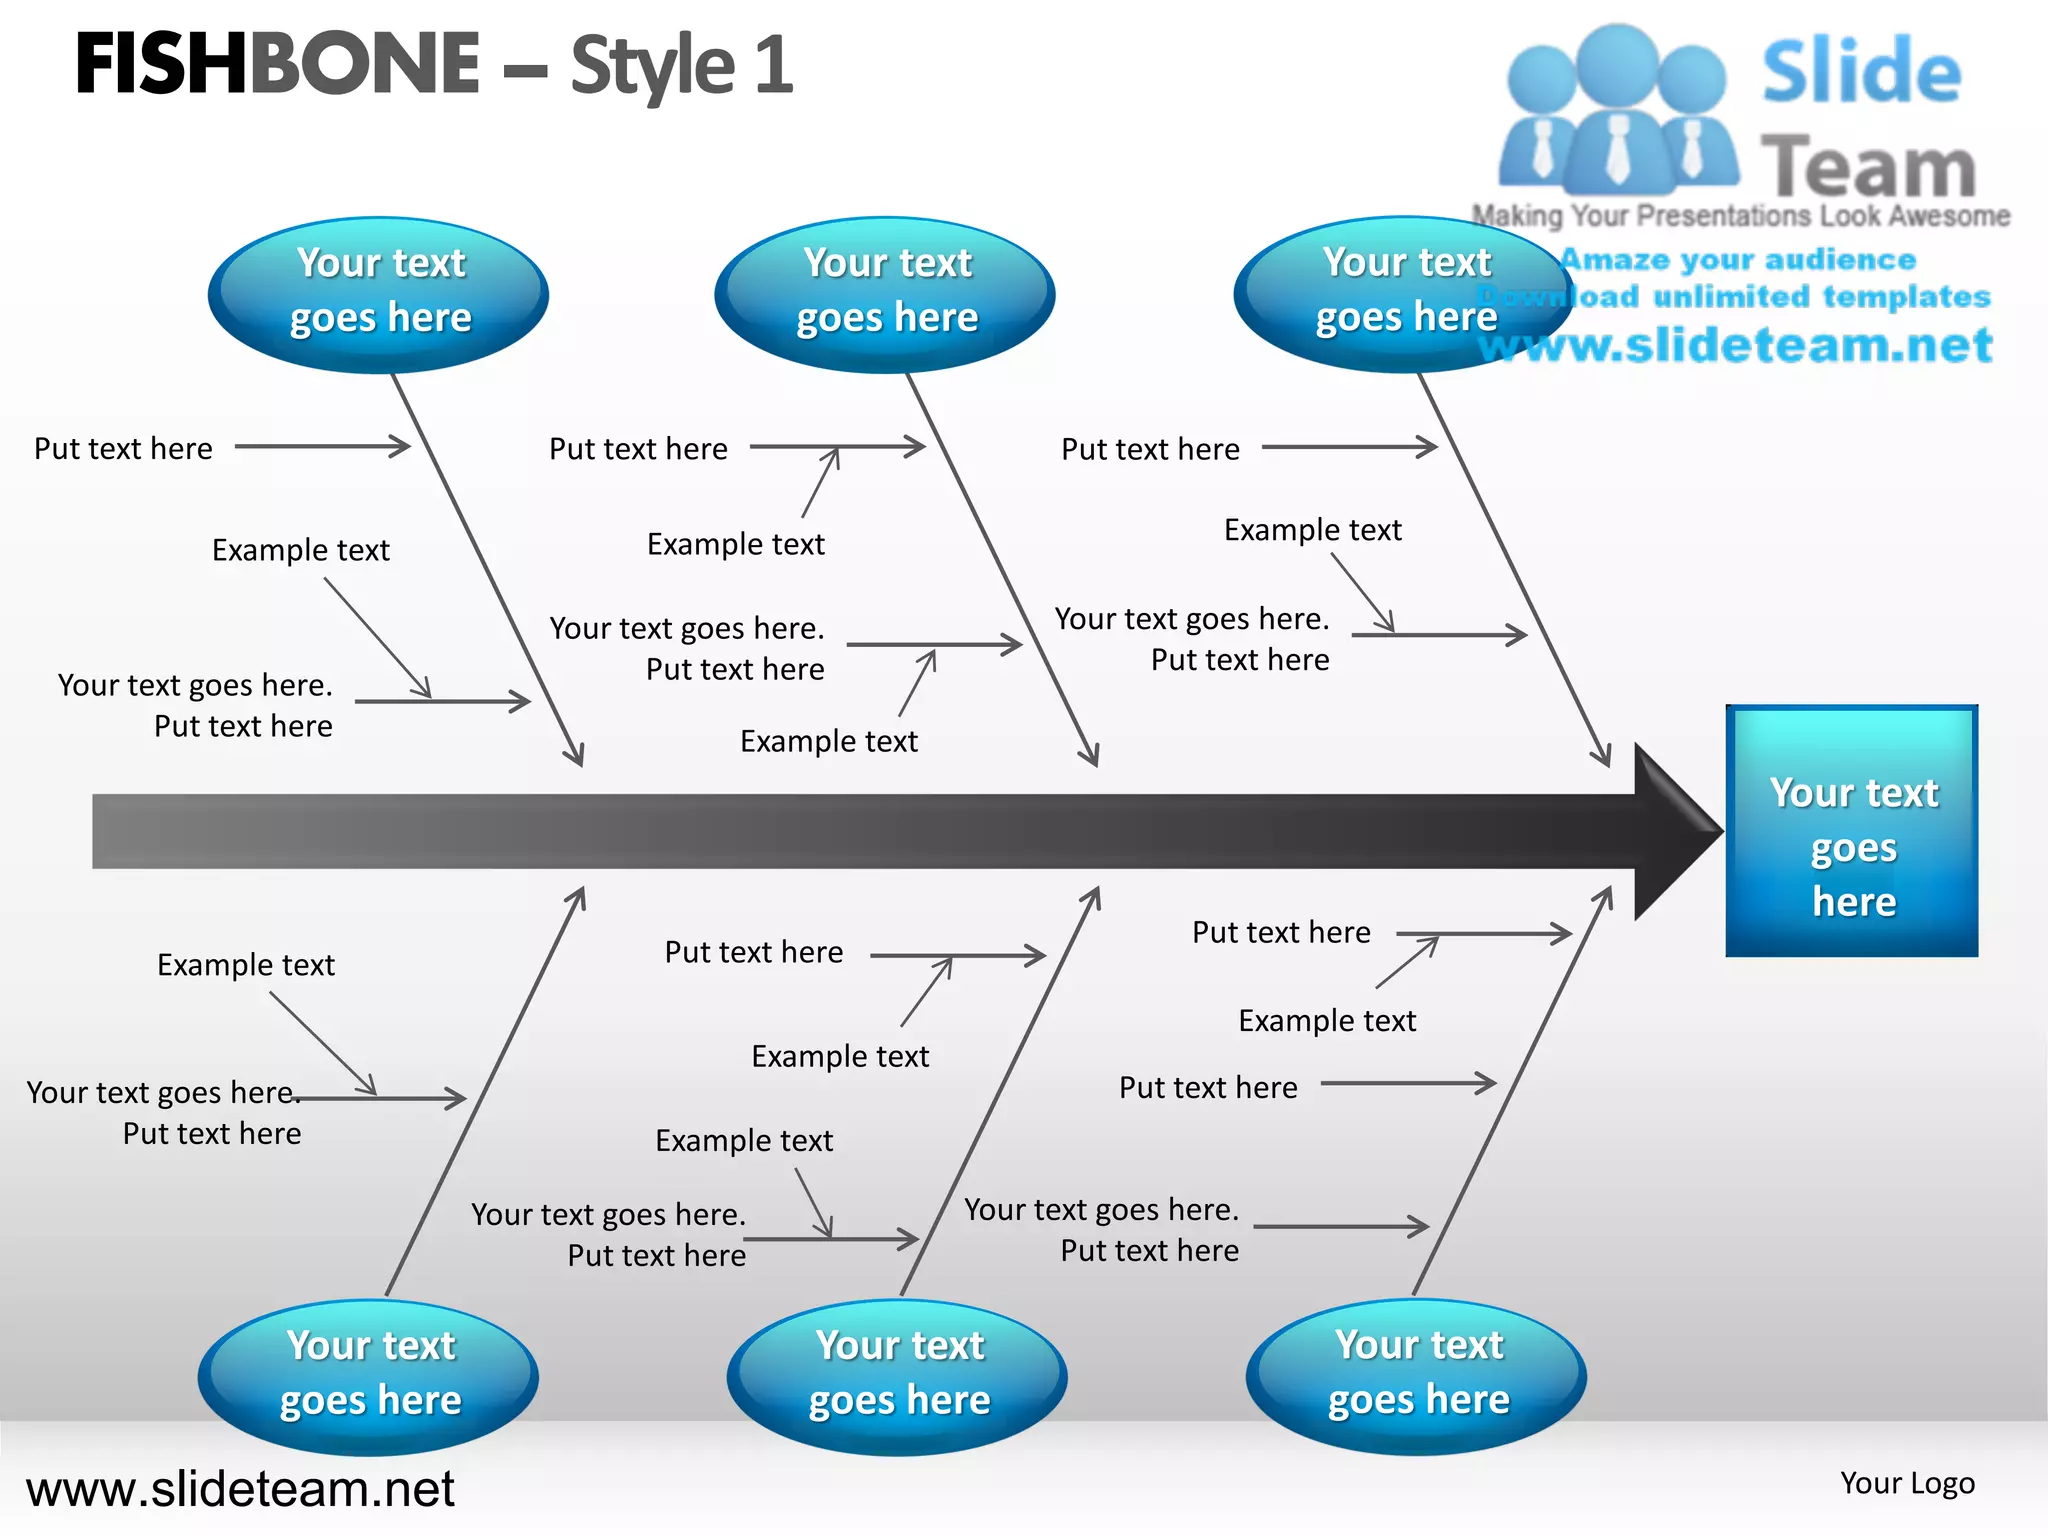
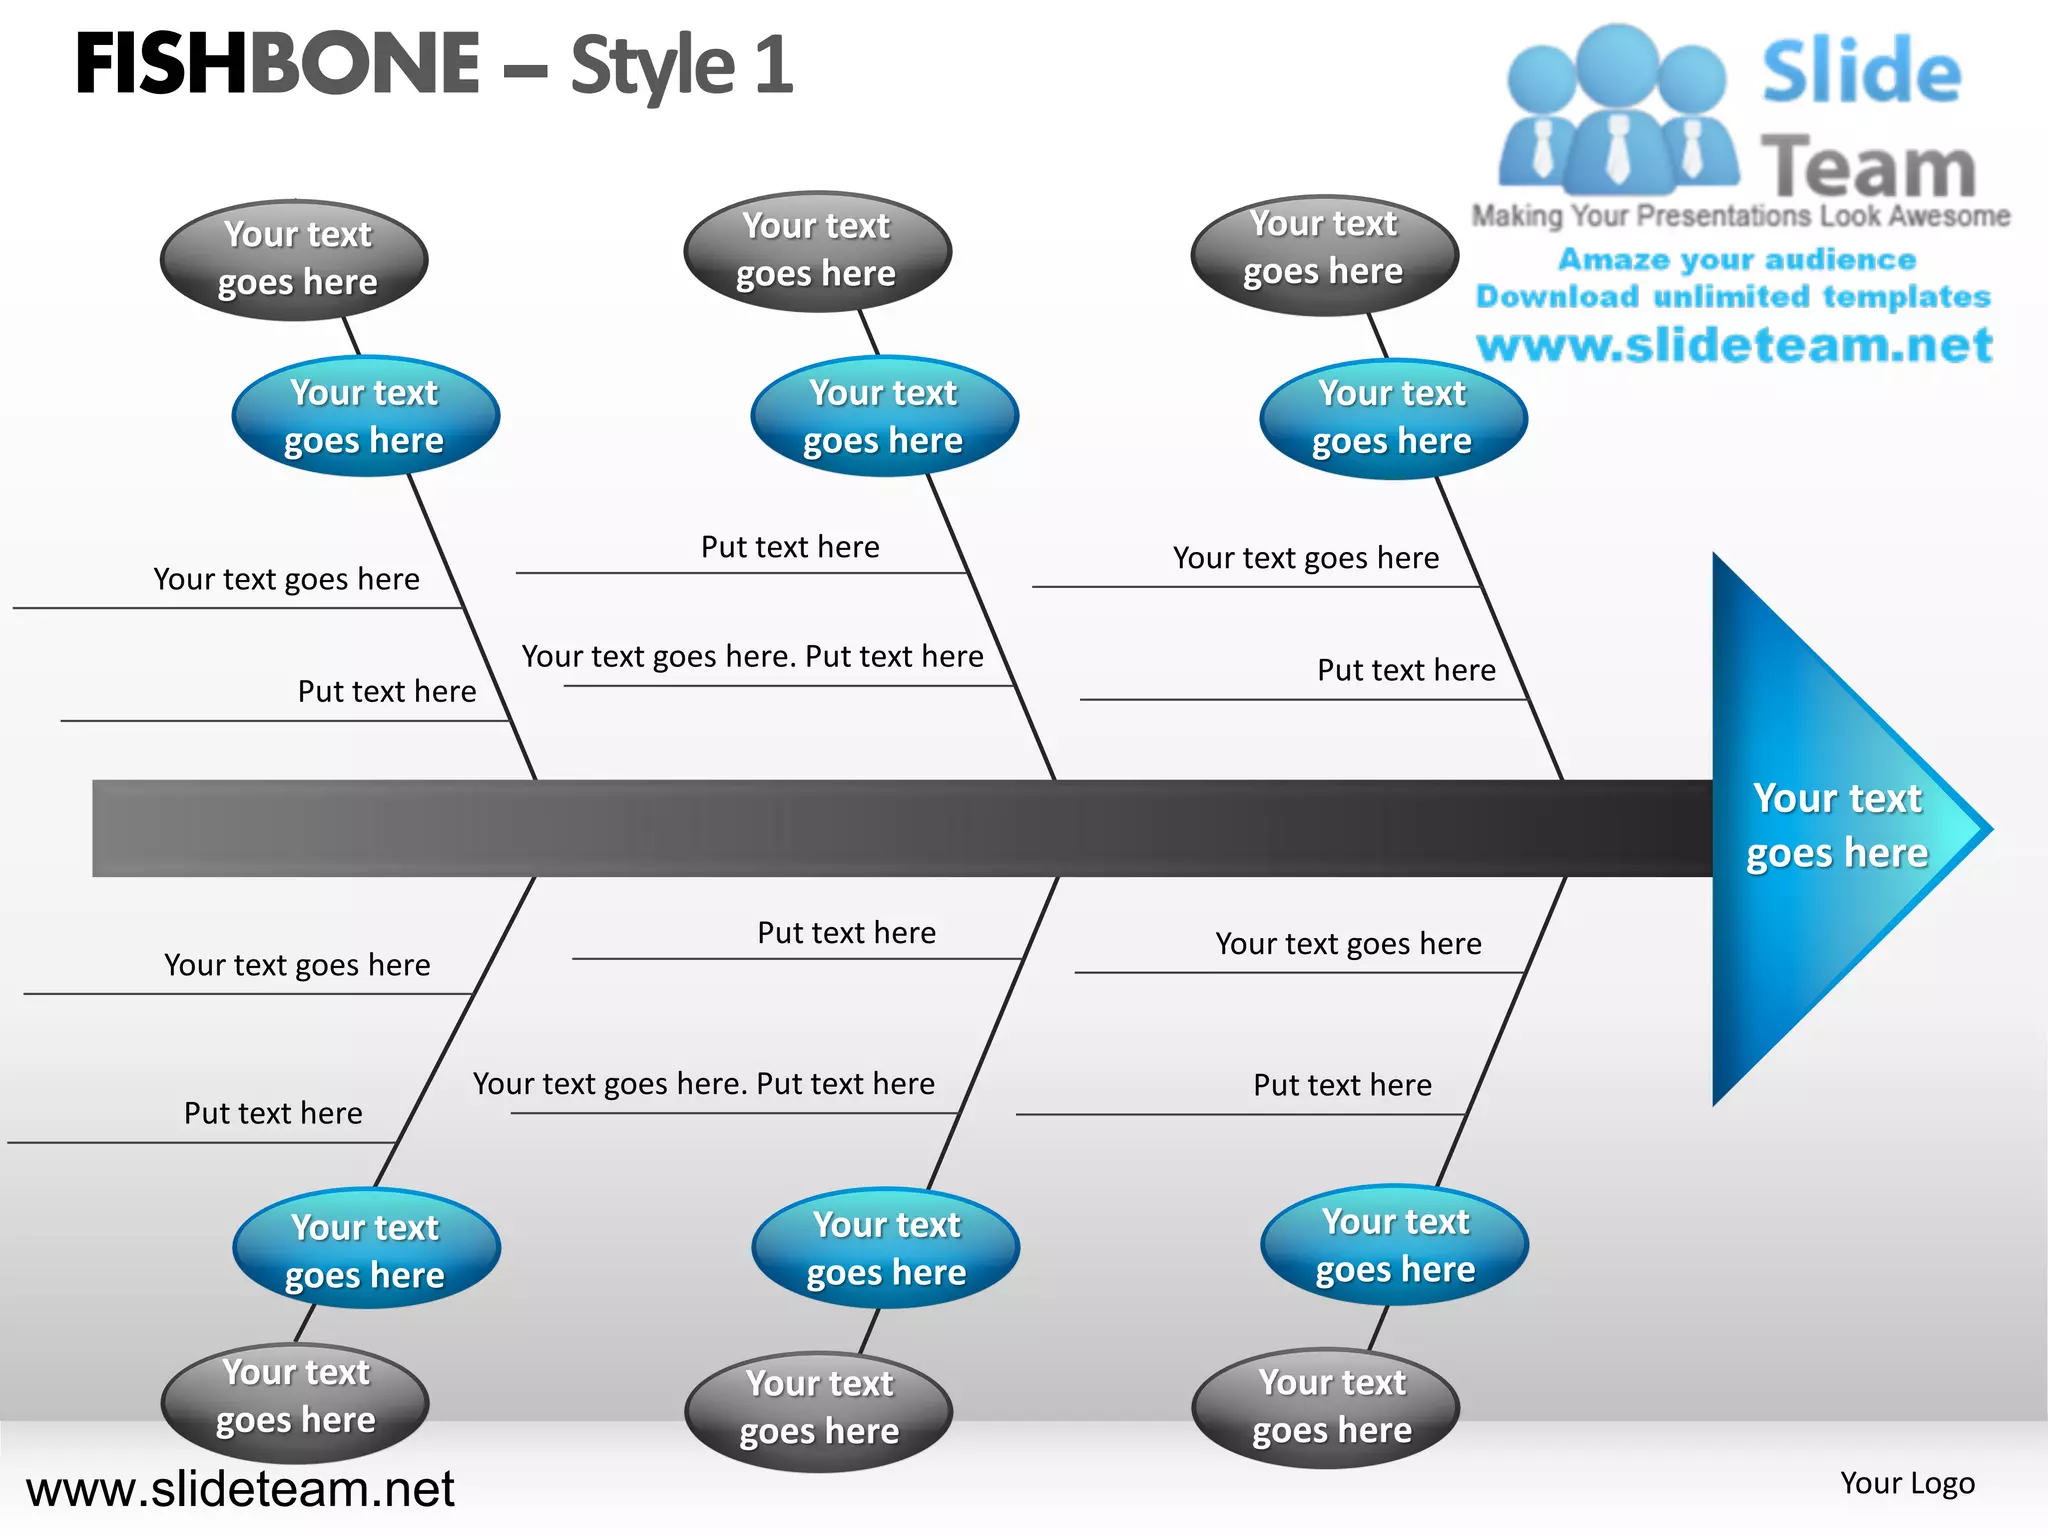
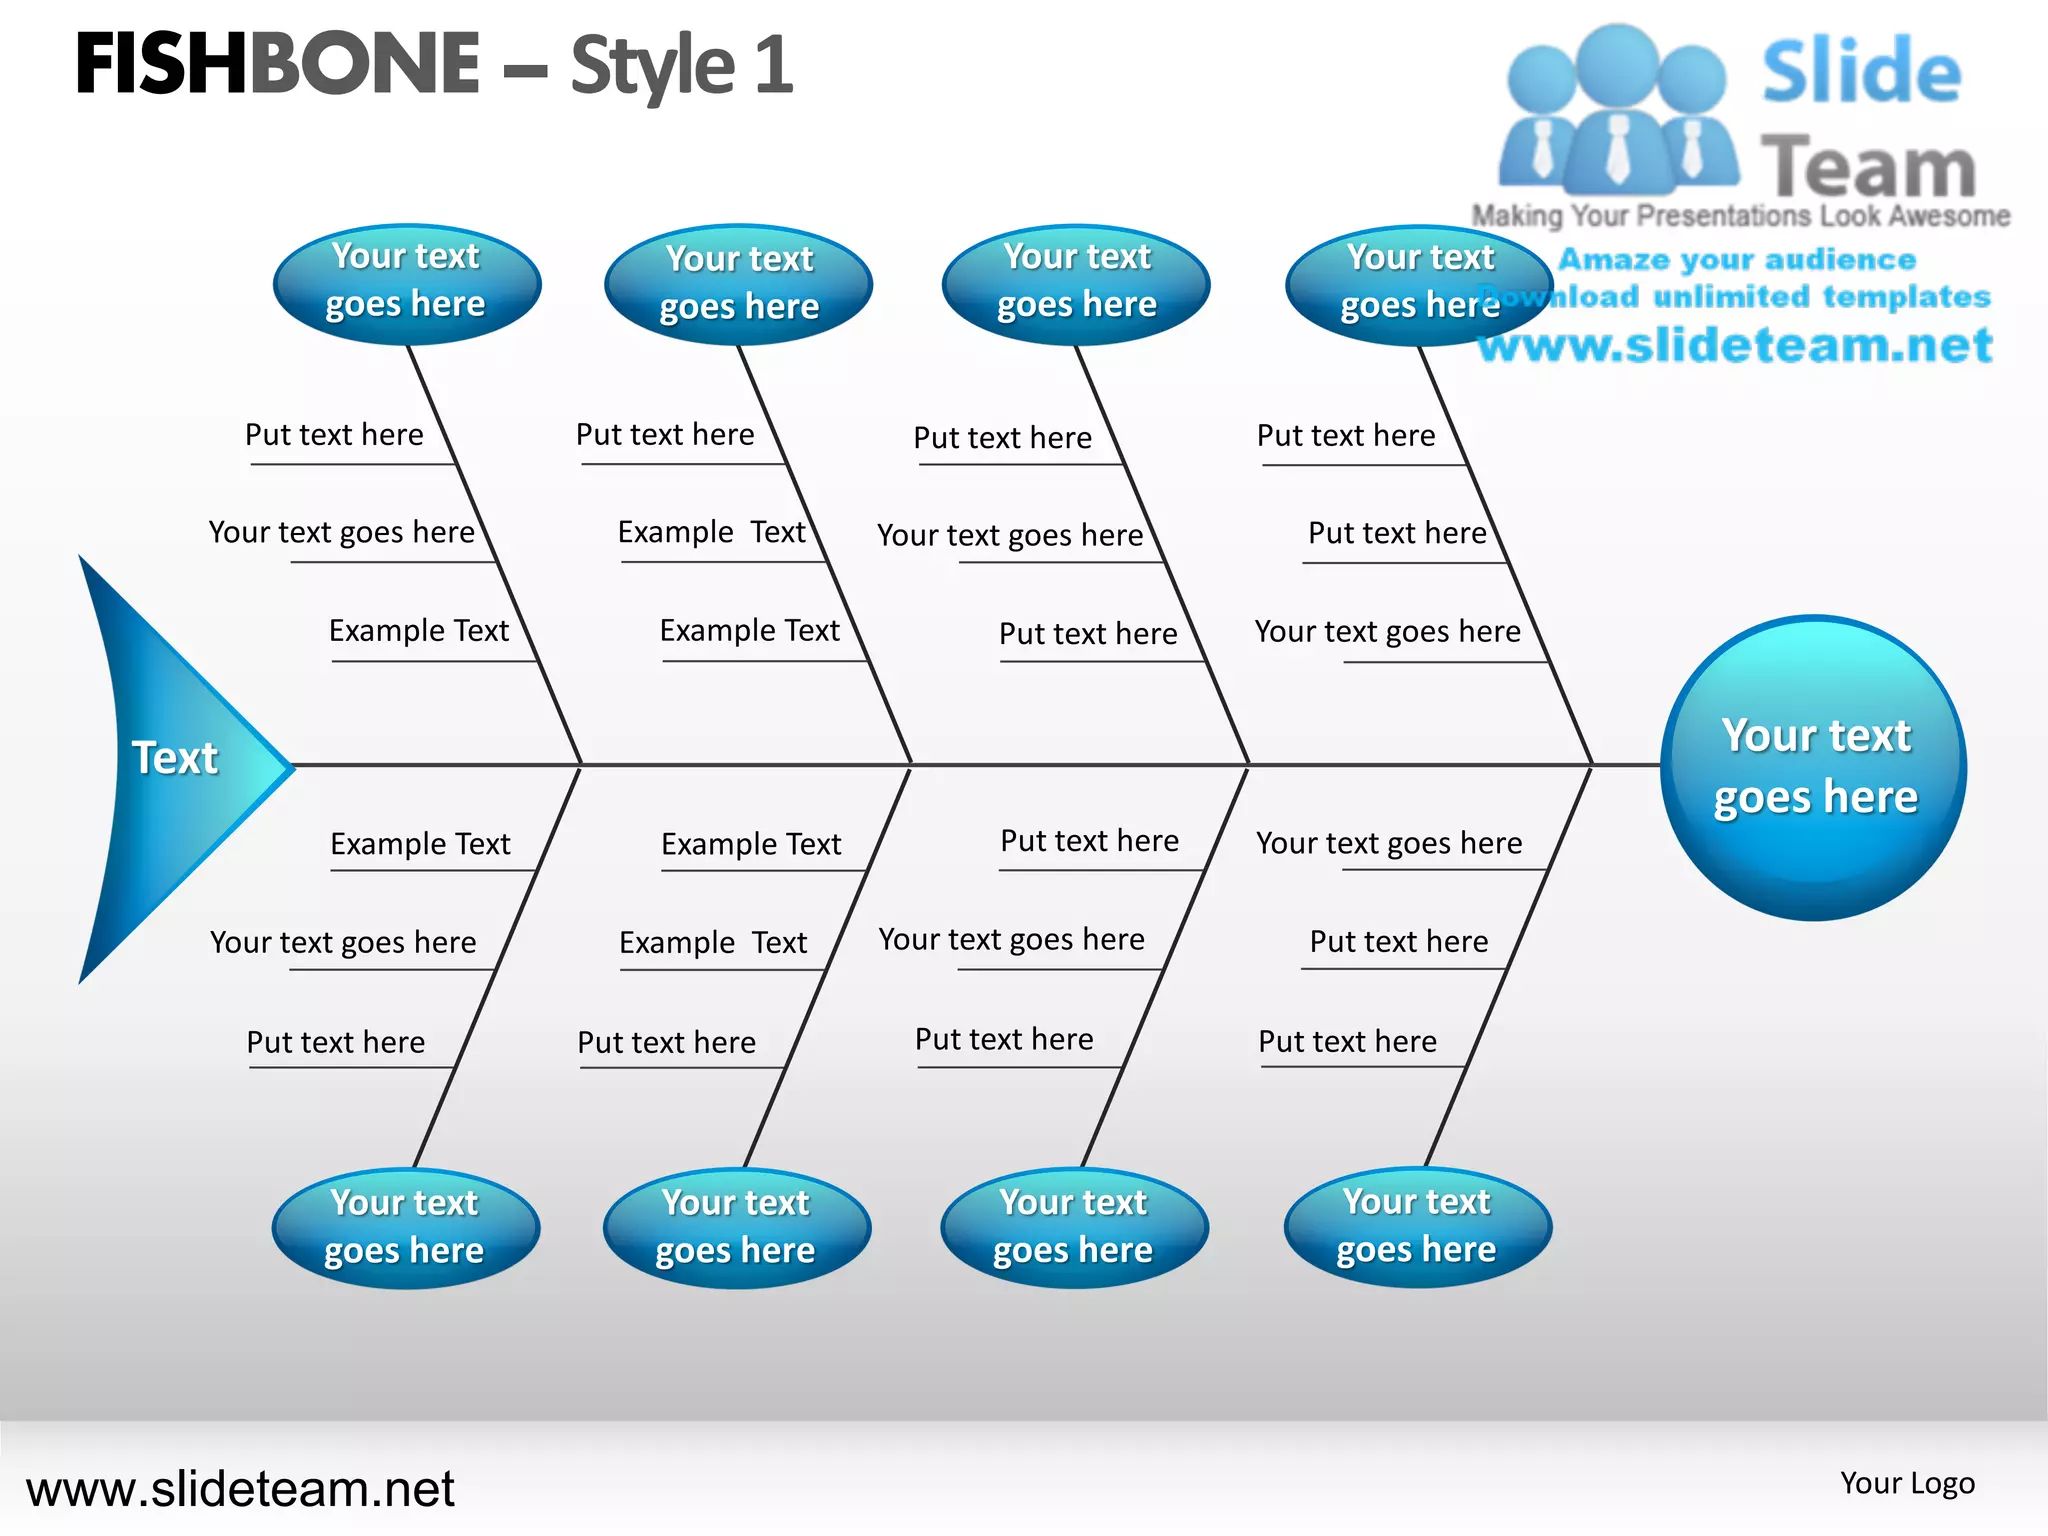
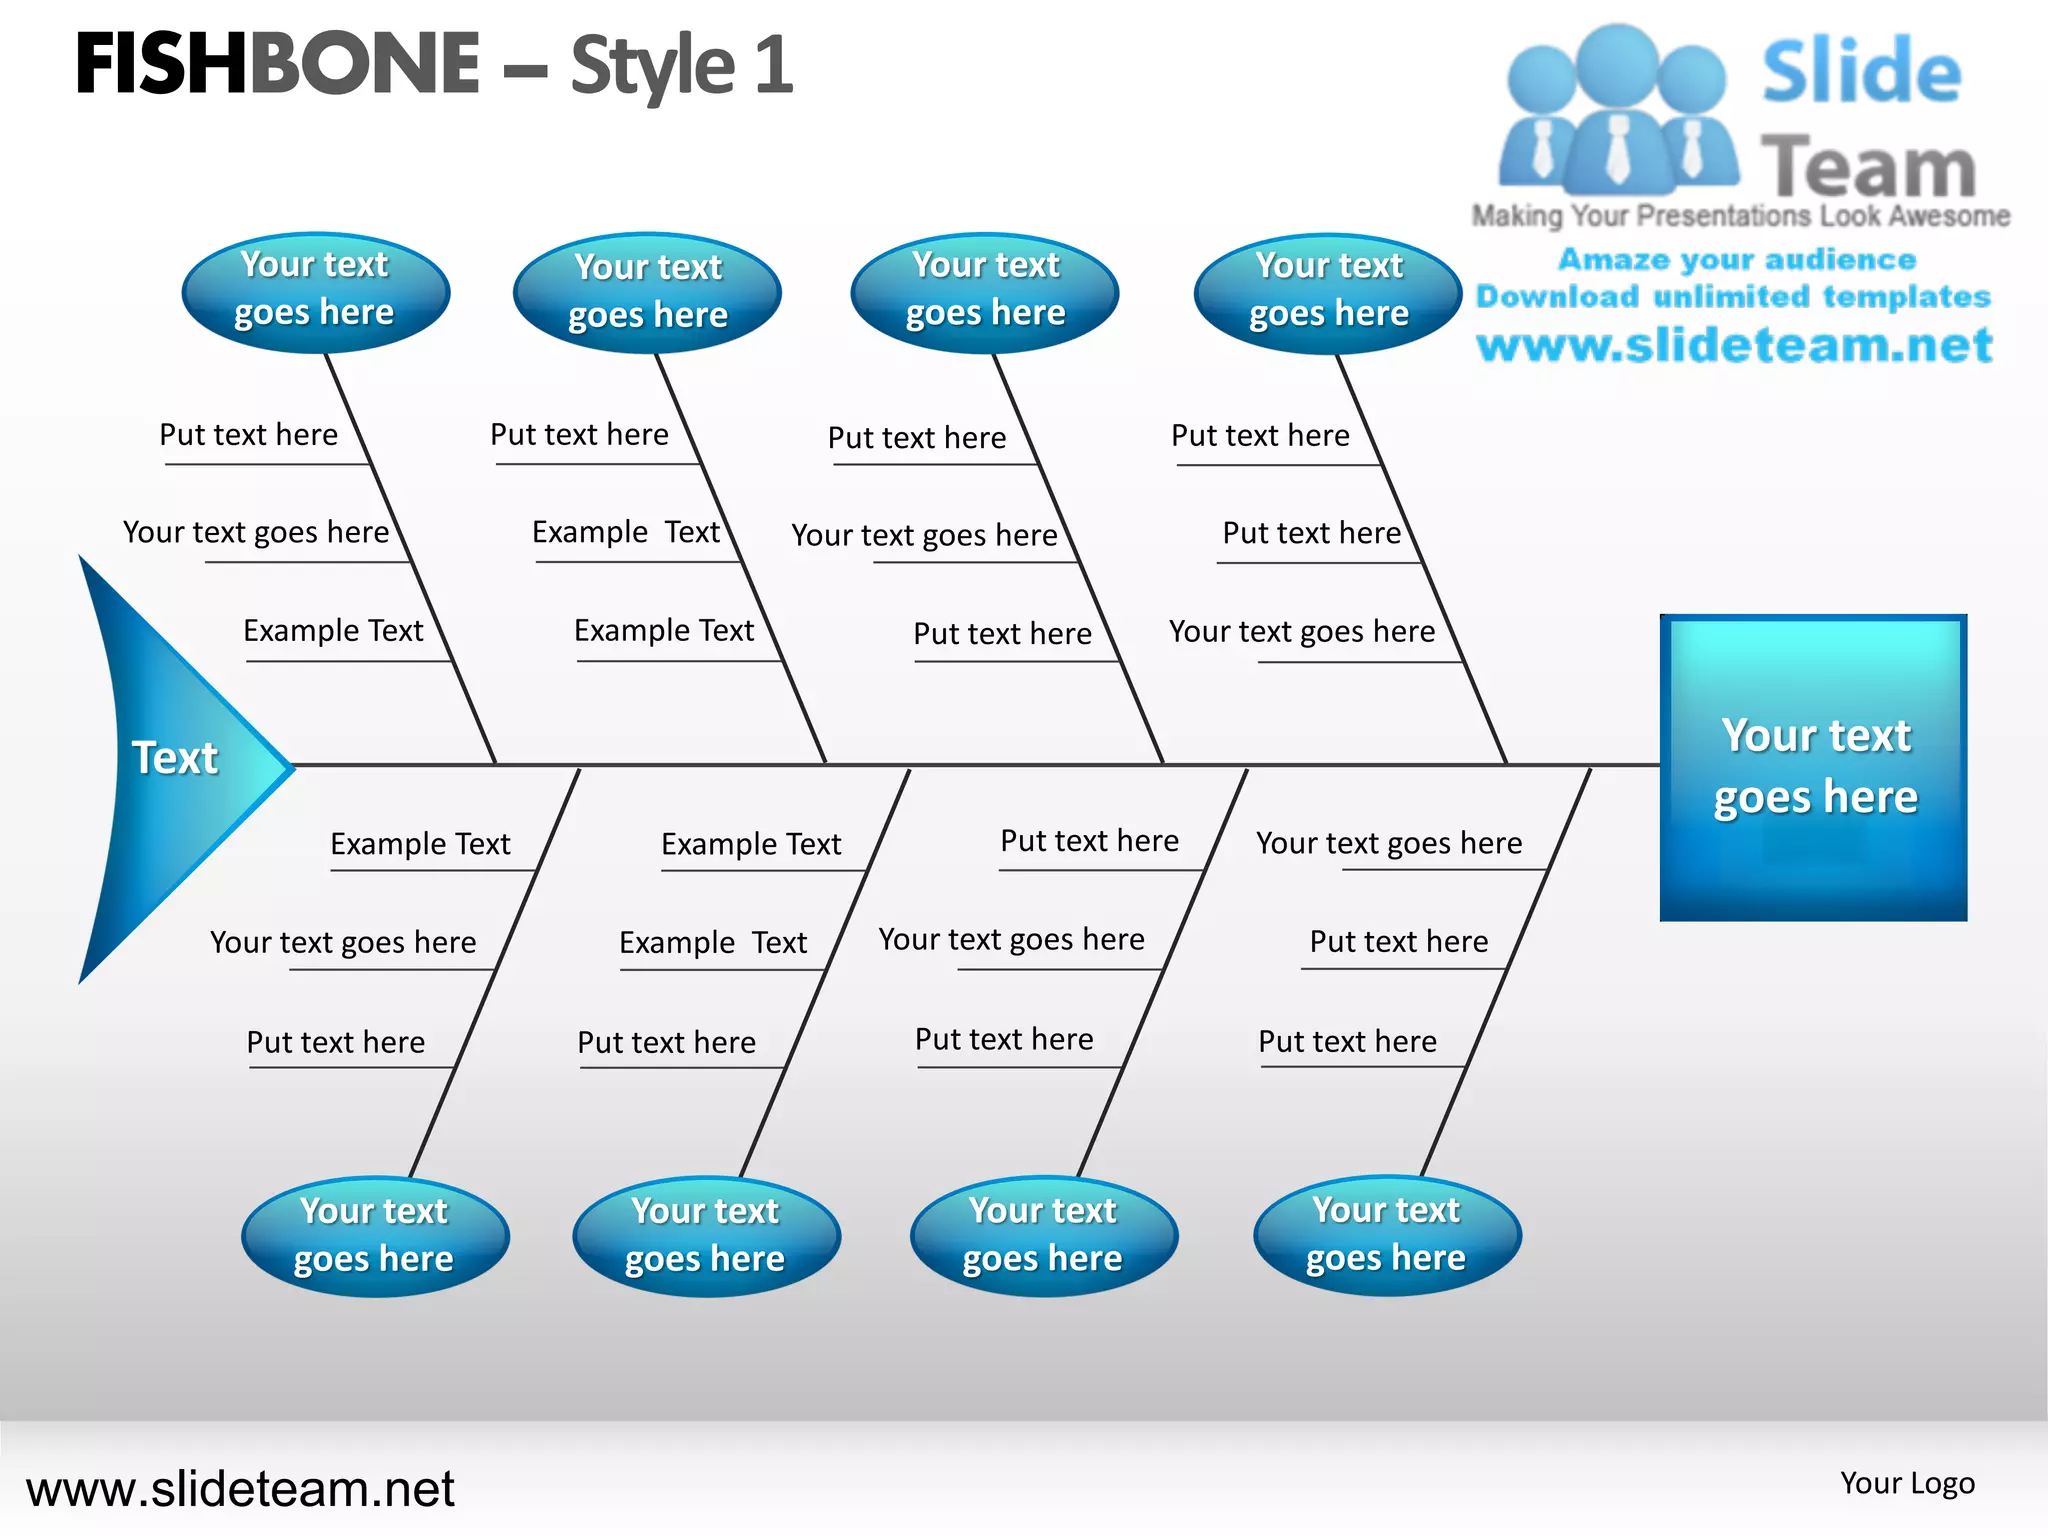
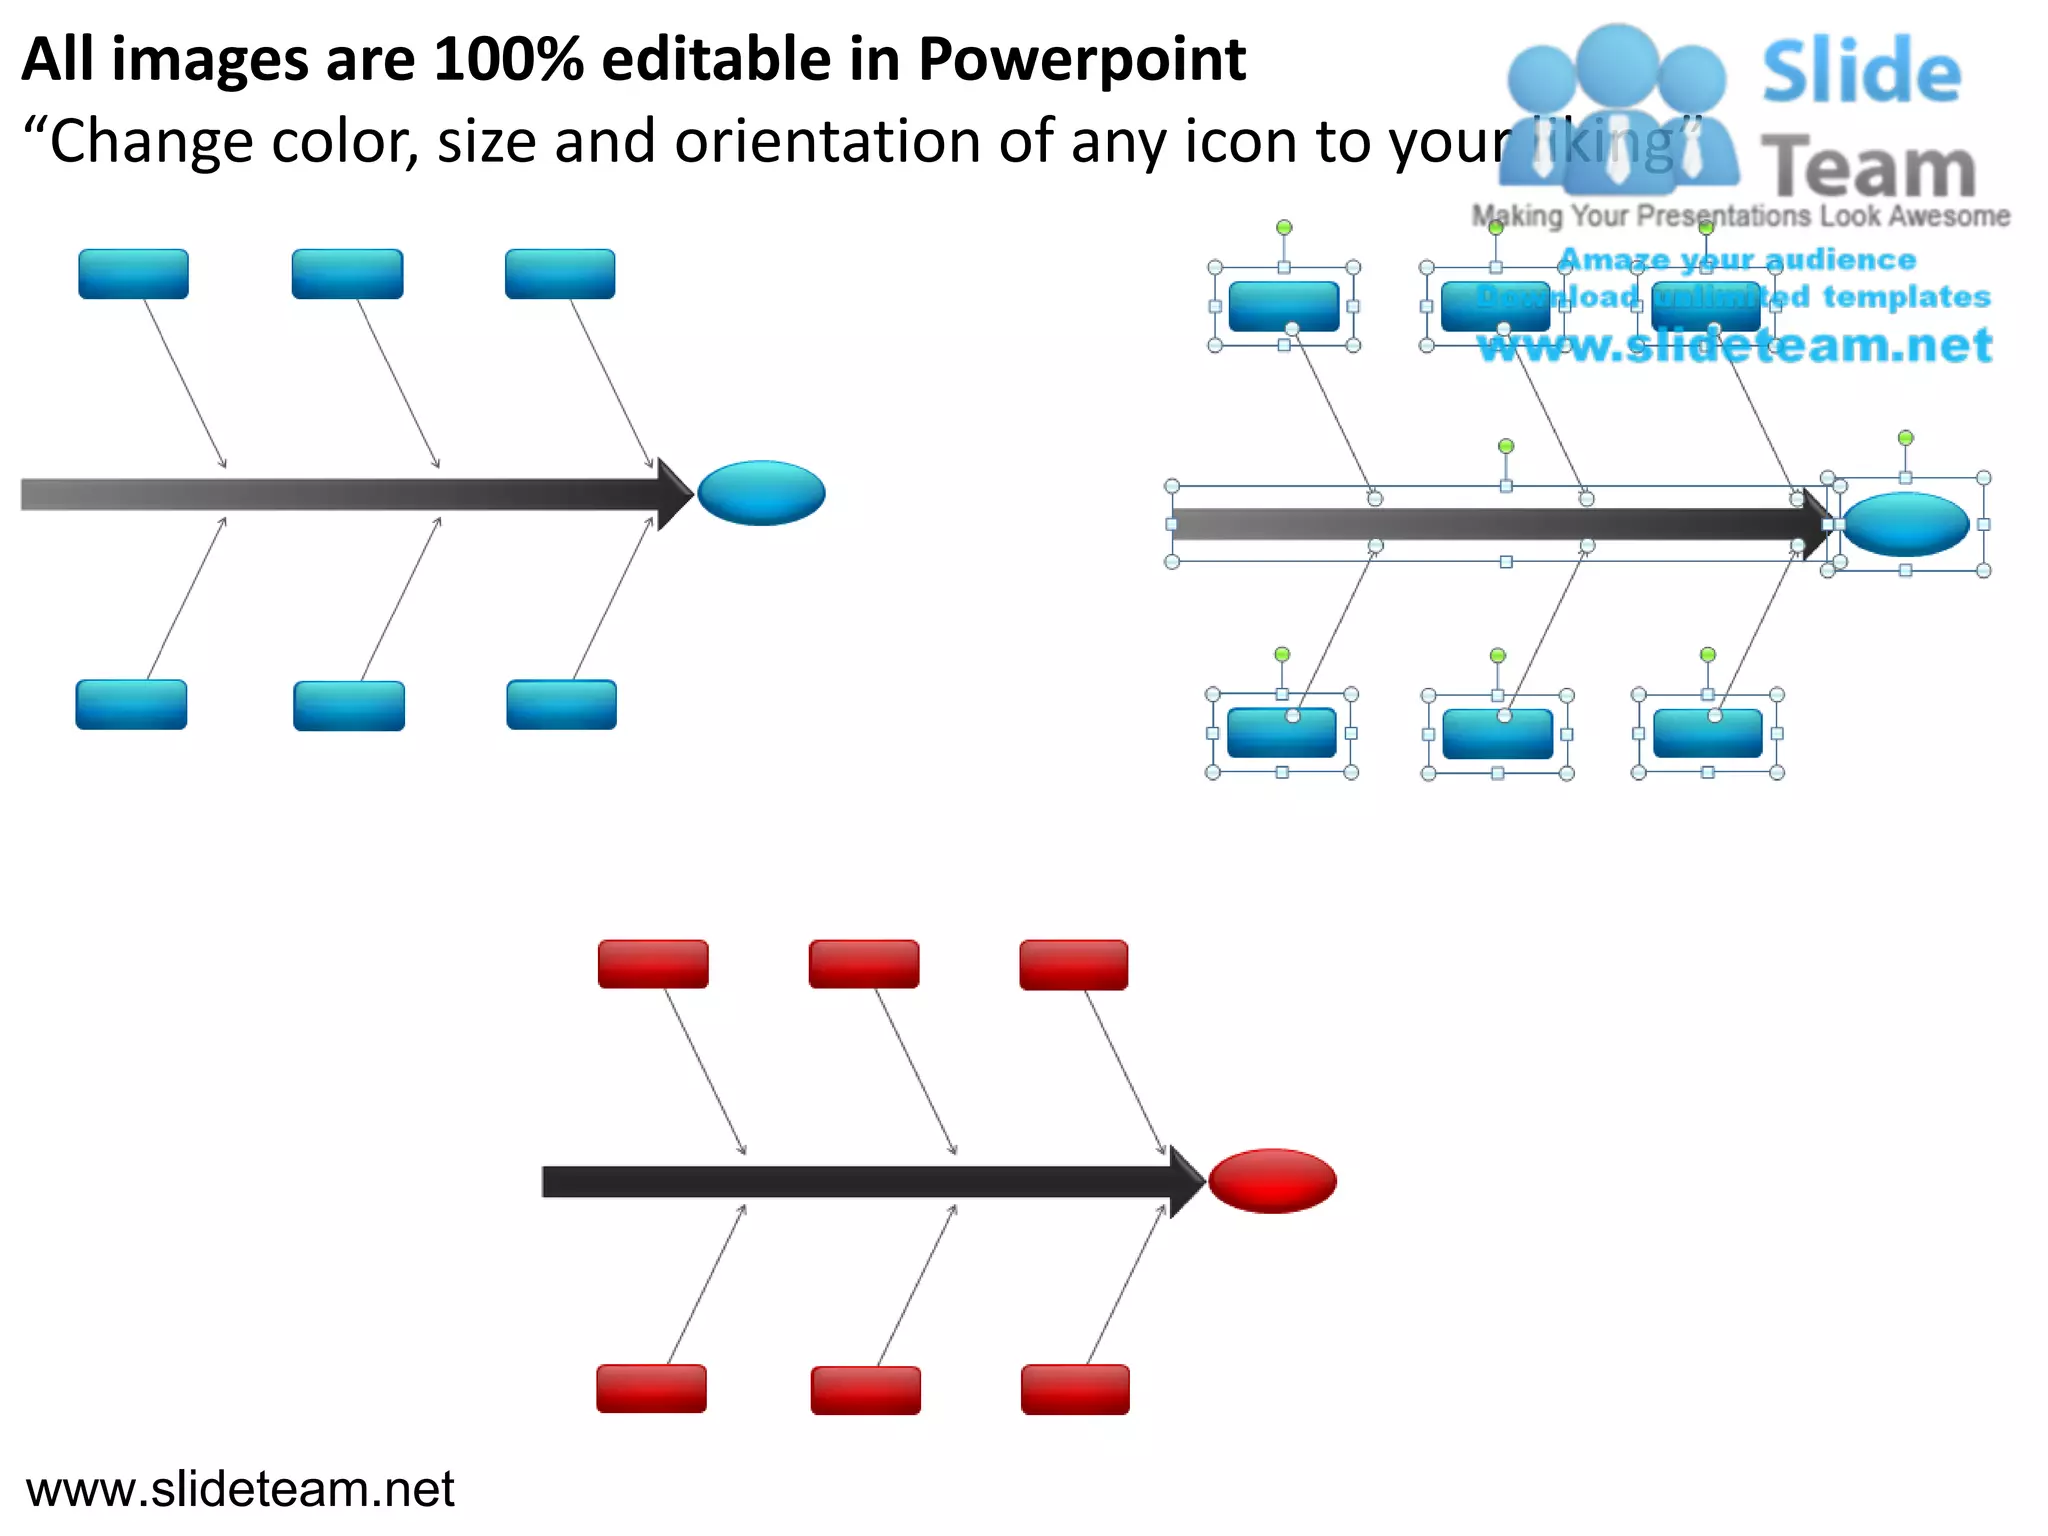
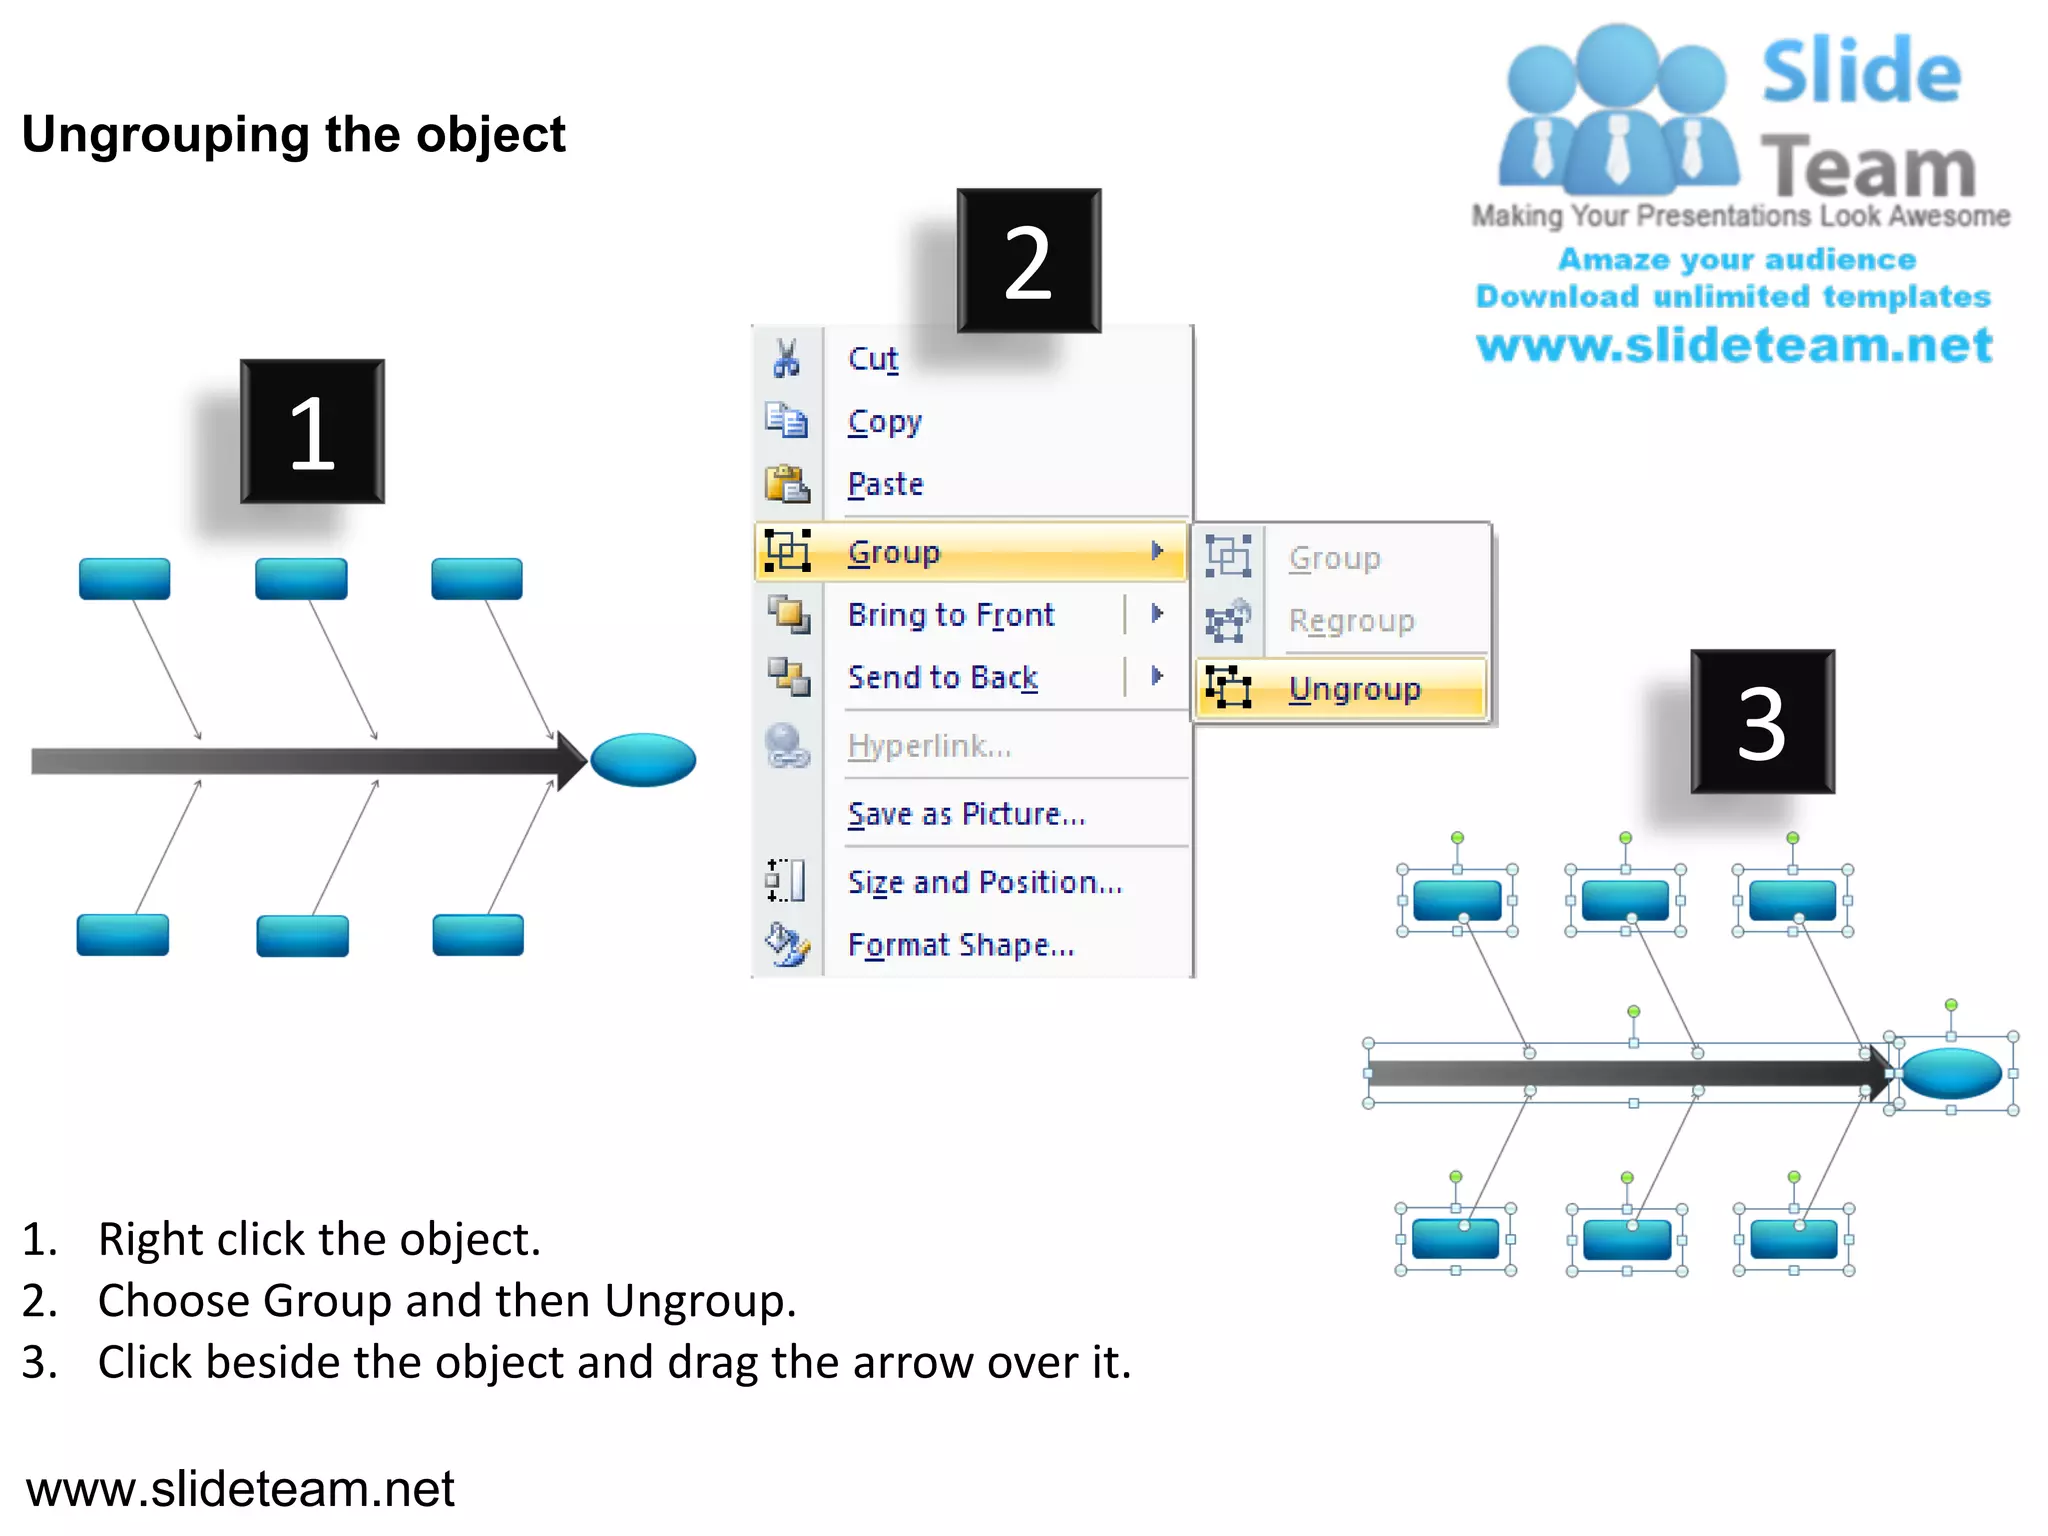
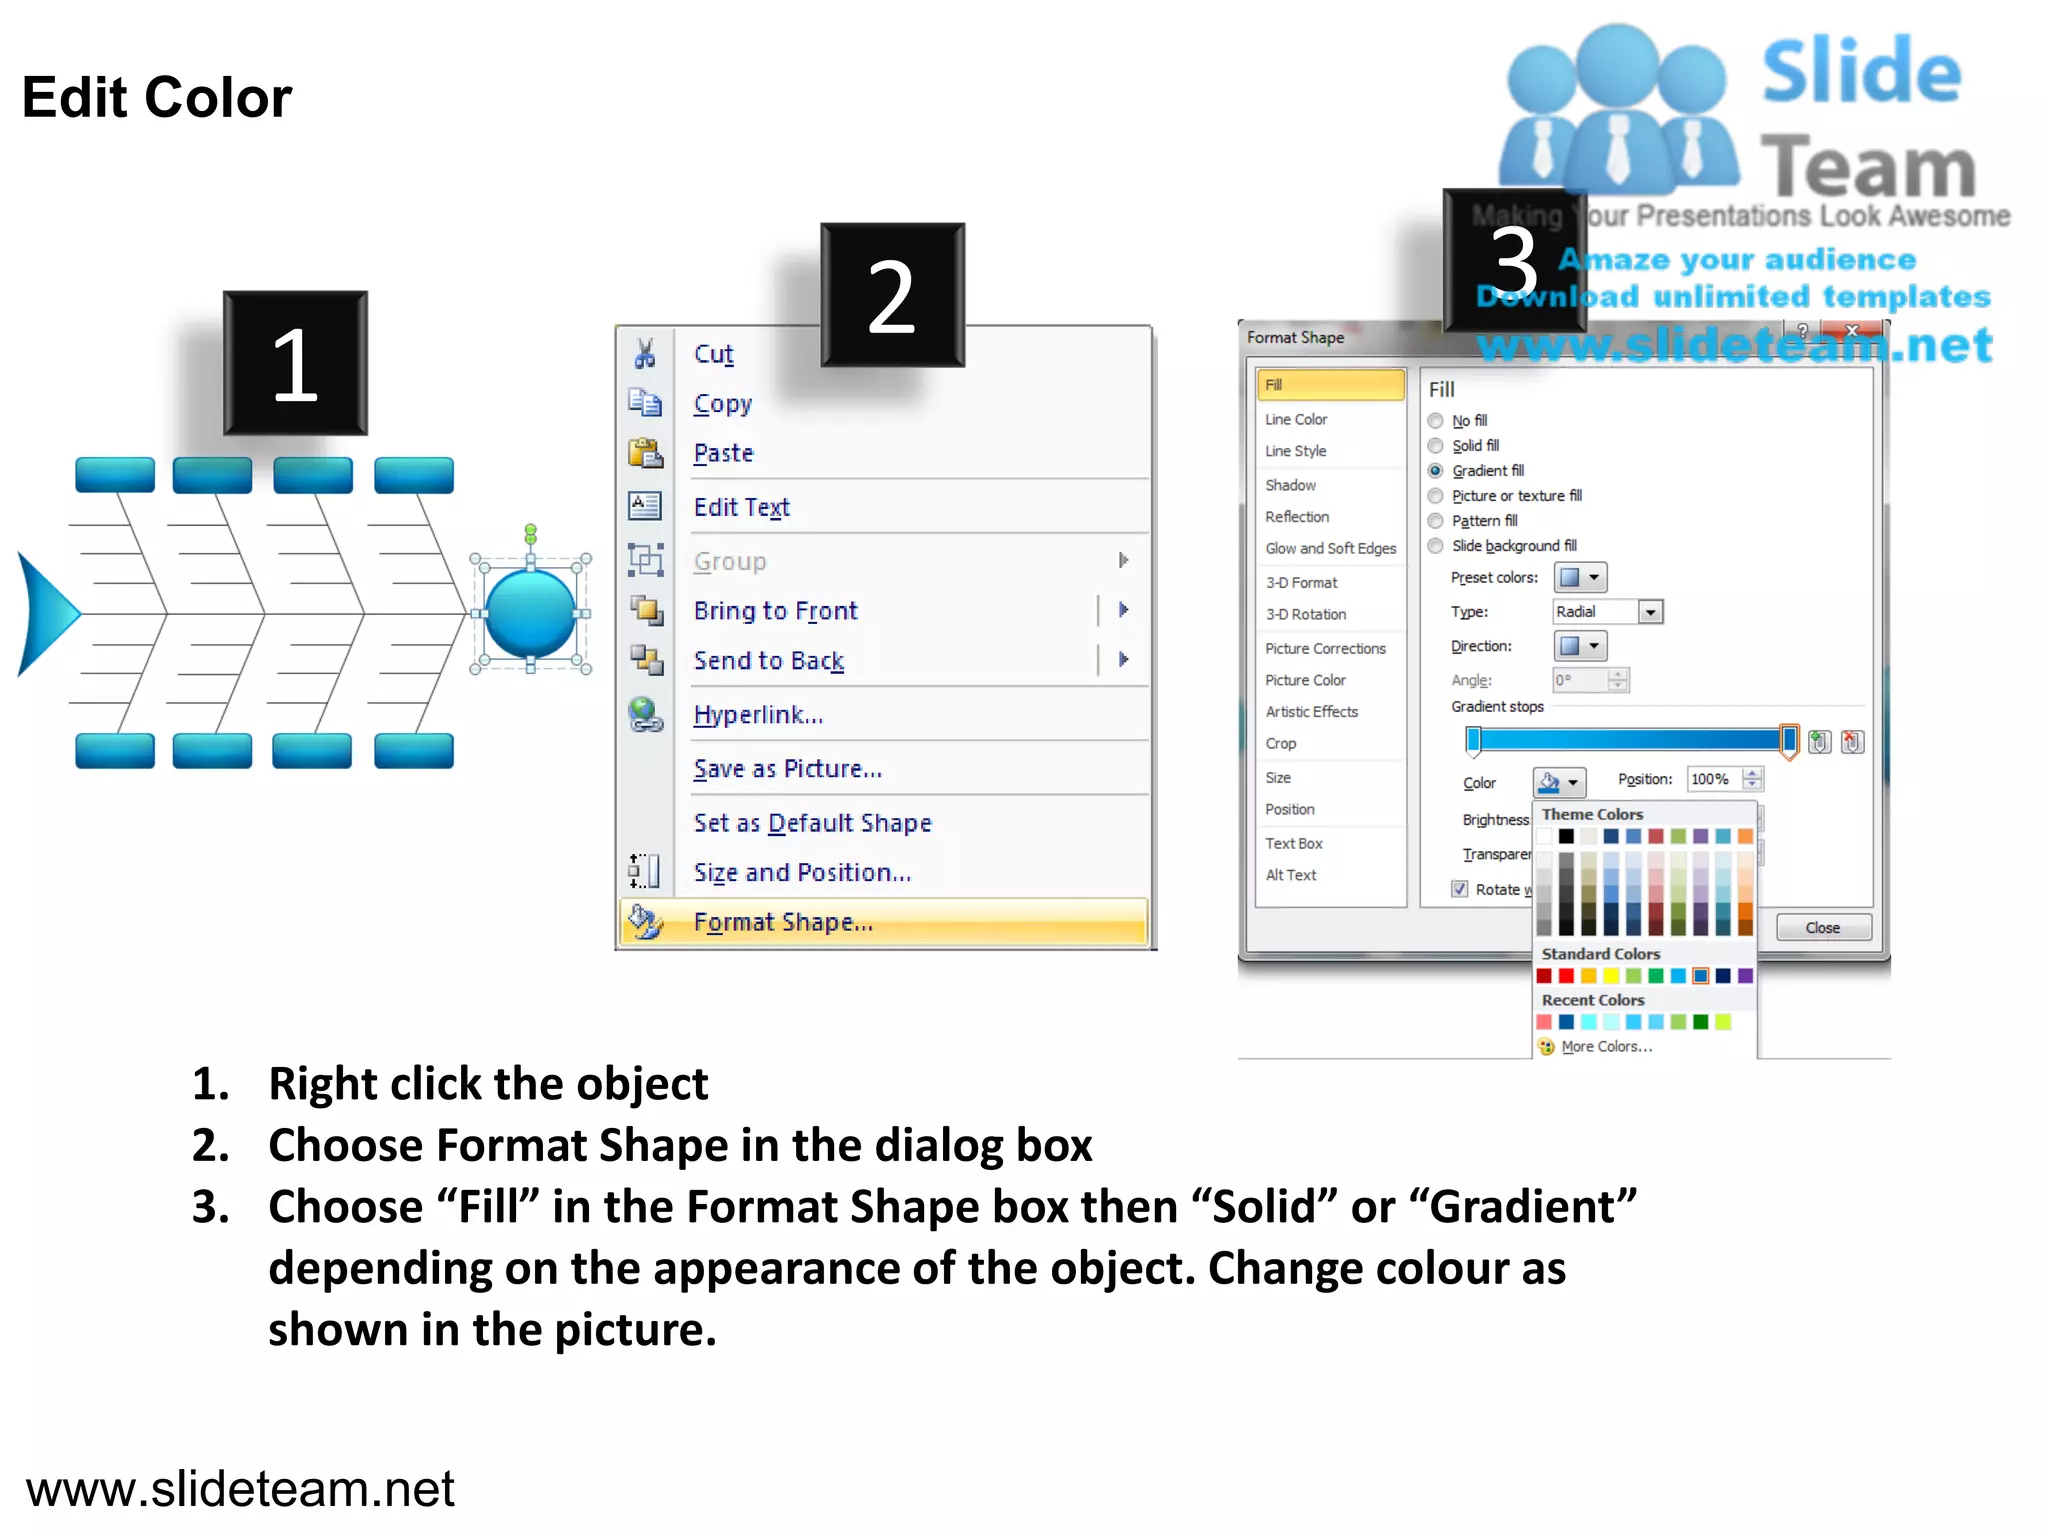

The document provides instructions for formatting a fishbone diagram in PowerPoint. It includes 27 steps to arrange text boxes and arrows in a specific layout resembling a fishbone or Ishikawa diagram. The diagram is used to explore the potential causes of a certain effect or problem. Users can customize the template by adding or editing text in each box and adjusting properties like colors and styles.


![Vibe Coding vs. Spec-Driven Development [Free Meetup]](https://cdn.slidesharecdn.com/ss_thumbnails/vibecodingvsspecdrivendevelopment-251209105622-43f455e7-thumbnail.jpg?width=640&height=640&fit=bounds)


