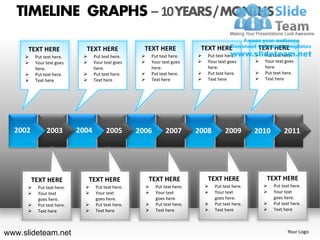
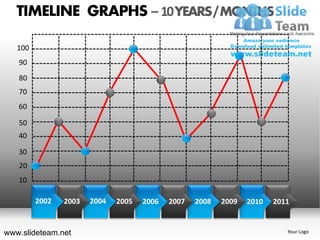
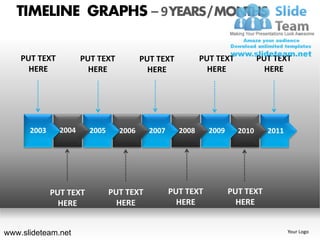
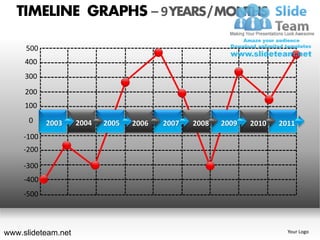
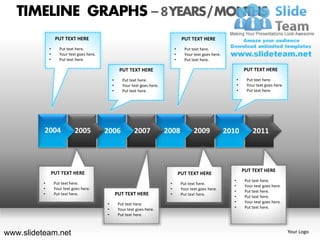
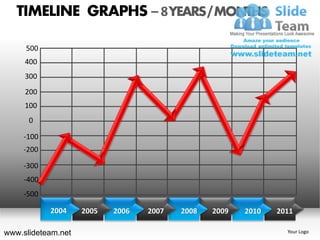
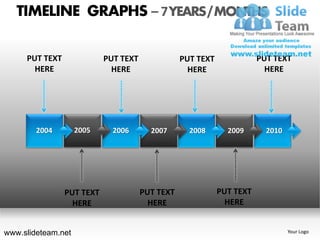
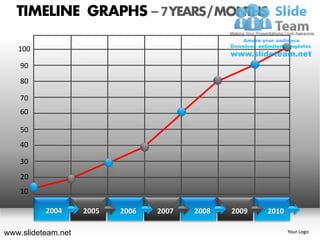
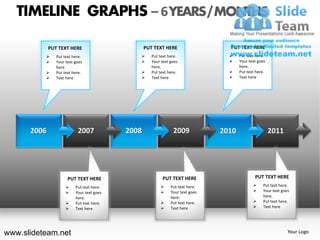
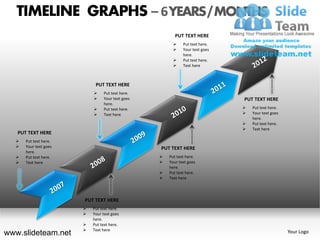
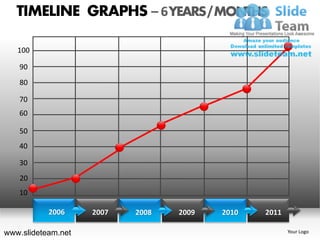
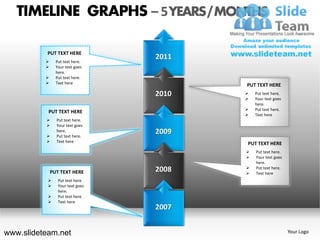
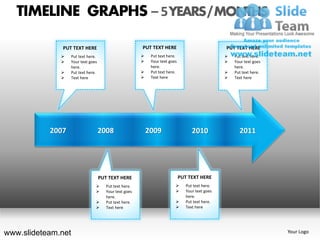
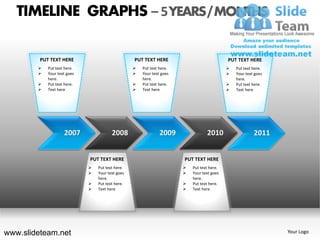
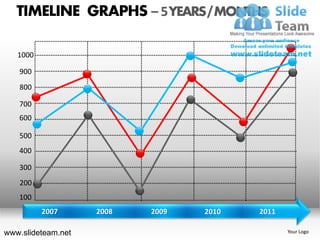
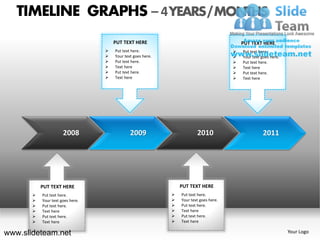
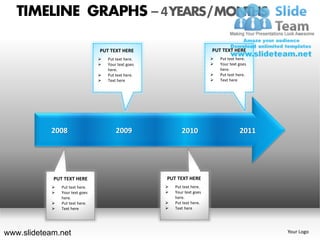
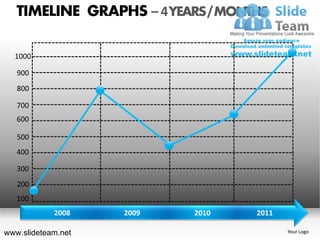
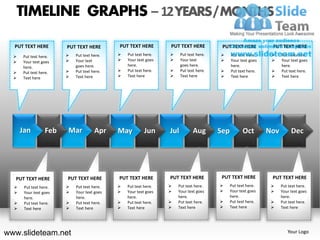
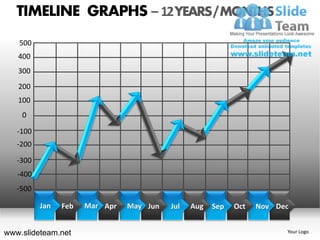
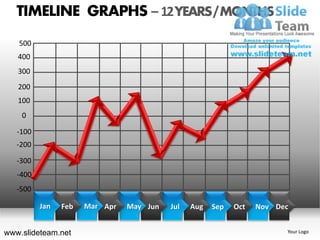
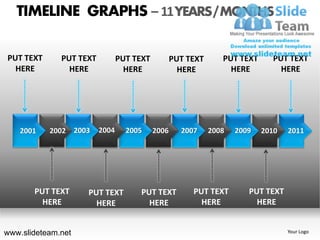
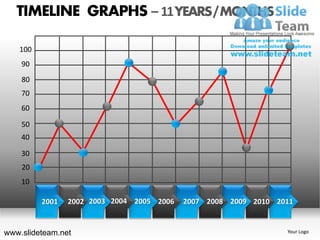
The document contains templates for timeline graphs that span different time periods from 4 to 12 years displayed in monthly or yearly intervals. Each template includes text boxes labeled "Put Text Here" to allow customization with descriptive text and metrics. Line graphs below some templates illustrate example data plots over time. The templates are intended to facilitate creation of timelines and comparisons across multiple time periods within a single slide presentation.
Smart TV Buyer Insights Survey 2024 by 91mobiles.pdf91mobiles
91mobiles recently conducted a Smart TV Buyer Insights Survey in which we asked over 3,000 respondents about the TV they own, aspects they look at on a new TV, and their TV buying preferences.
Software Delivery At the Speed of AI: Inflectra Invests In AI-Powered QualityInflectra
In this insightful webinar, Inflectra explores how artificial intelligence (AI) is transforming software development and testing. Discover how AI-powered tools are revolutionizing every stage of the software development lifecycle (SDLC), from design and prototyping to testing, deployment, and monitoring.
Learn about:
• The Future of Testing: How AI is shifting testing towards verification, analysis, and higher-level skills, while reducing repetitive tasks.
• Test Automation: How AI-powered test case generation, optimization, and self-healing tests are making testing more efficient and effective.
• Visual Testing: Explore the emerging capabilities of AI in visual testing and how it's set to revolutionize UI verification.
• Inflectra's AI Solutions: See demonstrations of Inflectra's cutting-edge AI tools like the ChatGPT plugin and Azure Open AI platform, designed to streamline your testing process.
Whether you're a developer, tester, or QA professional, this webinar will give you valuable insights into how AI is shaping the future of software delivery.
Accelerate your Kubernetes clusters with Varnish CachingThijs Feryn
A presentation about the usage and availability of Varnish on Kubernetes. This talk explores the capabilities of Varnish caching and shows how to use the Varnish Helm chart to deploy it to Kubernetes.
This presentation was delivered at K8SUG Singapore. See https://feryn.eu/presentations/accelerate-your-kubernetes-clusters-with-varnish-caching-k8sug-singapore-28-2024 for more details.
GDG Cloud Southlake #33: Boule & Rebala: Effective AppSec in SDLC using Deplo...James Anderson
Effective Application Security in Software Delivery lifecycle using Deployment Firewall and DBOM
The modern software delivery process (or the CI/CD process) includes many tools, distributed teams, open-source code, and cloud platforms. Constant focus on speed to release software to market, along with the traditional slow and manual security checks has caused gaps in continuous security as an important piece in the software supply chain. Today organizations feel more susceptible to external and internal cyber threats due to the vast attack surface in their applications supply chain and the lack of end-to-end governance and risk management.
The software team must secure its software delivery process to avoid vulnerability and security breaches. This needs to be achieved with existing tool chains and without extensive rework of the delivery processes. This talk will present strategies and techniques for providing visibility into the true risk of the existing vulnerabilities, preventing the introduction of security issues in the software, resolving vulnerabilities in production environments quickly, and capturing the deployment bill of materials (DBOM).
Speakers:
Bob Boule
Robert Boule is a technology enthusiast with PASSION for technology and making things work along with a knack for helping others understand how things work. He comes with around 20 years of solution engineering experience in application security, software continuous delivery, and SaaS platforms. He is known for his dynamic presentations in CI/CD and application security integrated in software delivery lifecycle.
Gopinath Rebala
Gopinath Rebala is the CTO of OpsMx, where he has overall responsibility for the machine learning and data processing architectures for Secure Software Delivery. Gopi also has a strong connection with our customers, leading design and architecture for strategic implementations. Gopi is a frequent speaker and well-known leader in continuous delivery and integrating security into software delivery.
Slack (or Teams) Automation for Bonterra Impact Management (fka Social Soluti...Jeffrey Haguewood
Sidekick Solutions uses Bonterra Impact Management (fka Social Solutions Apricot) and automation solutions to integrate data for business workflows.
We believe integration and automation are essential to user experience and the promise of efficient work through technology. Automation is the critical ingredient to realizing that full vision. We develop integration products and services for Bonterra Case Management software to support the deployment of automations for a variety of use cases.
This video focuses on the notifications, alerts, and approval requests using Slack for Bonterra Impact Management. The solutions covered in this webinar can also be deployed for Microsoft Teams.
Interested in deploying notification automations for Bonterra Impact Management? Contact us at sales@sidekicksolutionsllc.com to discuss next steps.
Key Trends Shaping the Future of Infrastructure.pdfCheryl Hung
Keynote at DIGIT West Expo, Glasgow on 29 May 2024.
Cheryl Hung, ochery.com
Sr Director, Infrastructure Ecosystem, Arm.
The key trends across hardware, cloud and open-source; exploring how these areas are likely to mature and develop over the short and long-term, and then considering how organisations can position themselves to adapt and thrive.
State of ICS and IoT Cyber Threat Landscape Report 2024 previewPrayukth K V
The IoT and OT threat landscape report has been prepared by the Threat Research Team at Sectrio using data from Sectrio, cyber threat intelligence farming facilities spread across over 85 cities around the world. In addition, Sectrio also runs AI-based advanced threat and payload engagement facilities that serve as sinks to attract and engage sophisticated threat actors, and newer malware including new variants and latent threats that are at an earlier stage of development.
The latest edition of the OT/ICS and IoT security Threat Landscape Report 2024 also covers:
State of global ICS asset and network exposure
Sectoral targets and attacks as well as the cost of ransom
Global APT activity, AI usage, actor and tactic profiles, and implications
Rise in volumes of AI-powered cyberattacks
Major cyber events in 2024
Malware and malicious payload trends
Cyberattack types and targets
Vulnerability exploit attempts on CVEs
Attacks on counties – USA
Expansion of bot farms – how, where, and why
In-depth analysis of the cyber threat landscape across North America, South America, Europe, APAC, and the Middle East
Why are attacks on smart factories rising?
Cyber risk predictions
Axis of attacks – Europe
Systemic attacks in the Middle East
Download the full report from here:
https://sectrio.com/resources/ot-threat-landscape-reports/sectrio-releases-ot-ics-and-iot-security-threat-landscape-report-2024/
GraphRAG is All You need? LLM & Knowledge GraphGuy Korland
Guy Korland, CEO and Co-founder of FalkorDB, will review two articles on the integration of language models with knowledge graphs.
1. Unifying Large Language Models and Knowledge Graphs: A Roadmap.
https://arxiv.org/abs/2306.08302
2. Microsoft Research's GraphRAG paper and a review paper on various uses of knowledge graphs:
https://www.microsoft.com/en-us/research/blog/graphrag-unlocking-llm-discovery-on-narrative-private-data/
Kubernetes & AI - Beauty and the Beast !?! @KCD Istanbul 2024Tobias Schneck
As AI technology is pushing into IT I was wondering myself, as an “infrastructure container kubernetes guy”, how get this fancy AI technology get managed from an infrastructure operational view? Is it possible to apply our lovely cloud native principals as well? What benefit’s both technologies could bring to each other?
Let me take this questions and provide you a short journey through existing deployment models and use cases for AI software. On practical examples, we discuss what cloud/on-premise strategy we may need for applying it to our own infrastructure to get it to work from an enterprise perspective. I want to give an overview about infrastructure requirements and technologies, what could be beneficial or limiting your AI use cases in an enterprise environment. An interactive Demo will give you some insides, what approaches I got already working for real.
1. TIMELINE GRAPHS – 10 YEARS / MONTHS
TEXT HERE TEXT HERE TEXT HERE TEXT HERE TEXT HERE
Put text here. Put text here. Put text here. Put text here. Put text here.
Your text goes Your text goes Your text goes Your text goes Your text goes
here. here. here. here. here.
Put text here. Put text here. Put text here. Put text here. Put text here.
Text here Text here Text here Text here Text here
2002 2003 2004 2005 2006 2007 2008 2009 2010 2011
TEXT HERE TEXT HERE TEXT HERE TEXT HERE TEXT HERE
Put text here. Put text here. Put text here. Put text here. Put text here.
Your text Your text Your text Your text Your text
goes here. goes here. goes here. goes here. goes here.
Put text here. Put text here. Put text here. Put text here. Put text here.
Text here Text here Text here Text here Text here
www.slideteam.net Your Logo
3. TIMELINE GRAPHS – 9 YEARS / MONTHS
PUT TEXT PUT TEXT PUT TEXT PUT TEXT PUT TEXT
HERE HERE HERE HERE HERE
2003 2004 2005 2006 2007 2008 2009 2010 2011
PUT TEXT PUT TEXT PUT TEXT PUT TEXT
HERE HERE HERE HERE
www.slideteam.net Your Logo
5. TIMELINE GRAPHS – 8 YEARS / MONTHS
PUT TEXT HERE PUT TEXT HERE
• Put text here. • Put text here.
• Your text goes here. • Your text goes here.
• Put text here. • Put text here.
PUT TEXT HERE PUT TEXT HERE
• Put text here. • Put text here.
• Your text goes here. • Your text goes here.
• Put text here. • Put text here.
2004 2005 2006 2007 2008 2009 2010 2011
PUT TEXT HERE
PUT TEXT HERE PUT TEXT HERE
• Put text here.
• Put text here. • Put text here.
• Your text goes here.
• Your text goes here. • Your text goes here.
• Put text here.
• Put text here. PUT TEXT HERE • Put text here.
• Put text here.
• Put text here. • Your text goes here.
• Your text goes here. • Put text here.
• Put text here.
www.slideteam.net Your Logo
6. TIMELINE GRAPHS – 8 YEARS / MONTHS
500
400
300
200
100
0
-100
-200
-300
-400
-500
2004 2005 2006 2007 2008 2009 2010 2011
www.slideteam.net Your Logo
7. TIMELINE GRAPHS – 7 YEARS / MONTHS
PUT TEXT PUT TEXT PUT TEXT PUT TEXT
HERE HERE HERE HERE
2004 2005 2006 2007 2008 2009 2010
PUT TEXT PUT TEXT PUT TEXT
HERE HERE HERE
www.slideteam.net Your Logo
8. TIMELINE GRAPHS – 7 YEARS / MONTHS
100
90
80
70
60
50
40
30
20
10
2004 2005 2006 2007 2008 2009 2010
www.slideteam.net Your Logo
9. TIMELINE GRAPHS – 6 YEARS / MONTHS
PUT TEXT HERE PUT TEXT HERE PUT TEXT HERE
Put text here. Put text here. Put text here.
Your text goes Your text goes Your text goes
here. here. here.
Put text here. Put text here. Put text here.
Text here Text here Text here
2006 2007 2008 2009 2010 2011
PUT TEXT HERE PUT TEXT HERE PUT TEXT HERE
Put text here. Put text here. Put text here.
Your text goes Your text goes Your text goes
here. here. here.
Put text here. Put text here. Put text here.
Text here Text here Text here
www.slideteam.net Your Logo
10. TIMELINE GRAPHS – 6 YEARS / MONTHS
PUT TEXT HERE
Put text here.
Your text goes
here.
Put text here.
Text here
PUT TEXT HERE
Put text here.
Your text goes PUT TEXT HERE
here.
Put text here. Put text here.
Text here Your text goes
here.
Put text here.
Text here
PUT TEXT HERE
Put text here.
Your text goes PUT TEXT HERE
here.
Put text here. Put text here.
Text here Your text goes
here.
Put text here.
Text here
PUT TEXT HERE
Put text here.
Your text goes
here.
Put text here.
Text here
www.slideteam.net Your Logo
11. TIMELINE GRAPHS – 6 YEARS / MONTHS
100
90
80
70
60
50
40
30
20
10
2006 2007 2008 2009 2010 2011
www.slideteam.net Your Logo
12. TIMELINE GRAPHS – 5 YEARS / MONTHS
PUT TEXT HERE
Put text here.
2011
Your text goes
here.
Put text here.
Text here
PUT TEXT HERE
2010 Put text here.
Your text goes
here.
Put text here.
PUT TEXT HERE
Text here
Put text here.
Your text goes
here.
Put text here.
2009
Text here
PUT TEXT HERE
Put text here.
Your text goes
here.
PUT TEXT HERE 2008
Put text here.
Text here
Put text here.
Your text goes
here.
Put text here.
Text here
2007
www.slideteam.net Your Logo
13. TIMELINE GRAPHS – 5 YEARS / MONTHS
PUT TEXT HERE PUT TEXT HERE PUT TEXT HERE
Put text here. Put text here. Put text here.
Your text goes Your text goes Your text goes
here. here. here.
Put text here. Put text here. Put text here.
Text here Text here Text here
2007 2008 2009 2010 2011
PUT TEXT HERE PUT TEXT HERE
Put text here. Put text here.
Your text goes Your text goes
here. here.
Put text here. Put text here.
Text here Text here
www.slideteam.net Your Logo
14. TIMELINE GRAPHS – 5 YEARS / MONTHS
PUT TEXT HERE PUT TEXT HERE PUT TEXT HERE
Put text here. Put text here. Put text here.
Your text goes Your text goes Your text goes
here. here. here.
Put text here. Put text here. Put text here.
Text here Text here Text here
2007 2008 2009 2010 2011
PUT TEXT HERE PUT TEXT HERE
Put text here. Put text here.
Your text goes Your text goes
here. here.
Put text here. Put text here.
Text here Text here
www.slideteam.net Your Logo
15. TIMELINE GRAPHS – 5 YEARS / MONTHS
1000
900
800
700
600
500
400
300
200
100
2007 2008 2009 2010 2011
www.slideteam.net Your Logo
16. TIMELINE GRAPHS – 4 YEARS / MONTHS
PUT TEXT HERE PUT TEXT HERE
Put text here. Put text here.
Your text goes here. Your text goes here.
Put text here. Put text here.
Text here Text here
Put text here. Put text here.
Text here Text here
2008 2009 2010 2011
PUT TEXT HERE PUT TEXT HERE
Put text here. Put text here.
Your text goes here. Your text goes here.
Put text here. Put text here.
Text here Text here
Put text here. Put text here.
Text here Text here
www.slideteam.net Your Logo
17. TIMELINE GRAPHS – 4 YEARS / MONTHS
PUT TEXT HERE PUT TEXT HERE
Put text here. Put text here.
Your text goes Your text goes
here. here.
Put text here. Put text here.
Text here Text here
2008 2009 2010 2011
PUT TEXT HERE PUT TEXT HERE
Put text here. Put text here.
Your text goes Your text goes
here. here.
Put text here. Put text here.
Text here Text here
www.slideteam.net Your Logo
18. TIMELINE GRAPHS – 4 YEARS / MONTHS
1000
900
800
700
600
500
400
300
200
100
2008 2009 2010 2011
www.slideteam.net Your Logo
19. TIMELINE GRAPHS – 12 YEARS / MONTHS
PUT TEXT HERE PUT TEXT HERE PUT TEXT HERE PUT TEXT HERE PUT TEXT HERE PUT TEXT HERE
Put text here. Put text here. Put text here. Put text here. Put text here. Put text here.
Your text goes Your text Your text goes Your text Your text goes Your text goes
here. goes here. here. goes here. here. here.
Put text here. Put text here. Put text here. Put text here. Put text here. Put text here.
Text here Text here Text here Text here Text here Text here
Jan Feb Mar Apr May Jun Jul Aug Sep Oct Nov Dec
PUT TEXT HERE PUT TEXT HERE PUT TEXT HERE PUT TEXT HERE PUT TEXT HERE PUT TEXT HERE
Put text here. Put text here. Put text here. Put text here. Put text here. Put text here.
Your text goes Your text goes Your text goes Your text goes Your text goes Your text goes
here. here. here. here. here. here.
Put text here. Put text here. Put text here. Put text here. Put text here. Put text here.
Text here Text here Text here Text here Text here Text here
www.slideteam.net Your Logo
20. TIMELINE GRAPHS – 12 YEARS / MONTHS
500
400
300
200
100
0
-100
-200
-300
-400
-500
Jan Feb Mar Apr May Jun Jul Aug Sep Oct Nov Dec
www.slideteam.net Your Logo
21. TIMELINE GRAPHS – 12 YEARS / MONTHS
500
400
300
200
100
0
-100
-200
-300
-400
-500
Jan Feb Mar Apr May Jun Jul Aug Sep Oct Nov Dec
www.slideteam.net Your Logo
22. TIMELINE GRAPHS – 11 YEARS / MONTHS
PUT TEXT PUT TEXT PUT TEXT PUT TEXT PUT TEXT PUT TEXT
HERE HERE HERE HERE HERE HERE
2001 2002 2003 2004 2005 2006 2007 2008 2009 2010 2011
PUT TEXT PUT TEXT PUT TEXT PUT TEXT PUT TEXT
HERE HERE HERE HERE HERE
www.slideteam.net Your Logo
25. All images are 100% editable in Powerpoint
“Change color, size and orientation of any icon to your liking”
www.slideteam.net
26. Edit Color– Inside the Group
2
1
3
1. Right click the object.
2. Choose Group and then Ungroup.
3. Click beside the object and drag the arrow over it.
www.slideteam.net
27. Edit Color
1 2 3
1. Right click the object
2. Choose Format Shape in the dialog box
3. Choose “Fill” in the Format Shape box then “Solid” or “Gradient”
depending on the appearance of the object. Change colour as
shown in the picture.
www.slideteam.net