Financial statements
•Download as DOCX, PDF•
0 likes•274 views

Report
Share
Report
Share

Recommended
(10-8)(10-13) (10-22) (10-24) (BYP 10-1) .docx
(10-8)
(10-13)
(10-22)
(10-24)
(BYP 10-1)
(10-2)
Print by:
ACC/291 - 46047347 / Assignment: Week 3 Assignment
Broadening Your Perspective 10-2
The financial statements of The Hershey Company and Tootsie Roll are presented below.
THE HERSHEY COMPANY
CONSOLIDATED STATEMENTS OF INCOME
For the years ended December 31,
2011
2010
2009
In thousands of dollars except per share amounts
Net Sales
$6,080,788
$5,671,009
$5,298,668
Costs and Expenses:
Cost of sales
3,548,896
3,255,801
3,245,531
Selling, marketing and administrative
1,477,750
1,426,477
1,208,672
Business realignment and impairment (credits) charges, net
(886
)
83,433
82,875
Total costs and expenses
5,025,760
4,765,711
4,537,078
Income before Interest and Income Taxes
1,055,028
905,298
761,590
Interest expense, net
92,183
96,434
90,459
Income before Income Taxes
962,845
808,864
671,131
Provision for income taxes
333,883
299,065
235,137
Net Income
$628,962
$509,799
$435,994
Net Income Per Share—Basic—Class B Common Stock
$2.58
$2.08
$1.77
Net Income Per Share—Diluted—Class B Common Stock
$2.56
$2.07
$1.77
Net Income Per Share—Basic—Common Stock
$2.85
$2.29
$1.97
Net Income Per Share—Diluted—Common Stock
$2.74
$2.21
$1.90
Cash Dividends Paid Per Share:
Common Stock
$1.3800
$1.2800
$1.1900
Class B Common Stock
1.2500
1.1600
1.0712
The notes to consolidated financial statements are an integral part of these statements and are included in the Hershey's 2011 Annual Report, available at www.thehersheycompany.com.
THE HERSHEY COMPANY
CONSOLIDATED BALANCE SHEETS
December 31,
2011
2010
In thousands of dollars
ASSETS
Current Assets:
Cash and cash equivalents
$693,686
$884,642
Accounts receivable—trade
399,499
390,061
Inventories
648,953
533,622
Deferred income taxes
136,861
55,760
Prepaid expenses and other
167,559
141,132
Total current assets
2,046,558
2,005,217
Property, Plant and Equipment, Net
1,559,717
1,437,702
Goodwill
516,745
524,134
Other Intangibles
111,913
123,080
Deferred Income Taxes
38,544
21,387
Other Assets
138,722
161,212
Total assets
$4,412,199
$4,272,732
LIABILITIES AND STOCKHOLDERS’ EQUITY
Current Liabilities:
Accounts payable
$420,017
$410,655
Accrued liabilities
612,186
593,308
Accrued income taxes
1,899
9,402
Short-term debt
42,080
24,088
Current portion of long-term debt
97,593
261,392
Total current liabilities
1,173,775
1,298,845
Long-term Debt
1,748,500
1,541,825
Other Long-term Liabilities
617,276
494,461
Total liabilities
3,539,551
3,335,131
Commitments and Contingencies
—
—
Stockholders’ Equity:
The Hershey Company Stockholders’ Equity
Preferred Stock, shares issued: none ...
i just need the 4 questions answered. please helpBroad.docx
i just need the 4 questions answered. please help
Broadening Your Perspective 6-2
The financial statements of
The Hershey Company
and
Tootsie Roll
are presented below.
THE HERSHEY COMPANY
CONSOLIDATED STATEMENTS OF INCOME
For the years ended December 31,
2011
2010
2009
In thousands of dollars except per share amounts
Net Sales
$6,080,788
$5,671,009
$5,298,668
Costs and Expenses:
Cost of sales
3,548,896
3,255,801
3,245,531
Selling, marketing and administrative
1,477,750
1,426,477
1,208,672
Business realignment and impairment (credits) charges, net
(886
)
83,433
82,875
Total costs and expenses
5,025,760
4,765,711
4,537,078
Income before Interest and Income Taxes
1,055,028
905,298
761,590
Interest expense, net
92,183
96,434
90,459
Income before Income Taxes
962,845
808,864
671,131
Provision for income taxes
333,883
299,065
235,137
Net Income
$628,962
$509,799
$435,994
Net Income Per Share—Basic—Class B Common Stock
$2.58
$2.08
$1.77
Net Income Per Share—Diluted—Class B Common Stock
$2.56
$2.07
$1.77
Net Income Per Share—Basic—Common Stock
$2.85
$2.29
$1.97
Net Income Per Share—Diluted—Common Stock
$2.74
$2.21
$1.90
Cash Dividends Paid Per Share:
Common Stock
$1.3800
$1.2800
$1.1900
Class B Common Stock
1.2500
1.1600
1.0712
The notes to consolidated financial statements are an integral part of these statements and are included in the Hershey's 2011 Annual Report, available at www.thehersheycompany.com.
THE HERSHEY COMPANY
CONSOLIDATED BALANCE SHEETS
December 31,
2011
2010
In thousands of dollars
ASSETS
Current Assets:
Cash and cash equivalents
$693,686
$884,642
Accounts receivable—trade
399,499
390,061
Inventories
648,953
533,622
Deferred income taxes
136,861
55,760
Prepaid expenses and other
167,559
141,132
Total current assets
2,046,558
2,005,217
Property, Plant and Equipment, Net
1,559,717
1,437,702
Goodwill
516,745
524,134
Other Intangibles
111,913
123,080
Deferred Income Taxes
38,544
21,387
Other Assets
138,722
161,212
Total assets
$4,412,199
$4,272,732
LIABILITIES AND STOCKHOLDERS’ EQUITY
Current Liabilities:
Accounts payable
$420,017
$410,655
Accrued liabilities
612,186
593,308
Accrued income taxes
1,899
9,402
Short-term debt
42,080
24,088
Current portion of long-term debt
97,593
261,392
Total current liabilities
1,173,775
1,298,845
Long-term Debt
1,748,500
1,541,825
Other Long-term Liabilities
617,276
494,461
Total liabilities
3,539,551
3,335,131
Commitments and Contingencies
—
—
Stockholders’ Equity:
The Hershey Company Stockholders’ Equity
Preferred Stock, shares issued: none in 2011 and 2010
—
—
Common Stock, shares issued: 299,269,702 in 20.
Accounting Analysis Paper
Your Task:
Please read “Problem 3: The Fiat Group in 2008” on page 211 from your textbook (Business Analysis & Valuation: IFRS 5th Edition, Text and Cases - Palepu, Krishna G., Paul M. Healy, Erik Peek).
Please answer the following questions with detailed workings:
Decompose Fiat’s return on equity – 2006 to 2008 (10 marks)
Calculate the line items of the profit and loss as percentages of sales 2006 to 2008 (5 marks)
Calculate the turnover ratios for 2006 to 2008 (5 Marks)
Using the ratios calculated in 1 to 3 above, and interpret the performance. (15 marks)
On your financial analysis provide recommendations for any improvements (5 marks)
Question 4The stockholders’ equity section of Tootsie Roll Industr.docx
Question 4
The stockholders’ equity section of Tootsie Roll Industries’ balance sheet is shown in the Consolidated Statement of Financial Position.
(Note that Tootsie Roll has two classes of common stock. To answer the following questions, add the two classes of stock together.)
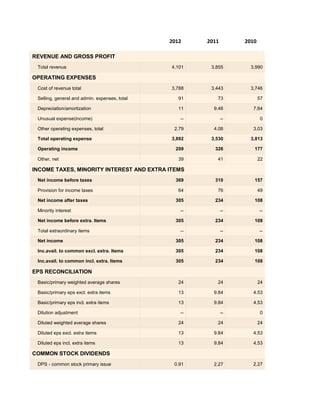
TOOTSIE ROLL INDUSTRIES, INC. AND SUBSIDIARIES
CONSOLIDATED STATEMENTS OF
Earnings, Comprehensive Earnings and Retained Earnings (in thousands except per share data)
For the year ended December 31,
2011
2010
2009
Net product sales
$528,369
$517,149
$495,592
Rental and royalty revenue
4,136
4,299
3,739
Total revenue
532,505
521,448
499,331
Product cost of goods sold
365,225
349,334
319,775
Rental and royalty cost
1,038
1,088
852
Total costs
366,263
350,422
320,627
Product gross margin
163,144
167,815
175,817
Rental and royalty gross margin
3,098
3,211
2,887
Total gross margin
166,242
171,026
178,704
Selling, marketing and administrative expenses
108,276
106,316
103,755
Impairment charges
—
—
14,000
Earnings from operations
57,966
64,710
60,949
Other income (expense), net
2,946
8,358
2,100
Earnings before income taxes
60,912
73,068
63,049
Provision for income taxes
16,974
20,005
9,892
Net earnings
$43,938
$53,063
$53,157
Net earnings
$43,938
$53,063
$53,157
Other comprehensive earnings (loss)
(8,740
)
1,183
2,845
Comprehensive earnings
$35,198
$54,246
$56,002
Retained earnings at beginning of year.
$135,866
$147,687
$144,949
Net earnings
43,938
53,063
53,157
Cash dividends
(18,360
)
(18,078
)
(17,790
)
Stock dividends
(47,175
)
(46,806
)
(32,629
)
Retained earnings at end of year
$114,269
$135,866
$147,687
Earnings per share
$0.76
$0.90
$0.89
Average Common and Class B Common shares outstanding
57,892
58,685
59,425
(The accompanying notes are an integral part of these statements.)
CONSOLIDATED STATEMENTS OF
Financial Position
TOOTSIE ROLL INDUSTRIES, INC. AND SUBSIDIARIES (in thousands except per share data)
Assets
December 31,
2011
2010
CURRENT ASSETS:
Cash and cash equivalents
$78,612
$115,976
Investments
10,895
7,996
Accounts receivable trade, less allowances of $1,731 and $1,531
41,895
37,394
Other receivables
3,391
9,961
Inventories:
Finished goods and work-in-process
42,676
35,416
Raw materials and supplies
29,084
21,236
Prepaid expenses
5,070
6,499
Deferred income taxes
578
689
Total current assets
212,201
235,167
PROPERTY, PLANT AND EQUIPMENT, at cost:
Land
21,939
21,696
Buildings
107,567
102,934
Machinery and equipment
322,993
307,178
Construction in progress
2,598
9,243
455,097
440,974
Less—Accumulated depreciation
242,935
225,482
Net property, plant and equipment
.
Broadening Your Perspective 8-1The financial statements of Toots.docx
Broadening Your Perspective 8-1
The financial statements of Tootsie Roll are presented below.
TOOTSIE ROLL INDUSTRIES, INC. AND SUBSIDIARIES
CONSOLIDATED STATEMENTS OF
Earnings, Comprehensive Earnings and Retained Earnings (in thousands except per share data)
For the year ended December 31,
2011
2010
2009
Net product sales
$528,369
$517,149
$495,592
Rental and royalty revenue
4,136
4,299
3,739
Total revenue
532,505
521,448
499,331
Product cost of goods sold
365,225
349,334
319,775
Rental and royalty cost
1,038
1,088
852
Total costs
366,263
350,422
320,627
Product gross margin
163,144
167,815
175,817
Rental and royalty gross margin
3,098
3,211
2,887
Total gross margin
166,242
171,026
178,704
Selling, marketing and administrative expenses
108,276
106,316
103,755
Impairment charges
—
—
14,000
Earnings from operations
57,966
64,710
60,949
Other income (expense), net
2,946
8,358
2,100
Earnings before income taxes
60,912
73,068
63,049
Provision for income taxes
16,974
20,005
9,892
Net earnings
$43,938
$53,063
$53,157
Net earnings
$43,938
$53,063
$53,157
Other comprehensive earnings (loss)
(8,740
)
1,183
2,845
Comprehensive earnings
$35,198
$54,246
$56,002
Retained earnings at beginning of year.
$135,866
$147,687
$144,949
Net earnings
43,938
53,063
53,157
Cash dividends
(18,360
)
(18,078
)
(17,790
)
Stock dividends
(47,175
)
(46,806
)
(32,629
)
Retained earnings at end of year
$114,269
$135,866
$147,687
Earnings per share
$0.76
$0.90
$0.89
Average Common and Class B Common shares outstanding
57,892
58,685
59,425
(The accompanying notes are an integral part of these statements.)
CONSOLIDATED STATEMENTS OF
Financial Position
TOOTSIE ROLL INDUSTRIES, INC. AND SUBSIDIARIES (in thousands except per share data)
Assets
December 31,
2011
2010
CURRENT ASSETS:
Cash and cash equivalents
$78,612
$115,976
Investments
10,895
7,996
Accounts receivable trade, less allowances of $1,731 and $1,531
41,895
37,394
Other receivables
3,391
9,961
Inventories:
Finished goods and work-in-process
42,676
35,416
Raw materials and supplies
29,084
21,236
Prepaid expenses
5,070
6,499
Deferred income taxes
578
689
Total current assets
212,201
235,167
PROPERTY, PLANT AND EQUIPMENT, at cost:
Land
21,939
21,696
Buildings
107,567
102,934
Machinery and equipment
322,993
307,178
Construction in progress
2,598
9,243
455,097
440,974
Less—Accumulated depreciation
242,935
225,482
Net property, plant and equipment
212,162
215,492
OTHER ASSETS:
Goodwill
73,237
73,237
Trademarks
175,024
175,024
Investments
96,161
64,461
Split dollar officer life insurance
74,209
.
Recommended
(10-8)(10-13) (10-22) (10-24) (BYP 10-1) .docx
(10-8)
(10-13)
(10-22)
(10-24)
(BYP 10-1)
(10-2)
Print by:
ACC/291 - 46047347 / Assignment: Week 3 Assignment
Broadening Your Perspective 10-2
The financial statements of The Hershey Company and Tootsie Roll are presented below.
THE HERSHEY COMPANY
CONSOLIDATED STATEMENTS OF INCOME
For the years ended December 31,
2011
2010
2009
In thousands of dollars except per share amounts
Net Sales
$6,080,788
$5,671,009
$5,298,668
Costs and Expenses:
Cost of sales
3,548,896
3,255,801
3,245,531
Selling, marketing and administrative
1,477,750
1,426,477
1,208,672
Business realignment and impairment (credits) charges, net
(886
)
83,433
82,875
Total costs and expenses
5,025,760
4,765,711
4,537,078
Income before Interest and Income Taxes
1,055,028
905,298
761,590
Interest expense, net
92,183
96,434
90,459
Income before Income Taxes
962,845
808,864
671,131
Provision for income taxes
333,883
299,065
235,137
Net Income
$628,962
$509,799
$435,994
Net Income Per Share—Basic—Class B Common Stock
$2.58
$2.08
$1.77
Net Income Per Share—Diluted—Class B Common Stock
$2.56
$2.07
$1.77
Net Income Per Share—Basic—Common Stock
$2.85
$2.29
$1.97
Net Income Per Share—Diluted—Common Stock
$2.74
$2.21
$1.90
Cash Dividends Paid Per Share:
Common Stock
$1.3800
$1.2800
$1.1900
Class B Common Stock
1.2500
1.1600
1.0712
The notes to consolidated financial statements are an integral part of these statements and are included in the Hershey's 2011 Annual Report, available at www.thehersheycompany.com.
THE HERSHEY COMPANY
CONSOLIDATED BALANCE SHEETS
December 31,
2011
2010
In thousands of dollars
ASSETS
Current Assets:
Cash and cash equivalents
$693,686
$884,642
Accounts receivable—trade
399,499
390,061
Inventories
648,953
533,622
Deferred income taxes
136,861
55,760
Prepaid expenses and other
167,559
141,132
Total current assets
2,046,558
2,005,217
Property, Plant and Equipment, Net
1,559,717
1,437,702
Goodwill
516,745
524,134
Other Intangibles
111,913
123,080
Deferred Income Taxes
38,544
21,387
Other Assets
138,722
161,212
Total assets
$4,412,199
$4,272,732
LIABILITIES AND STOCKHOLDERS’ EQUITY
Current Liabilities:
Accounts payable
$420,017
$410,655
Accrued liabilities
612,186
593,308
Accrued income taxes
1,899
9,402
Short-term debt
42,080
24,088
Current portion of long-term debt
97,593
261,392
Total current liabilities
1,173,775
1,298,845
Long-term Debt
1,748,500
1,541,825
Other Long-term Liabilities
617,276
494,461
Total liabilities
3,539,551
3,335,131
Commitments and Contingencies
—
—
Stockholders’ Equity:
The Hershey Company Stockholders’ Equity
Preferred Stock, shares issued: none ...
i just need the 4 questions answered. please helpBroad.docx
i just need the 4 questions answered. please help
Broadening Your Perspective 6-2
The financial statements of
The Hershey Company
and
Tootsie Roll
are presented below.
THE HERSHEY COMPANY
CONSOLIDATED STATEMENTS OF INCOME
For the years ended December 31,
2011
2010
2009
In thousands of dollars except per share amounts
Net Sales
$6,080,788
$5,671,009
$5,298,668
Costs and Expenses:
Cost of sales
3,548,896
3,255,801
3,245,531
Selling, marketing and administrative
1,477,750
1,426,477
1,208,672
Business realignment and impairment (credits) charges, net
(886
)
83,433
82,875
Total costs and expenses
5,025,760
4,765,711
4,537,078
Income before Interest and Income Taxes
1,055,028
905,298
761,590
Interest expense, net
92,183
96,434
90,459
Income before Income Taxes
962,845
808,864
671,131
Provision for income taxes
333,883
299,065
235,137
Net Income
$628,962
$509,799
$435,994
Net Income Per Share—Basic—Class B Common Stock
$2.58
$2.08
$1.77
Net Income Per Share—Diluted—Class B Common Stock
$2.56
$2.07
$1.77
Net Income Per Share—Basic—Common Stock
$2.85
$2.29
$1.97
Net Income Per Share—Diluted—Common Stock
$2.74
$2.21
$1.90
Cash Dividends Paid Per Share:
Common Stock
$1.3800
$1.2800
$1.1900
Class B Common Stock
1.2500
1.1600
1.0712
The notes to consolidated financial statements are an integral part of these statements and are included in the Hershey's 2011 Annual Report, available at www.thehersheycompany.com.
THE HERSHEY COMPANY
CONSOLIDATED BALANCE SHEETS
December 31,
2011
2010
In thousands of dollars
ASSETS
Current Assets:
Cash and cash equivalents
$693,686
$884,642
Accounts receivable—trade
399,499
390,061
Inventories
648,953
533,622
Deferred income taxes
136,861
55,760
Prepaid expenses and other
167,559
141,132
Total current assets
2,046,558
2,005,217
Property, Plant and Equipment, Net
1,559,717
1,437,702
Goodwill
516,745
524,134
Other Intangibles
111,913
123,080
Deferred Income Taxes
38,544
21,387
Other Assets
138,722
161,212
Total assets
$4,412,199
$4,272,732
LIABILITIES AND STOCKHOLDERS’ EQUITY
Current Liabilities:
Accounts payable
$420,017
$410,655
Accrued liabilities
612,186
593,308
Accrued income taxes
1,899
9,402
Short-term debt
42,080
24,088
Current portion of long-term debt
97,593
261,392
Total current liabilities
1,173,775
1,298,845
Long-term Debt
1,748,500
1,541,825
Other Long-term Liabilities
617,276
494,461
Total liabilities
3,539,551
3,335,131
Commitments and Contingencies
—
—
Stockholders’ Equity:
The Hershey Company Stockholders’ Equity
Preferred Stock, shares issued: none in 2011 and 2010
—
—
Common Stock, shares issued: 299,269,702 in 20.
Accounting Analysis Paper
Your Task:
Please read “Problem 3: The Fiat Group in 2008” on page 211 from your textbook (Business Analysis & Valuation: IFRS 5th Edition, Text and Cases - Palepu, Krishna G., Paul M. Healy, Erik Peek).
Please answer the following questions with detailed workings:
Decompose Fiat’s return on equity – 2006 to 2008 (10 marks)
Calculate the line items of the profit and loss as percentages of sales 2006 to 2008 (5 marks)
Calculate the turnover ratios for 2006 to 2008 (5 Marks)
Using the ratios calculated in 1 to 3 above, and interpret the performance. (15 marks)
On your financial analysis provide recommendations for any improvements (5 marks)
Question 4The stockholders’ equity section of Tootsie Roll Industr.docx
Question 4
The stockholders’ equity section of Tootsie Roll Industries’ balance sheet is shown in the Consolidated Statement of Financial Position.
(Note that Tootsie Roll has two classes of common stock. To answer the following questions, add the two classes of stock together.)
TOOTSIE ROLL INDUSTRIES, INC. AND SUBSIDIARIES
CONSOLIDATED STATEMENTS OF
Earnings, Comprehensive Earnings and Retained Earnings (in thousands except per share data)
For the year ended December 31,
2011
2010
2009
Net product sales
$528,369
$517,149
$495,592
Rental and royalty revenue
4,136
4,299
3,739
Total revenue
532,505
521,448
499,331
Product cost of goods sold
365,225
349,334
319,775
Rental and royalty cost
1,038
1,088
852
Total costs
366,263
350,422
320,627
Product gross margin
163,144
167,815
175,817
Rental and royalty gross margin
3,098
3,211
2,887
Total gross margin
166,242
171,026
178,704
Selling, marketing and administrative expenses
108,276
106,316
103,755
Impairment charges
—
—
14,000
Earnings from operations
57,966
64,710
60,949
Other income (expense), net
2,946
8,358
2,100
Earnings before income taxes
60,912
73,068
63,049
Provision for income taxes
16,974
20,005
9,892
Net earnings
$43,938
$53,063
$53,157
Net earnings
$43,938
$53,063
$53,157
Other comprehensive earnings (loss)
(8,740
)
1,183
2,845
Comprehensive earnings
$35,198
$54,246
$56,002
Retained earnings at beginning of year.
$135,866
$147,687
$144,949
Net earnings
43,938
53,063
53,157
Cash dividends
(18,360
)
(18,078
)
(17,790
)
Stock dividends
(47,175
)
(46,806
)
(32,629
)
Retained earnings at end of year
$114,269
$135,866
$147,687
Earnings per share
$0.76
$0.90
$0.89
Average Common and Class B Common shares outstanding
57,892
58,685
59,425
(The accompanying notes are an integral part of these statements.)
CONSOLIDATED STATEMENTS OF
Financial Position
TOOTSIE ROLL INDUSTRIES, INC. AND SUBSIDIARIES (in thousands except per share data)
Assets
December 31,
2011
2010
CURRENT ASSETS:
Cash and cash equivalents
$78,612
$115,976
Investments
10,895
7,996
Accounts receivable trade, less allowances of $1,731 and $1,531
41,895
37,394
Other receivables
3,391
9,961
Inventories:
Finished goods and work-in-process
42,676
35,416
Raw materials and supplies
29,084
21,236
Prepaid expenses
5,070
6,499
Deferred income taxes
578
689
Total current assets
212,201
235,167
PROPERTY, PLANT AND EQUIPMENT, at cost:
Land
21,939
21,696
Buildings
107,567
102,934
Machinery and equipment
322,993
307,178
Construction in progress
2,598
9,243
455,097
440,974
Less—Accumulated depreciation
242,935
225,482
Net property, plant and equipment
.
Broadening Your Perspective 8-1The financial statements of Toots.docx
Broadening Your Perspective 8-1
The financial statements of Tootsie Roll are presented below.
TOOTSIE ROLL INDUSTRIES, INC. AND SUBSIDIARIES
CONSOLIDATED STATEMENTS OF
Earnings, Comprehensive Earnings and Retained Earnings (in thousands except per share data)
For the year ended December 31,
2011
2010
2009
Net product sales
$528,369
$517,149
$495,592
Rental and royalty revenue
4,136
4,299
3,739
Total revenue
532,505
521,448
499,331
Product cost of goods sold
365,225
349,334
319,775
Rental and royalty cost
1,038
1,088
852
Total costs
366,263
350,422
320,627
Product gross margin
163,144
167,815
175,817
Rental and royalty gross margin
3,098
3,211
2,887
Total gross margin
166,242
171,026
178,704
Selling, marketing and administrative expenses
108,276
106,316
103,755
Impairment charges
—
—
14,000
Earnings from operations
57,966
64,710
60,949
Other income (expense), net
2,946
8,358
2,100
Earnings before income taxes
60,912
73,068
63,049
Provision for income taxes
16,974
20,005
9,892
Net earnings
$43,938
$53,063
$53,157
Net earnings
$43,938
$53,063
$53,157
Other comprehensive earnings (loss)
(8,740
)
1,183
2,845
Comprehensive earnings
$35,198
$54,246
$56,002
Retained earnings at beginning of year.
$135,866
$147,687
$144,949
Net earnings
43,938
53,063
53,157
Cash dividends
(18,360
)
(18,078
)
(17,790
)
Stock dividends
(47,175
)
(46,806
)
(32,629
)
Retained earnings at end of year
$114,269
$135,866
$147,687
Earnings per share
$0.76
$0.90
$0.89
Average Common and Class B Common shares outstanding
57,892
58,685
59,425
(The accompanying notes are an integral part of these statements.)
CONSOLIDATED STATEMENTS OF
Financial Position
TOOTSIE ROLL INDUSTRIES, INC. AND SUBSIDIARIES (in thousands except per share data)
Assets
December 31,
2011
2010
CURRENT ASSETS:
Cash and cash equivalents
$78,612
$115,976
Investments
10,895
7,996
Accounts receivable trade, less allowances of $1,731 and $1,531
41,895
37,394
Other receivables
3,391
9,961
Inventories:
Finished goods and work-in-process
42,676
35,416
Raw materials and supplies
29,084
21,236
Prepaid expenses
5,070
6,499
Deferred income taxes
578
689
Total current assets
212,201
235,167
PROPERTY, PLANT AND EQUIPMENT, at cost:
Land
21,939
21,696
Buildings
107,567
102,934
Machinery and equipment
322,993
307,178
Construction in progress
2,598
9,243
455,097
440,974
Less—Accumulated depreciation
242,935
225,482
Net property, plant and equipment
212,162
215,492
OTHER ASSETS:
Goodwill
73,237
73,237
Trademarks
175,024
175,024
Investments
96,161
64,461
Split dollar officer life insurance
74,209
.
Top of FormBottom of FormBroadening Your Perspective.docx
Top of Form
Bottom of Form
Broadening Your Perspective 4-1
The financial statements of Tootsie Roll are presented below.
TOOTSIE ROLL INDUSTRIES, INC. AND SUBSIDIARIES
CONSOLIDATED STATEMENTS OF
Earnings, Comprehensive Earnings and Retained Earnings (in thousands except per share data)
For the year ended December 31,
2011
2010
2009
Net product sales
$528,369
$517,149
$495,592
Rental and royalty revenue
4,136
4,299
3,739
Total revenue
532,505
521,448
499,331
Product cost of goods sold
365,225
349,334
319,775
Rental and royalty cost
1,038
1,088
852
Total costs
366,263
350,422
320,627
Product gross margin
163,144
167,815
175,817
Rental and royalty gross margin
3,098
3,211
2,887
Total gross margin
166,242
171,026
178,704
Selling, marketing and administrative expenses
108,276
106,316
103,755
Impairment charges
—
—
14,000
Earnings from operations
57,966
64,710
60,949
Other income (expense), net
2,946
8,358
2,100
Earnings before income taxes
60,912
73,068
63,049
Provision for income taxes
16,974
20,005
9,892
Net earnings
$43,938
$53,063
$53,157
Net earnings
$43,938
$53,063
$53,157
Other comprehensive earnings (loss)
(8,740
)
1,183
2,845
Comprehensive earnings
$35,198
$54,246
$56,002
Retained earnings at beginning of year
$135,866
$147,687
$144,949
Net earnings
43,938
53,063
53,157
Cash dividends
(18,360
)
(18,078
)
(17,790
)
Stock dividends
(47,175
)
(46,806
)
(32,629
)
Retained earnings at end of year
$114,269
$135,866
$147,687
Earnings per share
$0.76
$0.90
$0.89
Average Common and Class B Common shares outstanding
57,892
58,685
59,425
(The accompanying notes are an integral part of these statements.)
CONSOLIDATED STATEMENTS OF
Financial Position
TOOTSIE ROLL INDUSTRIES, INC. AND SUBSIDIARIES (in thousands except per share data)
Assets
December 31,
2011
2010
CURRENT ASSETS:
Cash and cash equivalents
$78,612
$115,976
Investments
10,895
7,996
Accounts receivable trade, less allowances of $1,731 and $1,531
41,895
37,394
Other receivables
3,391
9,961
Inventories:
Finished goods and work-in-process
42,676
35,416
Raw materials and supplies
29,084
21,236
Prepaid expenses
5,070
6,499
Deferred income taxes
578
689
Total current assets
212,201
235,167
PROPERTY, PLANT AND EQUIPMENT, at cost:
Land
21,939
21,696
Buildings
107,567
102,934
Machinery and equipment
322,993
307,178
Construction in progress
2,598
9,243
455,097
440,974
Less—Accumulated depreciation
242,935
225,482
Net property, plant and equipment
212,162
215,492
OTHER ASSETS:
Goodwill
73,237
73,237
Trademarks
175,024
175,024
Investments
96,161
64,461
Split dollar o ...
Below are two questions that includes financial statements, that i.docx
Below are two questions that includes financial statements, that is why it is so many pages.
Question 1
The financial statements of Tootsie Roll are presented below.
TOOTSIE ROLL INDUSTRIES, INC. AND SUBSIDIARIES
CONSOLIDATED STATEMENTS OF
Earnings, Comprehensive Earnings and Retained Earnings (in thousands except per share data)
For the year ended December 31,
2011
2010
2009
Net product sales
$528,369
$517,149
$495,592
Rental and royalty revenue
4,136
4,299
3,739
Total revenue
532,505
521,448
499,331
Product cost of goods sold
365,225
349,334
319,775
Rental and royalty cost
1,038
1,088
852
Total costs
366,263
350,422
320,627
Product gross margin
163,144
167,815
175,817
Rental and royalty gross margin
3,098
3,211
2,887
Total gross margin
166,242
171,026
178,704
Selling, marketing and administrative expenses
108,276
106,316
103,755
Impairment charges
—
—
14,000
Earnings from operations
57,966
64,710
60,949
Other income (expense), net
2,946
8,358
2,100
Earnings before income taxes
60,912
73,068
63,049
Provision for income taxes
16,974
20,005
9,892
Net earnings
$43,938
$53,063
$53,157
Net earnings
$43,938
$53,063
$53,157
Other comprehensive earnings (loss)
(8,740
)
1,183
2,845
Comprehensive earnings
$35,198
$54,246
$56,002
Retained earnings at beginning of year.
$135,866
$147,687
$144,949
Net earnings
43,938
53,063
53,157
Cash dividends
(18,360
)
(18,078
)
(17,790
)
Stock dividends
(47,175
)
(46,806
)
(32,629
)
Retained earnings at end of year
$114,269
$135,866
$147,687
Earnings per share
$0.76
$0.90
$0.89
Average Common and Class B Common shares outstanding
57,892
58,685
59,425
(The accompanying notes are an integral part of these statements.)
CONSOLIDATED STATEMENTS OF
Financial Position
TOOTSIE ROLL INDUSTRIES, INC. AND SUBSIDIARIES (in thousands except per share data)
Assets
December 31,
2011
2010
CURRENT ASSETS:
Cash and cash equivalents
$78,612
$115,976
Investments
10,895
7,996
Accounts receivable trade, less allowances of $1,731 and $1,531
41,895
37,394
Other receivables
3,391
9,961
Inventories:
Finished goods and work-in-process
42,676
35,416
Raw materials and supplies
29,084
21,236
Prepaid expenses
5,070
6,499
Deferred income taxes
578
689
Total current assets
212,201
235,167
PROPERTY, PLANT AND EQUIPMENT, at cost:
Land
21,939
21,696
Buildings
107,567
102,934
Machinery and equipment
322,993
307,178
Construction in progress
2,598
9,243
455,097
440,974
Less—Accumulated depreciation
242,935
225,482
Net property, plant and equipment
212,162
215,492
OTHER ASSETS:
Goodwill
73,237
73,237
Trademarks
175,024
175,024
Inv ...
Question 5The financial statements of The Hershey Company and .docx
Question 5
The financial statements of
The Hershey Company
and
Tootsie Roll
are presented below.
THE HERSHEY COMPANY
CONSOLIDATED STATEMENTS OF INCOME
For the years ended December 31,
2011
2010
2009
In thousands of dollars except per share amounts
Net Sales
$6,080,788
$5,671,009
$5,298,668
Costs and Expenses:
Cost of sales
3,548,896
3,255,801
3,245,531
Selling, marketing and administrative
1,477,750
1,426,477
1,208,672
Business realignment and impairment (credits) charges, net
(886
)
83,433
82,875
Total costs and expenses
5,025,760
4,765,711
4,537,078
Income before Interest and Income Taxes
1,055,028
905,298
761,590
Interest expense, net
92,183
96,434
90,459
Income before Income Taxes
962,845
808,864
671,131
Provision for income taxes
333,883
299,065
235,137
Net Income
$628,962
$509,799
$435,994
Net Income Per Share—Basic—Class B Common Stock
$2.58
$2.08
$1.77
Net Income Per Share—Diluted—Class B Common Stock
$2.56
$2.07
$1.77
Net Income Per Share—Basic—Common Stock
$2.85
$2.29
$1.97
Net Income Per Share—Diluted—Common Stock
$2.74
$2.21
$1.90
Cash Dividends Paid Per Share:
Common Stock
$1.3800
$1.2800
$1.1900
Class B Common Stock
1.2500
1.1600
1.0712
The notes to consolidated financial statements are an integral part of these statements and are included in the Hershey's 2011 Annual Report, available at www.thehersheycompany.com.
THE HERSHEY COMPANY
CONSOLIDATED BALANCE SHEETS
December 31,
2011
2010
In thousands of dollars
ASSETS
Current Assets:
Cash and cash equivalents
$693,686
$884,642
Accounts receivable—trade
399,499
390,061
Inventories
648,953
533,622
Deferred income taxes
136,861
55,760
Prepaid expenses and other
167,559
141,132
Total current assets
2,046,558
2,005,217
Property, Plant and Equipment, Net
1,559,717
1,437,702
Goodwill
516,745
524,134
Other Intangibles
111,913
123,080
Deferred Income Taxes
38,544
21,387
Other Assets
138,722
161,212
Total assets
$4,412,199
$4,272,732
LIABILITIES AND STOCKHOLDERS’ EQUITY
Current Liabilities:
Accounts payable
$420,017
$410,655
Accrued liabilities
612,186
593,308
Accrued income taxes
1,899
9,402
Short-term debt
42,080
24,088
Current portion of long-term debt
97,593
261,392
Total current liabilities
1,173,775
1,298,845
Long-term Debt
1,748,500
1,541,825
Other Long-term Liabilities
617,276
494,461
Total liabilities
3,539,551
3,335,131
Commitments and Contingencies
—
—
Stockholders’ Equity:
The Hershey Company Stockholders’ Equity
Preferred Stock, shares issued: none in 2011 and 2010
—
—
Common Stock, shares issued: 299,269,702 in 2011 and 299,195,325 in 2010
299,269
299,195
Class B Common Stock.
Exercise 8-4The ledger of Wainwright Company at the end of the c.docx
Exercise 8-4
The ledger of Wainwright Company at the end of the current year shows Accounts Receivable $76,000; Credit Sales $986,000; and Sales Returns and Allowances $42,200. (Credit account titles are automatically indented when amount is entered. Do not indent manually.)
(a)
If Wainwright uses the direct write-off method to account for uncollectible accounts, journalize the adjusting entry at December 31, assuming Wainwright determines that Hiller’s $1,000 balance is uncollectible.
(b)
If Allowance for Doubtful Accounts has a credit balance of $1,200 in the trial balance, journalize the adjusting entry at December 31, assuming bad debts are expected to be 11% of accounts receivable.
(c)
If Allowance for Doubtful Accounts has a debit balance of $950 in the trial balance, journalize the adjusting entry at December 31, assuming bad debts are expected to be 8% of accounts receivable.
No.
Account Titles and Explanation
Debit
Credit
(a)
(b)
(c)
Exercise 8-11
Suppose the following information was taken from the 2014 financial statements of FedEx Corporation, a major global transportation/delivery company.
(in millions)
2014
2013
Accounts receivable (gross)
$ 3,678
$ 4,608
Accounts receivable (net)
3,374
4,330
Allowance for doubtful accounts
304
278
Sales revenue
34,275
37,054
Total current assets
7,104
7,206
Answer each of the following questions.
Calculate the accounts receivable turnover and the average collection period for 2014 for FedEx. (Round answers to 1 decimal place, e.g. 12.5. Use 365 days for calculation.)
Accounts receivable turnover
times
The average collection period for 2014
days
Broadening Your Perspective 8-1
The financial statements of Tootsie Roll are presented below.
TOOTSIE ROLL INDUSTRIES, INC. AND SUBSIDIARIES
CONSOLIDATED STATEMENTS OF
Earnings, Comprehensive Earnings and Retained Earnings (in thousands except per share data)
For the year ended December 31,
2011
2010
2009
Net product sales
$528,369
$517,149
$495,592
Rental and royalty revenue
4,136
4,299
3,739
Total revenue
532,505
521,448
499,331
Product cost of goods sold
365,225
349,334
319,775
Rental and royalty cost
1,038
1,088
852
Total costs
366,263
350,422
320,627
Product gross margin
163,144
167,815
175,817
Rental and royalty gross margin
3,098
3,211
2,887
Total gross margin
166,242
171,026
178,704
Selling, marketing and administrative expenses
108,276
106,316
103,755
Impairment charges
—
—
14,000
Earnings from operations
57,966
64,710
60,949
Other income (expense), net
2,946
8,358
2,100
Earnings before income taxes
60,912
73,068
63,049
Provision for income taxes
16,974
20,005
9,892
Net earnings
$43,938
$53,063
$53,157
Net earnings
$43,938
$53,063
$53,157
Other comprehensive earnings (loss)
(8,740
)
1,183
2,845
Comprehensive earnings
...
Once each year, a corporation communicates to its stockholders.docx
Once each year, a corporation communicates to its stockholders and other inter-
ested parties by issuing a complete set of audited ! nancial statements. The
annual report , as this communication is called, summarizes the ! nancial results
of the company’s operations for the year and its plans for the future. Many annual
reports are attractive, multicolored, glossy public relations pieces, containing
pictures of corporate of! cers and directors as well as photos and descriptions of
new products and new buildings. Yet the basic function of every annual report is
to report ! nancial information, almost all of which is a product of the corpora-
tion’s accounting system.
The content and organization of corporate annual reports have become fairly
standardized. Excluding the public relations part of the report (pictures, prod-
ucts, etc.), the following are the traditional ! nancial portions of the annual report:
• Financial Highlights
• Letter to the Stockholders
• Management’s Discussion and
Analysis
• Financial Statements
• Notes to the Financial
Statements
• Management’s Responsibility
for Financial Reporting
• Management’s Report on Internal
Control over Financial Reporting
• Report of Independent Registered
Public Accounting Firm
• Selected Financial Data
The of! cial SEC ! ling of the annual report is called a Form 10-K, which
often omits the public relations pieces found in most standard annual reports. On
the following pages, we present Apple Inc.’s ! nancial statements taken from the
company’s 2013 Form 10-K. To access Apple’s Form 10-K, including notes to the
! nancial statements, follow these steps:
1. Go to http://investor.apple.com.
2. Select the Financial Information tab.
3. Select the 10-K annual report dated September 28, 2013.
4. The Notes to Consolidated Financial Statements begin on page 50.
Specimen Financial
Statements: Apple Inc.
Appendix A
A-1
A-2 Appendix A Specimen Financial Statements: Apple Inc.
CONSOLIDATED STATEMENTS OF OPERATIONS
(In millions, except number of shares which are reflected in thousands and per share amounts)
See accompanying Notes to Consolidated Financial Statements.
Years ended
September 28, 2013 September 29, 2012 September 24, 2011
Net sales $ 170,910 $ 156,508 $ 108,249
Cost of sales 106,606 87,846 64,431
Gross margin 64,304 68,662 43,818
Operating expenses:
Research and development 4,475 3,381 2,429
Selling, general and administrative 10,830 10,040 7,599
Total operating expenses 15,305 13,421 10,028
Operating income 48,999 55,241 33,790
Other income/(expense), net 1,156 522 415
Income before provision for income taxes 50,155 55,763 34,205
Provision for income taxes 13,118 ...
1Exercise 8-4The ledger of Wainwright Company at the end of .docx
1Exercise 8-4
The ledger of Wainwright Company at the end of the current year shows Accounts Receivable $76,000; Credit Sales $801,000; and Sales Returns and Allowances $50,000. (Credit account titles are automatically indented when amount is entered. Do not indent manually.)
(a)
If Wainwright uses the direct write-off method to account for uncollectible accounts, journalize the adjusting entry at December 31, assuming Wainwright determines that Hiller’s $1,000 balance is uncollectible.
(b)
If Allowance for Doubtful Accounts has a credit balance of $990 in the trial balance, journalize the adjusting entry at December 31, assuming bad debts are expected to be 11% of accounts receivable.
(c)
If Allowance for Doubtful Accounts has a debit balance of $850 in the trial balance, journalize the adjusting entry at December 31, assuming bad debts are expected to be 8% of accounts receivable.
No.
Account Titles and Explanation
Debit
Credit
(a)
(b)
(c)
Exercise 8-4
Accounts Payable
Accounts Receivable
Accumulated Depreciation-Equipment
Allowance for Doubtful Accounts
Bad Debt Expense
Cash
Common Stock
Cost of Goods Sold
Dividends
Income Tax Expense
Income Taxes Payable
Interest Receivable
Interest Revenue
Inventory
No Entry
Notes Receivable
Other Operating Expenses
Other Receivables
Retained Earnings
Sales Discounts
Sales Returns and Allowances
Sales Revenue
Service Charge Expense
Supplies
Supplies Expense
Exercise 8-11
Suppose the following information was taken from the 2014 financial statements of FedEx Corporation, a major global transportation/delivery company.
(in millions)
2014
2013
Accounts receivable (gross)
$ 3,480
$ 4,430
Accounts receivable (net)
3,472
4,401
Allowance for doubtful accounts
8
29
Sales revenue
34,728
37,059
Total current assets
7,883
7,166
Answer each of the following questions.
Calculate the accounts receivable turnover and the average collection period for 2014 for FedEx. (Round answers to 1 decimal place, e.g. 12.5. Use 365 days for calculation.)
Accounts receivable turnover
times
The average collection period for 2014
days
Is accounts receivable a material component of the company’s total current assets?
2
Broadening Your Perspective 8-1
The financial statements of Tootsie Roll are presented below.
TOOTSIE ROLL INDUSTRIES, INC. AND SUBSIDIARIES
CONSOLIDATED STATEMENTS OF
Earnings, Comprehensive Earnings and Retained Earnings (in thousands except per share data)
For the year ended December 31,
2011
2010
2009
Net product sales
$528,369
$517,149
$495,592
Rental and royalty revenue
4,136
4,299
3,739
Total revenue
532,505
521,448
499,331
Product cost of goods sold
365,225
349,334
319,775
Rental and royalty cost
1,038
1,088
852
Total costs
366,263
350,422
320,627
Product gross margin
163,144
167,815
175,817
Rental and royalty gross margin
3,098
3,211
2,887
Total gross margin
166,242
171,026
178.
More Related Content
Similar to Financial statements
Top of FormBottom of FormBroadening Your Perspective.docx
Top of Form
Bottom of Form
Broadening Your Perspective 4-1
The financial statements of Tootsie Roll are presented below.
TOOTSIE ROLL INDUSTRIES, INC. AND SUBSIDIARIES
CONSOLIDATED STATEMENTS OF
Earnings, Comprehensive Earnings and Retained Earnings (in thousands except per share data)
For the year ended December 31,
2011
2010
2009
Net product sales
$528,369
$517,149
$495,592
Rental and royalty revenue
4,136
4,299
3,739
Total revenue
532,505
521,448
499,331
Product cost of goods sold
365,225
349,334
319,775
Rental and royalty cost
1,038
1,088
852
Total costs
366,263
350,422
320,627
Product gross margin
163,144
167,815
175,817
Rental and royalty gross margin
3,098
3,211
2,887
Total gross margin
166,242
171,026
178,704
Selling, marketing and administrative expenses
108,276
106,316
103,755
Impairment charges
—
—
14,000
Earnings from operations
57,966
64,710
60,949
Other income (expense), net
2,946
8,358
2,100
Earnings before income taxes
60,912
73,068
63,049
Provision for income taxes
16,974
20,005
9,892
Net earnings
$43,938
$53,063
$53,157
Net earnings
$43,938
$53,063
$53,157
Other comprehensive earnings (loss)
(8,740
)
1,183
2,845
Comprehensive earnings
$35,198
$54,246
$56,002
Retained earnings at beginning of year
$135,866
$147,687
$144,949
Net earnings
43,938
53,063
53,157
Cash dividends
(18,360
)
(18,078
)
(17,790
)
Stock dividends
(47,175
)
(46,806
)
(32,629
)
Retained earnings at end of year
$114,269
$135,866
$147,687
Earnings per share
$0.76
$0.90
$0.89
Average Common and Class B Common shares outstanding
57,892
58,685
59,425
(The accompanying notes are an integral part of these statements.)
CONSOLIDATED STATEMENTS OF
Financial Position
TOOTSIE ROLL INDUSTRIES, INC. AND SUBSIDIARIES (in thousands except per share data)
Assets
December 31,
2011
2010
CURRENT ASSETS:
Cash and cash equivalents
$78,612
$115,976
Investments
10,895
7,996
Accounts receivable trade, less allowances of $1,731 and $1,531
41,895
37,394
Other receivables
3,391
9,961
Inventories:
Finished goods and work-in-process
42,676
35,416
Raw materials and supplies
29,084
21,236
Prepaid expenses
5,070
6,499
Deferred income taxes
578
689
Total current assets
212,201
235,167
PROPERTY, PLANT AND EQUIPMENT, at cost:
Land
21,939
21,696
Buildings
107,567
102,934
Machinery and equipment
322,993
307,178
Construction in progress
2,598
9,243
455,097
440,974
Less—Accumulated depreciation
242,935
225,482
Net property, plant and equipment
212,162
215,492
OTHER ASSETS:
Goodwill
73,237
73,237
Trademarks
175,024
175,024
Investments
96,161
64,461
Split dollar o ...
Below are two questions that includes financial statements, that i.docx
Below are two questions that includes financial statements, that is why it is so many pages.
Question 1
The financial statements of Tootsie Roll are presented below.
TOOTSIE ROLL INDUSTRIES, INC. AND SUBSIDIARIES
CONSOLIDATED STATEMENTS OF
Earnings, Comprehensive Earnings and Retained Earnings (in thousands except per share data)
For the year ended December 31,
2011
2010
2009
Net product sales
$528,369
$517,149
$495,592
Rental and royalty revenue
4,136
4,299
3,739
Total revenue
532,505
521,448
499,331
Product cost of goods sold
365,225
349,334
319,775
Rental and royalty cost
1,038
1,088
852
Total costs
366,263
350,422
320,627
Product gross margin
163,144
167,815
175,817
Rental and royalty gross margin
3,098
3,211
2,887
Total gross margin
166,242
171,026
178,704
Selling, marketing and administrative expenses
108,276
106,316
103,755
Impairment charges
—
—
14,000
Earnings from operations
57,966
64,710
60,949
Other income (expense), net
2,946
8,358
2,100
Earnings before income taxes
60,912
73,068
63,049
Provision for income taxes
16,974
20,005
9,892
Net earnings
$43,938
$53,063
$53,157
Net earnings
$43,938
$53,063
$53,157
Other comprehensive earnings (loss)
(8,740
)
1,183
2,845
Comprehensive earnings
$35,198
$54,246
$56,002
Retained earnings at beginning of year.
$135,866
$147,687
$144,949
Net earnings
43,938
53,063
53,157
Cash dividends
(18,360
)
(18,078
)
(17,790
)
Stock dividends
(47,175
)
(46,806
)
(32,629
)
Retained earnings at end of year
$114,269
$135,866
$147,687
Earnings per share
$0.76
$0.90
$0.89
Average Common and Class B Common shares outstanding
57,892
58,685
59,425
(The accompanying notes are an integral part of these statements.)
CONSOLIDATED STATEMENTS OF
Financial Position
TOOTSIE ROLL INDUSTRIES, INC. AND SUBSIDIARIES (in thousands except per share data)
Assets
December 31,
2011
2010
CURRENT ASSETS:
Cash and cash equivalents
$78,612
$115,976
Investments
10,895
7,996
Accounts receivable trade, less allowances of $1,731 and $1,531
41,895
37,394
Other receivables
3,391
9,961
Inventories:
Finished goods and work-in-process
42,676
35,416
Raw materials and supplies
29,084
21,236
Prepaid expenses
5,070
6,499
Deferred income taxes
578
689
Total current assets
212,201
235,167
PROPERTY, PLANT AND EQUIPMENT, at cost:
Land
21,939
21,696
Buildings
107,567
102,934
Machinery and equipment
322,993
307,178
Construction in progress
2,598
9,243
455,097
440,974
Less—Accumulated depreciation
242,935
225,482
Net property, plant and equipment
212,162
215,492
OTHER ASSETS:
Goodwill
73,237
73,237
Trademarks
175,024
175,024
Inv ...
Question 5The financial statements of The Hershey Company and .docx
Question 5
The financial statements of
The Hershey Company
and
Tootsie Roll
are presented below.
THE HERSHEY COMPANY
CONSOLIDATED STATEMENTS OF INCOME
For the years ended December 31,
2011
2010
2009
In thousands of dollars except per share amounts
Net Sales
$6,080,788
$5,671,009
$5,298,668
Costs and Expenses:
Cost of sales
3,548,896
3,255,801
3,245,531
Selling, marketing and administrative
1,477,750
1,426,477
1,208,672
Business realignment and impairment (credits) charges, net
(886
)
83,433
82,875
Total costs and expenses
5,025,760
4,765,711
4,537,078
Income before Interest and Income Taxes
1,055,028
905,298
761,590
Interest expense, net
92,183
96,434
90,459
Income before Income Taxes
962,845
808,864
671,131
Provision for income taxes
333,883
299,065
235,137
Net Income
$628,962
$509,799
$435,994
Net Income Per Share—Basic—Class B Common Stock
$2.58
$2.08
$1.77
Net Income Per Share—Diluted—Class B Common Stock
$2.56
$2.07
$1.77
Net Income Per Share—Basic—Common Stock
$2.85
$2.29
$1.97
Net Income Per Share—Diluted—Common Stock
$2.74
$2.21
$1.90
Cash Dividends Paid Per Share:
Common Stock
$1.3800
$1.2800
$1.1900
Class B Common Stock
1.2500
1.1600
1.0712
The notes to consolidated financial statements are an integral part of these statements and are included in the Hershey's 2011 Annual Report, available at www.thehersheycompany.com.
THE HERSHEY COMPANY
CONSOLIDATED BALANCE SHEETS
December 31,
2011
2010
In thousands of dollars
ASSETS
Current Assets:
Cash and cash equivalents
$693,686
$884,642
Accounts receivable—trade
399,499
390,061
Inventories
648,953
533,622
Deferred income taxes
136,861
55,760
Prepaid expenses and other
167,559
141,132
Total current assets
2,046,558
2,005,217
Property, Plant and Equipment, Net
1,559,717
1,437,702
Goodwill
516,745
524,134
Other Intangibles
111,913
123,080
Deferred Income Taxes
38,544
21,387
Other Assets
138,722
161,212
Total assets
$4,412,199
$4,272,732
LIABILITIES AND STOCKHOLDERS’ EQUITY
Current Liabilities:
Accounts payable
$420,017
$410,655
Accrued liabilities
612,186
593,308
Accrued income taxes
1,899
9,402
Short-term debt
42,080
24,088
Current portion of long-term debt
97,593
261,392
Total current liabilities
1,173,775
1,298,845
Long-term Debt
1,748,500
1,541,825
Other Long-term Liabilities
617,276
494,461
Total liabilities
3,539,551
3,335,131
Commitments and Contingencies
—
—
Stockholders’ Equity:
The Hershey Company Stockholders’ Equity
Preferred Stock, shares issued: none in 2011 and 2010
—
—
Common Stock, shares issued: 299,269,702 in 2011 and 299,195,325 in 2010
299,269
299,195
Class B Common Stock.
Exercise 8-4The ledger of Wainwright Company at the end of the c.docx
Exercise 8-4
The ledger of Wainwright Company at the end of the current year shows Accounts Receivable $76,000; Credit Sales $986,000; and Sales Returns and Allowances $42,200. (Credit account titles are automatically indented when amount is entered. Do not indent manually.)
(a)
If Wainwright uses the direct write-off method to account for uncollectible accounts, journalize the adjusting entry at December 31, assuming Wainwright determines that Hiller’s $1,000 balance is uncollectible.
(b)
If Allowance for Doubtful Accounts has a credit balance of $1,200 in the trial balance, journalize the adjusting entry at December 31, assuming bad debts are expected to be 11% of accounts receivable.
(c)
If Allowance for Doubtful Accounts has a debit balance of $950 in the trial balance, journalize the adjusting entry at December 31, assuming bad debts are expected to be 8% of accounts receivable.
No.
Account Titles and Explanation
Debit
Credit
(a)
(b)
(c)
Exercise 8-11
Suppose the following information was taken from the 2014 financial statements of FedEx Corporation, a major global transportation/delivery company.
(in millions)
2014
2013
Accounts receivable (gross)
$ 3,678
$ 4,608
Accounts receivable (net)
3,374
4,330
Allowance for doubtful accounts
304
278
Sales revenue
34,275
37,054
Total current assets
7,104
7,206
Answer each of the following questions.
Calculate the accounts receivable turnover and the average collection period for 2014 for FedEx. (Round answers to 1 decimal place, e.g. 12.5. Use 365 days for calculation.)
Accounts receivable turnover
times
The average collection period for 2014
days
Broadening Your Perspective 8-1
The financial statements of Tootsie Roll are presented below.
TOOTSIE ROLL INDUSTRIES, INC. AND SUBSIDIARIES
CONSOLIDATED STATEMENTS OF
Earnings, Comprehensive Earnings and Retained Earnings (in thousands except per share data)
For the year ended December 31,
2011
2010
2009
Net product sales
$528,369
$517,149
$495,592
Rental and royalty revenue
4,136
4,299
3,739
Total revenue
532,505
521,448
499,331
Product cost of goods sold
365,225
349,334
319,775
Rental and royalty cost
1,038
1,088
852
Total costs
366,263
350,422
320,627
Product gross margin
163,144
167,815
175,817
Rental and royalty gross margin
3,098
3,211
2,887
Total gross margin
166,242
171,026
178,704
Selling, marketing and administrative expenses
108,276
106,316
103,755
Impairment charges
—
—
14,000
Earnings from operations
57,966
64,710
60,949
Other income (expense), net
2,946
8,358
2,100
Earnings before income taxes
60,912
73,068
63,049
Provision for income taxes
16,974
20,005
9,892
Net earnings
$43,938
$53,063
$53,157
Net earnings
$43,938
$53,063
$53,157
Other comprehensive earnings (loss)
(8,740
)
1,183
2,845
Comprehensive earnings
...
Once each year, a corporation communicates to its stockholders.docx
Once each year, a corporation communicates to its stockholders and other inter-
ested parties by issuing a complete set of audited ! nancial statements. The
annual report , as this communication is called, summarizes the ! nancial results
of the company’s operations for the year and its plans for the future. Many annual
reports are attractive, multicolored, glossy public relations pieces, containing
pictures of corporate of! cers and directors as well as photos and descriptions of
new products and new buildings. Yet the basic function of every annual report is
to report ! nancial information, almost all of which is a product of the corpora-
tion’s accounting system.
The content and organization of corporate annual reports have become fairly
standardized. Excluding the public relations part of the report (pictures, prod-
ucts, etc.), the following are the traditional ! nancial portions of the annual report:
• Financial Highlights
• Letter to the Stockholders
• Management’s Discussion and
Analysis
• Financial Statements
• Notes to the Financial
Statements
• Management’s Responsibility
for Financial Reporting
• Management’s Report on Internal
Control over Financial Reporting
• Report of Independent Registered
Public Accounting Firm
• Selected Financial Data
The of! cial SEC ! ling of the annual report is called a Form 10-K, which
often omits the public relations pieces found in most standard annual reports. On
the following pages, we present Apple Inc.’s ! nancial statements taken from the
company’s 2013 Form 10-K. To access Apple’s Form 10-K, including notes to the
! nancial statements, follow these steps:
1. Go to http://investor.apple.com.
2. Select the Financial Information tab.
3. Select the 10-K annual report dated September 28, 2013.
4. The Notes to Consolidated Financial Statements begin on page 50.
Specimen Financial
Statements: Apple Inc.
Appendix A
A-1
A-2 Appendix A Specimen Financial Statements: Apple Inc.
CONSOLIDATED STATEMENTS OF OPERATIONS
(In millions, except number of shares which are reflected in thousands and per share amounts)
See accompanying Notes to Consolidated Financial Statements.
Years ended
September 28, 2013 September 29, 2012 September 24, 2011
Net sales $ 170,910 $ 156,508 $ 108,249
Cost of sales 106,606 87,846 64,431
Gross margin 64,304 68,662 43,818
Operating expenses:
Research and development 4,475 3,381 2,429
Selling, general and administrative 10,830 10,040 7,599
Total operating expenses 15,305 13,421 10,028
Operating income 48,999 55,241 33,790
Other income/(expense), net 1,156 522 415
Income before provision for income taxes 50,155 55,763 34,205
Provision for income taxes 13,118 ...
1Exercise 8-4The ledger of Wainwright Company at the end of .docx
1Exercise 8-4
The ledger of Wainwright Company at the end of the current year shows Accounts Receivable $76,000; Credit Sales $801,000; and Sales Returns and Allowances $50,000. (Credit account titles are automatically indented when amount is entered. Do not indent manually.)
(a)
If Wainwright uses the direct write-off method to account for uncollectible accounts, journalize the adjusting entry at December 31, assuming Wainwright determines that Hiller’s $1,000 balance is uncollectible.
(b)
If Allowance for Doubtful Accounts has a credit balance of $990 in the trial balance, journalize the adjusting entry at December 31, assuming bad debts are expected to be 11% of accounts receivable.
(c)
If Allowance for Doubtful Accounts has a debit balance of $850 in the trial balance, journalize the adjusting entry at December 31, assuming bad debts are expected to be 8% of accounts receivable.
No.
Account Titles and Explanation
Debit
Credit
(a)
(b)
(c)
Exercise 8-4
Accounts Payable
Accounts Receivable
Accumulated Depreciation-Equipment
Allowance for Doubtful Accounts
Bad Debt Expense
Cash
Common Stock
Cost of Goods Sold
Dividends
Income Tax Expense
Income Taxes Payable
Interest Receivable
Interest Revenue
Inventory
No Entry
Notes Receivable
Other Operating Expenses
Other Receivables
Retained Earnings
Sales Discounts
Sales Returns and Allowances
Sales Revenue
Service Charge Expense
Supplies
Supplies Expense
Exercise 8-11
Suppose the following information was taken from the 2014 financial statements of FedEx Corporation, a major global transportation/delivery company.
(in millions)
2014
2013
Accounts receivable (gross)
$ 3,480
$ 4,430
Accounts receivable (net)
3,472
4,401
Allowance for doubtful accounts
8
29
Sales revenue
34,728
37,059
Total current assets
7,883
7,166
Answer each of the following questions.
Calculate the accounts receivable turnover and the average collection period for 2014 for FedEx. (Round answers to 1 decimal place, e.g. 12.5. Use 365 days for calculation.)
Accounts receivable turnover
times
The average collection period for 2014
days
Is accounts receivable a material component of the company’s total current assets?
2
Broadening Your Perspective 8-1
The financial statements of Tootsie Roll are presented below.
TOOTSIE ROLL INDUSTRIES, INC. AND SUBSIDIARIES
CONSOLIDATED STATEMENTS OF
Earnings, Comprehensive Earnings and Retained Earnings (in thousands except per share data)
For the year ended December 31,
2011
2010
2009
Net product sales
$528,369
$517,149
$495,592
Rental and royalty revenue
4,136
4,299
3,739
Total revenue
532,505
521,448
499,331
Product cost of goods sold
365,225
349,334
319,775
Rental and royalty cost
1,038
1,088
852
Total costs
366,263
350,422
320,627
Product gross margin
163,144
167,815
175,817
Rental and royalty gross margin
3,098
3,211
2,887
Total gross margin
166,242
171,026
178.
Similar to Financial statements (20)
Top of FormBottom of FormBroadening Your Perspective.docx
Top of FormBottom of FormBroadening Your Perspective.docx
The Coca-Cola Company - Financial Analysis and Projections
The Coca-Cola Company - Financial Analysis and Projections
Below are two questions that includes financial statements, that i.docx
Below are two questions that includes financial statements, that i.docx
Question 5The financial statements of The Hershey Company and .docx
Question 5The financial statements of The Hershey Company and .docx
Exercise 8-4The ledger of Wainwright Company at the end of the c.docx
Exercise 8-4The ledger of Wainwright Company at the end of the c.docx
Once each year, a corporation communicates to its stockholders.docx
Once each year, a corporation communicates to its stockholders.docx
1Exercise 8-4The ledger of Wainwright Company at the end of .docx
1Exercise 8-4The ledger of Wainwright Company at the end of .docx
More from Pakistan Gum Industries Pvt. Ltd (20)
Recently uploaded
how to sell pi coins effectively (from 50 - 100k pi)
Anywhere in the world, including Africa, America, and Europe, you can sell Pi Network Coins online and receive cash through online payment options.
Pi has not yet been launched on any exchange because we are currently using the confined Mainnet. The planned launch date for Pi is June 28, 2026.
Reselling to investors who want to hold until the mainnet launch in 2026 is currently the sole way to sell.
Consequently, right now. All you need to do is select the right pi network provider.
Who is a pi merchant?
An individual who buys coins from miners on the pi network and resells them to investors hoping to hang onto them until the mainnet is launched is known as a pi merchant.
debuts.
I'll provide you the Telegram username
@Pi_vendor_247
Poonawalla Fincorp and IndusInd Bank Introduce New Co-Branded Credit Card
The unveiling of the IndusInd Bank Poonawalla Fincorp eLITE RuPay Platinum Credit Card marks a notable milestone in the Indian financial landscape, showcasing a successful partnership between two leading institutions, Poonawalla Fincorp and IndusInd Bank. This co-branded credit card not only offers users a plethora of benefits but also reflects a commitment to innovation and adaptation. With a focus on providing value-driven and customer-centric solutions, this launch represents more than just a new product—it signifies a step towards redefining the banking experience for millions. Promising convenience, rewards, and a touch of luxury in everyday financial transactions, this collaboration aims to cater to the evolving needs of customers and set new standards in the industry.
Turin Startup Ecosystem 2024 - Ricerca sulle Startup e il Sistema dell'Innov...
Turin Startup Ecosystem 2024 - Ricerca sulle Startup e il Sistema dell'Innov...Quotidiano Piemontese
Turin Startup Ecosystem 2024
Una ricerca de il Club degli Investitori, in collaborazione con ToTeM Torino Tech Map e con il supporto della ESCP Business School e di Growth Capitalhow to swap pi coins to foreign currency withdrawable.
As of my last update, Pi is still in the testing phase and is not tradable on any exchanges.
However, Pi Network has announced plans to launch its Testnet and Mainnet in the future, which may include listing Pi on exchanges.
The current method for selling pi coins involves exchanging them with a pi vendor who purchases pi coins for investment reasons.
If you want to sell your pi coins, reach out to a pi vendor and sell them to anyone looking to sell pi coins from any country around the globe.
Below is the contact information for my personal pi vendor.
Telegram: @Pi_vendor_247
how to sell pi coins at high rate quickly.
Where can I sell my pi coins at a high rate.
Pi is not launched yet on any exchange. But one can easily sell his or her pi coins to investors who want to hold pi till mainnet launch.
This means crypto whales want to hold pi. And you can get a good rate for selling pi to them. I will leave the telegram contact of my personal pi vendor below.
A vendor is someone who buys from a miner and resell it to a holder or crypto whale.
Here is the telegram contact of my vendor:
@Pi_vendor_247
What website can I sell pi coins securely.
Currently there are no website or exchange that allow buying or selling of pi coins..
But you can still easily sell pi coins, by reselling it to exchanges/crypto whales interested in holding thousands of pi coins before the mainnet launch.
Who is a pi merchant?
A pi merchant is someone who buys pi coins from miners and resell to these crypto whales and holders of pi..
This is because pi network is not doing any pre-sale. The only way exchanges can get pi is by buying from miners and pi merchants stands in between the miners and the exchanges.
How can I sell my pi coins?
Selling pi coins is really easy, but first you need to migrate to mainnet wallet before you can do that. I will leave the telegram contact of my personal pi merchant to trade with.
Tele-gram.
@Pi_vendor_247
The Evolution of Non-Banking Financial Companies (NBFCs) in India: Challenges...
Role in Financial System
NBFCs are critical in bridging the financial inclusion gap.
They provide specialized financial services that cater to segments often neglected by traditional banks.
Economic Impact
NBFCs contribute significantly to India's GDP.
They support sectors like micro, small, and medium enterprises (MSMEs), housing finance, and personal loans.
This assessment plan proposal is to outline a structured approach to evaluati...
This assessment plan proposal is to outline a structured approach to evaluati...lamluanvan.net Viết thuê luận văn
Luận Văn Group hỗ trợ viết luận văn thạc sĩ,chuyên đề,khóa luận tốt nghiệp, báo cáo thực tập, Assignment, Essay
Zalo/Sdt 0967 538 624/ 0886 091 915 Website:lamluanvan.net
Tham gia nhóm hỗ trợ viết bài fb: https://www.facebook.com/groups/285625754522599?locale=vi_VNwhat is the future of Pi Network currency.
The future of the Pi cryptocurrency is uncertain, and its success will depend on several factors. Pi is a relatively new cryptocurrency that aims to be user-friendly and accessible to a wide audience. Here are a few key considerations for its future:
Message: @Pi_vendor_247 on telegram if u want to sell PI COINS.
1. Mainnet Launch: As of my last knowledge update in January 2022, Pi was still in the testnet phase. Its success will depend on a successful transition to a mainnet, where actual transactions can take place.
2. User Adoption: Pi's success will be closely tied to user adoption. The more users who join the network and actively participate, the stronger the ecosystem can become.
3. Utility and Use Cases: For a cryptocurrency to thrive, it must offer utility and practical use cases. The Pi team has talked about various applications, including peer-to-peer transactions, smart contracts, and more. The development and implementation of these features will be essential.
4. Regulatory Environment: The regulatory environment for cryptocurrencies is evolving globally. How Pi navigates and complies with regulations in various jurisdictions will significantly impact its future.
5. Technology Development: The Pi network must continue to develop and improve its technology, security, and scalability to compete with established cryptocurrencies.
6. Community Engagement: The Pi community plays a critical role in its future. Engaged users can help build trust and grow the network.
7. Monetization and Sustainability: The Pi team's monetization strategy, such as fees, partnerships, or other revenue sources, will affect its long-term sustainability.
It's essential to approach Pi or any new cryptocurrency with caution and conduct due diligence. Cryptocurrency investments involve risks, and potential rewards can be uncertain. The success and future of Pi will depend on the collective efforts of its team, community, and the broader cryptocurrency market dynamics. It's advisable to stay updated on Pi's development and follow any updates from the official Pi Network website or announcements from the team.
Which Crypto to Buy Today for Short-Term in May-June 2024.pdf
The world of bitcoin is constantly changing, with new opportunities and hazards surfacing practically daily.
how to sell pi coins in all Africa Countries.
Yes. You can sell your pi network for other cryptocurrencies like Bitcoin, usdt , Ethereum and other currencies And this is done easily with the help from a pi merchant.
What is a pi merchant ?
Since pi is not launched yet in any exchange. The only way you can sell right now is through merchants.
A verified Pi merchant is someone who buys pi network coins from miners and resell them to investors looking forward to hold massive quantities of pi coins before mainnet launch in 2026.
I will leave the telegram contact of my personal pi merchant to trade with.
@Pi_vendor_247
Introduction to Indian Financial System ()
The financial system of a country is an important tool for economic development of the country, as it helps in creation of wealth by linking savings with investments.
It facilitates the flow of funds form the households (savers) to business firms (investors) to aid in wealth creation and development of both the parties
What price will pi network be listed on exchanges
The rate at which pi will be listed is practically unknown. But due to speculations surrounding it the predicted rate is tends to be from 30$ — 50$.
So if you are interested in selling your pi network coins at a high rate tho. Or you can't wait till the mainnet launch in 2026. You can easily trade your pi coins with a merchant.
A merchant is someone who buys pi coins from miners and resell them to Investors looking forward to hold massive quantities till mainnet launch.
I will leave the telegram contact of my personal pi vendor to trade with.
@Pi_vendor_247
BYD SWOT Analysis and In-Depth Insights 2024.pptx
Indepth analysis of the BYD 2024
BYD (Build Your Dreams) is a Chinese automaker and battery manufacturer that has snowballed over the past two decades to become a significant player in electric vehicles and global clean energy technology.
This SWOT analysis examines BYD's strengths, weaknesses, opportunities, and threats as it competes in the fast-changing automotive and energy storage industries.
Founded in 1995 and headquartered in Shenzhen, BYD started as a battery company before expanding into automobiles in the early 2000s.
Initially manufacturing gasoline-powered vehicles, BYD focused on plug-in hybrid and fully electric vehicles, leveraging its expertise in battery technology.
Today, BYD is the world’s largest electric vehicle manufacturer, delivering over 1.2 million electric cars globally. The company also produces electric buses, trucks, forklifts, and rail transit.
On the energy side, BYD is a major supplier of rechargeable batteries for cell phones, laptops, electric vehicles, and energy storage systems.
Webinar Exploring DORA for Fintechs - Simont Braun
Webinar Exploring DORA for Fintechs - Simont Braun
How to get verified on Coinbase Account?_.docx
t's important to note that buying verified Coinbase accounts is not recommended and may violate Coinbase's terms of service. Instead of searching to "buy verified Coinbase accounts," follow the proper steps to verify your own account to ensure compliance and security.
The European Unemployment Puzzle: implications from population aging
We study the link between the evolving age structure of the working population and unemployment. We build a large new Keynesian OLG model with a realistic age structure, labor market frictions, sticky prices, and aggregate shocks. Once calibrated to the European economy, we quantify the extent to which demographic changes over the last three decades have contributed to the decline of the unemployment rate. Our findings yield important implications for the future evolution of unemployment given the anticipated further aging of the working population in Europe. We also quantify the implications for optimal monetary policy: lowering inflation volatility becomes less costly in terms of GDP and unemployment volatility, which hints that optimal monetary policy may be more hawkish in an aging society. Finally, our results also propose a partial reversal of the European-US unemployment puzzle due to the fact that the share of young workers is expected to remain robust in the US.
Recently uploaded (20)
how to sell pi coins effectively (from 50 - 100k pi)
how to sell pi coins effectively (from 50 - 100k pi)
Poonawalla Fincorp and IndusInd Bank Introduce New Co-Branded Credit Card
Poonawalla Fincorp and IndusInd Bank Introduce New Co-Branded Credit Card
Turin Startup Ecosystem 2024 - Ricerca sulle Startup e il Sistema dell'Innov...
Turin Startup Ecosystem 2024 - Ricerca sulle Startup e il Sistema dell'Innov...
how to swap pi coins to foreign currency withdrawable.
how to swap pi coins to foreign currency withdrawable.
The Evolution of Non-Banking Financial Companies (NBFCs) in India: Challenges...
The Evolution of Non-Banking Financial Companies (NBFCs) in India: Challenges...
This assessment plan proposal is to outline a structured approach to evaluati...
This assessment plan proposal is to outline a structured approach to evaluati...
Which Crypto to Buy Today for Short-Term in May-June 2024.pdf
Which Crypto to Buy Today for Short-Term in May-June 2024.pdf
Webinar Exploring DORA for Fintechs - Simont Braun
Webinar Exploring DORA for Fintechs - Simont Braun
The European Unemployment Puzzle: implications from population aging
The European Unemployment Puzzle: implications from population aging
Financial statements
- 1. 2012 2011 2010 REVENUE AND GROSS PROFIT Total revenue 4,101 3,855 3,990 OPERATING EXPENSES Cost of revenue total 3,788 3,443 3,746 Selling, general and admin. expenses, total 91 73 57 Depreciation/amortization 11 9.46 7.64 Unusual expense(income) -- -- 0 Other operating expenses, total 2.79 4.08 3.03 Total operating expense 3,892 3,530 3,813 Operating income 209 326 177 Other, net 39 41 22 INCOME TAXES, MINORITY INTEREST AND EXTRA ITEMS Net income before taxes 369 310 157 Provision for income taxes 64 76 49 Net income after taxes 305 234 108 Minority interest -- -- -- Net income before extra. Items 305 234 108 Total extraordinary items -- -- -- Net income 305 234 108 Inc.avail. to common excl. extra. Items 305 234 108 Inc.avail. to common incl. extra. Items 305 234 108 EPS RECONCILIATION Basic/primary weighted average shares 24 24 24 Basic/primary eps excl. extra items 13 9.84 4.53 Basic/primary eps incl. extra items 13 9.84 4.53 Dilution adjustment -- -- 0 Diluted weighted average shares 24 24 24 Diluted eps excl. extra items 13 9.84 4.53 Diluted eps incl. extra items 13 9.84 4.53 COMMON STOCK DIVIDENDS DPS - common stock primary issue 0.91 2.27 2.27
- 2. Gross dividend - common stock 54 54 54 PRO FORMA INCOME Pro forma net income -- -- -- Interest expense, supplemental 51 98 51 SUPPLEMENTAL INCOME Depreciation, supplemental 48 42 33 Total special items (1.32) (0.70) (1.41) NORMALIZED INCOME Normalized income before taxes 368 310 156 Effect of special items on income taxes (0.23) (0.17) (0.44) Income tax excluding impact of special items 64 76 49 Normalized income after tax 304 234 107 Normalized income avail. to common 304 234 107 Basic normalized EPS 13 9.82 4.49 Diluted normalized EPS 13 9.82 4.49