The key points from the document are:
1. The 12th meeting of the National Power Committee was held on 17th October 2022 to discuss important agenda items including a proposal for National Level Optimization of Surplus Generation Capacity.
2. The committee confirmed the minutes from the previous two NPC meetings. An action taken report from regional power committees was also presented.
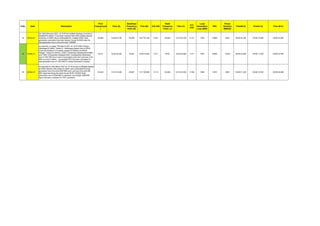
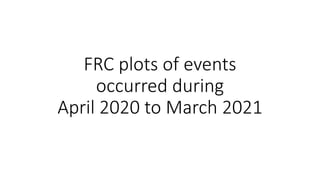
3. The proposal for National Level Optimization of Surplus Generation Capacity was discussed, and comments from stakeholders were requested within 10 days to finalize the scheme before the next crisis period expected in April-May 2023.
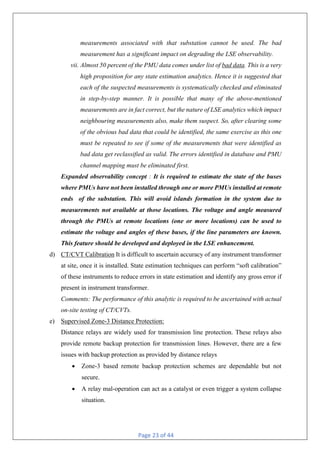
4. The status of existing and proposed islanding schemes across regions was reviewed, and regional power committees were requested to
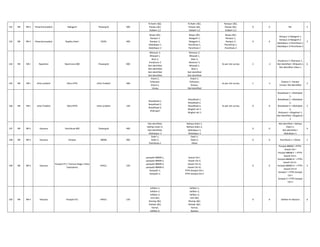
![6.5. MS, WRPC informed that 5 number of new islanding schemes were proposed for WR
region. DPR for newly proposed Islanding Schemes of Jabalpur is completed and sent to
NLDC for PSDF funding. Nagpur IS DPR is in the final stage of approval of competent
Authority of MSETCL .WRPC is to follow TATA model of load management used for
Mumbai IS. DPRs from state of Gujarat is awaited. He informed that review meeting for
these newly proposed IS would be taken by WRPC for completion of DPRs by the end of
October. He further informed that for Uran IS, SCADA visibility may be completed within
one month time.
6.6. MS, NERPC informed that DPR old Islanding Scheme of Guwahati would be completed by
October 2022. . He also informed that the Tripura Islanding Scheme is old IS which was
reviewed on 29.09.2021 and the reviewed scheme will be implemented by November, 22.
6.7. NERPC was also requested to expedite the process.
Decisions in the meeting
6.8. Chairperson, NPC/CEA suggested that in case of Mumbai IS, local generation of Mumbai
shall be made available for ensuring sustainability of Mumbai Island since in case of non-
availability of local generation, the Mumbai load will be heavily dependent on import
generation. He suggested WRPC to periodically review the situation.
[Action: WRPC]
6.9. RPCs were again requested to expedite the implementation of new islanding schemes and
review of old Islanding schemes, as per SOP. Islanding Schemes which are under
implementation shall be reviewed and discussed in next NPC meeting
[Action-All RPCs]
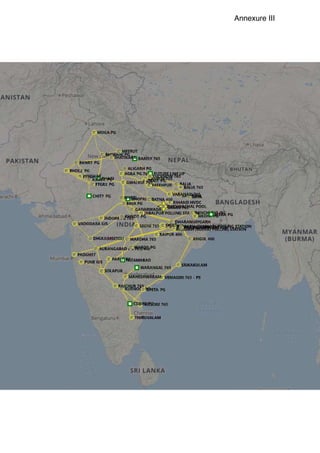
6.10. RPCs were requested to send the updated MIS report on monthly basis to NPC. The updated
MIS is attached at Annexure III.
[Action-All RPCs]
7. National Energy Account (NEA)
7.1. MS (NPC) informed followings in regard to National Energy Account (NEA) to the
committee:
a) MoP vide letter No.A-60016/24/2012-Adm-I dated 30.11.2016 observed that
considering the changing scenarios, the functions of NPC may also be broadened
including the functions to maintain the National Energy Account (NEA) involving the
trans-national and inter-regional transmission transactions.
b) NLDC vide letter dated 09th November
2018 furnished the Agenda Note on National
Energy Account & National Deviation Pool Account. NLDC was of the view that there
is a need for implementing a National Deviation Pool Account based on the National
Energy Account, for streamlining the accounting and settlement at national level.
Further, suitable changes/modifications were required to be effected in the Indian
Electricity Grid Code (IEGC) and Deviation Settlement Mechanism (DSM)
Regulations apart from recognizing the functions of NPC in the regulatory framework.
c) The issue of National Energy Account was deliberated in various meetings (8th
, 9th
, 10th
and 11th
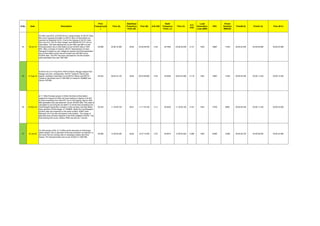
) of NPC and in the 11th
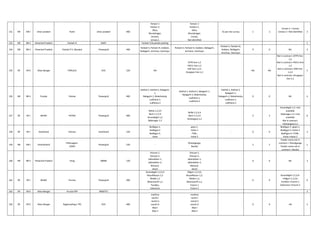
meeting of NPC held on 28.02.2022, NPC and RPCs](https://image.slidesharecdn.com/final12thnpcminutesofthemeeting-221230140335-73c09bbb/85/Final_12th_NPC_Minutes_of_the_Meeting-pdf-7-320.jpg)
![agreed that in future, if NEA would be mandated by CERC, the directions may be
followed accordingly. It was also decided that, the mock accounting of the proposed
National Energy Accounting (NEA) may be carried out by NLDC for RPCs and
NPC in order to have a clear understanding of NEA.
d) In this regard, the amendment in the functions of National Power Committee in its
Conduct of Business Rule (CBR) will be required. The amended CBR of NPC is
attached as Annexure-IV and the same is required to be forwarded to the MoP for
issuance of necessary orders.
Deliberations in the meeting
7.2. ED, NLDC highlighted the importance of NEA for smooth settlement of accounts in case
of inter-regional transactions by avoiding circular fund flow between the regions. It was also
suggested that NEA can be functioned in parallel with the Regional Energy Account (REA)
mentioning inter-regional and cross border transactions, and if there seems no concerns in
NEA, it can be adopted fully at national level and inter-regional & cross border transaction
may be removed from REA.
7.3. MS, NRPC endorsed the view of ED, NLDC. He further added that RPCs have concerns on
NEA since there is no directions from CERC on NEA.
7.4. MS, SRPC informed that presently NLDC issued the mock accounts based on REA accounts
issued by RPCs by merely adding and subtracting the inter-regional and cross border
transaction of DSM account only. He opined there is no value addition in the mock accounts
issued by NLDC since it considers DSM account only. He suggested that NLDC may
include accounts like RRAS and AGC in the mock NEA accounts.
7.5. ED, NLDC informed that currently the mock exercise include DSM accounts and gradually
the other accounts like RRAS, AGC etc. as suggested by SRPC may be included.
7.6. Chairperson, CEA opined that keeping in mind the future requirements, priority has to be
given for seamless inter-regional transactions and NEA is one of such mechanism. He
advised NLDC to analyse the modifications required in the CERC regulations for NEA
and send it to NPC, which can be taken up further with CERC. RPCs can also give
comments on mock accounting of NEA and send them to NPC within two month and
accordingly, the mock accounting can be modified.
7.7. It was also suggested that amendments in the functions of National Power Committee (NPC)
in its Conduct of Business Rule (CBR) can be taken up with MoP simultaneously.
Decisions in the meeting
7.8. POSOCO shall analyse the modifications required in the CERC regulations for NEA and
send it to NPC, which can be taken up further with CERC.
[Action-POSOCO/NPC Secretariat]
7.9. RPCs may give comments on mock accounting of NEA and send them to NPC within two
month and accordingly, the mock accounting can be modified.
[Action-All RPCs]
7.10. NEA requires amendments in the functions of National Power Committee (NPC) in its
Conduct of Business Rule (CBR) which can be taken up with MoP simultaneously.
[Action-NPC Secretariat]](https://image.slidesharecdn.com/final12thnpcminutesofthemeeting-221230140335-73c09bbb/85/Final_12th_NPC_Minutes_of_the_Meeting-pdf-8-320.jpg)
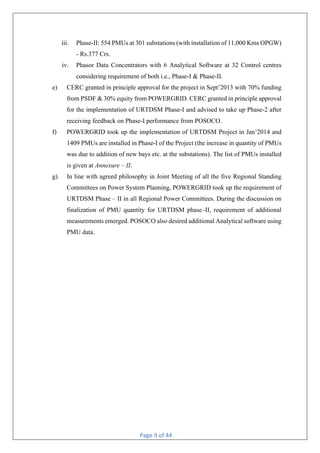
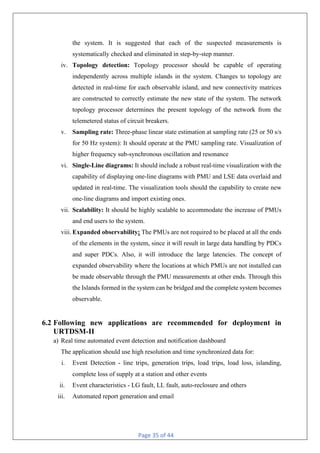
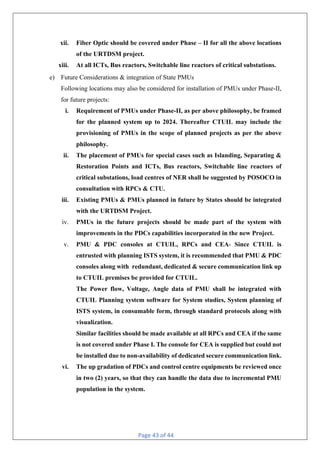
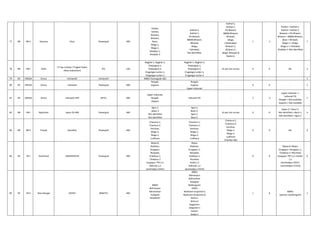
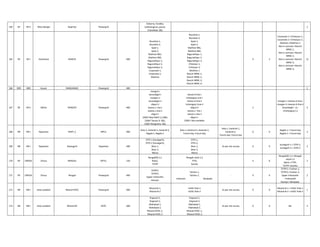
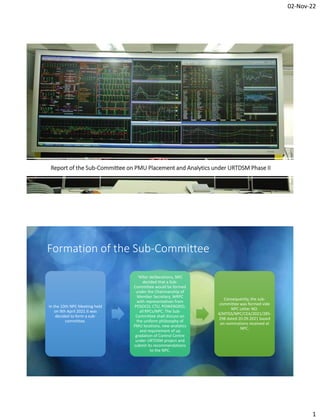
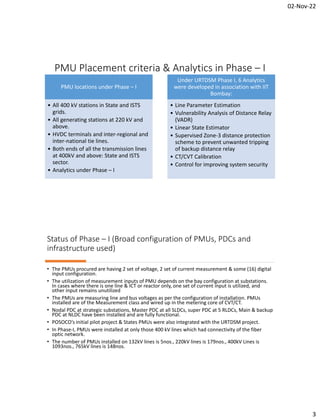
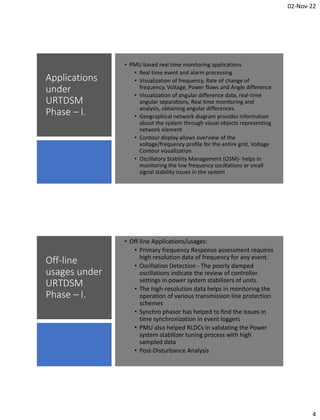
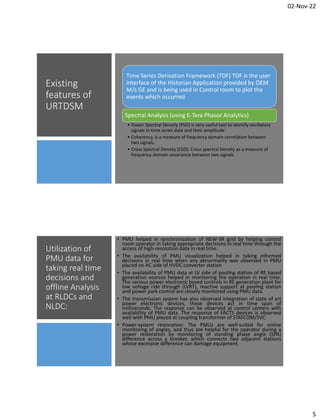
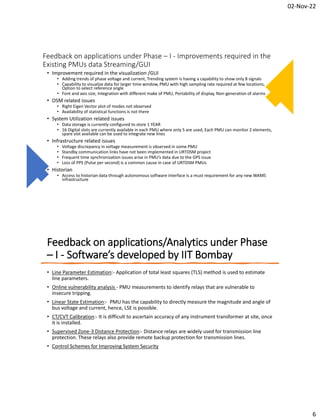
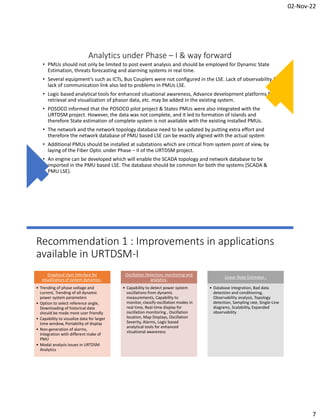
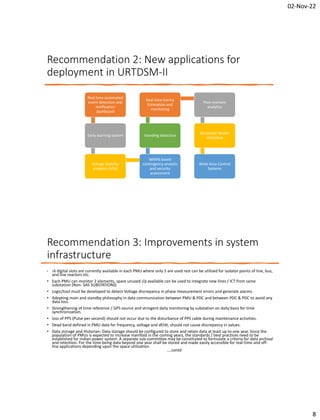
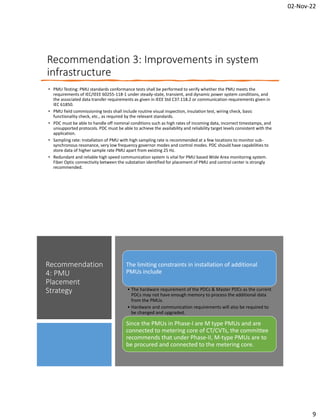
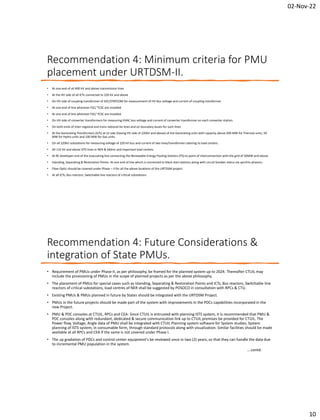
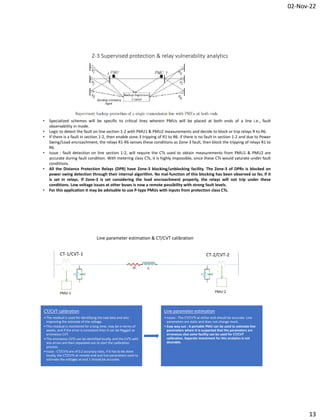
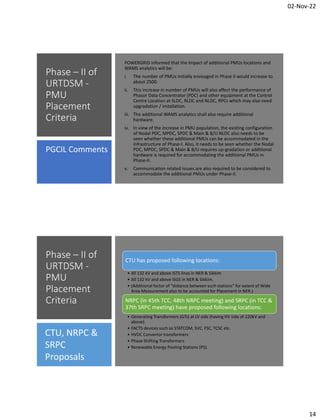
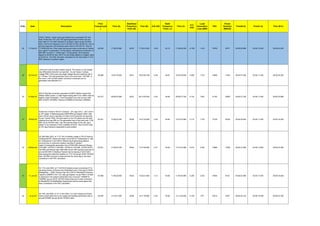
![8.10. MS, WRPC informed that the sub-committee has finalised its report. He presented a
presentation highlighting the salient features of the report on philosophy of PMU Placement
and Analytics under URTDSM Phase II. The report and presentation is attached at
Annexure-V.
8.11. Chairperson, CEA/NPC appreciated the sincere efforts of the subcommittee and advised
that the report of sub-committee may be examined at RPCs level. RPCs may give their
suggestions/recommendations within one month time and subsequently based on the
suggestions/recommendations of RPCs, the report would be accepted by NPC. MS WRPC
may take a lead and coordinate for the same and revise the report if required.
[Action-All RPCs/WRPC]
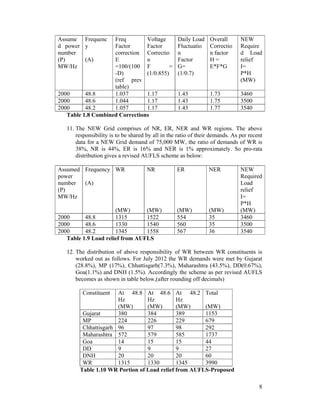
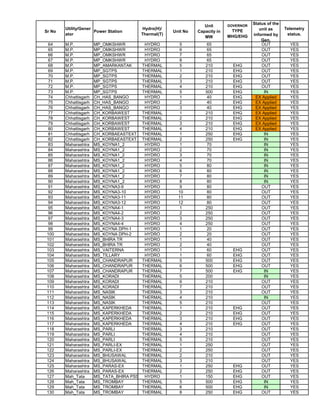
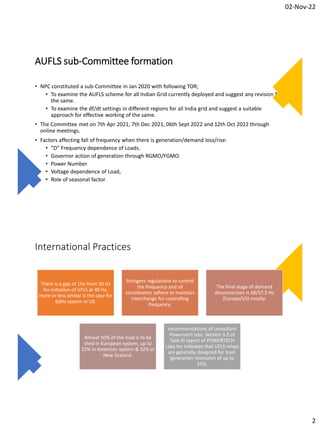
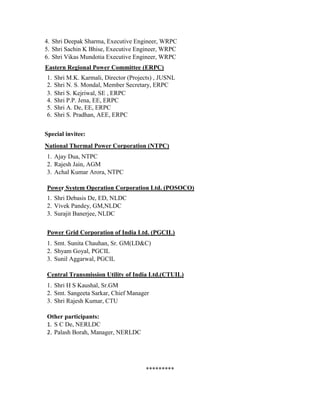
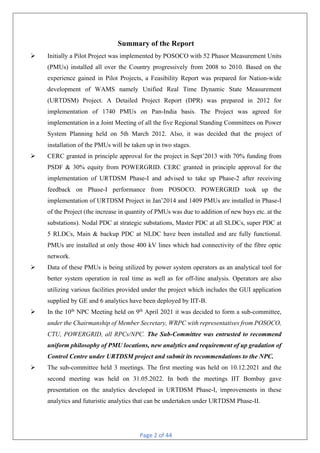
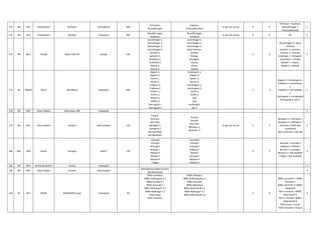
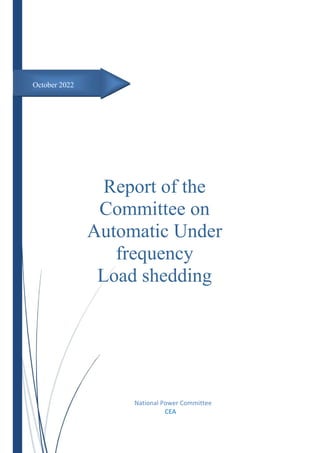
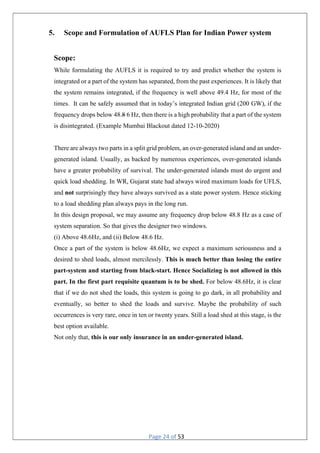
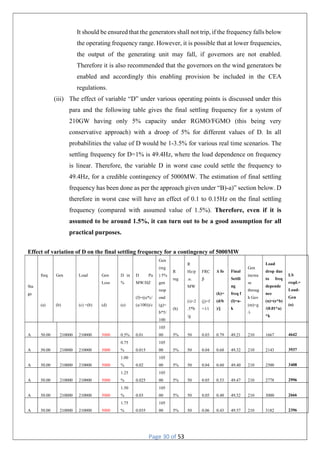
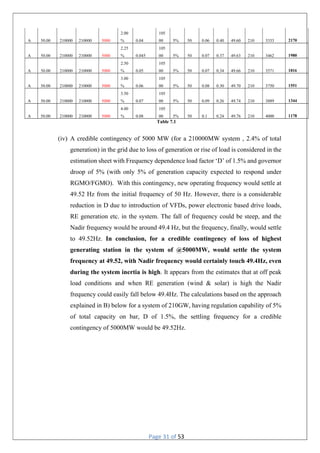
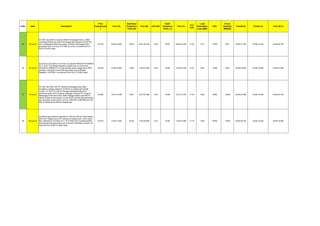
9. Automatic Under Frequency Load Shedding (AUFLS) Scheme and Mapping of Feeders
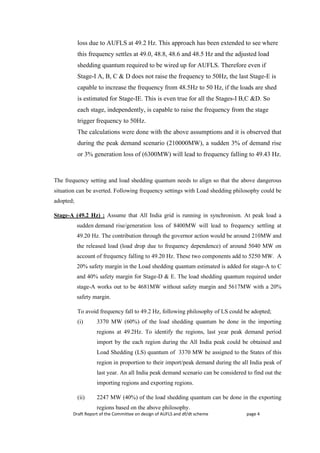
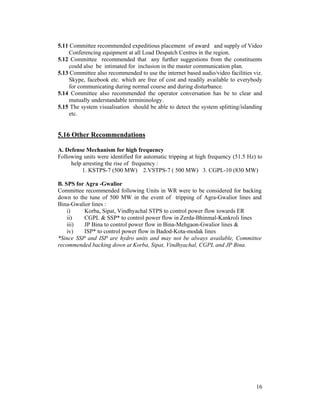
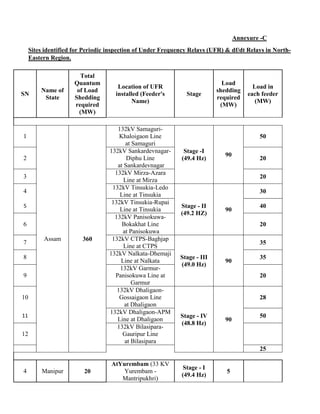
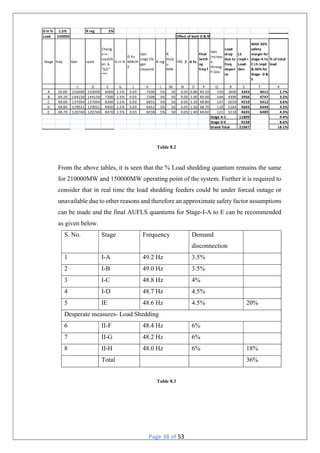
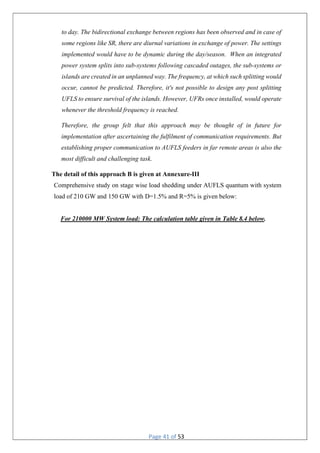
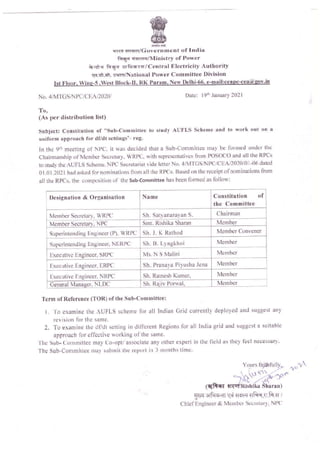
(A) Review of AUFLS Settings
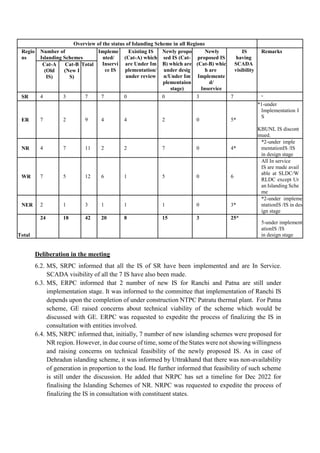
9.1. As per the decision in the 2nd
meeting of NPC held on 16th
July 2013, the following AUFLS
scheme at four (4) stages of frequency viz. 49.2 Hz, 49.0 Hz, 48.8 Hz & 48.6 Hz had been
implemented in all the regions
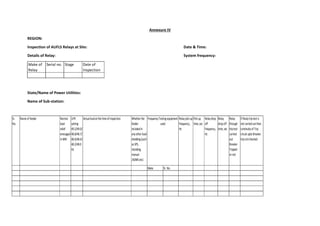
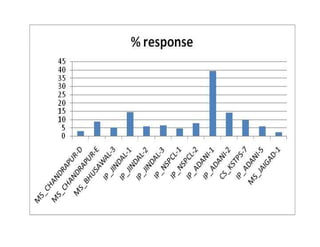
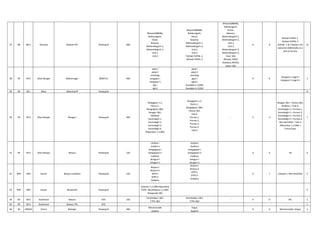
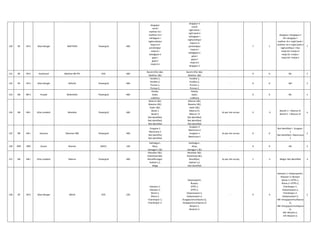
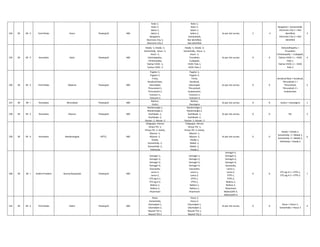
AUFLS Frequency
(Hz)
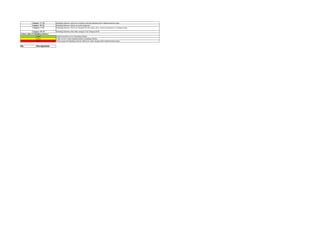
Load relief in MW
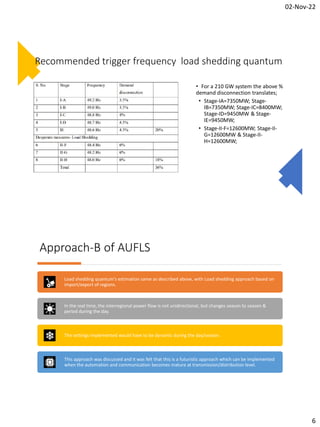
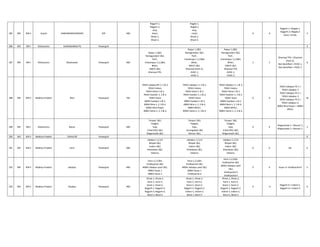
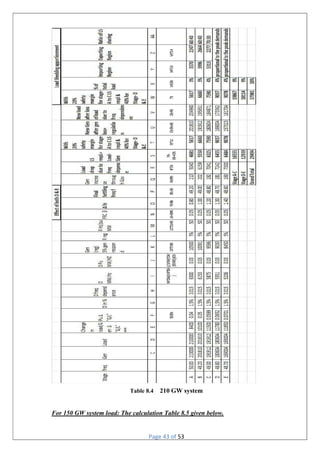
NR WR SR * ER NER Total
Stage-I 49.2 2160 2060 2350 820 100 7490
Stage-II 49.0 2170 2070 2360 830 100 7530
Stage-III 48.8 2190 2080 2390 830 100 7590
Stage-IV 48.6 2200 2100 2400 840 100 7640
Total
(MW)
8720 8310 9500 3320 400 30250
*SR grid not integrated with NEW grid at that point of time
9.2. In the 10th
meeting of NPC it was decided that the AUFLS scheme (with 4 stages) viz. 49.4,
49.2, 49.0 & 48.8 Hz with existing quantum of load shedding shall be implemented in all
the Regions. A subcommittee was also constituted with members from CEA, RPC,
POSOCO to review of AUFLS scheme and the quantum of load shedding.
9.3. In the 11th
meeting of NPC, it was informed that SR, WR and ER constituents have already
raised the settings of UFR of AUFLS scheme by 0.2 Hz.
Deliberations/Decisions in the meeting:
9.4. MS, NPC briefed the agenda item and requested MS, WRPC to update the progress of report
of sub-committee on AUFLS.
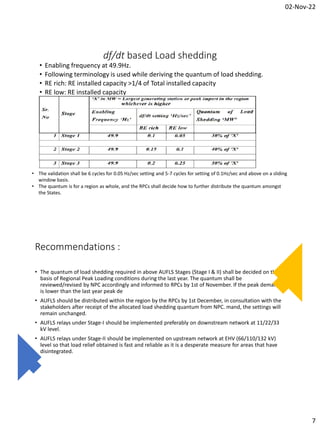
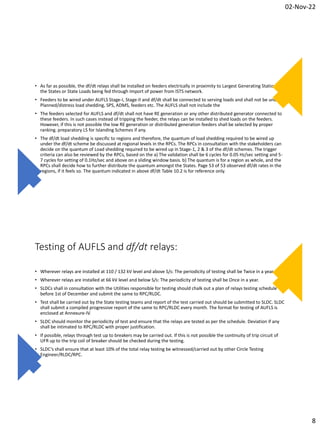
9.5. MS WRPC informed the Committee that report on AUFLS and df/dt has been finalised by
the sub-committee. He gave a presentation (PPT) briefing the highlights of reports. The
report and presentation is attached at Annexure-VI.
9.6. MS, SRPC raised the concern on the quantum of load shedding in the reports and suggested
that it needs to be reviewed considering the Islanding Schemes of SR.](https://image.slidesharecdn.com/final12thnpcminutesofthemeeting-221230140335-73c09bbb/85/Final_12th_NPC_Minutes_of_the_Meeting-pdf-10-320.jpg)
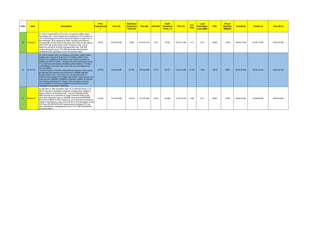
![9.7. Chairperson, CEA/NPC appreciated the efforts of the members of the subcommittee for
bringing out a very good technical report. He requested that Member Secretaries of all
RPCs may have a meeting to discuss the report and shall strive to reach at a working
consensus especially for SR. MS WRPC may take a lead and coordinate for the
meeting. NPC may be appraised in the next meeting.
[Action-WRPC/All RPCs]
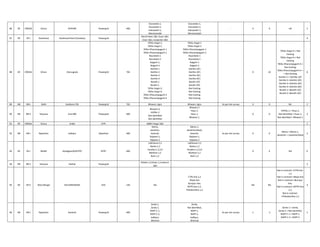
(B) Mapping of Feeders under AUFLS schemes:
9.8. MS, NPC reiterated that each RPC would submit the details/progress of feeder mapping
under AUFLS scheme on SCADA to NPC Secretariat regularly on a quarterly basis. It was
again suggested that for improving the mapping of feeders following similar procedure as
adopted by SRPC may be followed by all RPCs.
“Generally the 66 kV and 33 kV lines are connected at 132 kV level or 220 kV level,
therefore, the communication system available at 132 kV level and 220 kV level can be
utilized for these lines. For 11 kV and 33 kV level, the DISCOMs data may be integrated
with their control centers. From the control centre it could be picked up to SLDC.”
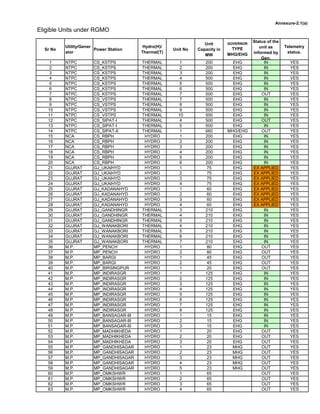
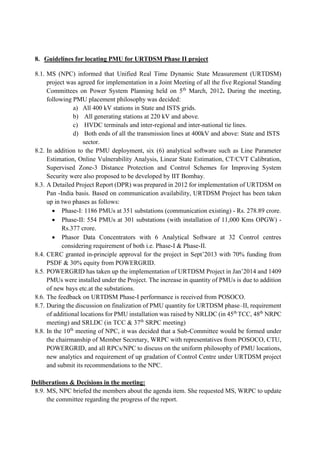
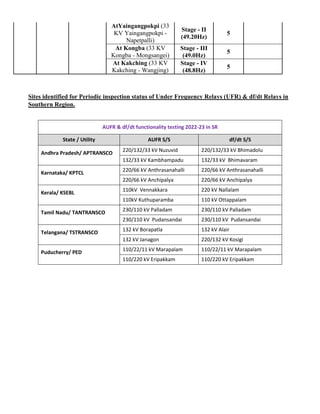
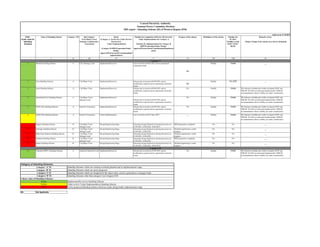
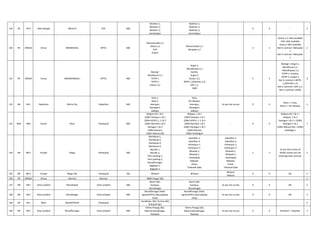
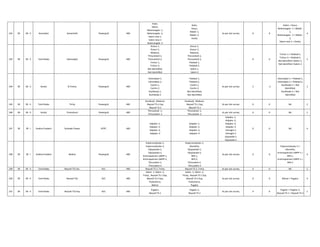
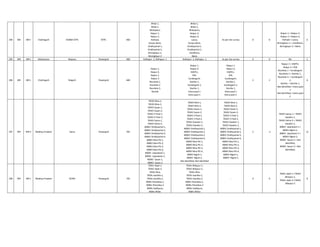
9.9. The status of mapping of feeder under AUFLS as intimated by RPCs are as below:
RPCs Status Updates from RPCs as on 17.10.2022
NRPC UP-89 %, Punjab-38%,Haryana-85%, Delhi-73%,HP-63%, Rajasthan, UK, J&K
& Chandigarh-0%.
ERPC 95% mapping of feeders achieved.
The matter is being regularly taken up with the state utilities in Test meeting of
ERPC for 100 % mapping of the feeders under AUFLS scheme.
NERPC Assam-100 %, Meghalaya-100%, Nagaland-80%, Arunachal Pradesh, Manipur,
Mizoram & Tripura – 0%.
The issue is being reviewed/discussed in monthly OCC meeting of NERPC and
50% will be mapped by October, 2022.
WRPC The recommendation of NPC regarding the mapping of feeders was taken in 560th
OCC and the utilities were advised to expedite the mapping of feeders. Regular
status of mapping would be taken up in upcoming OCC meetings.
SRPC SCADA mapping status is being updated/reviewed in monthly OCC Meetings.
The status update was taken in the 194th Meeting of OCC held on 12.09.2022 As
on 31.08.2022 mapping was 93% in SR.
9.10. Chairperson, CEA/NPC emphasized that mapping of the feeders is very much required for
smooth operation of the grid. He requested WRPC, NRPC and NERPC to conduct meetings
with their DISCOMs to find solutions for feeder mapping and expedite it in their regions.
The method suggested by SRPC may be explored.
[Action-NRPC/WRPC/NERPC]
10. Ensuring Proper Functioning of Under Frequency Relays (UFR) & df/dt Relays.
10.1. The updated status of ensuring Proper Functioning of Under Frequency Relays (UFR) &
df/dt Relays as submitted by RPCs are as follows:](https://image.slidesharecdn.com/final12thnpcminutesofthemeeting-221230140335-73c09bbb/85/Final_12th_NPC_Minutes_of_the_Meeting-pdf-11-320.jpg)
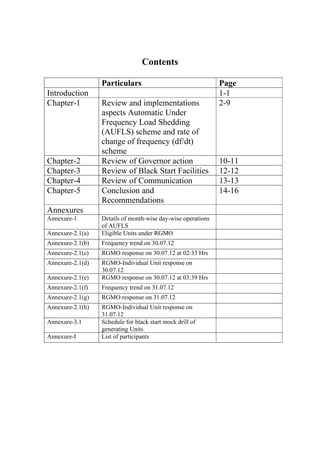
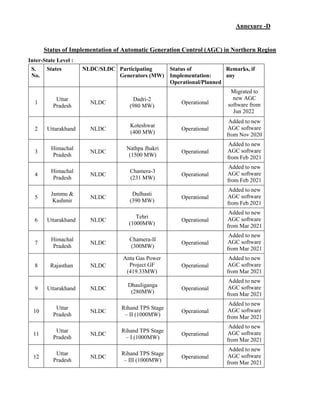
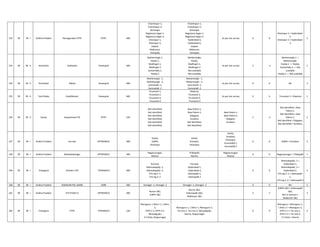
![RPCs Status Updates from RPCs
NRPC Utilities submit report of mock exercises for healthiness of UFRs on quarterly basis
to NRPC Secretariat. The compliance is monitored in monthly OCC meetings.
Further, NRPC has also conducted UFR inspection of 220 kV Park Street S/s of
DTL on 10.08.2022.
ERPC Certificate of healthiness of UFR relay is being submitted by respective
STU/SLDC in given format in every month and the same is monitored in monthly
OCC meeting of ERPC.
UFR audit of 3 substations in Bihar was carried out in April-22.
Further UFR audit of 7 no of substations in West Bengal would be carried out in
November’2022
NERPC 8 Substations and 16 feeders for UFR inspection have been identified for
inspection.
The inspection/test would be completed by 31st December 2022.
WRPC
In the 560th OCC States confirmed that they are ensuring healthiness of AUFLS
and df/dt relays and detailed report will be submitted shortly.
SRPC 12 Substations each for UFR & df/dt inspection have been identified for
inspection.
The inspection/test would be completed by 31st
December 2022.
10.2. Chairperson CEA suggested that RPCs shall periodically conduct the periodic inspection of
UFR and df/dt relays to ensure proper functioning of UFR and df/dt relays. He also advised
NPC Secretariat to regularly follow-up the status update from RPCs on the agenda item.
Decision in the meeting:
10.3. RPCs shall periodically conduct the inspection of UFR and df/dt relays to ensure proper
functioning of UFR and df/dt relays.
10.4. NPC Secretariat shall regularly follow-up the status update from RPCs on the agenda item.
[Action-All RPCs and NPC Secretariat]
11. Power System Stabilizers (PSS) tuning
11.1. The Enquiry Committee constituted by Govt. of India to enquire into the grid disturbances
of July, 2012, had inter-alia recommended proper tuning of electronic devices and PSS of
generators.
11.2. In the 9th
meeting of NPC, it was decided that a Sub-group may be constituted comprising
of representatives of Protection Sub-Committee of respective RPCs, NPC, NLDC, CTU,
NTPC and NHPC, to finalize a common procedure for Power System Stabilizers (PSS)](https://image.slidesharecdn.com/final12thnpcminutesofthemeeting-221230140335-73c09bbb/85/Final_12th_NPC_Minutes_of_the_Meeting-pdf-12-320.jpg)
![Tuning. Accordingly, NPC Secretariat vide letter dated 08.02.2021 has formed the Sub-
Committee under the chairmanship of MS, WRPC to finalize a common procedure for
Power System Stabilizers (PSS) Tuning.
11.3. MS WRPC briefed the ongoing works of the committee. He informed that within a month
time the report will be finalised.
11.4. Chairperson, CEA advised that before finalizing the reports, it must be ensured that
views and comments of RPCs and other stakeholders may be incorporated suitably in
the final report.
[Action-All RPC]
12. Issuance of Regional Energy Account (REA)
12.1. The status update received to NPC regarding the issuance of Regional Energy Account from
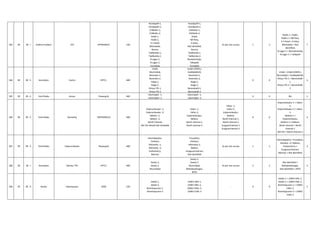
RPCs, NLDC and NTPC are as follows:
RPCs Status Updates from RPCs
NRPC REA Issued till 4th
day of the month.
ERPC ERPC Secretariat issues REA on the same day or by next day of receiving the
input data from ERLDC.
NERPC NERPC Secretariat issues REA (Provisional) on 1st
or 2nd
working day of the
month.
WRPC REA Issued till 2nd
of the month.
SRPC SRPC Secretariat issues REA (Provisional) on 1st
or 2nd
of the month.
NTPC From last six months REAs are being generally issued on 2nd
day of the month
from NERPC, ERPC, SRPC, and WRPC. NRPC also issued it timely but
sometimes till 4th
day of the month. He informed that overall the situation has
been improved in the past six months
NLDC The works related to preparation of data for REA is always dealt on priority,
however, sometimes it may be delayed due to generation of errors in data which
requires cross checking of data
12.2. Chairperson CEA stated that as informed by NTPC it appears that the issue has been
resolved and REA is being issued by RPCs in a timely manner. He suggested that this agenda
may be dropped from next meeting until any issue arises further in issuance of REA.
13. Implementation of Automatic Generation Control (AGC) in India (at Inter-State level)
13.1. In the 11th
meeting of NPC, it was observed that progress of implementation of AGC is slow
especially in intra-state AGC implementation. RPCs were requested to monitor the status
of intra-state AGC implementation regularly and to suggest states to approach SERC for the
financial implication of AGC implementation.
13.2. The status update received from RPCs are at as below:
RPCs Status Updates from RPCs](https://image.slidesharecdn.com/final12thnpcminutesofthemeeting-221230140335-73c09bbb/85/Final_12th_NPC_Minutes_of_the_Meeting-pdf-13-320.jpg)
![14.5. Chairperson, NPC/CEA was of the view that RPCs are not directly assigned for monitoring
of PSDF projects and suggested that monitoring of PSDF sanctioned projects may be done
through the Project Monitoring Group of PSDF which has been created for the same. All
RPCs endorsed the view of Chairperson, CEA.
14.6. MS NPC was of the view that the Project Monitoring Group of PSDF conducts various
meetings at regional levels for monitoring the implementation of sanctioned scheme and
these meetings were impactful in terms of reduction in delay in completion of projects and
also improves the disbursement of fund to project entities. The purpose of bringing this
agenda in NPC meetings was to sensitise the states for timely completion of projects through
RPCs
14.7. Chairperson, NPC/CEA raised concern on delay in sanctioning of the projects under PSDF.
On this MS, NRPC suggested for a dedicated online portal for PSDF for uploading of DPR,
comments of TESG, and inputs of project entities so that the project may be sanctioned in
limited time period.
14.8. ED, NLDC informed the committee that the portal was already developed one year back but
it has not been utilised by the entities. NLDC stated that they would again request
the utilities /states to utilise the portal.
14.9. Chairperson, NPC/CEA advised NLDC that the portal to be revived and to be made fully
operational. NLDC shall also informed states/utilities regarding the portal and suggest them
to utilise it for early sanctioning of projects in limited time period.
Decisions in the meeting:
14.10. NLDC shall revived the portal again and made it functional completely. POSOCO shall also
disseminate the information to states/utilities regarding the portal and suggest them to utilise
it for early sanctioning of projects through PSDF.
[Action-POSOCO/NLDC]
14.11. It was decided that the agenda item may be dropped as the monitoring of PSDF sanctioned
projects is done through Project Monitoring Group (PMG) of PSDF.
15. Membership of RPC forum (ERPC- Agenda)
15.1. Government of India has a vision of achieving Renewable Energy installation target of 150
GW and 450 GW by 2022 and 2030 respectively. The major challenge before the
government is the RE integration to the Indian Electricity Grid and smooth running of the
Grid in the Real Time operation. For resolving the issues of RE generators, smooth
integration and proper real time dispatch of RE generation, ERPC proposed a suitable
provision for inclusion of RE generators with threshold of 200 MW and above as a
membership of RPC forum.
15.2. In the 11th meeting of NPC, it was observed that the issue needs deliberation at the RPC
level first and afterward may be discussed at NPC level.
15.3. SRPC vide letter dated 05.07.2022(Annexure-VII) informed that the issue was discussed
in the 42nd meeting of SRPC. SRPC recommended that membership of two RE generators](https://image.slidesharecdn.com/final12thnpcminutesofthemeeting-221230140335-73c09bbb/85/Final_12th_NPC_Minutes_of_the_Meeting-pdf-16-320.jpg)
![with threshold of 1000 MW (and above) installed capacity in the region on rotational basis.
The participation of such generators would be limited to technical and operational issues.
Deliberations & decisions in the meeting
15.4. ERPC briefed the agenda to the Committee.
15.5. MS, NPC informed that SRPC had sent their recommendation to consider membership of
two RE generators with threshold of 1000 MW (and above) installed capacity in the region
on the rotational basis. The participation of such generator would be limited to technical and
operational issues.
15.6. Chairperson, CEA/NPC suggested that all RPCs may share their views to NPC Secretariat.
The views of all RPCs may be analysed and a holistic recommendation may be prepared by
NPC Secretariat for approval.
[Action-All RPCs and NPC Secretariat]
16. The meeting ended with Vote of thanks to the Chair.
*****](https://image.slidesharecdn.com/final12thnpcminutesofthemeeting-221230140335-73c09bbb/85/Final_12th_NPC_Minutes_of_the_Meeting-pdf-17-320.jpg)


![Page 26 of 53
𝑊 = 𝑊
𝑓 + Δ𝑓
𝑓
= 𝑊 1 + 2
Δ𝑓
𝑓
+
Δ𝑓
𝑓
≈ 𝑊 1 + 2
Δ𝑓
𝑓
𝑑
𝑑𝑡
(𝑊 ) = 2
𝑊
𝑓
∗
𝑑
𝑑𝑡
(Δ𝑓)
Substituting the above in eq. (1)
Δ𝑃 − Δ𝑃 = 2 ∗ (Δ𝑓) + 𝐷∆f MW
dividing this equation by the generator rating Pr and by introducing per unit inertia
constant
𝐻 = MW sec/MW (or sec)
∴ Δ𝑃 − Δ𝑃 = ∗ (Δ𝑓) + 𝐷∆f pu MW
The ∆P’ s are now measured in per unit (on base Pr) and D in p.u. MW per Hz.
Typical H values lie in the range 2 – 8 sec. Laplace transformation of the above
equation yields
Δ𝑃 (𝑠) − Δ𝑃 (𝑠) = 𝑠 Δ𝑓(𝑠) + 𝐷∆f (𝑠)
= 𝑠 + 𝐷 Δ𝑓(𝑠)
i.e., Δ𝑓(𝑠) = ∗ Δ𝑃 (𝑠) − Δ𝑃 (𝑠)
Δ𝑓(𝑠) = 𝐺 (𝑠)[Δ𝑃 (𝑠) − Δ𝑃 (𝑠)]
Where 𝐺 (𝑠) = =
( ∗
∗
)
=
Where 𝐾 = & 𝑇 = ∗
The dynamic response, by making a reasonable assumption that the action of speed
governor plus turbine generator is instantaneous compared with rest of the power
system and the effect of the same is introduced in the following equation.
Δ𝑓(𝑠) = −(Δ 𝐿𝑜𝑎𝑑 𝑖𝑛𝑐𝑟𝑒𝑎𝑠𝑒 𝑜𝑟 Δ𝐺𝑒𝑛 𝑙𝑜𝑠𝑠) ∗ ∗ − … (2)
Where “R” is the regulation of the governor.
Δ𝑓(𝑡) = −(Δ 𝐿𝑜𝑎𝑑 𝑖𝑛𝑐𝑟𝑒𝑎𝑠𝑒 𝑜𝑟 ∆𝐺𝑒𝑛 𝑙𝑜𝑠𝑠) ∗ ∗ 1 − 𝑒](https://image.slidesharecdn.com/final12thnpcminutesofthemeeting-221230140335-73c09bbb/85/Final_12th_NPC_Minutes_of_the_Meeting-pdf-188-320.jpg)
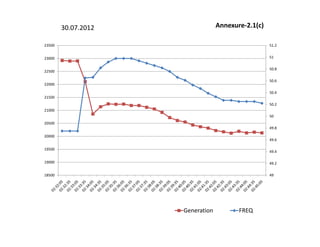
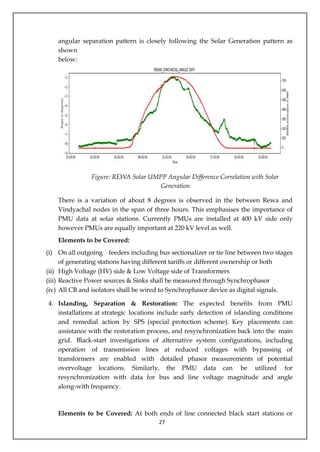
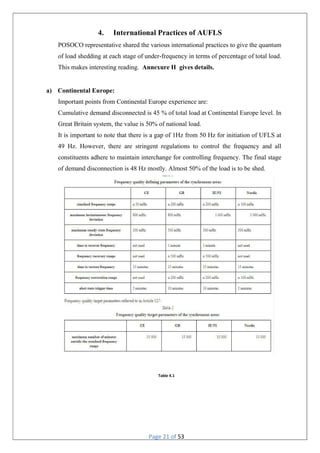
![2. North America: North American Electric Reliability Corporation (NERC) standard PRC-006-
2 — Automatic Underfrequency Load Shedding mentions that “Each Planning
Coordinator shall develop a UFLS program, including notification of and a schedule for
implementation by UFLS entities within its area, that meets the following performance
characteristics in simulations of underfrequency conditions resulting from an imbalance
scenario, where an imbalance = [(load — actual generation output) / (load)], of up to 25
percent within the identified island(s).”
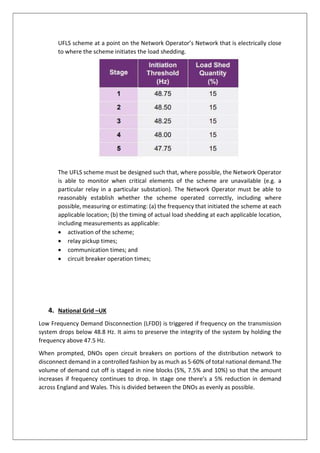
3. Australian Energy Market Operator
The Network Operator must ensure that its UFLS scheme: (a) in aggregate, targets 75% of
the system load available at any time for interruption, where system load is the sum of
generation injection into the SWIS, measured at the generator terminals; (b) has five
stages, each targeting 15% of the system load; and (c) has a relay time delay setting of 0.4
second for each stage with the maximum clearance time minimised. Load allocated to the
UFLS scheme for shedding may also include large individual load connections, where it is
possible to do so, provided that the Network Operator has considered the associated
impacts of losing that individual load.
The Network Operator must ensure that each stage of the UFLS scheme initiates
shedding at the frequencies listed in Table 1, where the frequency is measured by the](https://image.slidesharecdn.com/final12thnpcminutesofthemeeting-221230140335-73c09bbb/85/Final_12th_NPC_Minutes_of_the_Meeting-pdf-242-320.jpg)