1. ABSTRACT
CHARACTERIZATION OF MICROSTRUCTURAL MUTATION EVENTS IN PLASTOMES OF
CHLORIDOID GRASSES (CHLORIDOIDEAE; POACEAE).
Thomas J. Hajek III, M.S.
Department of Biological Sciences
Northern Illinois University, 2015
Melvin R. Duvall, Director
Basis for the study: Complete plastome analysis of grasses belonging to the subfamily
Chlorodoideae was used as a model for identifying microstructural mutations as a means
to produce high-resolution phylogenomic trees. Compared to nucleotide substitutions,
microstructural mutations are not as well understood.
Methods: High-throughput NextGen Illumina and Sanger sequencing methods were used
to obtain chloroplast genomes for nine species (Distichlis spicata, Bouteloua
curtipendula, Hilaria cenchroides, Sporobolus heterolepis, Spartina pectinata, Zoysia
macrantha, Eragrostis minor, Eragrostis tef and Centropodia glauca). An exhaustive
search of these plastomes produced a binary matrix that was used for phylogenomic
analyses.
Key results: Notable contradictions for the hypothesis that indel size is inversely
correlated with frequency were observed. Microstructural mutation results are at odds
with nucleotide sequence phylogenomic results and weaken bootstrap values in
phylogenomic trees.
Conclusions: Plastome-scale analyses produced phylogenies that are congruent with
previous work with relatively strong support values and should be considered the most
2. ii
reliable type of dataset when conducting these analyses. Five bp indels seem to occur or
be retained by the DNA repair complexes with greater frequency than indels of both
larger and smaller size classes across all taxa.
4. ii
ACKNOWLEDGEMENTS
I thank the Plant Molecular Biology Center and the Department of Biological Sciences at
Northern Illinois University for financial support. I also thank Dr. M.R. Duvall for allowing me to work
in his laboratory and being a mentor. I also thank Dr. Thomas Sims and Dr. Joel Stafstrom, both faculty
members of Northern Illinois University and graduate committee members, for help with this thesis
project. I would also like to thank Mr. William P. Wysocki and Mr. Sean V. Burke for their assistance.
5. iii
DEDICATION
I would like to dedicate this thesis to:
My father, Thomas J. Hajek II, wife Diana Hajek, and my children Niels Hajek, Torin Hajek,
Jessica Hajek and James Hajek
6. iv
TABLE OF CONTENTS
Page
LIST OF TABLES ………………………………………………………………… vi
LIST OF FIGURES ……………………………………………………………….... viii
LIST OF ABBREVIATIONS …………………………………………….……….... x
Chapter
1. INTRODUCTION……………………………………………………………..…… 1
2. MATERIALS AND METHODS………………………………………………….. 6
DNA Sampling……………………………………………………….…….... 6
Amplification ……………………………………………..……………….. 7
Primer Design……………………………………………..…….…………. 8
Sanger Sequencing and Assembly……………………………….…....…..... 10
Library Preparation, NextGen Sequencing, and QualityControl...................... 10
NGS Plastome Assembly, Annotation and Alignment…………….….…..... 11
MME Scoring and Analyses......................................................................... 12
Phylogenomic Analyses (ML, MP and BI)................................................... 13
3. RESULTS …………………..…………………………………………………… 15
7. v
Plastome Assembly, Annotation, and Alignment…………………………. 14
Plastome Characterization …………………………………………..……. 14
Microstructural Mutation Scoring Analyses................................................... 19
Small Inversions………………………………………..………… 28
Indels in CDS...........……………………………….……………. 28
CDS Specific Inversions........................................................... 30
Phylogenomic Analyses………………………….……………………….. 33
4. DISCUSSION AND CONCLUSIONS…………………………………………. 44
Microstructural mutation analysis…………………………………….…… 44
Indel Analysis.................................................................................... 44
Small Inversions................................................................................. 45
Indels in CDS...................................................................................... 46
CDS-Specific Inversions...................................................................... 46
Phylogenomic Analysis…………………………………….………………... 47
Conclusion……………………………………….………………………… 50
LITERATURE CITED…............................................................................................ 52
SUPPLIMENTAL FIGURES………………………………………………………. 56
8. vi
LIST OF TABLES
Table Page
1 List of Species in the Multiple Alignment and their Genbank Accession
Numbers………………….……………………………………………… 6
2 Species-Specific Primers Designed for Eragrostis tef that Successfully
Produced Amplicons.............................................................................. 9
3 Plastome Characteristics of Each Species Including Lengths
of their SSC, LSC, and IR Regions as well as %AT Richness.............. 16
4 Dataset [1] Multiple Alignment Statistics............................................. 17
5 Dataset [3] Multiple Alignment Statistics.............................................. 18
6 Dataset [4] Multiple Alignment Statistics............................................... 19
7 Frequency of Indels Categorized as Slipped-Strand Mispairing
Mechanism........................................................................................... 20
8 Frequency of Non-Tandem Repeat Indels............................................... 22
9 Sum of Tables 4 and 5………………..……………………………… 25
10 Inversion Size Class Frequency………………………………………. 28
9. vii
Table Page
11 Indels Found in CDS............................................................................. 29
12 Characteristics of the Two-Base Inversion Found in the matK
Sequence……………………………………………………………… 31
13 Characteristics of the Three-Base Inversion Found in the matK
Sequence ……………………………………………………………… 32
14 Characteristics of the Two-Base Inversion Found in the ndhF
Sequence ……………………………………………………………… 32
15 Characteristics of the Three-Base Inversion Found in the ccsA
Sequence ……………………………………………………………… 33
16 Results from Maximum Parsimony Analyses……………………….. 35
10. viii
LIST OF FIGURES
Figure Page
1 Indels that were identified to be a result of slipped-strand mispairing........ 22
2 Indels that were characterized as non-tandem repeat.................................. 24
3 Sum of all SSM and non-tandem repeat indels............................................. 27
4 Frequency of inversions by size class......................................................... 29
5 Maximum likelihood phylogram for dataset [1] with substitutions per site
(SPS) and Maximum parsimony number of changes (MPC) listed on each
branch (SPS | MPC).............................................................................. 36
6 ML phylogram for dataset [2] with substitutions per site (SPS) and
maximum parsimony number of changes (MPC) listed on each branch
(SPS | MPC)……………………............................................................... 37
7 ML phylogram for dataset [1-2]............................................................... 39
8 MP tree for dataset [1-2]................................................................................. 40
11. ix
Figure Page
9 Maximum likelihood tree for dataset [3] with substitutions per site (SPS)
and maximum parsimony number of changes (MPC) listed on each branch
(SPS | MPC).......................................................................................... 41
10 Maximum likelihood tree for dataset [4] with substitutions per site (SPS)
and maximum parsimony number of changes (MPC) listed on each branch
(SPS | MPC)……………………………………………………………….. 43
S1 MP branch and bound phylogram for dataset [1]………………………….. 56
S2 MP phylogram from dataset [2] binary matrix……………………………. 57
S3 MP tree generated from dataset [3] coding sequence matrix……………… 58
S4 MP tree from dataset [4] of all noncoding sequence………………………… 59
12. x
LIST OF ABBREVIATIONS
AA Amino acid
ACRE Anchored conserved region extension
BEAST Bayesian evolutionary analysis sampling trees
BEP Bambusoideae Ehrhartoideae Pooideae
bp Base pair
BV Bootstrap support value
CDS Coding sequence
CI Consistency index
CIPRES Cyber infrastructure for phylogenetic RESearch
GPWGI (II) Grass phylogeny working group I (II)
Indel Insertion/deletion
IR Inverted repeat
LSC Long single copy
MAFFT Multiple alignment using fast Fourier transform
MCMC Markov chain Monte Carlo
13. xi
ML Maximum likelihood
MLBV Maximum likelihood bootstrap value
MME Microstructural mutation event
MP Maximum parsimony
MPBV Maximum parsimony bootstrap value
MPC Maximum parsimony number of changes
NGS Next generation sequencing
NS Nucleotide sequence
PAUP* Phylogenetic analysis using parsimony * and other methods
PACMAD Panicoideae Arundinoideae Chloridoideae Micrairoideae Arundinoideae
Danthonioideae
RI Retention index
SSC Short single copy
SPS Substitutions per site
SSM Slipped-strand mispairing
XSEDE eXtreme science and engineering discovery environment
14. 1
CHAPTER 1
INTRODUCTION
Next generation Illumina sequencing (NGS) has revolutionized the way in which
molecular plant biologists and bioinformaticists are able to sequence complete genomes. The
expeditious turnover rate of data accumulated from NGS gives us the ability to study molecular
relationships in greater depth and find novel ways to use this wealth of information. We are now
able to rapidly sequence entire genomes in a way that minimizes time and cost factors.
Contemporary software is able to analyze the significant amount of data produced from this
sequencing method and accomplish in days what until recently took months or years to
achieve. In this research, complete chloroplast genomes (plastomes) sequenced with NGS
methods were fully analyzed to study relationships among selected species of the grass family
(Poaceae).
The most economically important of all plant families are grasses. The domesticated
types of grasses are commonly known as cereals. Cereals such as rice, corn, and wheat provide
more than half of human calorie intake (Raven & Johnson, 1995) and account for over 70% of all
crops grown for human and livestock consumption. Fossil records suggest that ancestors of rice
and bamboo, which are members of the grass family, began to diversify as early as 107 – 129
Mya (Prasad et al., 2011). Grasses have radiated into 11,000 accepted species (Strömberg,
2011), are the fifth largest plant family (Stevens, 2012), and dominate over 40% of the land area
on earth (Gibson, 2009). The size and complexity of the grass family has led to a taxonomic
15. 2
organization that now includes 12 subgroups or subfamilies of grasses (GPWG II, 2012). It is
important that we understand evolutionary relationships of grasses at a molecular level so that
scientists will be able to use this knowledge to manage ecosystems, bio-engineer species that are
resistant to plant pathogens, and also to produce high-yielding commercial crops.
All of the species used for this study belong to a subfamily of grasses known as
Chloridoideae, which are a monophyletic subfamily of graminoids comprised of 1420 known
species that share specific evolutionary adaptations such as C4 photosynthesis (Peterson et al.,
2010). Chloridoid species used for my research have many uses for both human and animal
consumption. Eragrostis tef has a taste profile which is similar to millet and quinoa and is high in
dietary fiber and iron and provides protein and calcium (El-Alfy et al., 2012). Bouteloua
curtipendula has been defined as being an exceptional foraging grass for livestock at medium to
low altitudes (Gould and Shaw, 1983). Livestock graze on Spartina pectinata when it is young
(Walkup, 1991). Distichlis spicata remains green when most other grasses are dry during
drought and is grazed by both cattle and horses and it is resistant to trampling (USDA Plants
Database, Plant Profile, 2010). Zoysia macrantha is grazed upon by marsupials from the
southern parts of Australia and can thrive in soil conditions where pH can vary from acidic to
mildly alkaline (Loch et al., 2005). The other grasses in this study may have adaptive
capabilities and economical viabilities that have yet to be discovered.
The chloridoid subfamily belongs to the Panicoideae, Arundinoideae, Chloridoideae,
Micrairoideae, Aristidoideae and Danthonioideae (PACMAD) clade. A high proportion of
16. 3
species belonging to the PACMAD clade exhibit the C4 photosynthetic pathway, which is an
efficient means of carbon fixation in arid climates (GPWG II, 2012). C4 plants have a
competitive advantage over plants possessing the more common C3 carbon fixation pathway
under conditions of drought, high temperatures, and nitrogen or CO2 limitation (Sage and
Monson, 1998). Since C4 is a more efficient means of carbon fixation, it would be beneficial to
engineer this ability into species that exhibit C3 mechanisms when facing climate changes.
Detailed understanding of evolutionary relationships among C4 grasses would provide
fundamental knowledge useful to scientists involved in the bioengineering of grasses.
A previous phylogenetic study published by Peterson et al. (2010) included only six
plastid DNA sequences and one ITS DNA sequence to infer evolutionary relationships among
chloridoid grasses. That limited molecular sampling was probably a result of the cost/time
inefficiencies of older methods such as Sanger sequencing. Now that we can have a complete
dataset of chloroplast genomes in a relatively short amount of time, we are able to develop deep
analytical understanding of the entire genome. In this study I have analyzed types of mutations
besides substitution mutations that may be able to predict and define genomic relationships
among species.
Microstructural mutation events (MMEs) such as slipped-strand mispairing induced
insertion-deletion (indel) mutations, and inversions can now be explored at the scale of the
plastome to help describe ancestral descent. We can see how these mutation events are shared
among closely related species. By scoring these events using a binary matrix and analyzing it
17. 4
together with nucleotide sequences, bootstrap support values (BV) could be increased or
polytomies on phylogenetic/phylogenomic trees could potentially be resolved.
MMEs such as slipped-strand mispairings occur during the replication of DNA during the
S-phase of interphase and may also occur in nonreplicating DNA (Levinson and Gutman, 1987).
Repeated sequences at tandem loci are able to form a loop structure that can be either excised by
DNA repair mechanisms resulting in a deletion or sequence duplication can occur resulting in the
formation of inserted repeats. Other MMEs such as inversions occur when complementary DNA
strands create a secondary stem-loop conformation that allows recombination in the stem to
invert the nucleotides that reside in the loop region of the structure.
Leseberg and Duvall (2009) postulated that plastome-scale MMEs are a potentially
valuable, underutilized resource that can be used for supporting relationships among genera. For
their analysis, three criteria for scoring indels produced a binary matrix that was concatenated
onto a NS matrix for maximum parsimony (MP) analysis including 78 indels and six inversions.
This was used to resolve relationships between subfamilies within the BEP clade and
Andropogoneae.
The plastome has been shown to be a useful tool when studying evolutionary
relationships in the grasses due to their relatively short length (from 133865 to 137619 bp for B.
curtipendula and D. spicata respectively in Chloridoideae), the amount of highly conserved
Coding Sequence (CDS) and the large number of chloroplasts within leaf cells, which average
50-155 per cell (Boffey and Leech, 1982). High-copy chloroplast DNA is well represented in
18. 5
NGS genome skimming data. Burke et al. (2012) utilized entire plastomes to describe
divergence estimates for selected species of New World bamboos. Shortly after that, Burke et al.
(2014) used plastome scale datasets to correlate paleoclimatic events with divergence estimates
for species of Arundinaria.
The analysis described here has also utilized plastome-scale datasets derived from
Chloridoideae. The internal relationships of the chloridoids are complex and not completely
understood. At this writing there is only one published complete plastome from a chloridoid
(Neyraudia reynaudiana; GenBank accession NC_024262.1). The MME data obtained in this
research will aid in determining on a fine scale the exact relationships between all of the major
subgroups of chloridoid grasses.
The following specific hypotheses were tested in this study: 1) Of the two types of
MMEs, indels occur more frequently than inversions. 2) Tandem repeat indels, i.e. those indels
occurring in regions of tandemly repeated sequences, occur with greater frequency than indels
not associated with such repeats. 3) MMEs that affect fewer nucleotides (shorter indels, smaller
inversions) occur with greater frequency than larger MMEs. 4) Plastome-scale MMEs are an
effective source of data for the inference of high-resolution, highly supported phylogenies
consistent with the inference from nucleotide substitutions.
19. 6
CHAPTER 2
MATERIALS AND METHODS
DNA Sampling
Silica dried leaf tissue was obtained for nine species of chloridoid grasses (Table 1). Leaf
tissues from sample species were homogenized in liquid nitrogen. DNA extraction was
performed using Qiagen DNeasy Plant Mini Kits (Qiagen Inc., Valencia, CA) following the
manufacturer's protocol.
Table 1
List of Species in the Multiple Plastome Alignment and their Genbank Accession Numbers
Species GenBank # Tribe
Centripodia glauca KT168383 Centropodeae
Bouteloua curtipedula KT168386 Cynodonteae
Distichlis spicata KT168395 Cynodonteae
Hilaria cenchroides KT168387 Cynodonteae
Eragrostis minor KT168384 Eragrostideae
Eragrostis tef KT168385 Eragrostideae
Neyraudia reynaudiana NC_024262.1 Triraphideae
Sporobolus heterolepis KT168389 Zoysieae
Spartina pectinata KT168388 Zoysieae
Zoysia macrantha KT168390 Zoysieae
20. 7
To represent major tribes in the subfamily, the plastomes for three species of
Cynodonteae (Bouteloua curtipedula, Distichlis spicata, and Hilaria cenchroides), one species
of Eragrostideae (Eragrostis minor), three species of Zoysieae (Sporobolus heterolepis, Spartina
pectinata and Zoysia macrantha) and one species of Centropodieae (Centripodia glauca) were
completely assembled using NextGen Illumina sequencing methods and have been annotated
(see below). Additionally, Eragrostis tef and one previously published species of Triraphideae
(Neyraudia reynaudiana) were included in the study.
In previous studies, C. glauca was found to be sister to other Chloridoideae (e.g.,
Peterson et al. 2010). The plastome for C. glauca was used here as an outgroup to suggest the
ancestral state for microstructural mutations within Chloridoideae.
Amplification
The complete chloroplast genome for Eragrostis tef and a rough-draft genome of
Neyraudia reynaudiana were sequenced using primers designed by Leseburg and Duvall (2009)
for the single-copy regions and the IR repeat primers and methods for chloroplast DNA
amplification and sequencing that were designed by Dhingra and Folta (2005).
Polymerase chain reactions (PCR) were performed on target regions in 50 μl reactions
consisting of 1.5 μl forward and reverse primers at 10 pmoles/μl, 1.5 μl DNA template, 0.4 μl
dNTP's (25 mM each), 5.0 μl 10x buffer, and 0.5 μl PFU Turbo DNA Polymerase (Strategen Inc,
Carlsbad, CA, USA). A GeneAmp ® PCR System 2700 was used for DNA amplification using
a touchdown program (Dhingra and Folta, 2005) with the following parameters: 94 ºC for 4.0
21. 8
min with 10 cycles PCR touchdown (55 ºC to 50 ºC with 0.5 ºC reduction in each cycle) at 40
seconds each to assure primer specificity would not preclude DNA amplification. Following this
were 35 cycles at: 94 °C for 40 sec each, 50 °C for 40 sec, then 72 °C for 3.0 min with a final
extension time of 7.0 min at 72 °C. Negative controls were also used to monitor contamination
of PCR reactions.
When amplifications failed, custom primers were designed from flanking sequence (see
below). In these cases, a standard thermal cycling program without touchdown was used. The
parameters for this program are as follows: 94 °C for 4.0 min; 40 cycles at 94 °C for 40 sec
each, 50 °C for 40 sec, then 72 °C for 3.0 min with a final extension time of 7.0 min at 72 °C.
Agarose electrophoresis was used to verify the size and number of amplified DNA
fragments. Successfully amplified single DNA fragments of the expected size were purified
(Wizard SV PCR Clean-up System, Promega Corp., Madison, WI, USA) before they were
exported to Macrogen, Inc., (Seoul, Korea) for DNA capillary Sanger sequencing.
Primer Design
Conserved sequences from the flanking regions were selected when the following criteria
were satisfied. Geneious Pro 5.5.6 (Biomatters Ltd, Aukland, NZ) software initially was used to
generate a list of potential primer sequences. Designed primers (Table 2) had several
characteristics: lengths of at least 25 bp; a 3’ base with a G or C anchor; minimum GC content of
50%; minimum melting temperature of 50 °C; ΔG of stem-loop structures > -6.0; ΔG of self-
dimer > -6.0; and ΔG of heterodimer > -6.0. The ΔG values were obtained with the
22. 9
Oligoanalyzer web tool (www.idtdna.com/site). If the primers generated by Geneious Pro failed
to meet target criteria, the sequence was manually searched until a priming sequence with the
required parameters was found.
Table 2
Species-Specific Primers Designed for Eragrostis tef that Successfully Produced Amplicons
Primer
Name
Sequence
#
bp
%GC
TM
(°C)
hairpin
(ΔG)
Self-
dimer
(ΔG)
Hetero-
dimer
(ΔG)
113FCHL-1 CTACCAAACTGCTCTACTCCGCTCT 27 44.4% 58.7 0.23 -3.61 -5.48
113RCHL-1 CCAACTGCTCACTTTTCTCCGTAGATT 25 52.0% 59.8 0.08 -3.61 -5.48
118FCHL-1 CACACCACTTCCATTTTGTAGTTCC 25 44.0% 56.3 0.81 -3.3 -3.07
120FCHL-1 GGATTTGCAGTCCCCTGCCTTACCG 25 60.0% 63.7 -2.38 -7.05 -4.64
12FCHL-1 GCCTTGAAGAGGACTCGAACCTCCA 25 56.0% 62.1 -2.03 -6.76 -4.64
12RCHL-1 CCTCTTTTCGACTCTGACTCCCCCA 25 56.0% 61.7 1.13 -6.76 -9.79
142FCHL-2 GATGGGTTGTAATTGTATGGCGGTATC 27 44.4% 57.6 1.52 -5.36 -6.36
153RCHL-1 GTTCAGTCCGATTCAGGTGCCAATTC 25 50.0% 59.9 0.05 -5.36 -4.41
156FCHL-1 GTTCGGGTAGGCTATCTAATTCTC 25 45.8% 54.4 0.08 -5.36 -4.65
156RCHL-1 GGAAAGTAGAGTAGGCAAAGATCC 24 45.8% 54.8 1.02 -4.64 -4.65
166FCHL-1 CGTTCTCCCGTGCTTCCAGACATGC 25 60.0% 63.7 0.25 -5.38 -6.91
17FCHL-1 CTCGGTATCAATCCCCTTGCCCCTC 25 60.0% 62.8 -0.17 -3.9 -6.68
29FCHLa CCGATATTCCATTATCCCTTACTCC 25 44.0% 54.5 0.27 -4.01 -7.74
41FCHL-3 CTGGTGCATTTACCGTTATTGCTTCTG 27 44.0% 58.4 -1 -7.05 -4.41
41RCHL-2 CTCCTCCTTCATATTGACCTTTTC 24 41.7% 53.2 0.63 -3.91 -4.41
42FCHL-1 GCTAGGTCTAGAGGGAAGTTGTGAG 25 52.0% 58 -1.07 -7.31 -4.41
23. 10
Sanger Sequencing and Assembly
Quality of sequences was evaluated by inspection of the electropherograms for peak height
and background noise. DNA sequences were assembled utilizing Geneious Pro 5.5.6
(Biomatters Ltd, Aukland, NZ). Forward and reverse Sanger sequences from Macrogen were
pairwise aligned against each other and ambiguities at 5’ and 3’ ends of the sequence were
removed. The alignments were then assembled into contigs that overlapped with a minimum of
15 bp, but generally ranged from 40-200 bp of overlap. Contigs that were formed ranged from
≈10,000-74,000 bp in length.
Contigs of Neyraudia reynaudiana (GenBank accession NC_024262.1) that were
generated from Sanger capillary and NextGen sequencing were reference aligned to each other to
check for accuracy. The completely assembled plastome was annotated at a 70% minimum
similarity threshhold using Panicum virgatum (GenBank accession HQ731441) as an annotation
reference.
Library Preparation, NGS Sequencing, and Quality Control
A minimum of 1.0 μg of DNA extractions for Distichlis spicata and Hilaria cenchroides
were measured using the Qubit ™ flourometer (Life Technologies, Grand Island, NY, USA).
After being diluted to 2 ng/μl, the DNA was sonicated at the University of Missouri using a
Bioruptor® sonicator (Diagenode, Denville, NJ, USA), which cut it into approximately 300 bp
fragments. Libraries were prepared using the TruSeq low-throughput protocol (gel method)
following the manufacturer's protocol (Illumina, San Diego, CA, USA).
24. 11
DNA extracts for Bouteloua curtipendula, Spartina pectinata, Sporobolus heterolepis,
Eragrostis minor, Zoysia macrantha, and Centropodia glauca were diluted to 2.5 ng/ul in 20 ul
water. This method was used when initial DNA quantities were below 1μg. Libraries were
prepared and purified using the Nextera Illumina library preparation kit (Illumina, San Diego,
CA, USA) and the DNA Clean and Concentrator Kit (Zymo Research, Irvine, CA, USA)
following the manufacture protocols.
Both types of libraries were submitted to the DNA core facility (Iowa State University,
Ames, IA, USA) for bio-analysis and HiSeq 2000 next generation sequence determination using
single reads (Illumina, San Diego, CA, USA). Single-reads were quality filtered using
DynamicTrim v2.1 from the SolexaQA software package using the default settings (Cox et al.,
2010). Sequences less than 25 bp in length (default setting) were removed with LengthSort v2.1
in the same package.
NGS Plastome Assembly, Annotation, and Alignment
Plastome assembly was performed with entirely de novo methods. The Velvet software
package was run iteratively following methods from Wysocki et al. (2014). Contigs were
scaffolded using the anchored conserved region extension (ACRE) method. Sequence overlap
for gaps in the plastomes that were not resolved using ACRE were determined by matching
sequences from the flanking contigs to the reads produced by NGS to complete the plastid
genome.
25. 12
Assembled plastomes were aligned to Neyraudia reynaudiana (GenBank accession
NC_024262.1) using the MAFFT plugin in Geneious Pro (Biomatters Ltd., Auckland, NZ) and
annotations that shared a minimum of 70% similarity were transferred to the assembled
plastomes.
MME Scoring and Analyses
Manual adjustments of the alignment were performed to preserve tandem and dispersed
repeat boundaries. The sequence alignment was systematically and exhaustively searched for
shared microstructural mutation events by manually scanning the alignment in Geneious Pro for
indels and inversions. Autapomorphic MMEs were also scored and included in the matrix. The
three specific types of events that were analyzed for this study included insertions and deletions
≥ 3 bp in length (to minimize artifacts of the sequencing methods) and inversions ≥ 2 bp.
Each sequence in the alignment was thoroughly examined for indels and a binary matrix
system developed for scoring indels where (0) = the ancestral condition, (1) = indel that is ≥ 3
bp, and (?) = denotes that it was not able to be determined whether or not a mutation event
occurred at that point of the alignment for a given species.
Inversions were scored such that (0) = shared event with ancestral condition (in C.
glauca), (1) = event not shared with ancestral condition, and (?) = ambiguous.
Frequencies of MME size classes were calculated to test the hypothesis that shorter
indels and inversions occur with higher frequencies than longer ones. The regions in which
26. 13
microstructural mutations occur were classified as coding or noncoding and frequencies were
ascertained between these two partitions.
Phylogenomic Analyses (ML, MP and BI)
The ten chloridoid complete plastomes were aligned using the Geneious Pro MAFFT
plugin (Katoh et al., 2005). Gaps introduced by the alignment process and one inverted repeat
region (IRa) were removed prior to phylogenomic analyses. Gapped regions were removed to
eliminate ambiguities. The IRa was removed to prevent overrepresentation of the inverted repeat
sequence. The resulting alignment was 104,284 bp. Binary coded data were concatenated for a
total evidence analysis. The MME data added 605 characters to the sequence matrix. jModelTest
2 (Darriba et. al, 2012; Guindon and Gascuel, 2003) analysis was performed before phylogenetic
analyses to find the optimal model of nucleotide substitution.
Five maximum-likelihood (ML) analyses were performed in RAxML-HPC2 on XSEDE
(Stamatakis, 2014) that was accessed using the CIPRES science gateway (Miller et al., 2010) to
find ML trees. For nucleotide sequences alone, the GTRCAT model was specified. For analysis
of the binary data, the BINCAT model was used. The combined data matrix was partitioned using
the two models for their respective partitions. In each case, 1,000 bootstrap (BS) iterations
produced trees used as input for the Consense tool available in the PHYLIP software package
(Felsenstein, 2005) on CIPRES. C. glauca was specified as the outgroup for all ML analyses.
Phylogenomic trees were visualized and edited using FigTree v1.4.0 (Rambaut, 2014).
27. 14
Five branch and bound maximum parsimony (MP) analyses were performed using PAUP*
v4.0b10 (Swofford, 2003) to obtain the most parsimonious trees. MP branch and bound bootstrap
analyses were performed using 1,000 replicates in each case. C. glauca was specified as the
outgroup for all MP analyses.
Five Bayesian inference (BI) analyses were performed using MrBayes 3.2.2 on XSEDE
(Ronquist et al., 2012), which was accessed using the CIPRES science gateway. All five analyses
used two Markov chain Monte Carlo (MCMC) analyses at 20,000,000 generations each. The
model for among-site rate conversion was set to invariant gamma and the fraction of sampled
values discarded at burn-in was set at 0.25 to generate 50% majority rule consensus trees.
28. 15
CHAPTER 3
RESULTS
Plastome Assembly, Annotation, and Alignment
Completely assembled and annotated plastomes were submitted to GenBank and the
accession numbers for the plastomes analyzed in this thesis are listed in Table 1. This represents
1,216,882 bases of new plastid sequence added to the GenBank database.
Plastome Characterization
The nine unpublished plastomes in this study share a general organization of the highly
conserved gene content and gene order that are consistent with the grass plastome. Their sizes
range from 133,865 to 137,619 bp in length (B. curtipendula and D. spicata, respectively).
Large single-copy regions (LSC) have a range of 79,309 to 82,488 bp (B. curtipendula and D.
spicata), short single-copy regions (SSC) from 12,606 to 12,679 (H. cenchroides and S.
heterolepis), and inverted repeat regions (IR) from 20,975 to 21,226 bp (B. curtipedula and D.
spicata). The AT content of all nine species ranges from 61.5 to 62.6% (Table 3). The
plastome of D. spicata has a large insertion of 3,137 bp (Duvall et al., unpublished) that together
with smaller insertions makes the plastome of this species the largest in the alignment. When
this inserted sequence is subjected to a BLASTn search, it indicates little sequence identity
shared with other grass species that have had complete plastomes sequenced.
The multiple alignment of nine chloridoids against Centropodia glauca is 123,074 bp
including gaps introduced by the alignment, but only one inverted repeat sequence. Identical
29. 16
sites in this alignment are 94,855 (77.1%) with pairwise identity of 92.7%. The alignment was
stripped of all sites in which there were gaps introduced by the alignment and resolved to a total
alignment length of 104,601 bp with 94,849 (90.7%) identical sites and a pairwise identity of
97.3% (Table 4). The multiple alignment of all CDS against Centropodia glauca is 63,197 bp in
length including gaps introduced by the alignment. Identical sites in this alignment are 58,199
(92.1%) with pairwise identity of 97.7%. The alignment was stripped of all sites in which there
were gaps introduced by the alignment and resolved to a total alignment length of 62,486 bp with
58,199 (93.1%) identical sites and a pairwise identity of 98.1% (Table 5).
Table 3
Lengths of Regions and Subregions in bp and Base Compositions for Ten Chloridoid Plastomes
Species LSC IrB IrA SSC Total % AT
B. curtipedula 79309 20975 20975 12606 133865 61.8
E. tef 79802 21026 21026 12581 134435 61.6
C. glauca 80074 21012 21012 12467 134565 61.5
H. cenchroides 80238 21082 21082 12419 134821 61.7
E. minor 80316 21065 21065 12577 135023 61.8
S. heterolepis 80614 21028 21028 12692 135097 61.6
N. reynaudiana 81213 20570 20570 12744 135362 61.7
S. pecinata 80922 20985 20985 12720 135612 62.6
Z. macrantha 81351 20961 20961 12572 135845 61.6
D. spicata 82488 21226 21226 12679 137619 61.7
31. 18
Table 5
Aligned Coding Sequence Characteristics
The multiple alignment of all nine species that includes all noncoding sequences against
Centropodia glauca is 123,036 bp including gaps introduced by the alignment. Identical sites in
this alignment are 35,745 (58.8%) with pairwise identity of 85.8%. The alignment was stripped
of all sites in which there were gaps introduced by the alignment and resolved to a total
alignment length of 41,012 bp with 35,740 (87.1%) identical sites and a pairwise identity of
96.3% (Table 6).
CDS nonstripped alignment CDS stripped alignment
Length: 63,197 Length: 62,486
Identical Sites: 58,199 (92.1%) Identical Sites: 58,199 (93.1%)
Pairwise % Identity: 97.7% Pairwise % Identity: 98.1%
Ungapped lengths of 10 sequences: Ungapped lengths of 10 sequences:
Mean: 62788.7 Std Dev: 67.8 Mean: 62486.0 Std Dev: 0.0
Minimum: 62674 Maximum: 62940 Minimum: 62486 Maximum: 62486
Freq % of non-gaps Freq % of non-gaps
A: 189,615 30.2% A: 188,456 30.2%
C: 124,451 19.8% C: 123,919 19.8%
G: 130,898 20.8% G: 130,353 20.9%
T: 182,923 29.1% T: 182,132 29.1%
GC: 255,349 40.4% GC: 254,272 40.7%
32. 19
Table 6
Aligned Noncoding Region Characteristics
No CDS nonstripped alignment No CDS stripped alignment
Length: 123,036 Length: 41,012
Identical Sites: 35,745 (58.8%) Identical Sites: 35,740 (87.1%)
Pairwise % Identity: 85.8% Pairwise % Identity: 96.3%
Ungapped lengths of 10 sequences: Ungapped lengths of 10 sequences:
Mean: 50985.7 Std Dev: 1215.8 Mean: 41012.0 Std Dev: 0.0
Minimum: 49506 Maximum: 53982 Minimum: 41012 Maximum: 41012
Freq % of non-gaps Freq % of non-gaps
A: 167,799 32.9% A: 132,807 32.4%
C: 85,104 16.7% C: 70,407 17.2%
G: 84,346 16.5% G: 69,562 17.0%
T: 172,605 33.9% T: 137,342 33.5%
GC: 169,450 13.8% GC: 139,969 34.1%
Microstructural Mutation Scoring and Analysis
Each sequence in the non-gapped alignment was exhaustively searched for
microstructural mutation events and a binary matrix system for scoring indels and inversions was
constructed where (0) = the ancestral condition (as seen in C. glauca), (1) = indel that is ≥ 3 bp,
and (?) = denotes an ambiguous.
Indels that were identified as tandem repeat indels likely to be a result of slipped-strand
mispairing (SSM) events were scored using the methods described above. SSM event types
range from 58 to 95 occurrences for N. reynaudiana and B. curtipedula, respectively. The
lengths of scored SSM’s range from 3 bp (the lower limit set to minimize artifacts) to a 120 bp
33. 20
insertion found in E. tef. The frequency of SSM events for each species is quantified (Table 7).
The distribution of event sizes are graphically represented (Fig. 1), which shows that the
occurrence of 5 bp indels are considerably higher than the number of indels of any other size
class for all nine ingroup species. The frequency of indels that are larger than 10 bp drops to
only one or two events per species with the exception of H. cenchroides, in which three 22 bp
events were identified.
When the mutational mechanism of an indel could not be clearly attributed directly to
slipped-strand mispairing (e.g., the absence of tandem repeats in adjacent sequence of any
species in the alignment), they were scored separately for each species and are listed in Table 8.
Indels described in this fashion have frequencies that range from 74 events in N. reynaudiana to
110 in H. cenchroides and their reported sizes range from 3 bp to a 433 bp deletion that is shared
by all nine ingroup species. The distribution of events by size classes are graphically represented
(Fig. 2) and shows that a substantial number of indels for all nine ingroup species also appear to
be 5 bp. The frequency of indels in size classes that are ≥ 19 bp is reduced to only one or two
occurrences per species.
Table 7
Number of Bases in Slipped-Strand Mispairing Event and Occurrences Per Species
Length
(bp) D.s. B.c. H.c. S.h. S.p. Z.m. E.t. E.m. N.r.
3 5 6 4 5 6 7 4 4 4
(continued on following page)
41. 28
Small Inversions
Small inversions present in the alignment were scored using a binary matrix. Inversion
size class frequencies are represented in Table 10 and are shown graphically in Figure 4. The
inversion size class that is most common is three bp; the range is from two to nine bp.
Indels in CDS
Although most MMEs were found in noncoding sequences, a number of indels were
identified in coding sequences altering the amino acid sequence and overall length of exons. Ten
coding sequences with indels were: rpoB, rps14, rps18, clpP, rpoC1, rpoC2, matK, ycf68, ndhF
and ccsA. The size classes of these indels range from 1 to 78 bp with a majority of them
belonging to the 3, 6 and 9 bp categories (Table 11). All size classes are multiples of
Table 10
Inversion Size Frequency
Length
(bp) D.s. B.c. H.c. S.h. S.p. Z.m. E.t. E.m. N.r.
2 2 3 1 3 2 3 1 1 1
3 6 6 7 5 4 2 4 4 2
4 0 1 1 0 0 0 0 0 0
5 2 2 2 2 2 2 2 2 1
6 0 1 1 1 1 1 0 0 0
7 1 1 1 1 1 1 1 1 1
9 1 2 1 1 1 0 1 1 1
Σ 12 16 14 13 11 9 9 9 6
Table 10 Legend: D.s. = Distichlis spicata, B.c. = Bouteloua curtipemdula, H.c. = Hilaria
cenchroides, S.h. = Sporobolus heterolepis, S.p. = Spartina pectinata, Z.m. = Zoysia macrantha,
E.t. = Eragrostis tef, E.m. = Eragrostis minor and N.r. = Neyraudia reynaudiana.
43. 30
Table 11 (continued)
78 1 0 0 0 0 0 0 0 0
Σ 8 7 4 2 3 5 10 6 5
Table 11 Legend: D.s. = Distichlis spicata, B.c. = Bouteloua curtipemdula, H.c. = Hilaria
cenchroides, S.h. = Sporobolus heterolepis, S.p. = Spartina pectinata, Z.m. = Zoysia macrantha,
E.t. = Eragrostis tef, E.m. = Eragrostis minor and N.r. = Neyraudia reynaudiana.
three with the exception of three separate one-base insertions that were found only in the rpoB
locus of E. tef. The frequency of indels found in coding sequence is low relative to their rate of
occurrence in noncoding regions, more specifically the LSC regions. A total of 581 indels were
identified in the multi-alignment analysis of which 30 have been identified as specifically
occurring in exonic sequence making the percentage of indels that occur in CDS 5.2% of the
total.
CDS Specific Inversions
Four inversions of 2 or 3 bp were located in the coding regions of matK, ndhF and ccsA,
which altered the amino acid (AA) sequences in those loci. The first inversion that was
identified in the CDS of matK (Table 12) shows that E. minor, E. tef, N. reynaudiana and S.
pectinata share the ancestral condition with the outgroup. Amino acid side chain properties from
5’→ 3’ near the inversion site changed from positively charged lysine and nonpolar leucine to
polar glutamine and aromatic phenylalanine.
44. 31
Table 12
Characteristics of the Two-Base Inversion Found in the matK Sequence
Taxa Nucleotide sequence AA sequence
Δ AA
properties
D. spicata TTTCTTTTGAAAAAGAAG KKQFLL P,A
B. curtipedula TTTCTTTTGAAAAAGAAG KKQFLL P,A
H. cenchroides TTTCTTTTGAAAAAGAGG KKQFLP P,A
S. heterolepis TTTCTTTTGAAAAAGAAG KKQFLL P,A
S. pecinata TTTCTTTTTCAAAAGAAG KKKLLL (+), NP
Z. macrantha TTTCTTTTGAAAAAGAAG KKQFLL P,A
E. tef TTTCTTCTTCAAAAGAAG KKKLLL (+), NP
E. minor TTTCTTCTTCAAAAGAAG KKKLLL (+), NP
N. reynaudiana TTTCTTCTTCAAAAGAAG KKKLLL (+), NP
C. glauca TTTCTTCTTCAAAAGAGG KKKLLP (+), NP
The second inversion found in matK (Table 13) shows that Z. macrantha, N. reynaudiana
and S. pectinata share the ancestral condition with C. glauca, with the exception of a substitution
event where a guanine nucleotide was substituted with a cysteine at the 3’ end of the loop-
forming region. These nonsynonymous changes in sequence resulted in an AA property
alteration where positively charged lysine and nonpolar leucine were replaced by polar serine
and aromatic phenylalanine.
A 2 bp inversion was found in ndhF (Table 14) in which D. spicata, H. cenchroides, E.
minor, E. tef and N. reynaudiana share the same AA sequence as the outgroup and the inversion
caused a change in one amino acid where aromatic phenylalanine was converted aromatic
phenylalanine was converted to polar asparagine.
45. 32
Table 13
Characteristics of the Three-Base Inversion Found in the matK Sequence
Taxa Nucleotide sequence AA sequence
Δ AA
properties
D. spicata ATTTTCTTTTGAAAAAAGAAAAAT NEKSFLFI P,A
B. curtipedula ATTTTCTTTTGAAAATAGAAAAAT NEKSFLFI P,A
H. cenchroides ATTTTCTTTTGAAAAAAGAAAAAT NEKSFLFI P,A
S. heterolepis ATTTTCTTTTGAAAAAAGAAAAAT NEKSFLFI P,A
S. pecinata ATTTTCTTTTTTCAAAAGAAAAAT NEKKLLFI (+), NP
Z. macrantha ATTTTCTTTTTTCAAAAGAAAAAT NEKKLLFI (+), NP
E. tef ATTTTCTTTTGAAAAAAGAAAAAT NEKSFLFI P,A
E. minor ATTTTCTTTTGAAAAAAGAAAAAT NEKSFLFI P,A
N. reynaudiana ATTTTCTTTTTTCAAAAGAAAAAT NEKKLLFI (+), NP
C. glauca ATTTTCTTTTTTGAAAAGAAAAAT NEKKFLFI (+), A
Table 14
Characteristics of the Two-Base Inversion Found in ndhF Sequence
Taxa Nucleotide sequence AA sequence
Δ AA
properties
D. spicata ATCCAAAAAGAACTTTTGGGG DLFFKQP A
B. curtipedula ATCAAAAAAGTTCTTTTTTGA DFFNKKS P
H. cenchroides ATCCAAAAATAACTTTTTTTG DLFLKKQ A
S. heterolepis ATGCAAAAAGTTCTTTTGGGG HLFNKQP P
S. pecinata ATGCAAAAAGTTCTTTTTGGA HLFNKKS P
Z. macrantha ATGCAAAAAGTTCTTTTGGGG HLFNKQP P
E. tef ATCCAAAAAGAACTTTTTGGG DLFFKKP A
E. minor ATCCAAAAAGAACTTTTTGGG DLFFKKP A
N. reynaudiana ATCCAAAAAGAACTTTTTTGG DLFFKKP A
C. glauca ATCCAAAAAGAACTTTTTTGG DLFFKKP A
46. 33
The final inversion discovered in a CDS is within ccsA (Table 15) of D. spicata where a 3
bp inversion has changed a positively charged lysine and polar asparagine AA sequence into
polar asparagine and polar serine, respectively.
Table 15
Characteristics of the Three-Base Inversion Found in the ccsA Sequence
Taxa Nucleotide sequence AA sequence
Δ AA
properties
D. spicata TTTCGAAATTCTTTCGAT FRNSFD P,P
B. curtipedula TTTCGAAAGAATTTCGAT FRKNFD (+), P
H. cenchroides TTTCGAAAGAATTTTGAT FRKNFD (+), P
S. heterolepis TTTCGAAAGAATTTCTAT FRKNFY (+), P
S. pecinata TTTCGAAAGAATTTCTAT FRKNFY (+), P
Z. macrantha TTTCGAAAGAATTTCTAT FRKNFY (+), P
E. tef TTTCGAAAGAATTTAGAT FRKNLD (+), P
E. minor TTTCGAAAGAATTTAGAT FRKNLD (+), P
N. reynaudiana TTTCGAAAGAATTTCGAT FRKNFD (+), P
C. glauca TTTCGAAAAAATTTCGAT FRKNFD (+), P
Phylogenomic Analysis
Phylogenomic analyses were performed using a series of five datasets: [1], [2], [1-2], [3],
and [4]. The datasets were comprised of [1] complete plastome sequences with the inclusion of
only one IR and exclusion of any sites where a gap was introduced by the alignment; [2] the
binary matrix of characterized MMEs; [3] a matrix of CDS including 78 protein CDS, four
mRNA sequences, 32 tRNA sequences; and [4] all noncoding sequences (introns and intergenic
regions). In all cases, the ML and BI topologies were identical, so the BI results will not be
specifically described. In the following, bootstrap values (BV) = 100% unless otherwise noted.
47. 34
ML analyses of all datasets produced trees that were highly similar in organization as the
MP trees (see summary, Table 16). ML analysis for dataset [1] produced a single tree with –lnL
-217097.7. MP analysis of dataset [1] produced a single tree of 11,647 steps (Supp. Fig. S1)
with an ensemble consistency index (CI) excluding uninformative characters of 0.7463 and a
retention index (RI) of 0.7597 (Table 16). The topology of this tree was identical to that of the
ML tree. The maximum parsimony bootstrap value (MPBV) for the B. curtipendula and D.
spicata clade was 58% (Fig. 5).
When dataset [2] binary matrix was analyzed by the ML method, a phylogram was
generated where –lnL = -2549.18 (Fig. 6). The ML BV for the branch leading from the
Eragrostis clade was BV = 51. The MP tree generated from dataset [2] produced a single tree of
674 steps (Supp. Fig. S2) with a CI of 0.7544 and a RI of 0.7971. The topology of this tree was
identical to that of the ML tree. The topology of the trees generated from dataset [2] is
incongruent in two ways from the trees produced from analyses of dataset [1]. First, the
relationships among the three Cynodonteae differ, so that B. curtipendula is sister to H.
cenchroides, and these in turn are sister to D. spicata, unlike the trees generated from dataset [1]
in which B. curtipendula is sister to D. spicata, and these in turn are sister to H. cenchroides
(Figs. 5 and S1). The MPBV for the relationship between B. curtipendula and H. cenchroides
was 75%. Second, analyses of dataset [2] also show reversal in the order of divergences of N.
reynaudiana and the Eragrostis clade compared to those of dataset [1], but with a MPBV of only
63% (Supp. Fig. S2).
48. 35
Table 16
Maximum Parsimony Results from All Datasets
Dataset
used
Total
number of
characters
Number of
parsimony
informative
characters
Tree
length
CI excluding
uninformative
characters
RI
[1] 104,248 3143 11647 0.7463 0.7597
[2] 605 212 674 0.7544 0.7971
[1-2] 104,853 3355 12328 0.746 0.7611
[3] 62,486 1437 5191 0.7205 0.7311
[4] 41,012 1688 6356 0.7722 0.7852
49. 36
Eragrostis minor
Bouteloua curtipendula
Eragrostis tef
Spartina pectinata
Centropodiaglauca
Zoysia macrantha
Sporobolusheterolepis
Distichlis spicata
Neyraudia reynaudiana
Hilaria cenchroides
0.0062 | 608
0.003 | 313
0.0064 | 643
0.0035 | 359
0.0051 | 511
0.0082 | 774
0.0019 | 210
0.0042 | 420
0.0097 | 926
0.0078 | 803
0.016 | 1540
0.0141 | 1308
0.0004 | 111
0.0037 | 453
*
0.0023 | 287
0.0014 | 226
0.0054| 1070 0.003
0.0054| 1070
Figure 5: Maximum likelihood phylogram for dataset [1] with Substitutions per Site (SPS) and
Maximum parsimony number of changes (MPC) listed on each branch (SPS | MPC). All BV = 100 for
ML and MP except where indicated with (*) where MPBV = 58. Three species in the Cynodonteae clade,
which varied in topological positions across analyses, are indicated in red, blue and green.
50. 37
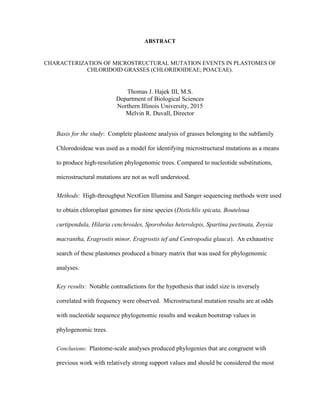
Figure 6: ML phylogram for dataset [2] with Substitutions per Site (SPS) and Maximum parsimony
number of changes (MPC) listed on each branch (SPS | MPC). Bar indicates the scale in substitutions per
site. MLBV = 100 on all internal nodes except where indicated with (**) where MLBV = 92. MPBV =
100 on all internal nodes except as indicated with (*) where MPBV = 75, (**) MPBV = 99 and (***)
MPBV = 63. BI was not able to resolve the relationship between B. curtipendula, D. spicata and H.
cenchroides for this dataset. Three species in the Cynodonteae clade, which varied in topological
positions across analyses, are indicated in red, blue and green.
0.8
Neyraudia reynaudiana
Spartina pectinata
Zoysia macrantha
Distichlis spicata
Centropodia glauca
Eragrostis minor
Sporobolus heterolepis
Eragrostis tef
Hilaria cenchroides
Bouteloua
curtipendula
0.124 | 50
0.129 | 44
*
0.243 | 87
4.0E-7 | 13
0.21 | 76
4.0E-7 | 12 ***
**0.063 | 20
0.063 | 27
0.103 | 35
0.041 | 23
0.058 | 29
0.036 | 16
0.02 | 14
0.29 | 72
3.458 | 95
3.458 | 95
0.115 | 36
0.06 | 25
51. 38
ML analysis of combined dataset [1-2] produced a tree with –lnL = -221210. The ML BV
for the internal branch leading to the B. curtipendula and D. spicata clade was 85% (Fig. 7). MP
analysis produced a single tree with 12,328 steps, a CI of 0.7460 and a RI of 0.7611. The
topology of this tree was congruent with the ML tree except for the relationships among the three
Cynodonteae. The sister relationship between B. curtipendula and H. cenchroides is resolved
with a BV of only 56% (Fig. 8).
The analysis of CDS included in dataset [3] generated a single ML tree with –lnL = -
120157.61 (Fig. 9). The ML BV of the node leading to the B. curtipendula and H. cenchroides
clade has a value of 59%. MP analysis produced a single tree (Supp. Fig. S3) with 5,191 steps, a
CI of 0.7460, a RI of 0.7611, and had an identical topology to the tree generated from ML
analysis of the same dataset. The MP BV for the internal branch leading to the B. curtipendula
and H. cenchroides clade has a value of 79% (Figure 9).
52. 39
Figure 7: ML phylogram for dataset [1-2]. All branch labels represent substitutions per site. BV = 100
on all internal nodes except where indicated by (*) where MLBV = 85. Three species in the Cynodonteae
clade, which varied in topological positions across analyses, are indicated in red, blue and green.
0.004
Neyraudia reynaudiana
Eragrostis minor
Distichlis spicata
Sporobolus heterolepis
Centropodia glauca
Hilaria cenchroides
Eragrostis tef
Bouteloua
curtipendula
Zoysia macrantha
Spartina pectinata
0.0025
0.0021
0.0084
0.004
0.0106
0.0057
0.0037
0.0044
0.0065
0.0088
0.0067
0.0015
0.0151
0.0171
0.0057
0.0004
0.0032
0.0055
*
53. 40
Figure 8: MP tree for dataset [1-2]. All branch labels represent the number of mutational steps along the
branch. BV = 100 for all internal nodes except where indicated by (*) where MPBV = 56. Three species
in the Cynodonteae clade, which varied in topological positions across analyses, are indicated in red, blue
and green.
Zoysia macrantha
Spartina pectinata
Sporobolus heterolepis
Bouteloua curtipendula
Hilaria cenchroides
Distichlis spicata
Eragrostis minor
Eragrostis tef
Neyraudia reynaudiana
Centropodia glauca
500 changes
1169
230
300
561
627
392
336
672
481
126
1620
1456
786
1007
221
439
815
1090
*
54. 41
Neyraudia reynaudiana
Sporobolus heterolepis
Distichlis spicata
Eragrostis tef
Zoysia macrantha
Centropodia glauca
Eragrostis minor
Spartina pectinata
Hilaria cenchroides
Bouteloua curtipendula
0.0069 | 377
0.0017 | 107
0.0028 | 174
0.0028 | 198
0.0067 | 372
0.0041 | 247
0.0071 | 400
0.0035 | 208
0.0004 | 50
0.0015 | 111
0.0043 | 249
0.0039 | 241
0.001 | 95
0.0041 | 475
0.0041 | 489
0.0022 | 135
0.01 | 597
0.0116 | 664
*
0.003
Figure 9: Maximum likelihood tree for dataset [3] with substitutions per site (SPS) and maximum
parsimony number of changes (MPC) listed on each branch (SPS | MPC). Bar indicates the scale in
substitutions per site. All BV = 100 except where indicated with (*) where MLBV = 59 and MPBV
= 79. Three species in the Cynodonteae clade, which varied in topological positions across analyses,
are indicated in red, blue and green.
55. 42
ML analysis of dataset [4] noncoding sequence matrix produced a single tree with –lnL =
-94368.28 (Fig. 10). The MP analysis of the dataset [4] matrix produced a single most
parsimonious tree (Supp. Fig. S4) of 6,356 steps with a CI of 0.7722 and a RI of 0.7852. This
tree was identical in topology to the tree produced from dataset [1]. The MP BV for the internal
branch leading to the B. curtipendula and D. spicata clade was 85%.
Bayesian inference (BI) analysis produced trees that are identical in topology to all ML
trees with the exception of the tree generated from the binary matrix of MMEs (tree not shown).
In the BI analysis of the MME matrix, the method was not able to resolve the exact relationship
among the species of Cynodonteae, B. curtipendula, H. cenchroides and D. spicata, which
resulted in a polytomy. All posterior probability values were 1.00 on all branches of the binary
matrix phylogram with the only difference being that the internal branch leading to the Z.
macrantha, S. heterolepis and S. pectinata clade is 0.92.
56. 43
0.005
Zoysia macrantha
Spartina pectinata
Sporobolus heterolepis
Bouteloua curtipendula
Distichlis spicata
Hilaria cenchroides
Eragrostis minor
Ertagrostis tef
Neyraudia reynaudiana
Centropodia glauca
0.0075 | 587
0.0021 | 128
0.0035 | 163
0.0068 | 270
0.009 | 352
0.0045 | 185
0.0042 | 177
0.01 | 395
0.0052 | 246
0.0006 | 58
0.0224 | 857
0.0094 | 380
0.0199 | 739
0.0137 | 526
0.0023 | 99
0.0051 | 205
0.0107 | 398
0.0075 | 591
*
Figure 10: Maximum likelihood tree for dataset [4] with substitutions per site (SPS) and maximum
parsimony number of changes (MPC) listed on each branch (SPS | MPC). All BV = 100 for ML and MP
except where indicated with (*) where MPBV = 85. Three species in the Cynodonteae clade, which
varied in topological positions across analyses, are indicated in red, blue and green.
57. 44
CHAPTER 4
DISCUSSION AND CONCLUSIONS
The hypothesis proposed by Leseberg and Duvall (2009), that underutilized plastome-
scale MMEs could be a valuable resource for supporting relationships among species, was tested.
However, the analyses from the MME data were incongruent with those of the nucleotide
substitution matrix, showed reduced support for relationships, and conflicted with analyses in
which more species were sampled. While the addition of MME data to substitution mutations
proved to be an ineffective means of constructing high- resolution phylogenies, it did raise new
questions about the way in which mutational/DNA repair mechanisms might function.
Microstructural Mutation Analysis
Indel Analysis
It was determined by an exhaustive search of the plastomes in this study that indels occur
with a higher frequency than inversions. A total of 581 indels were identified compared to only
24 inversions. These results confirm Hypothesis #1 (see Introduction) that indels occur more
frequently than inversions. Contrary to a recent study within Zea by Orton (2015), indels that
were scored as non-tandem repeat (308 occurrences) were more frequent than those that were
identified as having occurred by SSM (275 occurrences). This result refutes Hypothesis #2 that
tandem repeat indels, occur with greater frequency than indels that have arisen due to slipped-
strand mispairing. This result is not surprising since the taxa in this study belong to a more
58. 45
ancient lineage than the congeneric species in Orton’s (2015) study, which have had less time to
accumulate subsequent mutations that obscure tandem repeat patterns.
The overall size of indels that were characterized revealed that a substantial number of
these events were 5 bp in length. This result contradicts Hypothesis #3 that proposed that
slippage events across shorter tandem repeats would be expected to require a smaller input of
energy and so would occur with frequencies that progressively decreased with increasing indel
size (Wu et al., 1991). In other words, the size of the indels caused by slippage should be
inversely proportional to their frequency. The results presented here show that the number of 5
bp event frequencies range from 1.8 to 3.4-fold greater than four-base indels (E. tef and H.
cenchroides respectively) for all species in the alignment. Note that Orton (2015) had similar
results with a 1.6-fold increase of 5 bp indels over 4 bp indels, then a decrease in frequency of
indels ≥ 6 bp. It is unknown whether this trend is a result of some uncharacterized facet of the
energetics of slippage, a limitation on mutation recognition systems, some feature of DNA repair
mechanisms in the plastid, or an artifact of indel scoring.
Small Inversions
In a study on the occurrence of small inversions in chloroplast genomes of land plants,
Kim and Lee (2005) suggest that small inversions are more common than large inversions.
While the frequency of inversions over 9 bp drops substantially, my study found an inversion
frequency profile that largely confirms this conclusion. The single exception is that the
frequency profiles obtained in this study (Table 7, Fig. 5) showed an increase in the number of
59. 46
three-base inversions (ten occurrences) compared to two-base inversions (six occurrences). This
could be attributed to the steric limitations of loop-forming regions that make 2 bp inversions
less frequent than 3 bp inversions. Another possibility is that a portion of the loop was absorbed
by the stem regions where it would be difficult to classify the actual size of the inversion (e.g.,
AATACCCAATATCCTGTTGGAACAAGATATTGGGTATTT), leading to errors of inversion
size interpretations.
Indels in CDS
Indels were found to occur in CDS with a lower frequency of only 5.2% of the total that
were identified in noncoding sequence. This result supports the conjecture that noncoding
sequences are more likely to retain mutations since they do not directly affect gene function.
Indels that occur in CDS can cause frameshift mutations, alter AA sequences, or introduce
internal stop codons, which can be deleterious. Indels in CDS are not frequently observed in the
plastome since purifying selection acts against deleterious mutations, which can be fatal or
negatively impact the overall fitness of the organism.
CDS Specific Inversions
The inversions found in CDS of matK, ndhF and ccsA outlined in Tables 12-15 show that
AA at these loci have changed physical properties from that of the ancestral condition. Since all
of these CDS produce enzymes that are crucial to cell metabolism, it can be inferred that these
changes do not affect the overall function of their gene products. Further investigation could
show if these MMEs somehow alter the function of these gene products. However, it is not
60. 47
known if these AA alterations are located near active sites of these mRNA products. There is
evidence to support that reversion to the ancestral condition can occur because of homoplasious
mutation events. An example is shown in Table 12 where the nucleotide sequence inversion for
S. pectinata has reverted from guanine and adenine at positions 2,330-2331 to the tyrosine and
cytosine nucleotide sequence found in C. glauca at the same loci.
Phylogenomic Analyses
In this study, topologies were largely stable for the study group across data matrices, with
the exception of species of Cynodonteae (B. curtipendula, D. spicata, and H. cenchroides). Note
that the terminal branches belonging to B. curtipendula and H. cenchroides are relatively long in
comparison to those of other ingroup species in the study. For MP analyses, this anomaly could
produce faulty phylogenomic inferences due to a phenomenon known as long-branch attraction,
as described by Felsenstein (1978). Felsenstein demonstrated that the attraction between
homoplasious character state changes on different long-terminal branches could be a source of
error when conducting phylogenetic analyses. It is generally assumed that ML analyses are a
more robust form of analysis when compared to MP; however, ML can perform poorly if some
sequences are highly divergent (Tateno et al., 1994). ML, MP and BI analyses of all five
datasets produced trees that were largely congruent with the conclusions of Peterson et al. (2010)
on molecular phylogenetic studies that included members of the Chloridoideae subfamily
included here. However the inferred relationship between species in the B. curtipendula, D.
spicata and H. cenchroides clade changed depending on the dataset and method that was used.
61. 48
The ML, MP and BI analyses of dataset [1] produced phylograms with identical
topologies, which would indicate that B. curtipendula is sister to D. spicata that are in turn are
sister to H. cenchroides. Bootstrap values for the internal node supporting this relationship are
100% and 58% for ML and MP respectively. Given that plastome-scale datasets have a greater
number of informative characters than previous studies where only small portions of the
plastome were used (e.g., Peterson et al. 2010), we could conclude that this relationship is
accurate. However, when characterized MMEs from dataset [2] are concatenated with plastome-
scale sequence of dataset [1], ML analysis of dataset [1-2] produced a phylogram with an
identical topology to the tree generated by dataset [1] with a BV that dropped from 100% to 85%
in support of the sister relationship between B. curtipendula and D. spicata, and MP analysis of
the same dataset has changed the internal relationship of the clade to show B. curtipendula as
sister to H. cenchroides with a BV = 56. The results of this analysis refute the hypothesis that
plastome-scale MMEs are an effective source of data for the inference of high-resolution, highly
supported phylogenies. Recent findings in our lab (Duvall et al., in review) show that the sister
relationship between B. curtipendula and D. spicata is more strongly supported under ML, MP
and BI when additional plastome sequences from congeneric species are added to the matrix.
This allows for long branches to be divided by the additional taxa.
An analysis of the MMEs contained in dataset [2] for ML and MP generated phylograms
that support a sister relationship between B. curtipendula and H. cenchroides with BV = 100 and
BV = 75 for ML and MP respectively. BI analysis was not able to resolve this relationship. This
result would indicate that B. curtipendula shares a greater number of MMEs with H. cenchroides
62. 49
than with D. spicata. It would appear that the addition of the binary MME matrix is the cause of
decreasing BVs for ML analysis and reorganizing species in the Cynodonteae clade for the MP
analysis. This suggests that the different mutational mechanisms that cause substitution
mutations and MMEs are not equally informative for phylogenetic purposes.
To discover the cause of the shift in these relationships when MMEs were added to the
sequence matrix for MP, analyses of concatenated coding regions was performed to see what this
relationship is in terms of the highly conserved areas of the plastome. The analysis of CDS
contained in dataset [3] produced phylograms identical in topology for ML, MP and BI where B.
curtipendula was sister to H. cenchroides, which differs from the results generated from dataset
[1]. By conventional standards this relationship could be considered valid since the internal-
node BVs supporting this relationship are 59% and 79% for ML and MP respectively. This
result confirms that B. curtipendula and H. cenchroides share a somewhat greater amount of
sequence identity in regards to their CDS alone. Note that a number of previous studies of
complete plastomes have failed to show clear advantages when restricting the plastome data to
coding sequences (Burke et al., 2012; Cotton et al., 2015; Ma et al., 2014; Saarela et al., 2015;
Zhang et al., 2011). In these studies the use of both coding and noncoding sequences together
substantially increased phylogenetic information and raised support values.
Since the analysis of CDS did not provide a clear explanation as to what caused the MP
analysis of datasets [1-2] and [3] to differ from the topology of the tree produced from ML and
MP analysis of dataset [1], a nonconventional analysis of concatenated noncoding sequences
63. 50
included in dataset [4] was performed. This analysis produced a phylogram identical in topology
to that of dataset [1] with BV = 100 for ML and BV = 85 for MP supporting a sister relationship
between B. curtipendula and D. spicata. This result shows that there is a higher degree of
similarity in the noncoding regions of B. curtipendula and D. spicata when compared to H.
cenchroides and could be a contributing factor by which B. curtipendula and D. spicata were
grouped together when dataset [1] was subjected to phylogenomic analysis.
The weight of the evidence presented here better supports the Bouteloua curtipendula and
Distichlis spicata sister relationship for the following reasons: 1) ML and BI generated
phylograms for three out of the five (3/5) analyses for datasets [1], [1-2] and [4] with strong
support of this relationship where MLBVs range from 85-100% and all BI posterior probabilities
for these datasets are equal to 1.0; 2) phylograms produced from MP show weak support for B.
curtipendula as sister to H. cenchroides for datasets [2], [1-2] and [3] with MPBVs that range
from 56-79%; 3) sampling of more taxa in Cynodonteae supports a sister relationship between
Bouteloua and Distichlis (Duvall et al., unpublished).
Conclusion
The way in which microstructural mutations arise in plastomes is not well understood,
and the exact way in which cpDNA repair mechanisms function remains elusive. Further
investigation into identifying the gene products that are responsible for cpDNA damage repair is
64. 51
paramount for a better understanding of the mechanisms responsible for indels and inversions
and improving our knowledge of chloroplast genome evolution.
Conventional phylogenetic analyses that utilize CDS only no longer appear to be a
reliable means of defining lineages since it has been shown in this and other studies that datasets
that include CDS only produced trees with low support and/or resolution. Plastome-scale
analyses of nucleotide substitutions produced phylogenies that are congruent with previous work
with relatively strong support values and should be considered the most reliable type of dataset
when conducting these analyses.
65. 52
LITERATURE CITED
Boffey, S. A., & Leech, R. M. (1982). Chloroplast DNA levels and the control of chloroplast division in
light-grown wheat leaves. Plant Physiology, 69(6), 1387-1391.
Burke, S. V., Clark, L. G., Triplett, J. K., Grennan, C. P., & Duvall, M. R. (2014). Biogeography and
phylogenomics of new world Bambusoideae (Poaceae), revisited. American journal of
botany, 101(5), 886-891.
Burke, S. V., Grennan, C. P., & Duvall, M. R. (2012). Plastome sequences of two New World bamboos—
Arundinaria gigantea and Cryptochloa strictiflora (Poaceae)—extend phylogenomic
understanding of Bambusoideae. American journal of botany, 99(12), 1951-1961.
Cotton, J. L., Wysocki, W. P., Clark, L. G., Kelchner, S. A., Pires, J. C., Edger, P. P., ... & Duvall, M. R.
(2015). Resolving deep relationships of PACMAD grasses: a phylogenomic approach. BMC plant
biology, 15(1), 178.
Cox, M. P., Peterson, D. A., & Biggs, P. J. (2010). SolexaQA: At-a-glance quality assessment of Illumina
second-generation sequencing data. BMC bioinformatics, 11(1), 485.
Darriba D, Taboada GL, Doallo R & Posada D. (2012). jModelTest 2: more models, new heuristics and
parallel computing. Nature Methods 9(8), 772.
Dhingra, A., & Folta, K. M. (2005). ASAP: amplification, sequencing & annotation of plastomes. BMC
genomics, 6(1), 176.
El-Alfy, T. S., Ezzat, S. M., & Sleem, A. A. (2012). Chemical and biological study of the seeds of
Eragrostis tef (Zucc.) Trotter. Natural product research,26(7), 619-629.
Felsenstein, J. (1978). Cases in which parsimony or compatibility methods will be positively
misleading. Systematic Biology, 27(4), 401-410.
Felsenstein, J. (2005). PHYLIP (phylogeny inference package) Distributed by the author. Department of
Genome Sciences, University of Washington, Seattle), Version, 3.
Gibson, D. J. (2009). Grasses and grassland ecology. Oxford University Press.
Gould, F. W., & Shaw, R. B. (1983). Grass systematics. Brittonia, 35(3), 301-301.
66. 53
Grass Phylogeny Working Group II (2012). (Authors alphabetized; Aliscioni s, Bell HL, Besnard G,
Christin PA, Columbus JT, Duvall MR, Edwards EJ, Giussani L, Hasenstab-Lehman K, Hilu
KW, Hodkinson TR, Ingram AL, Kellogg EA, Mashayekhi S, Morrone O, Osborne CP, Salamin
N, Schaefer H, Spriggs E, Smith SA, Zuloaga F). New grass phylogeny resolves deep
evolutionary relationships and discovers C4 origins. New Phytologist 193: 304–312.doi:
10.1111/j.1469-8137.2011.03972.x
Guindon, S & Gascuel, O. (2003). A simple, fast and accurate method to estimate large phylogenies by
maximum-likelihood". Systematic Biology 52: 696-704.
Katoh K, Kuma KI, Toh H, Miyata T (2005). MAFFT version 5: improvement in accuracy of multiple
sequence alignment. Nucleic Acids Res 33(2): 511-518. doi: 10.1093/nar/gki198
Kim, K. J., & Lee, H. L. (2005). Widespread occurrence of small inversions in the chloroplast genomes of
land plants. Molecules and cells, 19(1), 104-113.
Leseberg, C. H., & Duvall, M. R. (2009). The complete chloroplast genome of Coix lacryma-jobi and a
comparative molecular evolutionary analysis of plastomes in cereals. Journal of Molecular
Evolution, 69(4), 311-318.
Levinson, G., & Gutman, G. A. (1987). Slipped-strand mispairing: a major mechanism for DNA sequence
evolution. Molecular biology and evolution, 4(3), 203-221
Loch, D. S., Simon, B. K., & Poulter, R. E. (2005). Taxonomy, distribution and ecology of Zoysia
macrantha Desv., an Australian native species with turf breeding potential. In International
Turfgrass Society Research Journal (Vol. 10, No. Part 1, pp. 593-599). Virginia Polytechnic
Institute and State University.
Ma PF, YX Zhang, CX Zeng, ZH Guo, DZ Li (2014). Chloroplast phylogenomic analyses resolve deep-
level relationships of an intractable bamboo tribe Arundinarieae (Poaceae). Syst Biol 63:933-950.
Miller, M., Pfeiffer, W., & Schwartz, T. (2010, November). Creating the CIPRES science gateway for
inference of large phylogenetic trees. In Gateway Computing Environments Workshop (GCE),
2010 (pp. 1-8). IEEE.
Orton, L. (2015). Phylogenomic study of selected species within the genus Zea: mutation rate analysis of
complete chloroplast genomes. M.S. Thesis, Northern Illinois University.
Peterson, P. M., Romaschenko, K., & Johnson, G. (2010). A classification of the Chloridoideae (Poaceae)
based on multi-gene phylogenetic trees. Molecular Phylogenetics and Evolution, 55(2), 580-598.
Prasad, V., Strömberg, C. A. E., Leaché, A. D., Samant, B., Patnaik, R., Tang, L., ... & Sahni, A. (2011).
Late Cretaceous origin of the rice tribe provides evidence for early diversification in
Poaceae. Nature Communications, 2, 480.
67. 54
Rambaut A. (2014). FigTree v1.4.2, Available from http://tree.bio.ed.ac.uk/software/figtree/
Raven P. & G. Johnson. (1995). Understanding Biology (3rd ed.). WM C. Brown. p. 536.
Ronquist, F., Teslenko, M., van der Mark, P., Ayres, D. L., Darling, A., Höhna, S., ... & Huelsenbeck, J.P.
(2012). MrBayes 3.2: efficient Bayesian phylogenetic inference and model choice across a large
model space.Systematic biology, 61(3), 539-542.
Saarela, J. M., W. P. Wysocki, C. F. Barrett, R. J. Soreng, J. I. Davis, L. G. Clark, S. A. Kelchner J. C.
Pires, P. P. Edger, D. R. Mayfield, and M. R. Duvall. 2015. Plastid phylogenomics of the cool-
season grass subfamily: Clarification of relationships among early-diverging tribes. AoB plants,
plv046.
Sage, R. F., & Monson, R. K. (1998). C4 plant biology. Academic Press.
Stamatakis, A. (2014). RAxML version 8: a tool for phylogenetic analysis and post-analysis of large
phylogenies. Bioinformatics, 30(9), 1312-1313.
Stevens, P.F. (2012, July). "Angiosperm Phylogeny Website". Version 12 [and more or less continuously
updated since]. http://www.mobot.org/MOBOT/Research/APweb/welcome.html
Strömberg, C. A. (2011). Evolution of grasses and grassland ecosystems. Annual Review of Earth and
Planetary Sciences, 39, 517-544.
Swofford, D. L. (2003). PAUP*. Phylogenetic Analysis Using Parsimony (*and Other Methods). Version
4. Sinauer Associates, Sunderland, Massachusetts, USA.
Tateno, Y., Takezaki, N., & Nei, M. (1994). Relative efficiencies of the maximum-likelihood, neighbor
joining, and maximum-parsimony methods when substitution rate varies with site. Molecular
Biology and Evolution, 11(2), 261-277.
USDA Plants Database, Plant Profile (2010). http://plants.usda.gov/java/
Walkup, C. J. (1991). Spartina pectinata. In: Fire Effects Information System, [Online]. U.S. Department
of Agriculture, Forest Service, Rocky Mountain Research Station, Fire Sciences Laboratory.
Wu, D. Y., Ugozzoli, L., Pal, B. K., Qian, J., & Wallace, R. B. (1991). The effect of temperature and
oligonucleotide primer length on the specificity and efficiency of amplification by the polymerase
chain reaction. DNA and cell biology, 10(3), 233-238.
Wysocki, W. P., Clark, L. G., Kelchner, S. A., Burke, S. V., Pires, J. C., Edger, P. P., ... & Duvall, M. R.
(2014). A multi-step comparison of short-read full plastome sequence assembly methods in
grasses. Taxon, 63(4), 899-910.
Zhang, Y. J., Ma, P. F., & Li, D. Z. (2011). High-throughput sequencing of six bamboo chloroplast
genomes: phylogenetic implications for temperate woody bamboos (Poaceae:
Bambusoideae). PLoS One, 6(5), e20596.
68. 55
SUPPLEMENTAL FIGURES
Supplemental Figure S1: MP branch and bound phylogram for dataset [1]. All branch labels represent the
number of mutational steps along the branch. All BV = 100 except for where indicated with (*) where BV
= 58. Three species in the Cynodonteae clade, which varied in topological positions across analyses, are
indicated in red, blue and green.
Zoysia macrantha
Spartina pectinata
Sporobolus heterolepis
Bouteloua curtipendula
Distichlis spicata
Hilaria cenchroides
Eragrostis minor
Eragrostis tef
Neyraudia reynaudiana
Centropodia glauca
500 changes
1070
226
287
511
608
359
313
643
453
111 *
1540
803
1308
926
210
420
774
1085
69. 56
Distichlis spicata
Bouteloua curtipendula
Hilaria cenchroides
Sporobolus heterolepis
Spartina pectinata
Zoysia macrantha
Neyraudia reynaudiana
Eragrostis tef
Eragrostis minor
Centropodia glauca
50 changes
95
12
20
36
50
13
87
76
35
25
29
23
27
44
72
16
14
Supplemental Figure S2: MP phylogram from dataset [2] binary matrix. All branch labels represent the
number of mutational steps along the branch. BV = 100 on all internal nodes except where indicated with
(*) where BV = 75, (**) BV = 99 and (***) BV = 63. Three species in the Cynodonteae clade, which
varied in topological positions across analyses, are indicated in red, blue and green.
70. 57
Zoysia macrantha
Spartina pectinata
Sporobolus heterolepis
Bouteloua curtipendula
Hilaria cenchroides
Distichlis spicata
Eragrostis minor
Eragrostis tef
Neyraudia reynaudiana
Centropodia glauca
100 changes
475
95
111
243
249
174
135
247
198
* 50
664
597
377
400
107
208
372
489
Supplemental Figure S3: MP tree generated from dataset [3] coding sequence matrix. All branch labels
represent the number of mutational steps along the branch. All BV = 100 except where indicated by (*)
where BV = 79. Three species in the Cynodonteae clade, which varied in topological positions across
analyses, are indicated in red, blue and green.
71. 58
Supplemental Figure S4: MP tree from dataset [4] of all noncoding sequence. All branch labels represent
the number of mutational steps along the branch. All BV = 100 except where indicated by (*) where BV
= 85. Three species in the Cynodonteae clade, which varied in topological positions across analyses, are
indicated in red, blue and green.
Zoysia macrantha
Spartina pectinata
Sporobolus heterolepis
Bouteloua curtipendula
Distichlis spicata
Hilaria cenchroides
Eragrostis minor
Ertagrostis tef
Neyraudia reynaudiana
Centropodia glauca
500 changes
587
128
163
270
352
185
177
395
246
* 58
857
380
739
526
99
205
398
591