Final Report
Title
By Your Name
ECO100
Professor’s Name
Date
1. Introduction
(In this section, provide a one-paragraph brief introduction about your selected industry. Please delete all instructions and use double-spacing before submitting your paper.)
2. Size and/or Growth of Industry
Write at least one paragraph assessing the size and/or growth rate of the industry relative to the national economy.
If you click on the GDP by industry, you should be able to assess the numbers related to the size and/or growth rate of the industry relative
You may also click on the percentage change in GDP by industry (especially the value added by industry) for additional inputs to this question.
· You should use the statistics to determine the weight of the industry relative to the GDP.
· You may also use the revenues, number of employees, and/or number of customers to substantiate your idea.
· Do not use bulleted or numbered lists.
· Write clearly and professionally; follow the Strayer Writing Standards.
3. Macroeconomic Indicator or Policy and Its Importance and Impact
Write at least one paragraph identifying the macroeconomic indicator or policy that the industry should monitor (inflation, unemployment, imports and exports, government expenditure, taxes, and/or interest rates). Explain why the macroeconomic indicator or policy is important and how it may impact the industry.
· Consider its importance and impact by looking at one or more of the indicators below:
1. The operational costs supported by the industry as compared to the revenues.
2. The trends observed in terms of profits and/or number of employees to substantiate your idea.
· Do not use bulleted or numbered lists.
· Write clearly and professionally; follow the Strayer Writing Standards.
4. Recent Trend
Write one paragraph describing a recent trend in the macroeconomic indicator or policy in part 3. Include a graph, table, or chart that illustrates the observed trend.
· Focus on the stability or increase/decrease of the chosen indicator when commenting on the graph, be certain to follow your graph or table with substantiated comments, explaining any major discrepancy in the data or the change in the shape of the curve.
· Do not use bulleted or numbered lists.
· Write clearly and professionally; follow the Strayer Writing Standards.
5. Conclusion
Write a one-paragraph conclusion that summarizes how you think the industry will perform in the future. Attention should be paid to whether the observed trend is expected to continue.
· This should be your (own) opinion.
· Explain what you learned about the topic. Attention should be paid to whether the observed trend is expected to continue.
· You may also expand upon this point by explaining what conclusion you draw from your research on the topic.
· Do not use bulleted or numbered lists.
· Write clearly and professionally; follow the Strayer Writing Standards.
Sources
1. List in order of use.
2. List a second source here.
3. Repeat f.
1. Final Report
Title
By Your Name
ECO100
Professor’s Name
Date
1. Introduction
(In this section, provide a one-paragraph brief introduction
about your selected industry. Please delete all instructions and
use double-spacing before submitting your paper.)
2. Size and/or Growth of Industry
Write at least one paragraph assessing the size and/or growth
rate of the industry relative to the national economy.
If you click on the GDP by industry, you should be able to
assess the numbers related to the size and/or growth rate of the
industry relative
You may also click on the percentage change in GDP by
industry (especially the value added by industry) for additional
inputs to this question.
· You should use the statistics to determine the weight of the
industry relative to the GDP.
· You may also use the revenues, number of employees, and/or
2. number of customers to substantiate your idea.
· Do not use bulleted or numbered lists.
· Write clearly and professionally; follow the Strayer Writing
Standards.
3. Macroeconomic Indicator or Policy and Its Importance and
Impact
Write at least one paragraph identifying the macroeconomic
indicator or policy that the industry should monitor (inflation,
unemployment, imports and exports, government expenditure,
taxes, and/or interest rates). Explain why the macroeconomic
indicator or policy is important and how it may impact the
industry.
· Consider its importance and impact by looking at one or more
of the indicators below:
1. The operational costs supported by the industry as compared
to the revenues.
2. The trends observed in terms of profits and/or number of
employees to substantiate your idea.
· Do not use bulleted or numbered lists.
· Write clearly and professionally; follow the Strayer Writing
Standards.
4. Recent Trend
Write one paragraph describing a recent trend in the
macroeconomic indicator or policy in part 3. Include a graph,
table, or chart that illustrates the observed trend.
· Focus on the stability or increase/decrease of the chosen
indicator when commenting on the graph, be certain to follow
your graph or table with substantiated comments, explaining
any major discrepancy in the data or the change in the shape of
the curve.
· Do not use bulleted or numbered lists.
· Write clearly and professionally; follow the Strayer Writing
Standards.
5. Conclusion
Write a one-paragraph conclusion that summarizes how you
think the industry will perform in the future. Attention should
3. be paid to whether the observed trend is expected to continue.
· This should be your (own) opinion.
· Explain what you learned about the topic. Attention should be
paid to whether the observed trend is expected to continue.
· You may also expand upon this point by explaining what
conclusion you draw from your research on the topic.
· Do not use bulleted or numbered lists.
· Write clearly and professionally; follow the Strayer Writing
Standards.
Sources
1. List in order of use.
2. List a second source here.
3. Repeat for additional sources.
2
Global issues
4. ENERGY SOURCES
Initially, people in the early generations relied on sun to
provide energy.
Wind was relied on to drive sails and horses to travel on land.
In the 18th century, steam engines were developed at the start
of industrialization providing power for locomotives and
factories.
Coal was used to heat water to produce steam. At the late
1800s, petroleum fuel began to be used.
Fuel engines were developed and mining of petroleum took
center stage to provide fuel for the first models of cars.
Electricity eventually was invented via the hydro electric power
to furnish the needs of the robust industries that needed a lot of
energy.
The development of energy was gradual but began to accelerate
during the height of industrialization. The invention of electric
power salvaged the over-utilization of petroleum fuel. The ever
increasing number of factories drew the pathway for the
development of energy and its sources.
*
ENERGY SOURCES
Developing countries are majorly faced with energy problems in
the world. There is access to small quantities of energy
compared to their needs. Industrialized countries have sufficient
amount of energy sources ranging from wind, electricity and
fuel. Countries that access low energy include:-
Burundi
Niger
Sierra Leone
Liberia
Central Africa Republic
5. Burkina Faso
South Sudan
Countries listed above have lowest access to electricity which is
the major source of energy in the modern world. South Sudan is
the country with its population accessing least amount of
electricity. About 5.1% of its population access electricity. The
country is in crisis of energy sources and is struggling to
generate more electricity for its population and industrialization
(Miller, 2015).
*
ENERGY SOURCES
Liberia and Niger and Sierra Leone are the countries accessing
least amount of electrification rates.
Developing countries are still suffering from less access to
energy sources.
Above graph shows trends in electrification rates in west Africa
for a decade. The graph shows how developing countries are
still faced with the problem of accessing energy sources i.e.
electricity (Miller, 2015)..
*
6. ENERGY SOURCES
The non renewable sources of energy affect the environment
much more than the renewable source.
There is overuse of non renewable sources of energy which has
led to environmental population.
There has been civil wars in countries that mine petroleum due
to the issue of revenue sharing.
More than half of developing countries do not access enough
energy due to scarcity of energy sources.
Global warming has been brought about due to excessive mining
of petroleum and fuel smoke emission into the atmosphere.
Diseases has been brought about due to use of non renewable
sources of energy e.g. the use of non leaded fuels.
Effect of energy sources on world population has been caused
majorly by the use of non-renewable sources. Theses sources
have been cause of environmental pollution and ultimately
global warming. Overexploitation of petroleum has brought
about harmful emission of gases into the environment (Miller,
2015).
*
CIVIL WARS
History of civil wars
Civil war is war between groups existing within the same
country.
The first civil war was le Julius Caesar against senate armies
led by Pompey. The war ended Roman Republic.
English civil war fought between 1642 and 1651 was a war
between religious and political groups.
Peninsular war of 1807-1814 fought between armies of Duke of
Wellington and Napoleon armies.
The American civil war 1861 to 1865 that ended slavery in
7. America.
Other civil wars that were fought include the Spanish, Chinese
and Vietnamese wars.
Civil wars are characterized by a lot of blood shed and also a lot
of destruction. Although civil wars have shaped the world as it
is today, most of them have brought destruction and ended many
peoples lives with others having their life change for the worst
and never to recover. American civil war is the only one that
brought positive changes by signifying end of slavery that had
been practiced for centuries (Aaronson, 2018).
*
CIVIL WARS
Countries affected by Civil Wars
Today, many countries are affected by civil wars just like in the
olden times.
These countries include:-
Democratic Republic of Congo.
Pakistan
Central Africa Republic.
North Korea
Nigeria
Sudan
Somalia
Iraq
Russia.
Most of these countries are developing countries. Russia is a
superpower that is experiencing civil wars.
Research has found that there is a low chance of a person living
in a absolutely peaceful country. Countries that have
experienced low numbers of wars include countries such as
8. Switzerland, Brazil and Chile. Global peace index has found out
that the major cause of civil wars is the financial crisis. There
has been an incremental chances of war in countries such as
Sudan and Democratic Republic of Congo (Aaronson, 2018).
*
CIVIL WARS
Chart1100000564162952271500081362496
Deaths
NUMBER OF DEATHS
Sheet1DeathsDemocratic Republic of
congo100000sudan5641central african
republic6295Pakistan227Nigeria15000Iraq8136Russia2496
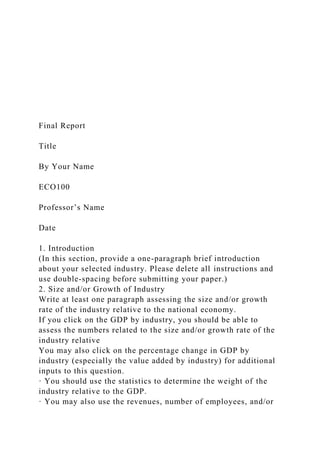
The Pie chart shows number of deaths in recent civil wars.
Democratic Republic of Congo has experienced a large number
of deaths reaching 10,000 in number (Aaronson, 2018). Pakistan
has lowest number of deaths in their civil war. Data above
shows how many people have lost their lives during civil wars,
one of the most devastating effects of civil wars.
*
CIVIL WARS
Effects of civil wars on world population
Many lives have been lost during civil wars.
Many people have been displaced from their homes and many
have became homeless.
Civil wars has brought economic crisis such as those
experienced in Congo.
National peace has been lost due to civil wars. It takes the
9. effort of BLOCs to maintain peace in this countries.
People become poor as their property is destroyed during the
span of civil wars.
Many children are left without parents who are killed in war.
The most adverse effect of them all is the loss of lives. Many
people have lost their lives in countries such as DRC and
Central African Republic. Economical damage is also one of the
most significant effects of civil wars. Despite the call for peace,
many countries have been plunging into civil wars due to
financial crisis wrecking havoc in them. In some countries,
presence of precious minerals has been the cause of civil war
(Aaronson, 2018).
*
LACK OF EDUCATIONAL OPPORTUNITIES
History of Education
Education and literacy began in the ancient civilization with the
innovation of writing techniques in Egypt and Mesopotamia via
the invention of Hieroglyphics.
Schools were built during the middle ages. Schools were mainly
built by churches and Islamic religions.
There was development of elementary schools in Europe in the
19th century.
Today, there is compulsory system of education. Nevertheless,
there is rising cases of illiteracy due to many causes such as the
expensive nature of education or lack of educational facilities.
In today’s world, people are entitled to right to education. Many
countries have enforced the rule of compulsory education
among its citizens. Nonetheless, in some countries there is still
cases of illiteracy due to its incapability to provide educational
facilities to its citizens. Some countries are faced with civil
wars that the education system is entirely disrupted (Simmons,
10. 2016). .
*
LACK OF EDUCATIONAL OPPORTUNITIES
Many countries in the African Continent have high number of
their populations not acquiring educational opportunities.
The countries with high numbers of illiteracy are:-
Niger
Eritrea
Burkina Faso
Chad
Guinea
Sierra Leone
Mali
Djibouti
Mali
One common factor about these countries with highest figures
of illiteracy is that all of the are from the African continent.
The causes of this bad phenomenon are; civil wars, lack of
enough funding, poverty, gender inequality etc. Many girls in
these countries do not attend school due to the prejudice of girl
child not being eligible for education. Lack of facilities of
learning is the major cause of illiteracy in these countries
(Simmons, 2016).
*
LACK OF EDUCATIONAL OPPORTUNITIES
U.N education Index in 2013
11. Chart10.1980.2280.250.2560.2940.3050.3050.306
INDEX
Sheet1INDEXNiger0.198Eritrea0.228Burkina
Faso0.25Chad0.256Guinea0.294Sierra
Leone0.305Mali0.305Djibouti0.306
The countries above face lack of educational opportunities.
Most of the countries spend less of their GDP on education and
thus a large number of its citizens do not get to access
education. Nevertheless, there has been increase in education
index compared to the previous years in this countries but the
problem is that there is slow increase in the index as UN
education index shows (Simmons, 2016). .
*
LACK OF EDUCATIONAL OPPORTUNITIES
Effects of Lack of educational opportunities
It prevents economic development in the country.
There is increase in illiteracy levels.
Increase in crime rates in the country.
The rate of employment increases with lack of education.
Increases the use of illegal drugs in the population.
Every nation’s development agenda composes of improve in the
education system. Without this in place, the nation fails to
develop and its GDP drops drastically. The citizens who do not
access education in the countries lacking facilities face
unemployment and end up being criminals in the society.
Effects of illiteracy are the worst since with education
everything in the country is driven forward.
*
12. CLIMATE CHANGE
History of Climate change
Climate change is the shift of weather patterns from a more
predictable way to complete unpredictable state characterized
by increase in heat radiation.
Major cause of this change over years has been credited to
Green house effect and the destruction of ozone layer as stated
in the Joint conference in 1895 .
Geologists found out this change in climate change as they
studied the difference between geological ages while focusing
on climate.
They found that there was increasing solar radiation in
successive geological ages with increasing glacial activity and
worldwide temperatures.
Climate change started during the height of industrialization as
harmful emissions were being released to the atmosphere from
factories. This gases were known to destroy ozone layer which
shields most of sun rays from reaching earth. As a result,
temperatures have increased exponentially. Today, there is
continuing climate change as industries continue being erected
and emission of harmful gases is increasing (Urry, 2015).
*
CLIMATE CHANGE
Climate change has affected all nations in the world. One of the
conditions that has resulted due to climate change is Global
warming. It is known as global because its effects cut across the
entire globe.
The regions that have depicted clear effects of global warming
are the polar regions characterized by fall in ice mass due to
melting.
The desert regions such as the Saharan desert has been
extending its borders tremendously. Oases in the deserts have
13. diminished and others vanishing.
Water masses have been reducing in size due to excessive
evaporation.
Forest and all plant habitats has been decreasing due to effects
of high scorching sun.
Water life has decreased.
The adverse effects of climate change has been felt all through
the world. All countries are experiencing its share of adverse
effects of climate change (Urry, 2015). Water land masses are
increasing due to ice melting and then drop acutely as a result
of pounding heat of the sun. Vegetation forests are drying up
and wild fires consumed them up while aquatic life is slowly
becoming extinct as the depth of waters is fast decreasing.
*
CLIMATE CHANGE
Annual average Temperatures in USA from 2000 to 2012
(Fahrenheit's)
Chart153.2753.6452.9853.1855.28
Series 1
Sheet1Series
1200053.27200553.64201052.98201153.18201255.28To resize
chart data range, drag lower right corner of range.
The graph above shows increasing temperatures from 2000 to
2012. At the end of the observed value i.e. 2012, there is higher
temperatures observed compared to 2000 when observation
began. This shows increase in temperatures as a result of global
14. warming in the USA which is a sample of the world countries.
*
CLIMATE CHANGE
Effects of climate change
Rise in water bodies and flooding along the coastal region
causing displace of populations along the coast and event death.
Intensive and increasing heat waves that cause health problems
such as heat strokes, skin cancers and heat exhaustion.
Famines and droughts caused by lack of rains to irrigate food
crops.
Decrease in population numbers due to lack of food to eat and
deaths.
Diseases such as cancer, heat stroke, heat exhaustion and diet
diseases.
Food insecurity due to bad weather patterns.
The effects of climate change are lethal for human population
more than everything else combined. Lack of mitigation
measures may lead to vanishing of life from the face of earth.
The major threat of climate change is that towards the
destruction of what sustains human life e.g. food and water
reservoirs. It will take and effort to undo the risk and get
climate change back on track (Urry, 2015).
*
REFERENCES
Aaronson, S. (2018). State Repression and its Effects on Civil
Conflict, Socio-Economic Outcomes, and Leadership Tenure.
George Washington University Washington United States.
Hite, K. A., & Seitz, J. L. (2016). Global issues: an
introduction. John Wiley & Sons.
15. Miller, S., Shemer, H., & Semiat, R. (2015). Energy and
environmental issues in desalination. Desalination, 366, 2-8.
Simmons, J. (Ed.). (2016). The education dilemma: Policy
issues for developing countries in the 1980s. Elsevier.
Urry, J. (2015). Climate change and society. In Why the social
sciences matter (pp. 45-59). Palgrave Macmillan,
London.
The development of energy was gradual but began to accelerate
during the height of industrialization. The invention of electric
power salvaged the over-utilization of petroleum fuel. The ever
increasing number of factories drew the pathway for the
development of energy and its sources.
*
Countries listed above have lowest access to electricity which is
the major source of energy in the modern world. South Sudan is
the country with its population accessing least amount of
electricity. About 5.1% of its population access electricity. The
country is in crisis of energy sources and is struggling to
generate more electricity for its population and industrialization
(Miller, 2015).
*
Above graph shows trends in electrification rates in west Africa
for a decade. The graph shows how developing countries are
still faced with the problem of accessing energy sources i.e.
electricity (Miller, 2015)..
*
Effect of energy sources on world population has been caused
majorly by the use of non-renewable sources. Theses sources
have been cause of environmental pollution and ultimately
global warming. Overexploitation of petroleum has brought
about harmful emission of gases into the environment (Miller,
2015).
*
Civil wars are characterized by a lot of blood shed and also a lot
of destruction. Although civil wars have shaped the world as it
16. is today, most of them have brought destruction and ended many
peoples lives with others having their life change for the worst
and never to recover. American civil war is the only one that
brought positive changes by signifying end of slavery that had
been practiced for centuries (Aaronson, 2018).
*
Research has found that there is a low chance of a person living
in a absolutely peaceful country. Countries that have
experienced low numbers of wars include countries such as
Switzerland, Brazil and Chile. Global peace index has found out
that the major cause of civil wars is the financial crisis. There
has been an incremental chances of war in countries such as
Sudan and Democratic Republic of Congo (Aaronson, 2018).
*
The Pie chart shows number of deaths in recent civil wars.
Democratic Republic of Congo has experienced a large number
of deaths reaching 10,000 in number (Aaronson, 2018). Pakistan
has lowest number of deaths in their civil war. Data above
shows how many people have lost their lives during civil wars,
one of the most devastating effects of civil wars.
*
The most adverse effect of them all is the loss of lives. Many
people have lost their lives in countries such as DRC and
Central African Republic. Economical damage is also one of the
most significant effects of civil wars. Despite the call for peace,
many countries have been plunging into civil wars due to
financial crisis wrecking havoc in them. In some countries,
presence of precious minerals has been the cause of civil war
(Aaronson, 2018).
*
In today’s world, people are entitled to right to education. Many
countries have enforced the rule of compulsory education
among its citizens. Nonetheless, in some countries there is still
cases of illiteracy due to its incapability to provide educational
facilities to its citizens. Some countries are faced with civil
wars that the education system is entirely disrupted (Simmons,
17. 2016). .
*
One common factor about these countries with highest figures
of illiteracy is that all of the are from the African continent.
The causes of this bad phenomenon are; civil wars, lack of
enough funding, poverty, gender inequality etc. Many girls in
these countries do not attend school due to the prejudice of girl
child not being eligible for education. Lack of facilities of
learning is the major cause of illiteracy in these countries
(Simmons, 2016).
*
The countries above face lack of educational opportunities.
Most of the countries spend less of their GDP on education and
thus a large number of its citizens do not get to access
education. Nevertheless, there has been increase in education
index compared to the previous years in this countries but the
problem is that there is slow increase in the index as UN
education index shows (Simmons, 2016). .
*
Every nation’s development agenda composes of improve in the
education system. Without this in place, the nation fails to
develop and its GDP drops drastically. The citizens who do not
access education in the countries lacking facilities face
unemployment and end up being criminals in the society.
Effects of illiteracy are the worst since with education
everything in the country is driven forward.
*
Climate change started during the height of industrialization as
harmful emissions were being released to the atmosphere from
factories. This gases were known to destroy ozone layer which
shields most of sun rays from reaching earth. As a result,
temperatures have increased exponentially. Today, there is
continuing climate change as industries continue being erected
and emission of harmful gases is increasing (Urry, 2015).
*
The adverse effects of climate change has been felt all through
18. the world. All countries are experiencing its share of adverse
effects of climate change (Urry, 2015). Water land masses are
increasing due to ice melting and then drop acutely as a result
of pounding heat of the sun. Vegetation forests are drying up
and wild fires consumed them up while aquatic life is slowly
becoming extinct as the depth of waters is fast decreasing.
*
The graph above shows increasing temperatures from 2000 to
2012. At the end of the observed value i.e. 2012, there is higher
temperatures observed compared to 2000 when observation
began. This shows increase in temperatures as a result of global
warming in the USA which is a sample of the world countries.
*
The effects of climate change are lethal for human population
more than everything else combined. Lack of mitigation
measures may lead to vanishing of life from the face of earth.
The major threat of climate change is that towards the
destruction of what sustains human life e.g. food and water
reservoirs. It will take and effort to undo the risk and get
climate change back on track (Urry, 2015).
*