Recommended

Recommended
More Related Content
What's hot
What's hot (20)
Similar to Final Pedernales Poster
Similar to Final Pedernales Poster (20)
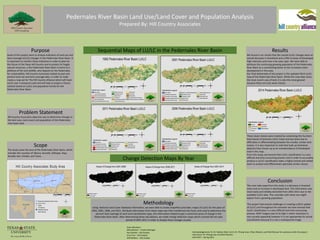
Final Pedernales Poster
- 1. Scope The study coves the area of the Pedernales River Basin, which includes the counties of: Blanco, Burnett, Gillespie, Hays, Kendall, Kerr, Kimble, and Travis. Pedernales River Basin Land Use/Land Cover and Population Analysis Prepared By: Hill Country Associates Sequential Maps of LU/LC in the Pedernales River BasinPurpose Goals of this project were to analyze indicators of land use and land coverage (LU/LC) changes in the Pedernales River Basin. It is important to monitor these indicators in order to plan for the future of the Texas Hill Country and to protect its fragile natural resources, a the Pedernales River Basin is home to a plethora of fish and wildlife, who depend on the Pedernales for sustainability. Hill Country Associates looked at past and present land use and land coverage data, in order to make create a map-set for The Hill Country Alliance which will track LU/LC over a temporal scale and will help to project a future outlook based on LU/LC and population trends for the Pedernales River Basin. Change Detection Maps By Year Team Members Kelly Blanton – Project Manager Paul Starkel – GIS Analyst Erica Tice – GIS Analyst Will Weldon – GIS Analyst Acknowledgements To: Dr. Nathan Allen Currit, Dr. Yihong Yuan, Ethan Roberts, and Nick McLean for assistance with this project. Instructors: Dr. Yihong Yuan and Nick McLean GEO 4427 – Spring 2015 Results We found in our results that the overall LU/LC changes were an overall decrease in forestland and a 50% increase of Developed High Intensity Land over a ten year span. We were able to attribute the continuing growing population of the Pedernales River Basin as a contributing factor to the increased urban development in this area. Our final deliverable of this project is the updated 2014 LU/LC map of the Pedernales River Basin. While this map does show the most recent uses of land, it is also the most general because there are only seven classes. These seven classes were created by condensing the fourteen land classes of previous LU/LC maps and was done due to difficulties in differentiating between the smaller, similar land classes. It is also important to note that built up limestone deposits have shown up as an overabundance of Developed land in this map. From this study, we learned that LU/LC classification is a very difficult and time consuming process and in order to accurately produce a LU/LC classification takes a highly trained and skilled team to analyze and differentiate spectrally similar classes. Methodology Using National Land Cover Database information, we were able to create shapefiles (and later, maps) of LU/LC for the years of 1992, 2001, 2006, and 2011. Attribute information from these maps was then transferred into Excel, and used to determine the percent land coverage of each land classification type, this information helped to get a numerical sense of change in the Pedernales River Basin. After determining these calculations, we made change detection maps which covered the ten year period of 2001-2011 in order to display these changes visually. Conclusion The main take away from this study is a decrease in forested areas and an increase in developed land. This information was most easily and reliably extracted from 2001-2011 due to the available LU/LC data. This coincides with what one might expect from a growing population. This project had several challenges in creating a 2014 update of LU/LC and throughout the semester we have learned that LU/LC classification is a very difficult and time consuming process. NAIP imagery due to its high 1-meter resolution is very visually appealing however it is not appropriate for actual classification because it is not a multispectral image Problem Statement Hill Country Associates objective was to determine changes in the land uses, land covers and population of the Pedernales river basin area.