Download to read offline

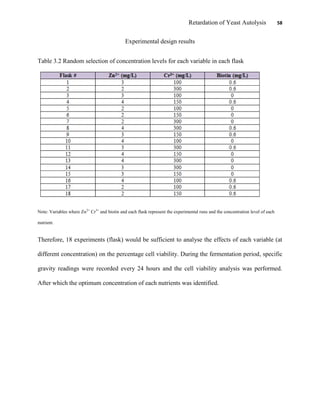
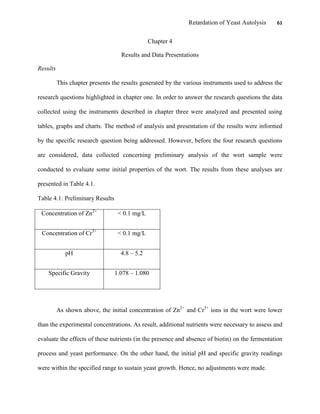
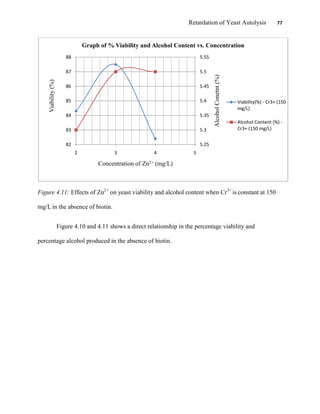
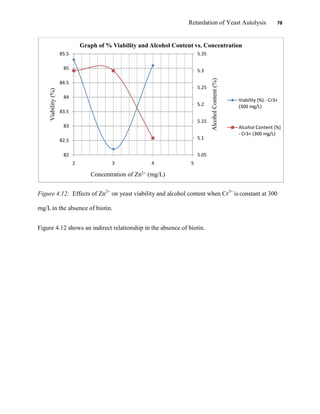
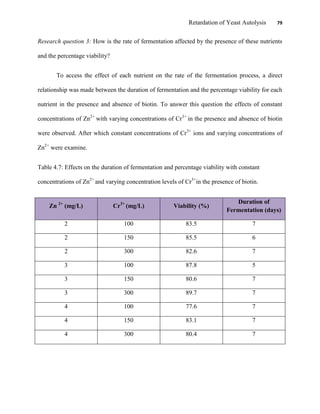
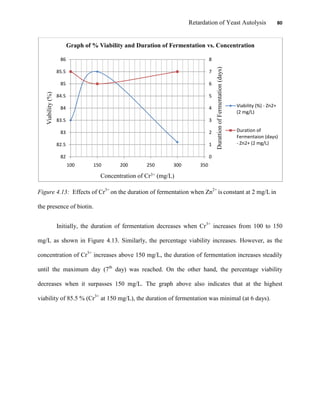
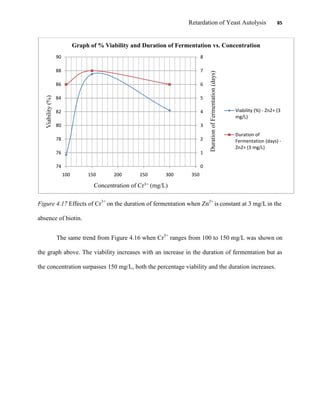
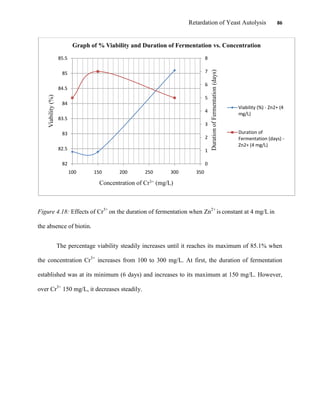
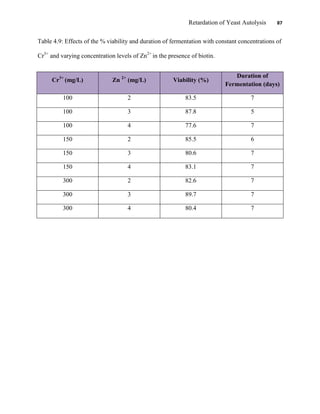
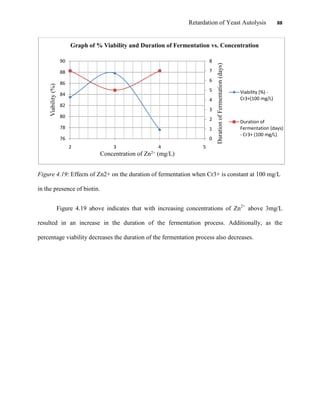
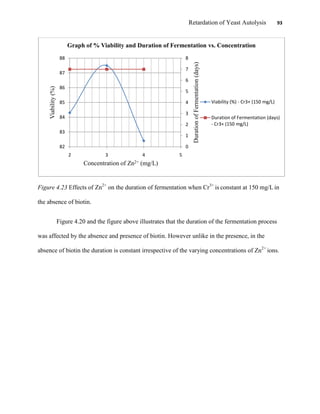
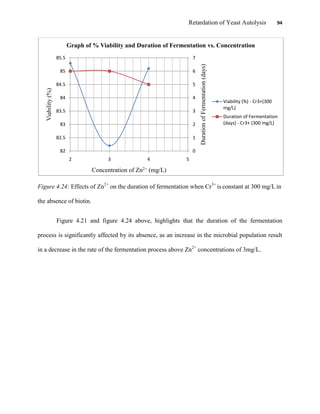
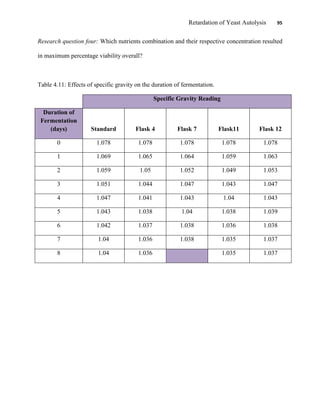
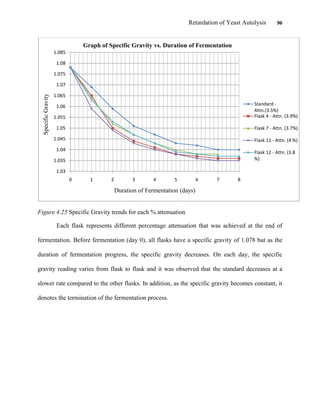
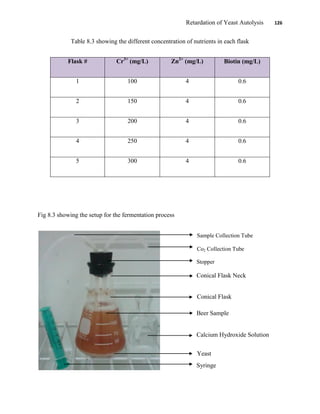
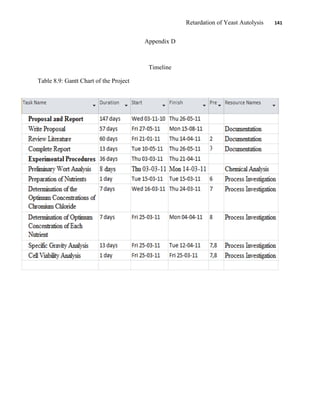
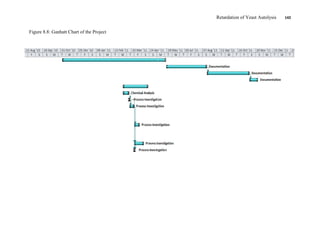
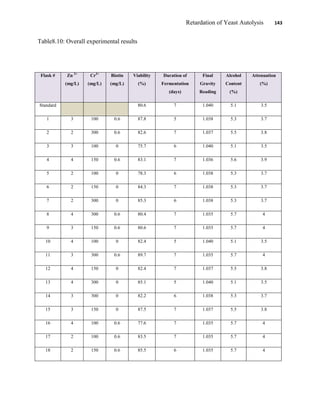
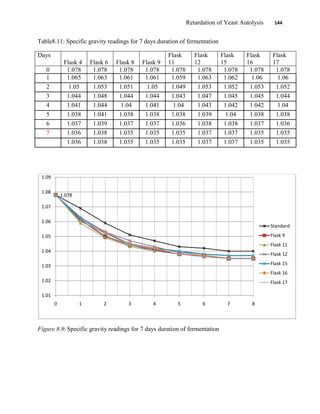


This document appears to be a student thesis project on retarding yeast autolysis during beer fermentation. It consists of an acknowledgments section thanking those who provided assistance, followed by a table of contents. The body includes chapters on literature review, methodology, results and data presentation, discussion of results, and conclusions. The literature review covers topics like types of yeast, fermentation phases, factors affecting fermentation, yeast metabolism, nutritional requirements, minerals in grains, by-products, and assessment methods. The methodology describes procedures for wort analysis, nutrient preparation, selecting chromium chloride, ensuring cell viability, and analyzing specific gravity and cell viability. The results and discussion sections present and analyze the experimental data and findings.


