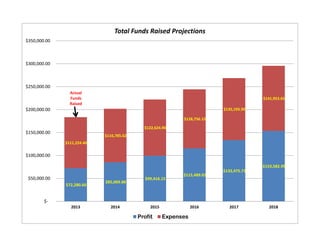
This bar graph shows projected and actual total funds raised from 2013 to 2018 for a nonprofit organization. The actual funds raised were lower than the projections for each year. The actual funds raised increased each year from $72,280.60 in 2013 to $153,582.99 in 2018, though they did not meet the projected amounts.