Download to read offline


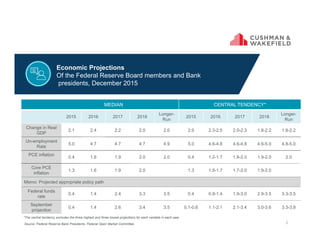
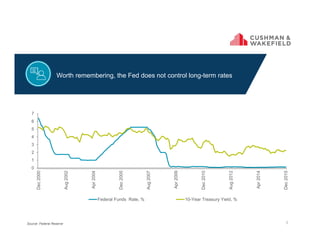
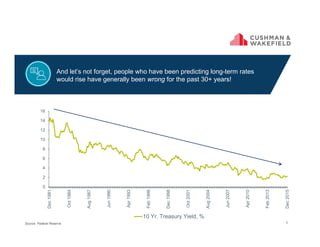
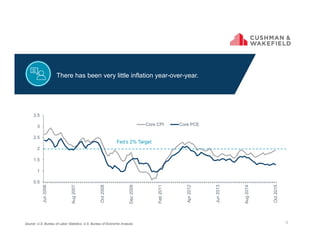
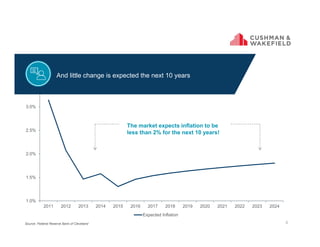
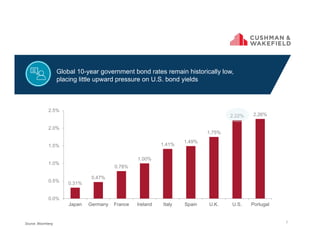
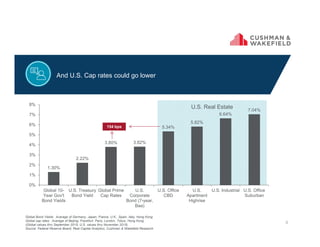
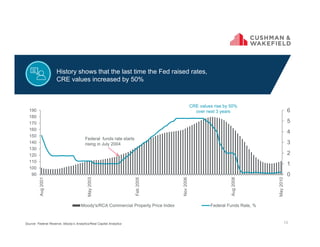
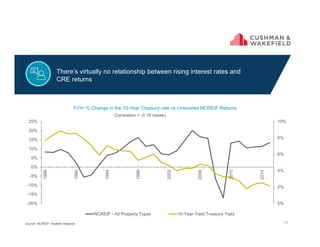
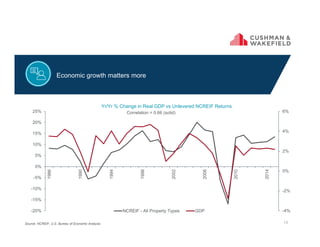
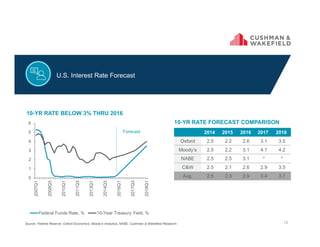
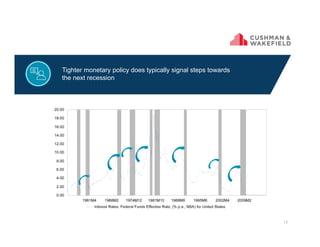
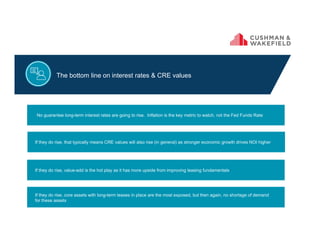


This document summarizes economic projections from the Federal Reserve Board members and Bank presidents from December 2015. It projects modest GDP growth between 2.0-2.5% annually through 2018 and a gradual decline in the unemployment rate to around 4.7-5.0% through the longer run. Inflation is projected to be around 2.0% each year. The median projection shows the federal funds rate rising gradually to around 3.3-3.5% by 2018. Several charts show historical interest rates and inflation remaining low. The summary concludes that there is no guarantee long-term interest rates will rise significantly and that inflation is a more important indicator to watch than the federal funds rate.


