This document is a handbook on finance for city leaders published by UN-Habitat. It contains 15 chapters organized into 3 parts that provide an in-depth analysis of challenges posed by rapid urbanization and various financing tools available to municipalities. The handbook aims to equip city leaders with sustainable, inclusive and autonomous financing solutions to achieve the goals of the New Urban Agenda. It draws on expertise from over 30 contributing authors from public, private and multilateral institutions worldwide.


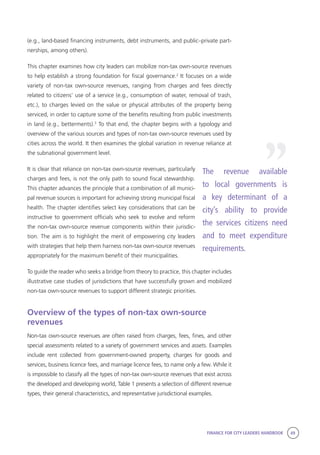
![10 FINANCE FOR CITY LEADERS HANDBOOK
only take away the decision-making of local actors
when there are clear efficiency gains to be realized.
As Finnis describes further, “[T]he proper function of
association is to help the participants in the associa-
tion to help themselves or, more precisely, to consti-
tute themselves through the individual initiatives of
choosing commitments […] and of realizing these
commitments through personal inventiveness and
effort in projects.”5
The need for cherishing indi-
vidual initiative is not just a case of citizens versus
government, but among government institutions
themselves. At times, the greater authority of those
higher up in government can be used to nullify
individual creativity among local government prac-
titioners, and this can harm municipal governments’
capacity to grow their revenue base.
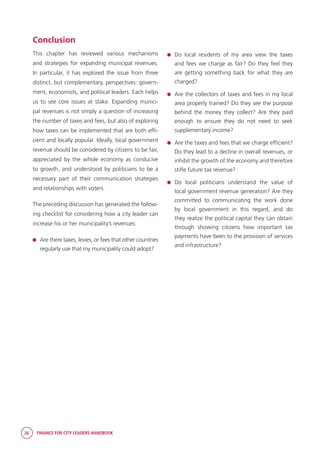
Principles of municipal finance:
The “benefit principle” and the
“ability-to-pay” principle
There are two main principles around which systems
of taxation can be arranged. One is the “benefit
principle,” a long-held idea put forward by public
finance theorists, which argues that “an equita-
ble tax system is one under which each taxpayer
contributes in line with the benefits which he or she
receives from public services.”6
This approach ties
taxation to public service delivery, helping develop
a close correlation between the money generated
in tax revenue and the money spent delivering the
particular good or service.
To help understand the benefit principle, it can be
contrasted with an alternative approach, the “abil-
ity-to-pay principle.” As the name suggests, this
principle entails that “each taxpayer is asked to
contribute in line with his or her ability to pay.”7
The
difference between this and the benefit principle
is that there is no direct connection with what is
being paid for. Citizens contribute according to their
ability without necessarily seeing the results of their
contributions.
In reality, most tax systems combine elements of
both approaches, with wealthier citizens contrib-
uting more, but some contributions being directly
linked to services. The advantage of this approach
is that linking taxation to services helps to generate
a social contract between citizens and the govern-
ment, such that citizens know what they are
contributing to and are able to witness its effects.
This, it is believed, will help increase compliance
in taxpaying. There is an element of fairness in
consumers of a publicly provided service being the
ones who pay for it.8
In order to maximize the advantages of the benefit
principle, some practitioners have recommended
earmarking certain taxes for specific uses.9
This can
make citizens more willing to pay the tax because
they know exactly where the money goes, and
can also help reduce corruption. Tax expert Wilson
Prichard writes:
“The aim of such tax earmarking is to build greater
trust between governments and taxpayers, while
providing a foundation for improved monitoring of
public expenditures. The case for such tax earmark-
ing is particularly strong in low-income countries
where trust is frequently limited and monitoring
particularly difficult.”10
Prichard describes the example of increases in
value-added tax (VAT) in Ghana, which was imple-
mented by connecting VAT to the provision of
specific public services, and “served to increase trust
amongst taxpayers while also making it somewhat
easier for the public to monitor government perfor-
mance.”11](https://image.slidesharecdn.com/c3a97ace-eb6e-4fd6-9ab6-2d03dee3f645-161012131538/85/FCL_HANDBOOK_HiRes-26-320.jpg)
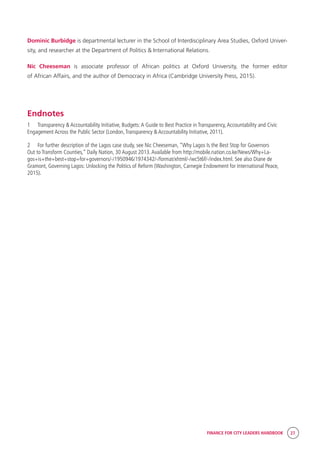
![24 FINANCE FOR CITY LEADERS HANDBOOK
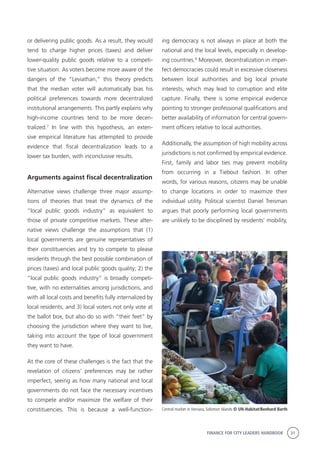
Civic engagement and public participation offer
a range of very important benefits to municipal
governments. Recent research shows that “greater
access to public information together with effec-
tive public engagement can help reduce corruption
and enhance socioeconomic development.”1
Most
obviously, effective participation and communica-
tion means that local governments are more likely
to implement policies that match citizens’ prefer-
ences, and are more likely to be given credit for
doing so. Less obviously, significant benefits can be
reaped in terms of revenue generation and popular
support for the government. The case study
explains how Governor Fashola of Lagos, Nigeria,
successfully expanded local government revenue
generation while increasing his vote share through
successfully communicating the value of these tax
increases to local citizens.2
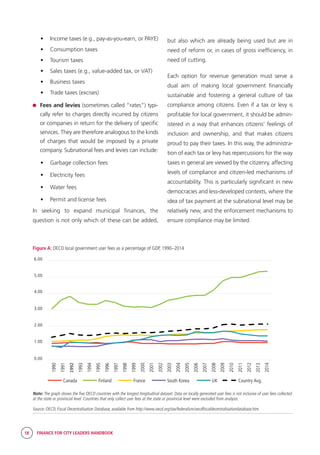
One of the most important issues to keep in mind
when seeking to build a social contract and increase
tax payment is the difference between regressive
and progressive forms of taxation. Regressive taxes
are those that have a uniform rate, applied to
everyone regardless of each person’s income level
(e.g., sales tax or value added tax [VAT]). Progres-
sive taxes modify the rate of payment based on the
payees’ income or wealth level (e.g., income tax).
Regressive taxes are generally understood to affect
poorer citizens disproportionately. There is also a
second important difference when it comes to the
form of taxation: Citizens tend to be more aware
that they are paying direct taxes, such as income
tax, than indirect taxes, such as VAT. As a result,
researchers have often suggested that direct taxes
are more significant when it comes to forming an
effective social contract around tax payment and
public service delivery.
These variations are relevant because when evaluat-
ing which local taxes or fees will expand municipal
revenues, it is important to pay attention to citizen
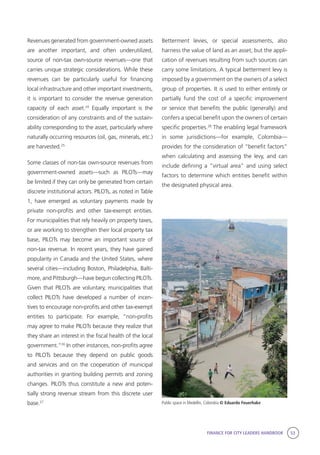
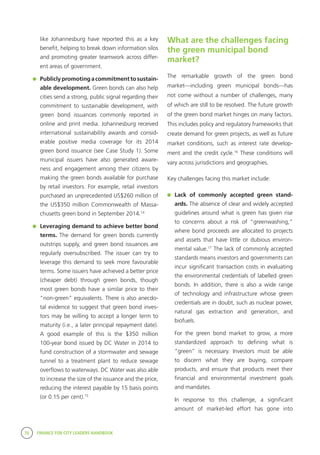
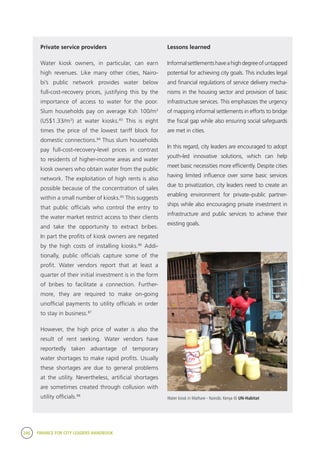
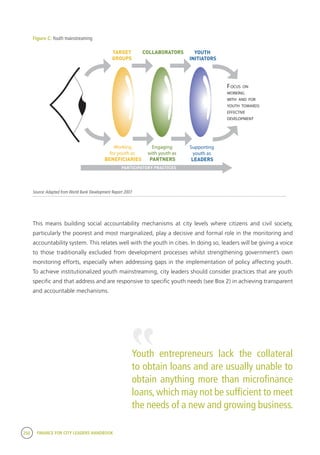
Case Study 1: Lagos, Nigeria, under Governor Fashola
In 2007, Babatunde Fashola won the governor-
ship, having been chosen as successor to the
previous governor, Bola Tinubu, with a modest
majority. In the years that followed, he furthered
Tinubu’s earlier efforts to expand state revenues
by introducing a new consumption tax on hotels
and eateries, and pursuing higher levels of tax
enforcement throughout Lagos State. These
measures initially drew criticism from some
sectors, but because these resources were chan-
nelled into issues of major public concern—
reducing crime, improving roads, providing
health clinics, etc.—they actually increased his
popularity over time. Significantly, his political
strategy, including a heavy emphasis on the
link between tax payment and public service
delivery, built support for the expansion of the
tax net. Ultimately, he won the 2011 elections
with a significantly increased majority, securing
just over 80 percent of the vote.](https://image.slidesharecdn.com/c3a97ace-eb6e-4fd6-9ab6-2d03dee3f645-161012131538/85/FCL_HANDBOOK_HiRes-40-320.jpg)
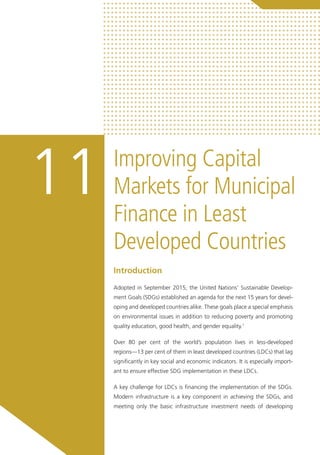
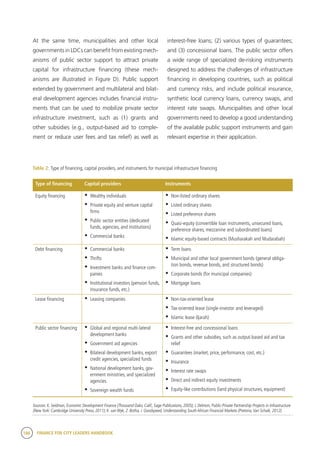
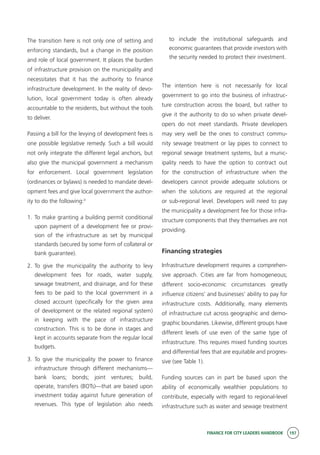
![FINANCE FOR CITY LEADERS HANDBOOK 39
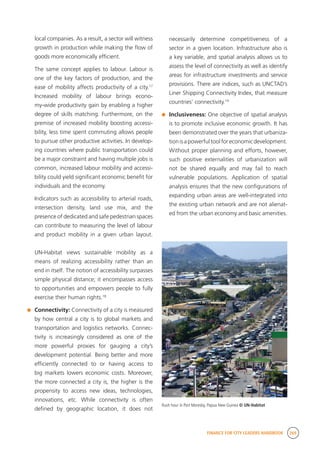
The global landscape of municipal credit
markets
Advanced municipal finance tools are available once
demand- and supply-side barriers are overcome (see
Table 1). These include local government-based
financing options (e.g., general obligation bonds,
revenue bonds, green bonds), development exactions
(e.g., linkage fees, impact fees), public and private
options (e.g., public–private partnerships [PPPs], pay
for performance), and mechanisms to leverage the
private sector (e.g., loan guarantees, tax increment
financing). Although the use of such market-based
financing mechanisms is growing, they are largely
confined to prosperous municipalities in advanced
economies (e.g., the United States, Western Europe,
and some other OECD countries). Some require the
participation of several partners, including private
capital, and others largely rely on the coercive power
of local governments.
A number of borrowing mechanisms have been used
by municipalities that are not yet investment-grade
creditworthy but have undertaken significant efforts
in this direction:
Municipal development funds operated by
national or state government entities mobilize
resources from private lenders, the central
government, and donor agencies, and on-lend
these resources to subnational governments
to finance capital investment programs. Terms
are normally concessional, although capacity to
repay debt obligations is an important criterion to
access these funds. More complex arrangements
may pursue the dual objective of financing local
infrastructure investments and strengthening
local credit markets. In Colombia, the Findeter
Fund used external borrowing to rediscount
loans made by private commercial banks to
public local authorities and local private entities
for investing in urban services and utilities. The
success of a model like Findeter depends on
the depth of the local financial markets and the
availability of capable financial institutions that
can take on credit risk related to municipal and
urban services loans at a substantial scale.
In poor countries, hybrid financing, a combi-
nation of market loans and grants, helps local
authorities keep debt service affordable. In
Burkina Faso, the hybrid financing for the
reconstruction of Ouagadougou following
the destruction of its central market by fire,
comprised access to long-term resources from
the Agence Française de Développement (AFD)
and a €3 million grant, without using a central
government guarantee.24
Many large cities across the globe have used
land-based revenues to finance capital invest-
ments. For example, in Shanghai, 46 per
cent of urban growth was funded through
land-based financing mechanisms by which
the city sold developed land to operators of
commercial or industrial zones, and revenuesPedestrians in New York, USA © Flickr/Stefane Georgi](https://image.slidesharecdn.com/c3a97ace-eb6e-4fd6-9ab6-2d03dee3f645-161012131538/85/FCL_HANDBOOK_HiRes-55-320.jpg)


![FINANCE FOR CITY LEADERS HANDBOOK 83
Devashree Saha is an associate fellow at the Brookings Institution Metropolitan Policy Program.
Skye d’Almeida manages the Financing Sustainable Cities Initiative at C40 Cities Climate Leadership
Group, a joint initiative of the Citi Foundation and WRI Ross Center.
9 Climate Bonds Initiative, Investor Statement re: Green
Bonds & Climate Bonds (London, Climate Bonds Initiative,
2014).Available from https://www.climatebonds.net/get-in-
volved/investor-statement.
10 Statehouse News Service, “Investors Gobble up Mass.
‘Green Bonds,’”Worcester Business Journal, 23 September
2014.Available from http://www.wbjournal.com/arti-
cle/20140923/NEWS01/140929987/investors-gobble-up-
mass-green-bonds.
11 Climate Bonds Initiative et al., How to Issue a Green
Muni Bond:The Green Muni Bonds Playbook (n.p., City
Green Bonds Coalition, 2015).Available from https://www.
nrdc.org/sites/default/files/greencitybonds-ib.pdf.
12 Climate Bonds Initiative et al., How to Issue a Green
Muni Bond:The Green Muni Bonds Playbook (n.p., City
Green Bonds Coalition, 2015).Available from https://www.
nrdc.org/sites/default/files/greencitybonds-ib.pdf.
13 Luke Spajic, “Green Bonds:The Growing Market for
Environment-Focused Investment,” Insights, September
2014.Available from https://www.pimco.com/insights/view-
points/viewpoints/green-bonds-the-growing-market-for-en-
vironment-focused-investment.
14 Climate Bonds Initiative et al., How to Issue a Green
Muni Bond:The Green Muni Bonds Playbook (n.p., City
Green Bonds Coalition, 2015).Available from https://www.
nrdc.org/sites/default/files/greencitybonds-ib.pdf.
15 Climate Bonds Initiative et al., How to Issue a Green
Muni Bond:The Green Muni Bonds Playbook (n.p., City
Green Bonds Coalition, 2015).Available from https://www.
nrdc.org/sites/default/files/greencitybonds-ib.pdf.
16 OECD, Green Bonds: Mobilizing the Debt Capital
Markets for a Low-Carbon Transition (Paris, OECD, 2015).
Available from https://www.oecd.org/environment/cc/
Green%20bonds%20PP%20[f3]%20[lr].pdf.
Endnotes
1 Climate Bonds Initiative, Bonds and Climate Change:
State of the Market (London, Climate Bonds Initiative,
2016). Available from https://www.climatebonds.net/
files/files/CBI%20State%20of%20the%20Market%20
2016%20A4.pdf.
2 Climate Bonds Initiative, Bonds and Climate Change:
State of the Market (London, Climate Bonds Initiative,
2016).Available from https://www.climatebonds.net/
files/files/CBI%20State%20of%20the%20Market%20
2016%20A4.pdf.
3 Climate Bonds Initiative, 2015 Green Bond Market
Roundup (London, Climate Bonds Initiative, 2016).Avail-
able from http://www.climatebonds.net/files/files/2015%20
GB%20Market%20Roundup%2003A.pdf.
4 Stephen Liberatore and Joel Levy, Green Muni Bonds:
Responsible Investing in a Centuries-Old Asset Class (New
York,TIAA Global Asset Management, 2016).Available
from https://www.tiaa.org/public/pdf/C29869_TGAM_
whitepaper_muni_bonds.pdf.
5 Elizabeth Daigneau, “Massachusetts Uses Popularity
of Environmental Stewardship to Pad its Bottom line,”
Governing, July 2013.Available from http://www.govern-
ing.com/topics/transportation-infrastructure/gov-massachu-
setts-green-bonds-a-first.html.
6 Mike Cherney, “D.C.Water Authority to Issue 100-
Year ‘Green Bond,’”Wall Street Journal, 2 July 2014.
7 Climate Bonds Initiative, Bonds and Climate Change:
The State of the Market in 2015 (London, Climate Bonds
Initiative, 2015).Available from https://www.climatebonds.
net/files/files/CBI-HSBC%20report%207July%20JG01.pdf.
8 Climate Bonds Initiative, Growing a Green Bonds
Market in China (London, Climate Bonds Initiative, 2015).
Available from https://www.climatebonds.net/files/files/
Growing%20a%20green%20bonds%20market%20in%20
China.pdf.](https://image.slidesharecdn.com/c3a97ace-eb6e-4fd6-9ab6-2d03dee3f645-161012131538/85/FCL_HANDBOOK_HiRes-99-320.jpg)
![FINANCE FOR CITY LEADERS HANDBOOK 93
These are the basic conditions, but above all there
must be a need, obvious to local authorities, for
new financing solutions. These local authorities
must also be convinced that pooled financing
could be a way forward. The next step is to get the
support from central government.
Unfortunately, in many countries there has been
an initial hesitation for municipalities to cooper-
ate. This is probably because municipalities often
see themselves as competitors to the neighboring
local authority. Sometimes there could also be an
element of distrust among municipalities. This can
stem from different political parties being in power
or a number of other reasons.
In countries where municipal funding agencies have
been created, these challenges have been present.
Fairly soon in the process it is recognized by the
local authorities that a PFM is for the benefit of all
participants, but it is still important to, in different
ways, enhance trust among municipalities. The
process needs to start with a few motivated stake-
holders that can lead the way for others. These
initiators must clearly state their interest in studying
the introduction of a PFM in order to build a strong
enough foundation for a project.
The work to create a PFM entity should be properly
organized. A local government association could
host the project and supply administrative support.
It is important to remember that it is the local
authorities that should drive the project. A step
that is key in this type of process is the recruitment
of leaders, both political and professional. A need
for entrepreneurial skills cannot be underestimat-
ed. It is a question of breaking new ground, and
it requires hard work and creativity combined with
diplomacy.
The value of the process
All uses of financial markets for borrowing purposes
are built upon good creditworthiness. The situation
for local authorities varies greatly among different
countries. For some developing countries a PFM
is perfectly feasible, while other countries’ local
authorities lack steady income streams and a solid
regulatory framework. Nevertheless, all countries
and their local authorities could make substantial
gains from the process towards a PFM.
A project that aims to put in place financial coop-
eration among cities in a developing country
addresses almost all the questions that are vital for
well-functioning local authorities. These include:
What is the relationship between local author-
ities and central government, both legal and
financial?
What is the flow of income (including stability,
predictability, diversification, trends [especially of
tax bases], system for collection, collection rates,
and the possibilities to tap new local taxes)?
What is the cost structure?
What is the debt outlook (e.g., size, interest
payments, maturities, payment record, and
central government restrictions)?
What institutional factors are present (e.g.,
organization, accounting system, audit, level of
knowledge, and skills)?
All of the above constitute a well-functioning local
authority with high creditworthiness.
Asking these questions in connection with a project
that aims to solve a major problem, such as financ-
ing infrastructure investment, can be very efficient. It
would enable putting needed reforms in the context
of a vision for the future. A project would be orga-](https://image.slidesharecdn.com/c3a97ace-eb6e-4fd6-9ab6-2d03dee3f645-161012131538/85/FCL_HANDBOOK_HiRes-109-320.jpg)

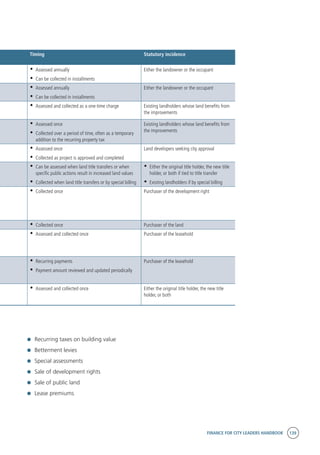
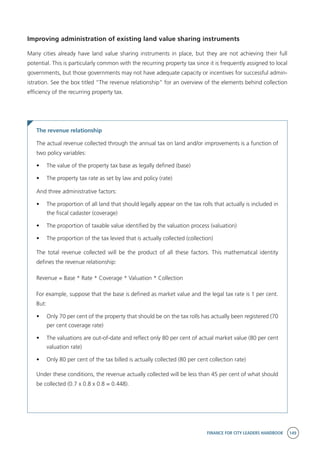
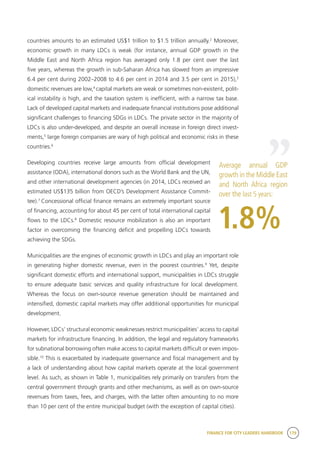
![FINANCE FOR CITY LEADERS HANDBOOK 101
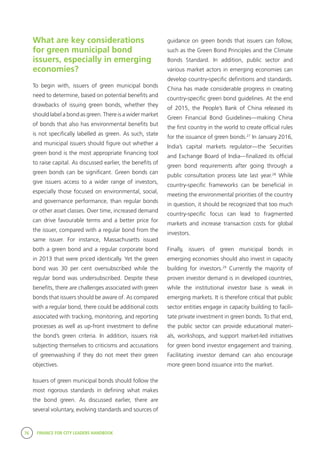
Table 1. Common types of PPPs and relevant terms
Term Description
Buy-build-operate (BBO) Transfer of a public asset to a private or quasi-public entity usually under contract to upgrade
and operate assets for a specific period of time. Public control is exercised through the contract
at the time of transfer.
Build-own-operate (BOO) The private sector finances, builds, owns, and operates a facility or service in perpetuity.The
public constraints are stated in the original agreement and through ongoing regulatory au-
thority.
Build-own-operate-transfer (BOOT) A private entity receives a franchise to finance, design, build, and operate a facility (and to
charge user fees) for a specified period, after which ownership is transferred back to the public
sector.
Build-operate-transfer (BOT) The private sector designs, finances, and constructs a new facility under a long-term concession
contract, and operates the facility during the term of the concession, after which ownership is
transferred back to the public sector if not already transferred upon completion of the facility.
In fact, such a form covers BOOT and BLOT, with the sole difference being the ownership of the
facility.
Build-lease-operate-transfer (BLOT) A private entity receives a franchise to finance, design, build, and operate a leased facility (and
to charge user fees) for the lease period, against payment of a rent.
Design-build-finance-operate (DBFO) The private sector designs, finances, and constructs a new facility under a long-term lease, and
operates the facility during the term of the lease.The private partner transfers the new facility
to the public sector at the end of the lease term.
Finance only A private entity, usually a financial services company, funds a project directly or uses various
mechanisms such as a long-term lease or bond issue.
Operation and maintenance contract
(O&M)
A private operator, under contract, operates a publicly owned asset for a specified term. Own-
ership of the asset remains with the public entity. (Many do not consider O&Ms to be within
the spectrum of PPPs and consider such contracts as service contracts.)
Design–build (DB) The private sector designs and builds infrastructure to meet public sector performance speci-
fications, often for a fixed price, turnkey basis, so the risk of cost overruns is transferred to the
private sector. (Many do not consider DBs to be within the spectrum of PPPs and consider such
contracts as public works contracts.)
Operation license A private operator receives a license or rights to operate a public service, usually for a specified
term.This is often used in IT projects.
Source: S. Baizakov, Guidebook on Promoting Good Governance in Public-Private Partnership (Geneva, UNECE, 2008).Available from http://www.unece.org/fileadmin/DAM/
ceci/publications/ppp.pdf.
In public–private partnerships, it is common practice for a project company, called a special purpose vehicle
(SPV), to be established by the private firm or group of private firms running the project. It is the SPV that
signs the PPP contract with its public entity counterpart, which then allows the company to build, own, and
operate the infrastructure project.6
SPVs are especially useful for private firms engaging in PPPs because
they offer additional security and reduce the risk of undertaking major infrastructure projects by acting as
“a legally distinct entity to the parent company, and…[financing] large new stand-alone projects off the
corporate balance sheet.”7
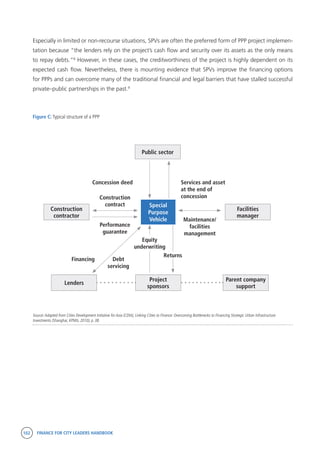
Figure C shows the structure of a typical SPV composed of the financer (major
shareholder), the developer, facilities manager, and occasionally the government. The financing structure
in terms of debt and equity is a key aspect of a PPP project and can have a big impact on its costs and
affordability.](https://image.slidesharecdn.com/c3a97ace-eb6e-4fd6-9ab6-2d03dee3f645-161012131538/85/FCL_HANDBOOK_HiRes-117-320.jpg)

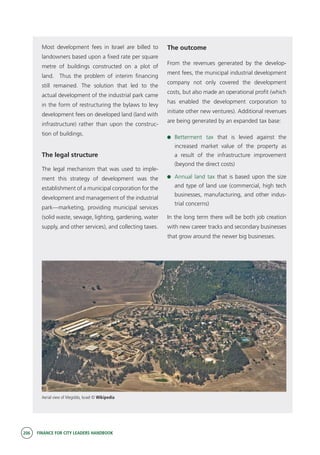
![126 FINANCE FOR CITY LEADERS HANDBOOK
Risk as a cost in an investment project
There are a number of risk factors involved in investments related to the development of a particular
area (e.g., management risk, liquidity risk, legislative risk, inflation risk, interest rate risk, environmental
risk, archaeological risk, etc.), and not all investments entail the same level and type of risk. Real estate
development is, generally speaking, more risky than government bonds (i.e., gilt-edged securities), and
the development of rural land into serviced urban parcels is likely even more risky than the construction
of the final real estate product.
Therefore, depending on the risk inherent in each investment project, we need to add a risk premium
to the opportunity cost of the capital, as appropriate for that particular project.
r = RFR [Risk Free Rate]
+ RP [Risk Premium]
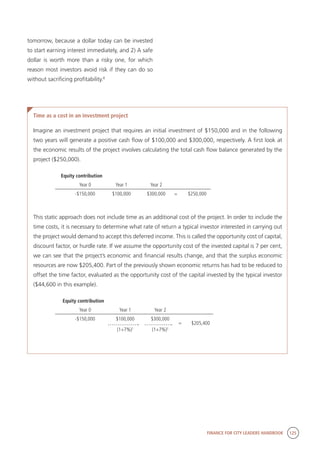
Net present value and internal rate of return as metrics of financial feasibility
Net present value (NPV) is the indicator par excellence, and its purpose is to update, at any given moment,
all cash flows generated by the investment project under analysis:
CF = Estimated cash flow for each time unit (year, six-month period, etc.)
i = Discount factor applied to each time unit
n = Number of time units estimated for the investment project (years, six-month periods, etc.)
A project with a positive NPV means that:
1. It has returned all capital invested.
2. It has paid back the cost of all resources used to fund it.
3. It has generated an additional surplus equivalent to the volume indicated by the NPV in question.
NPV is the best indicator for the economic and financial assessment of any urban transformation project
since it is the indicator, along with the internal rate of return (discussed below), that takes into account the
time value of money and that is based solely on the inflow and outflow of economic resources provided for
in the project and on their opportunity cost.
( ) ( ) ( )n
n
i
CF
i
CF
i
CF
CFNVA
+
++
+
+
+
+=
1
.........
11
. 2
2
1
1
0](https://image.slidesharecdn.com/c3a97ace-eb6e-4fd6-9ab6-2d03dee3f645-161012131538/85/FCL_HANDBOOK_HiRes-142-320.jpg)
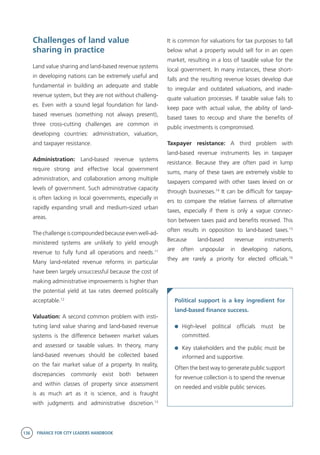
![Sharing the Wealth:
Private Land Value
and Public Benefit
09
Introduction
Sustainable development includes the public financial resources to invest
in and maintain the physical infrastructure and urban services necessary to
support urban living. The need for additional resources to meet the demands
of urban growth is nearly ubiquitous. This need has led many thoughtful
observers to advocate greater use of land as a basis for raising additional
revenues. For example, the editors of The Economist recently argued:
“[G]overnments should impose higher taxes on the value of land. In most
rich countries, land-value taxes account for a small share of total revenues.
Land taxes are efficient. They are difficult to dodge; you cannot stuff land
into a bank-vault in Luxembourg. Whereas a high tax on property can
discourage investment, a high tax on land creates an incentive to develop
unused sites. Land-value taxes can also help cater for newcomers. New infra-
structure raises the value of nearby land, automatically feeding through into
revenues—which helps to pay for the improvements.”1](https://image.slidesharecdn.com/c3a97ace-eb6e-4fd6-9ab6-2d03dee3f645-161012131538/85/FCL_HANDBOOK_HiRes-148-320.jpg)

![234 FINANCE FOR CITY LEADERS HANDBOOK
Gender equality
Within the current urban environment, women face
unique challenges due to gender-based discrimina-
tion. For example, urban settlements are associated
with increased incidence of public space gender-
based violence (GBV) and challenges in mobility due
to gender-neutral urban planning, which fails to
acknowledge and accommodate the informal and care
economies.28
Specifically, urban poverty has distinctive
gendered dimensions, aggravated by the gendered-di-
vision of labour, poor representation in urban gover-
nance, and unequal access to public spaces.29
Therefore, urbanization’s potential to deliver sustain-
able development and an adequate standard of living
for all depends on an intersectional approach that
recognizes that the urban poor, and especially women,
face daunting challenges in the form of environmental
hazards, inadequate shelter, insufficient provision of
water and sanitation, and limited access to services,
resulting in the overall challenge that their human
rights are violated or at risk of being violated.30
In order
to meet these challenges, city leaders will have to
draw on tools for socially inclusive urbanization, which
recognize the participation and rights of all.
Gender equality and women’s
empowerment (GEWE), and gender
mainstreaming
The implementation of sound and inclusive munici-
pal finance will define the achievement of the 2030
Agenda in cities and the New Urban Agenda (NUA).
In short, transparent, effective municipal finance
will be the source for financing for SDG 11 and the
NUA.32
In the same vein, it is paramount to recognize
that women’s livelihoods are key drivers of the urban
economy, and essential to effective finance and imple-
mentation of sustainable urban growth.
At its core, GEWE is about behavioral change and an
overarching long-term development goal. Empow-
erment relies on a woman’s ability to plan and
control her own life. Therefore, in order to become
empowered, women must not only have equal capa-
bilities (i.e., education and health) and equal rights
and access to resources and opportunities (i.e., land
and employment), they must also have the agency
to deploy those rights and capabilities and to be
included in societal decision-making processes (i.e.,
through leadership and participation at the institu-
tional levels).33
Gender mainstreaming is the process of assessing the
implications for women and men of planned actions
in all areas, and at all levels (for a specific example,
see Case Study 3). Therefore, all activities should
be defined so that gender differences can be diag-
nosed; gender-neutrality is never the case.34
Gender
mainstreaming is the main international approach
to promoting equality between men and women.35
Women’s crucial role
“The subordinate role of women … enables
the minimal maintenance of [the city’s]
housing, transport and public facilities …
because women guarantee unpaid trans-
portation, because they repair their homes,
because they make meals when these are no
canteens … because they look after others’
children when there are no nurseries. … [I]f
women who ‘do nothing’ ever stopped to do
’only that’, the whole urban structure as we
know it would become completely incapable
of maintaining its functions.”31](https://image.slidesharecdn.com/c3a97ace-eb6e-4fd6-9ab6-2d03dee3f645-161012131538/85/FCL_HANDBOOK_HiRes-250-320.jpg)
![FINANCE FOR CITY LEADERS HANDBOOK 237
of gendered division of labour—can cause women to
crowd the informal sector in search of flexible work
arrangements. Indeed, addressing and engaging the
informal sector is oftentimes a challenge for local
authorities; therefore, engaging with women’s grass-
roots organizations and civil society organizations is
paramount.
Inlightofwomen’spositionintheurbaneconomy,and
their relative position in the reality of urban poverty, it
is fundamental that urban finance managers consider
GEWE as paramount in strategic plans and budgets,
thus bringing together SDG 1.4 (“[to] ensure that
all men and women, in particular the poor and the
vulnerable, have equal rights to economic resourc-
es…”), 5.a (“[to] undertake reforms to give women
equal rights to economic resources, as well as access
to ownership and control over land and other forms
of property, financial services, inheritance and natural
resources, in accordance with national laws”), and
SDG 11 (“[to] make cities and human settlements
inclusive, safe, resilient and sustainable”).
Transparent municipal institutions via GRB:
Achieving SDGs 1, 5, and 16 in cities
Recent trends in municipal finance have led to
increased recognition of the different needs of men
and women in financing and budgeting. These trends
include decentralization policies to ensure more effi-
cient public service delivery;50
greater emphasis on
land property taxation to raise revenue and imple-
ment urban development; growing popularity of
public–private partnerships; and increasing demands
for accountability and transparency of local gover-
nance, including increased implementation of trans-
parent participatory budgeting methods.51
Institutional transparency denotes the availability and
accessibility of information to citizens on all decisions
and actions made by government; as such, budgets
are an ideal area to focus on governance and
accountability.52
The inclusion of a gender perspec-
tive in decision-making enhances the legitimacy
of governance, in line with SDG 16.7 (“[to] ensure
responsive, inclusive, participatory and representa-
tive decision-making at all levels”) and 16.b (“[to]
promote and enforce non-discriminatory laws and
policies for sustainable development”). It enriches
political processes by contributing new skills, styles,
and visions (see Case Study 4).
Case Study 4: Including women in
decision-making processes53
In Bacolod city in the Philippines, the NGO
Development Through Active Women
Networking (DAWN) Foundation first
helped women stand for and fight local
elections. As a result of DAWN’s activi-
ties, the number of women councilors
increased. The executive director of DAWN
was one of the new councilors. She and
her colleagues recognized the importance
of budgets, and worked together with
gender activists from two other cities in
a GRB initiative. Soon after the research
was finished, a leading member of DAWN
(who was one of the budget researchers)
became the city administrator—the top
official in local government. She and her
colleagues in DAWN and the administra-
tion are now working to implement the
gender-sensitive policies and budgets that
they advocated in their research.](https://image.slidesharecdn.com/c3a97ace-eb6e-4fd6-9ab6-2d03dee3f645-161012131538/85/FCL_HANDBOOK_HiRes-253-320.jpg)
![238 FINANCE FOR CITY LEADERS HANDBOOK
Against Women (CEDAW, promulgated in 1979)55
and the Beijing Declaration and Platform for Action
(promulgated in 1995).56
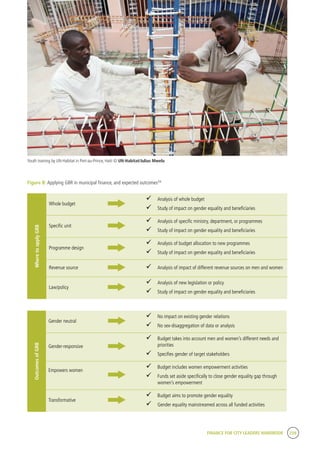
It is important to note that GRB initiatives are not
about dividing government money 50–50 between
the genders. Instead, they look at the full govern-
ment budget from a gender perspective to assess
how it will address the different needs of women
and men, girls and boys, and different groups of
women and men, girls and boys.57
Specifically,
GRB entails the adoption of precise goals, indica-
tors of achievement, data collection, and effective
auditing. GRB initiatives have a number of tools
for application to ensure effective budgeting (see
Figure B); these can be implemented on a stand-
alone basis, or integrated into the entire budget-
ary process. A gender analysis of budget revenues
and expenditures can be conducted at the budget
preparation phase, to assess baselines and set
goals; in the budget monitoring phase; and at the
budget audit and evaluation the budget phase.58
For in-depth examples of using GRB in municipal
finance, see Case Studies 5, 6, and 7.
As a means to promote transparency, GRB initia-
tives are able to provide a way of assessing the
impact of government revenue and expenditure on
women and men, girls and boys. Therefore, these
initiatives can help to improve economic gover-
nance and financial management, while providing
feedback to government on whether it is meeting
the needs of different groups. For those outside
government, GRB can be used to encourage trans-
parency, accountability, and people’s ownership
of the development process. Fundamentally, GRB
initiatives provide information that allows for better
decision-making on how policies and priorities
should be revised to achieve SDG 5.54
Moreover, GRB initiatives align with a number of
international agendas and agreements, and can
ensure the fulfillment of SDG 16.6 (“[to] develop
effective, accountable and transparent institutions
at all levels”). For local authorities in particular, GRB
initiatives can also become a means of meeting
SDG 1.4, 5.5, and 5.a, as well as SDG 11.3. In
addition, these initiatives align with the Convention
on the Elimination of All Forms of Discrimination
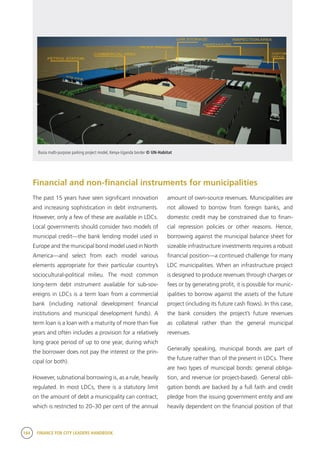
Women fetching water in Bandiagara, Mali © UN-Habitat](https://image.slidesharecdn.com/c3a97ace-eb6e-4fd6-9ab6-2d03dee3f645-161012131538/85/FCL_HANDBOOK_HiRes-254-320.jpg)
![254 FINANCE FOR CITY LEADERS HANDBOOK
the fulfillment of one right often depends, wholly or in part,
upon the fulfillment of other rights. UN-Habitat, Program-
matic Guidance Note on the Promotion and Protection of
Human Rights (Nairobi, UN-Habitat, 2015), p. 10.
23 The human rights principles of equality and non-dis-
crimination mean that individuals are equal as human be-
ings by virtue of the inherent dignity of each human person,
and that every individual is entitled to enjoy human rights
without discrimination of any kind, such as discrimination
due to race, religion, political or other opinion, national
or social origin, disability, property, birth, or other status.
UN-Habitat, Programmatic Guidance Note on the Promo-
tion and Protection of Human Rights (Nairobi, UN-Habitat,
2015), p. 10.
24 The human rights principles of participation and
inclusion imply that all stakeholders, duty-bearers, and
rights-holders, including slum dwellers and other urban
residents in vulnerable situations, should be given the
opportunity to participate in activities and interventions
that affect them. UN-Habitat, Programmatic Guidance Note
on the Promotion and Protection of Human Rights (Nairobi,
UN-Habitat, 2015), p. 10.
25 The human rights principle of accountability requires
that duty-bearers, including city leaders, mayors, and local
government officials, be answerable for the observance of
human rights. Rule of law means that all persons, institu-
tions and entities, public and private, including the state
itself, are accountable to laws that are publicly promulgat-
ed, equally enforced, independently adjudicated, and which
are consistent with international human rights norms and
standards. UN-Habitat, Programmatic Guidance Note on
the Promotion and Protection of Human Rights (Nairobi,
UN-Habitat, 2015), p. 10.
26 Human Rights Council, Role of Local Government
in the Promotion and Protection of Human Rights – Final
report of the Human Rights Council Advisory Committee
(New York, Human Rights Council, 2015), para. 37.
27 Human Rights Council, Role of Local Government
in the Promotion and Protection of Human Rights – Final
report of the Human Rights Council Advisory Committee
(New York, Human Rights Council, 2015), para. 41.
28 Vienna City Council, Gender Mainstreaming in Ur-
ban Planning and Urban Development (Vienna,Vienna City
Council, 2013).
29 UN-Habitat, State of Women in Cities 2012/13
(Nairobi, UN-Habitat, 2013).
30 UNFPA, State of the World Population 2007: Un-
leashing the Potential of Urban Growth (New York, UNFPA,
2007).
31 M. Castells, City, Class and Power (London, Macmil-
lan, 1978), pp. 177–178.
32 UN-Habitat,World Cities Report 2016 (Nairobi,
UN-Habitat, 2016).
33 UNICEF, UNFPA, UNDP, UN Women, “Gender Equal-
ity, UN Conference and You” [training module].Available
from http://www.unicef.org/gender/training/content/scoIn-
dex.html.
34 ECOSOC Resolution 1997/2.
35 D. Budlender and G. Hewitt, Engendering Budgets:
A Practitioners’ Guide to Understanding and Implementing
Gender-Responsive Budgets (London, Commonwealth
Secretariat, 2003).
36 GA Resolution S-23/3 (2000) annex, paragraph
73[c].
37 Case study available in D. Budlender and G. Hewitt,
Engendering Budgets:A Practitioners’ Guide to Under-
standing and Implementing Gender-Responsive Budgets
(London, Commonwealth Secretariat, 2003).
38 ECOSOC Resolution 1997/2
39 D. Budlender and G. Hewitt, Engendering Budgets:
A Practitioners’ Guide to Understanding and Implementing
Gender-Responsive Budgets (London, Commonwealth
Secretariat, 2003).
40 D. Elson and N. Cagatay, Engendering Macro-Eco-
nomic Policy and Budgets for Sustainable Human Develop-
ment (New York, Human Development Report Office, 1999).
41 Rhonda Sharp, Moving Forward: Multiple Strategies
and Guiding Goals (New York, UNIFEM, 2002).
42 IIED and UNFPA, Urbanization, Gender and Urban
Poverty: Paid Work and Unpaid Care Work in the City (n.p.,
IIED & UNFPA, 2012).
43 World Bank, Planning, Connecting, and Financing
Cities-Now: Priorities for City Leaders (Washington,World
Bank, 2013).
44 UN-Habitat,World Cities Report (WCR): Emerging
Futures (Nairobi, UN-Habitat, 2016).](https://image.slidesharecdn.com/c3a97ace-eb6e-4fd6-9ab6-2d03dee3f645-161012131538/85/FCL_HANDBOOK_HiRes-270-320.jpg)
![FINANCE FOR CITY LEADERS HANDBOOK 255
45 UNDESA,World Urbanization Prospects (New York,
UN DESA, 2014).
46 IIED and UNFPA, Urbanization, Gender and Urban
Poverty: Paid Work and Unpaid Care Work in the City (n.p.,
IIED & UNFPA, 2012).
47 IIED and UNFPA, Urbanization, Gender and Urban
Poverty: Paid Work and Unpaid Care Work in the City (n.p.,
IIED & UNFPA, 2012).
48 S. Chant and C. McIlwaine, Cities, Slums and Gender
in the Global South:Towards a Feminised Urban Future
(New York, Routledge, 2016).
49 Beijing Declaration and Platform for Action, Strategic
Objectives and Actions:A.Women and Poverty, 49–51.
50 G.K. Ingram and Y. Hong, Land Policies and their
Outcomes (Cambridge, Mass., Lincoln Institute of Land
Policy, 2007).
51 UN-Habitat, Guide to Municipal Finance (Nairobi,
UN-Habitat, 2009).
52 D. Budlender and G. Hewitt, Engendering Budgets:
A Practitioners’ Guide to Understanding and Implementing
Gender-Responsive Budgets (London, Commonwealth
Secretariat, 2003).
53 Case study available in D. Budlender and G. Hewitt,
Engendering Budgets:A Practitioners’ Guide to Under-
standing and Implementing Gender-Responsive Budgets
(London, Commonwealth Secretariat, 2003).
54 D. Budlender and G. Hewitt, Engendering Budgets:
A Practitioners’ Guide to Understanding and Implementing
Gender-Responsive Budgets (London, Commonwealth
Secretariat, 2003).
55 To view countries that have ratified the Convention,
see: https://treaties.un.org/Pages/ViewDetails.aspx?s-
rc=TREATY&mtdsg_no=IV-8&chapter=4&lang=en.
56 Supported by GA Resolution S-23/3 (2000) annex,
paragraph 73[c].
57 D. Budlender and G. Hewitt, Engendering Budgets:
A Practitioners’ Guide to Understanding and Implementing
Gender-Responsive Budgets (London, Commonwealth
Secretariat, 2003).
58 Austrian Development Cooperation, Making Budgets
Gender-Sensitive:A Checklist for Programme-Based Aid
(Vienna,Austrian Development Cooperation, 2009).
59 Adapted from HELVETAS Swiss Intercooperation,
Gender in Municipal Plans and Budgets: Manual with
Practical Guidelines on Gender Responsive Planning and
Budgeting at Local Level, Based on Experiences with Mu-
nicipalities in Kosovo (Vernier, Switzerland, HELVETAS Swiss
Intercooperation, 2012).
60 UN Women, “Strengthening Local Councils in
Cameroon to Respond to Women and Girls Needs,” 2014,
available from http://gender-financing.unwomen.org/en/
highlights/local-governance-in-cameroon.
61 UN Women, “CSOs in Serbia Demand for Gender
Responsive Local Plans and Budgets,” 2014, available from
http://gender-financing.unwomen.org/en/highlights/csos-in-
serbia-demand-for-gender-responsive-local-plans-and-bud-
gets.
62 UN Women, “Morocco’s Successful Case in Imple-
menting Gender Responsive Budgets,” 2014, available
from http://gender-financing.unwomen.org/en/highlights/
gender-responsive-budgets-case-of-morocco.
63 Youth does not have a defined age.Youth is defined
differently in different countries, organizations, and con-
texts.The UN defines youth as between the ages of 15–32
years.
64 Sustainable Development Goal 11: “Make cities
inclusive, safe, resilient and sustainable.”
65 UN DESA,World Urbanization Prospects:The 2014
Revision (New York, UN DESA, 2014); Douglas Ragan,
Cities of Youth, Cities of Prosperity (Nairobi, UN-Habitat,
2012).
66 An inclusive city promotes a model of interaction
that upholds the rights of every inhabitant.
67 UN-Habitat defines informal settlement as character-
ized by inadequate access to safe water, inadequate access
to sanitation and other infrastructure, poor structural quali-
ty of housing, overcrowding, and insecure residential status.
68 Kenya National Bureau of Statistics, Economic Survey
(Nairobi, Kenya National Bureau of Statistics, 2016).
69 Kenya National Bureau of Statistics, Economic Survey
(Nairobi, Kenya National Bureau of Statistics, 2016).
70 P.Amis, “Squatters or Tenants:The Commer-
cialization of Unauthorized Housing in Nairobi,”World
Development, vol. 12, no. 1, 1984, p. 88; P. Syagga,W.
Mitullah, and S. Karirah-Gitau. Nairobi Situation Analyses
Supplementary Study:A Rapid Economic Appraisal of Rents](https://image.slidesharecdn.com/c3a97ace-eb6e-4fd6-9ab6-2d03dee3f645-161012131538/85/FCL_HANDBOOK_HiRes-271-320.jpg)
![256 FINANCE FOR CITY LEADERS HANDBOOK
in Slums and Informal Settlements (Nairobi, Government of
Kenya and UN-Habitat, 2001), p. 93.
71 P.Amis,A Shanty Town of Tenants:The Commer-
cialization of Unauthorized Housing in Nairobi 1960-1980
(Canterbury, University of Kent, 1983), p. 206.
72 P. Syagga,W. Mitullah, and S. Karirah-Gitau, Nairobi
Situation Analyses Supplementary Study:A Rapid Economic
Appraisal of Rents in Slums and Informal Settlements (Nai-
robi, Government of Kenya and UN-Habitat, 2001), p. 96.
73 P. Syagga,W. Mitullah, and S. Karirah-Gitau, Nairobi
Situation Analyses Supplementary Study:A Rapid Economic
Appraisal of Rents in Slums and Informal Settlements (Nai-
robi, Government of Kenya and UN-Habitat, 2001), p. 21.
74 S. Gulyani, D.Talukdar, and C. Potter, Inside Informal-
ity: Poverty, Jobs, Housing and Services in Nairobi’s Slums
(Washington, D.C.,World Bank, 2006), p.37.
75 P. Syagga,W. Mitullah, and S. Karirah-Gitau, Nairobi
Situation Analyses Supplementary Study:A Rapid Economic
Appraisal of Rents in Slums and Informal Settlements (Nai-
robi, Government of Kenya and UN-Habitat, 2001), p. 5.
76 S. Gulyani, D.Talukdar, and C. Potter, Inside Informal-
ity: Poverty, Jobs, Housing and Services in Nairobi’s Slums
(Washington, D.C.,World Bank, 2006), p. 43.
77 M. Huchzermeyer, “Slum Upgrading in Nairobi With-
in the Housing and Basic Services Market:A Housing Rights
Concern,” Journal of Asian and African Studies (2008), p.
30.
78 S. Gulyani, D.Talukdar, and C. Potter, Inside Informal-
ity: Poverty, Jobs, Housing and Services in Nairobi’s Slums
(Washington, D.C.,World Bank, 2006), pp. 49–53.
79 S. Gulyani, D.Talukdar, and C. Potter, Inside Informal-
ity: Poverty, Jobs, Housing and Services in Nairobi’s Slums
(Washington, D.C.,World Bank, 2006), p. 50.
80 S. Gulyani, D.Talukdar, and M. Kariuki, “Universal
(Non)service? Water Markets, Household Demand and the
Poor in Urban Kenya,” Urban Studies, vol. 42, no. 8 (2005),
p. 1252.
81 S. Gulyani, D.Talukdar, and C. Potter, Inside Informal-
ity: Poverty, Jobs, Housing and Services in Nairobi’s Slums
(Washington, D.C.,World Bank, 2006), p. 51.
82 Central Bureau of Statistics Kenya, Demographic and
Health Survey.Available from http://www.measuredhs.com/
pubs/pub_details.cfm?ID=462&ctry_id=20&SrchTp=type
(accessed 25 August 2008).
83 S. Gulyani, D.Talukdar, and C. Potter, Inside Informal-
ity: Poverty, Jobs, Housing and Services in Nairobi’s Slums
(Washington, D.C.,World Bank, 2006), p. 50.
84 S. Mehrotra, Rogues No More? Water Kiosk Oper-
ators Achieve Credibility in Kibera (Nairobi,World Bank,
2005), p. 6.
85 S. Mehrotra, Rogues No More? Water Kiosk Oper-
ators Achieve Credibility in Kibera (Nairobi,World Bank,
2005), p. 7.
86 S. Mehrotra, Rogues No More? Water Kiosk Oper-
ators Achieve Credibility in Kibera (Nairobi,World Bank,
2005), p. 5.
87 S. Mehrotra, Rogues No More? Water Kiosk Oper-
ators Achieve Credibility in Kibera (Nairobi,World Bank,
2005), p. 7.
88 S. Mehrotra, Rogues No More? Water Kiosk Oper-
ators Achieve Credibility in Kibera (Nairobi,World Bank,
2005), p. 7.
89 A Savings and Credit Cooperative Society (SACCO)
is a member-owned financial cooperative whose primary
objective is to mobilize savings and afford members access
to loans (productive and provident) on competitive terms as
a way of enhancing their socio-economic well-being.
90 UN-Habitat,World Cities Report 2016 (Nairobi,
UN-Habitat, 2016).
91 UNFPA, State of the World Population 2007: Un-
leashing the Potential of Urban Growth (New York, UNFPA,
2007).
92 M. Kaldor, Our Global Institutions Are Not Fit for
Purpose. It’s Time for Reform (London,World Economic
Forum, 2016).
93 D. Budlender and G. Hewitt, Engendering Budgets:
A Practitioners’ Guide to Understanding and Implementing
Gender-Responsive Budgets (London, Commonwealth
Secretariat, 2003).
94 To see which countries have ratified the convention,
visit https://treaties.un.org/Pages/ViewDetails.aspx?s-
rc=TREATY&mtdsg_no=IV-8&chapter=4&lang=en.
95 Supported by GA Resolution S-23/3 (2000) annex,
paragraph 73[c].](https://image.slidesharecdn.com/c3a97ace-eb6e-4fd6-9ab6-2d03dee3f645-161012131538/85/FCL_HANDBOOK_HiRes-272-320.jpg)