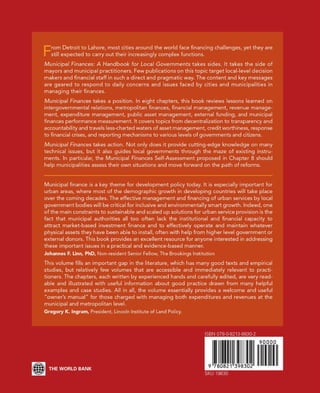
This document provides an overview and table of contents for the book "Municipal Finances: A Handbook for Local Governments". The handbook contains 8 chapters that cover topics related to municipal finances, including intergovernmental finances, metropolitan governance and finance, municipal financial management, managing local revenues and expenditures, managing local assets, managing external resources, and achieving transparency and accountability. It is intended to serve as a reference for local governments on best practices in municipal financial management. The table of contents provides a high-level summary of the topics and issues covered within each chapter.


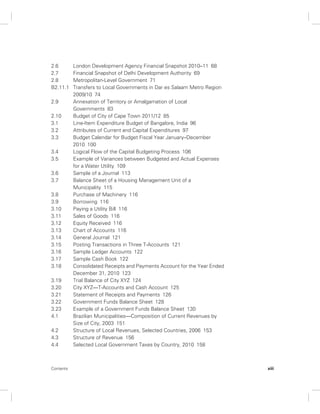


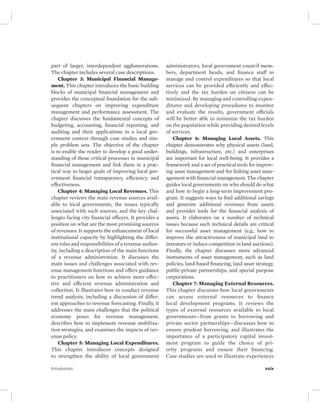

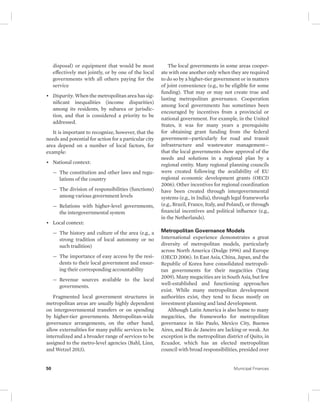
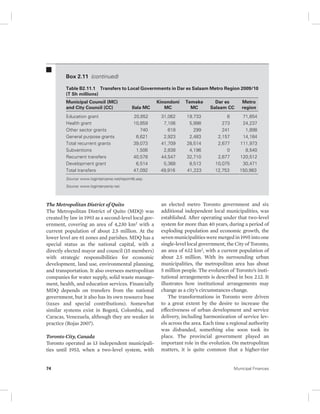
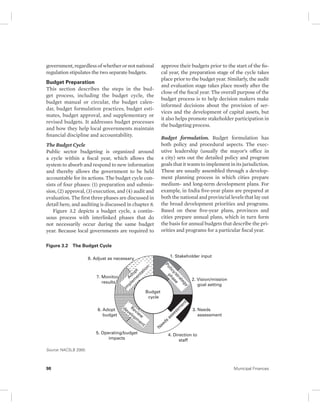
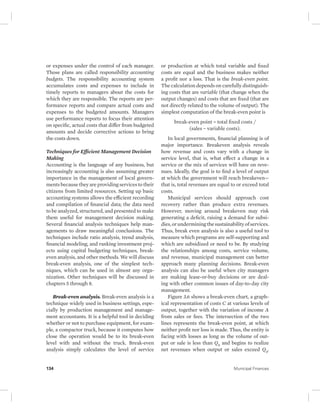

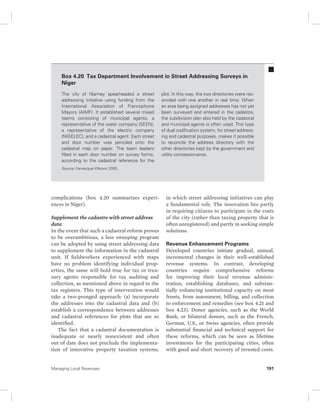
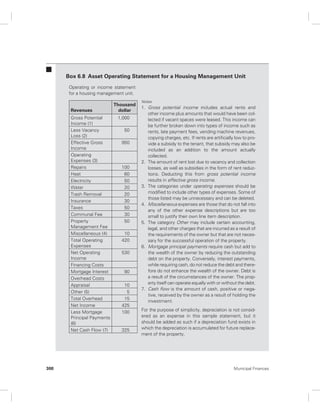
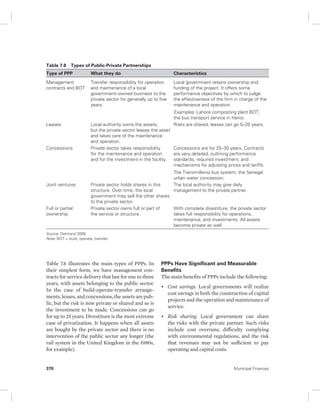
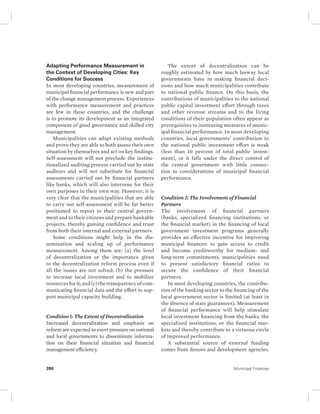
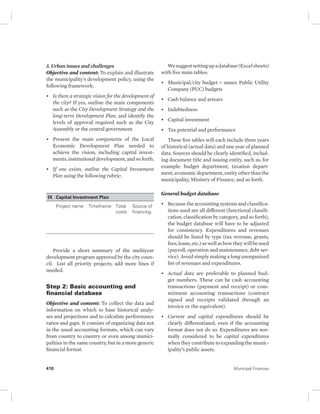
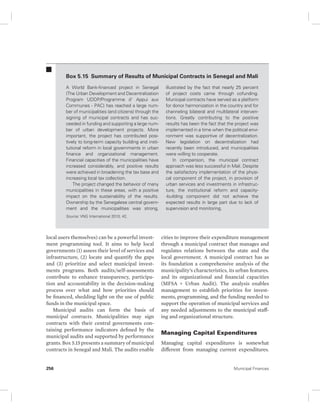
![validity. Conducting a sensitivity analysis
assesses reliability. The key parameters used to
create the estimates are varied, and if this leads
to large changes in the results, the projection is
assumed to have a low degree of reliability.
6. Monitor and compare revenue collection with
the estimates. Monitoring serves both to assess
the accuracy of the projections and to deter-mine
whether there is likely to be any budget
shortfall or surplus.
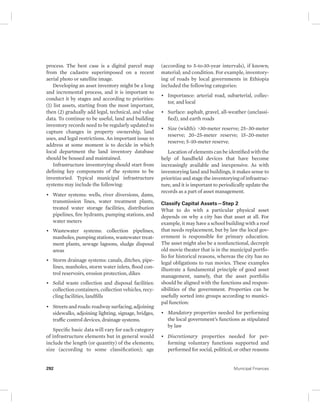
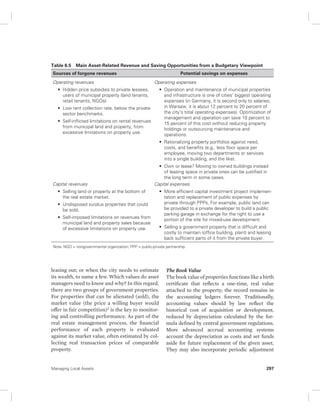
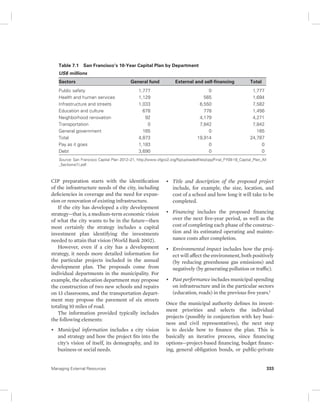
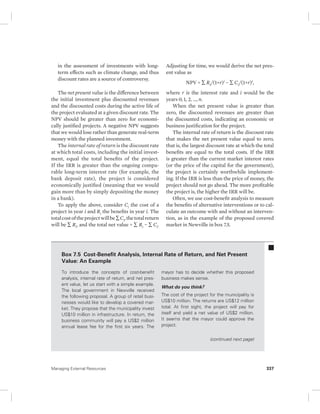
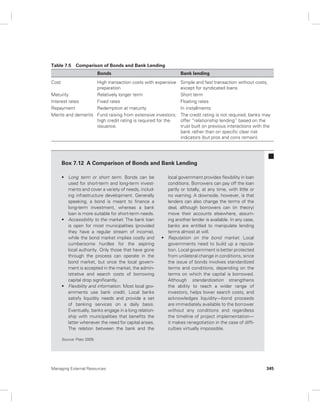
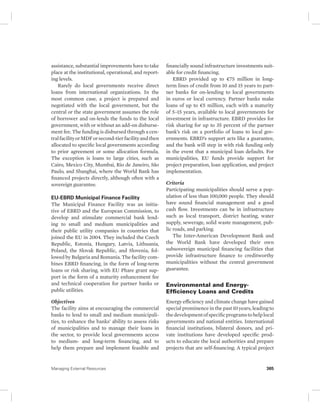
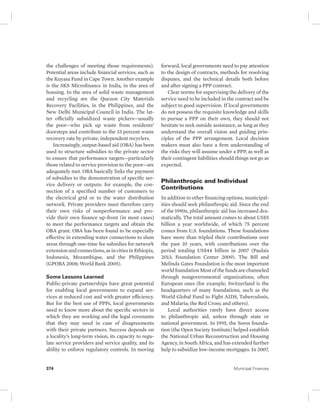
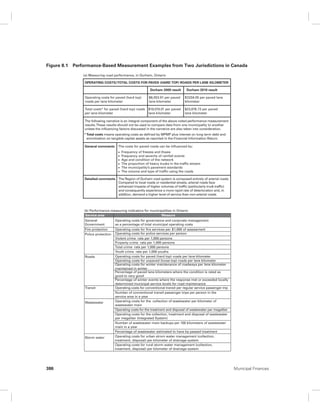
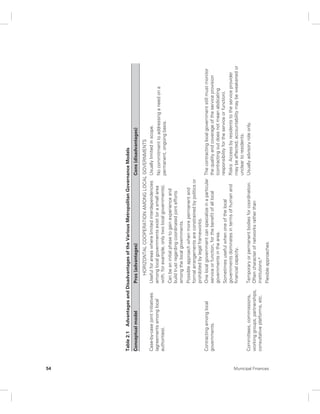
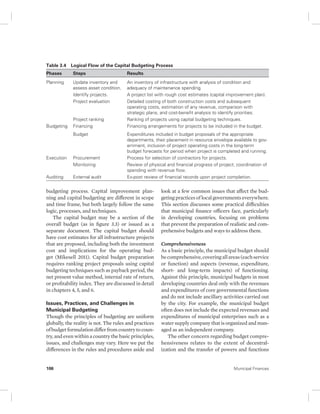
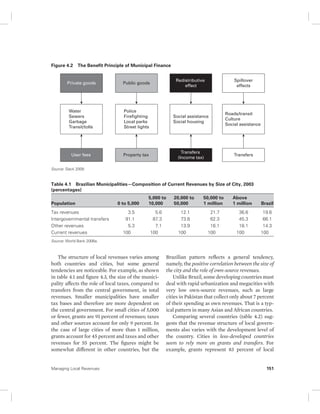
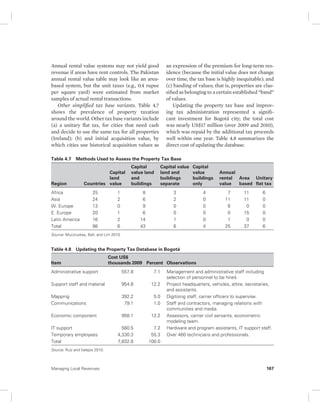
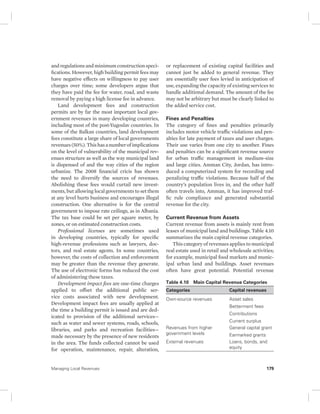
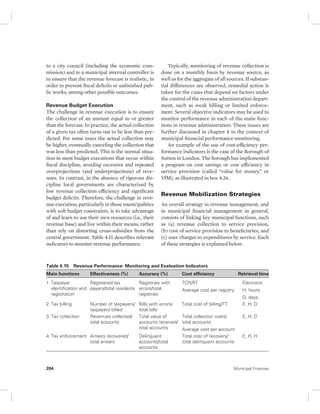
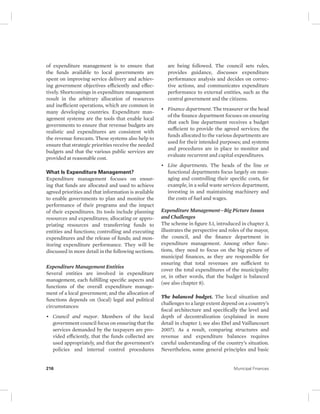
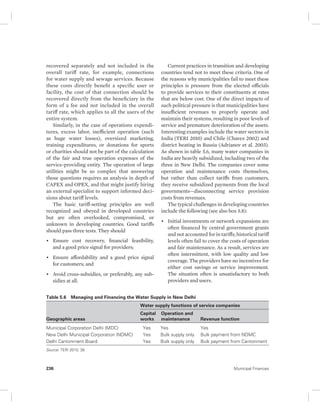
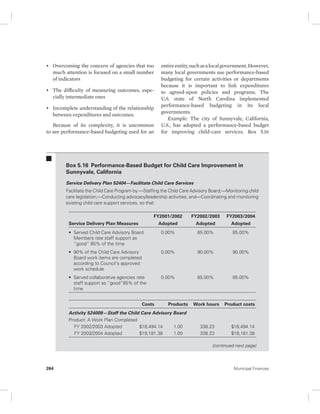
Box 4.24 Methods for Calculating Growth Rates and Projecting Revenues
Years Forward
Percent Change: The first option compares
consecutive time periods using the following
formula:
Percent change = [(CR – PR)/PR]*100, (Eq.1)
where CR = Current Revenue and PR = Past
Revenue.
Average Growth Rate: For a longer period,
the same change formula can be used, but the
total percent would be divided by the number
of years (N):
Average growth rate = {[(CR−PR)/PR] /N}*100
(Eq. 2); for (tn−to).
However, for such longer periods, the
use of the first and last year may be suit-able
only when the revenue changes are
rather uniform. A more accurate growth rate
would be obtained using compound growth
rates.
Compound Annual Growth Rate
(CAGR): CAGR takes into account the first and
the last value of the particular time period but
includes the effect of the annual compound-ing
periods in the final growth rate. The results
are fairly reliable if the changes from one year
to the next are rather smooth. The CAGR can
be computed as CAGR (tn−to) = ([(Vtn/Vto)*1/
(tn−to)] – 1)*100 (Eq. 3), Vto = initial value,
Vtn = last value, and 1/(tn−to) = number of
years or using the basic formula of
VTn = VTo (1 + r)n−1
and solving for r:
r = {exp[ln(VTn /VTo)/N]−1}*100.
Arithmetic Mean Growth Rate:
Alternatively, if the time series is character-ized
by volatility in yearly revenues, the first
and the last year might not be representative;
in such cases, it may be better to use the arith-metic
mean growth rate (also known as the
Arithmetic Mean Return—AMR). The formula
of the AMR is as follows:
AMR = 1/n(X1 + … + Xn), (Eq. 4)
where n = number of time periods of one
year, and Xi = percent revenue change for
period i.; computed as [(CR – PR)/PR]*100
(Eq. 1) i = 1…to… n.
Linear Trend Growth Rate: Another option
is to compute the CAGR of the trend line,
calculated by the least squares method. This
would provide the growth rate of the trend
in revenues for the particular time period. For
example, Excel automatically draws the trend
line, calculates the trend equation, and R2,
which indicates the quality of the forecasting
trend.
198 Municipal Finances](https://image.slidesharecdn.com/28b91a67-02cd-4f0b-9dd0-98c709df8d25-141215172912-conversion-gate02/85/MF-Handbook-230-320.jpg)
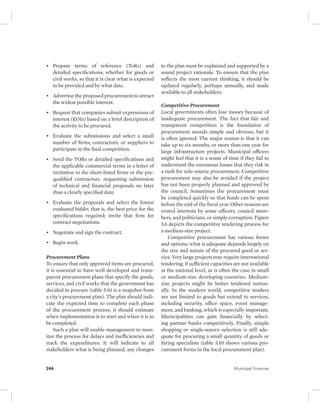
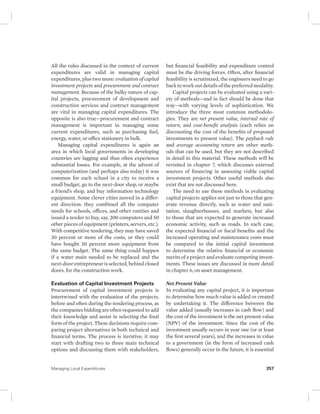
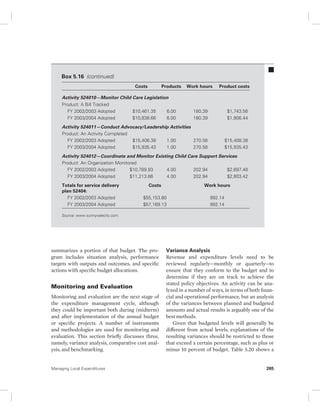
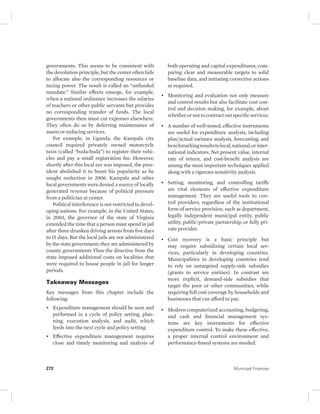
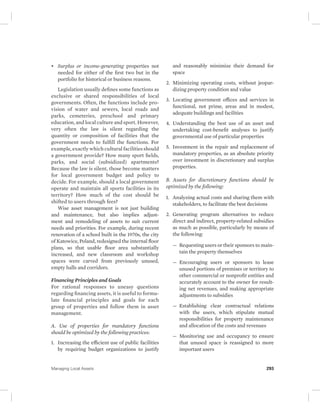
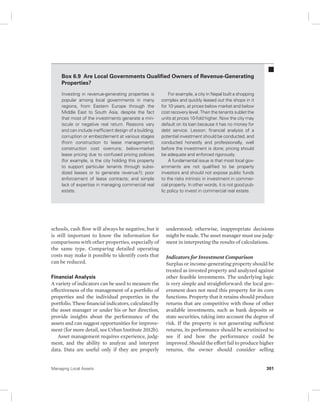
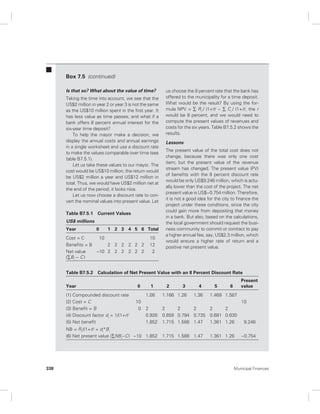
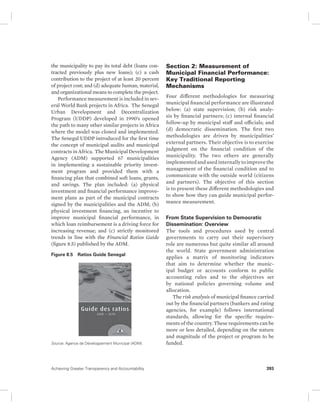
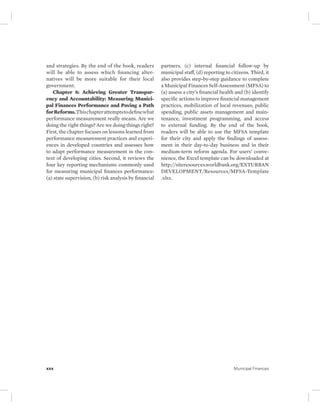
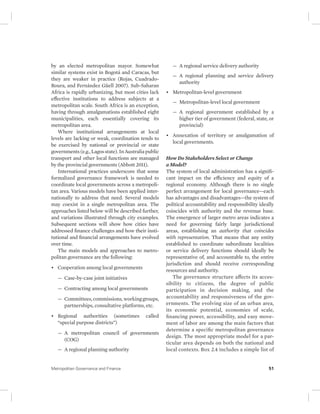
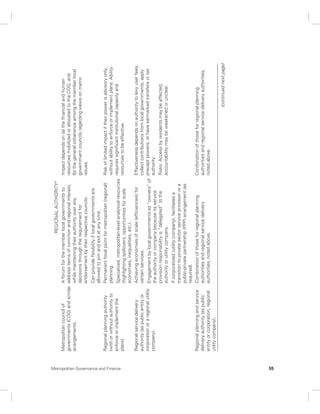
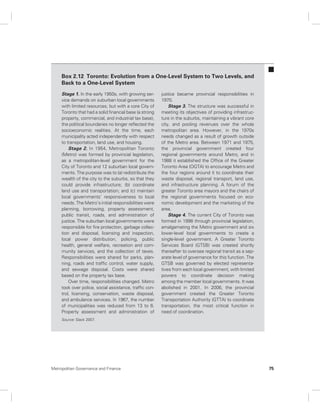
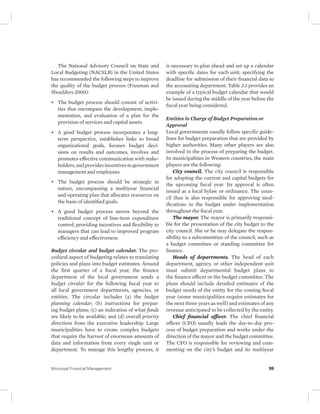
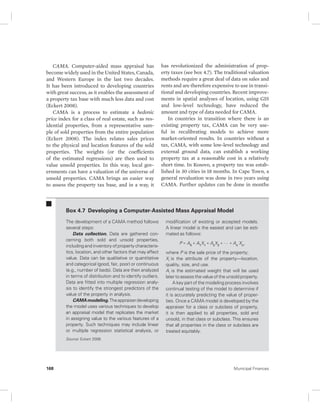
![• Managing capital expenditures requires
long-term planning of both capital investment
projects and financing; transparent and com-petitive
procurement; and strong capacities
for contract management.
• A medium-term expenditure framework is
a robust instrument for supporting effective
expenditure management and for perfor-mance
monitoring. It should be combined
with disciplined audits and financial and
regulatory oversight.
• Expenditure management is not merely a
technical process but also a very political
one. Thus, effective expenditure management
requires good understanding and manage-ment
of the political economy implications of
the plans and decisions.
Notes
1. This section was prepared based on World
Bank 1998, chapter 2.
2. More details are available at http://ec.europa
.eu/europeaid/what/economic-support
/ public-finance/documents/ethiopia
__ addisababa_pefa_report_2010_en.pdf.
3. The entire assessment can be found at
http://ec.europa.eu/ europeaid/what
/economic-support/ public-finance
/ documents/ ethiopia_ _addisababa_pefa
_report_2010_en.pdf.
References
Adrianov, Valentin, Sergei Sivaev, Raymond
Struyk, and Emin Askerov. 2003. Russia’s
Winter Woes: Tariff Setting for Local Utilities
in a Transition Economy. Moscow: Institute for
Urban Economics.
Chavez, Carlos. 2002. “Public-Private Partnership
and Tariff Setting: The Case of Chile.” Paper
for the OECD Global Forum on Sustainable
Development, Paris, April.
Chernyavsky, Andrei, and Karen Vartapetov.
2004. “Municipal Finance Reform and Local
Self Governance in Russia.” Post-communist
Economies 16 (3), September.
DANCED (Danish Co-operation for
Environment and Development). 2002.
“Solid Waste Tariff Setting—Guidelines
for Local Authorities.” Proposal for the
Department of Environmental Affairs and
Tourism, Tanzania, April.
Ebel, R., and F. Vaillancourt. 2007.
“Intergovernmental Assignment of
Expenditure Responsibility.” In The
Kosovo Decentralization Briefing Book.
Prishtina: Kosovo Foundation for an
Open Society.
Helgason, Sigurdur. 1997. International
Benchmarking Experiences from
OECD Countries. Paper presented in
Paris, February.
Kopanyi, M., S. El Daher, and D. Wetzel, eds.
2004. Intergovernmental Finances in Hungary,
A Decade of Experience. Washington, DC:
World Bank Institute.
Shugart, Chris, and Ian Alexander. 2009.
“Tariff Setting Guidelines.” Public-Private
Infrastructure Advisory Facility (PPIAF),
Working Paper No. 8, World Bank,
Washington, DC.
Tausz, Katalin. 2004. “Managing Household
Arrears in Utility Services—Social
Policy Challenges and Responses.” In
Intergovernmental Finances in Hungary,
A Decade of Experience, edited by M. Kopanyi,
S. El Daher, and D. Wetzel. Washington, DC:
World Bank Institute.
TERI (The Energy and Resource Institute
[India]). 2010. Review of Current Practices
in Determining User Charges and Incorporation
of Economic Principles of Pricing of Urban
Water Supply. New Delhi, India. New Delhi:
TERI.
USAID (U.S. Agency for International
Development). 2006. Managing Municipal
Managing Local Expenditures 273](https://image.slidesharecdn.com/28b91a67-02cd-4f0b-9dd0-98c709df8d25-141215172912-conversion-gate02/85/MF-Handbook-305-320.jpg)