External Trade Bulletin, March 2014
•
0 likes•967 views

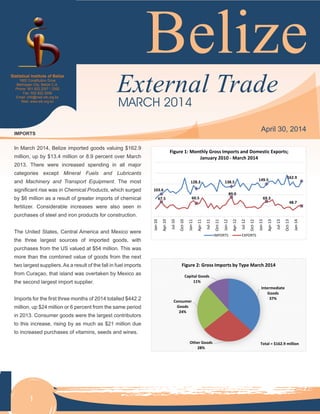
In March 2014, Belize imported goods valuing $162.9 million, up by $13.4 million or 8.9 percent over March 2013.

Recommended
Recommended
More Related Content
What's hot
What's hot (20)
Viewers also liked
Viewers also liked (19)
Similar to External Trade Bulletin, March 2014
Similar to External Trade Bulletin, March 2014 (20)
More from Adele Ramos
More from Adele Ramos (20)
Recently uploaded
Recently uploaded (20)
External Trade Bulletin, March 2014
- 1. Statistical Institute of Belize .............................................................................. Belize External Trade Bulletin March 2014 1 Belize External Trade Statistical Institute of Belize 1902 Constitution Drive Belmopan City, Belize C.A. Phone: 501.822.2207 / 2352 Fax: 502.822.3206 Email: info@mail.sib.org.bz Web: www.sib.org.bz 1 IMPORTS In March 2014, Belize imported goods valuing $162.9 million, up by $13.4 million or 8.9 percent over March 2013. There were increased spending in all major categories except Mineral Fuels and Lubricants and Machinery and Transport Equipment. The most significant rise was in Chemical Products, which surged by $6 million as a result of greater imports of chemical fertilizer. Considerable increases were also seen in purchases of steel and iron products for construction. The United States, Central America and Mexico were the three largest sources of imported goods, with purchases from the US valued at $54 million. This was more than the combined value of goods from the next two largest suppliers.As a result of the fall in fuel imports from Curaçao, that island was overtaken by Mexico as the second largest import supplier. Imports for the first three months of 2014 totalled $442.2 million, up $24 million or 6 percent from the same period in 2013. Consumer goods were the largest contributors to this increase, rising by as much as $21 million due to increased purchases of vitamins, seeds and wines. MARCH 2014 April 30, 2014 103.6 128.3 138.5 149.5 162.9 67.5 60.5 89.0 69.3 48.7 Jan-10 Apr-10 Jul-10 Oct-10 Jan-11 Apr-11 Jul-11 Oct-11 Jan-12 Apr-12 Jul-12 Oct-12 Jan-13 Apr-13 Jul-13 Oct-13 Jan-14 Figure 1: Monthly Gross Imports and Domestic Exports; January 2010 - March 2014 IMPORTS EXPORTS Intermediate Goods 37% Other Goods 28% Consumer Goods 24% Capital Goods 11% Figure 2: Gross Imports by Type March 2014 Total = $162.9 million
- 2. Statistical Institute of Belize .............................................................................. Belize External Trade Bulletin March 2014 2 DOMESTIC EXPORTS Domestic export earnings totalled $48.6 million in March 2014, a decline of $20.6 million or 30 percent over March 2013. This fall was entirely the result of no sales of crude petroleum and a decline in sugar and orange concentrate exports of $7 million and $4 million, respectively. Sales of Red Kidney Beans grew by $3 million owing to higher demand from Jamaica. Exports of marine products increased by $1.6 million, reflecting the continued positive performance of farm shrimp, which was sold primarily to Mexico and the US. Since the start of the year, Belize has exported over $139 million worth of goods made in the country. This is 22 percent or $40 million less than was exported during the same period last year. Among the major commodities for which exports have declined are crude petroleum, sugar and citrus concentrate. There has, however, been a notable increase in exports of marine products. For more information contact Data Dissemination Department at telephone number 822-2207/2352 or e-mail at info@mail.sib.org.bz. An Excel version of the tables contained in this release can be downloaded from our website at www.sib.org.bz 54.0 6.3 4.6 20.8 14.1 5.4 22.8 11.9 5.4 0.6 United States European Union Caricom Mexico China Gross Imports Domestic Exports Figure 3: Merchandise Trade with Selected Countries/Regions; March 2014 Sugar 24% Citrus 16% Marine Products 16% Bananas 13% Red Kidney Beans 12% Other Goods 19% Figure 4: Domestic Exports by Type; March 2014 Total = $48.6 million
- 3. ..............................................................................Statistical Institute of Belize 3 Belize External Trade Bulletin March 2014 Table 1: Value of Belize’s Imports and Exports by Section of the S.I.T.C for March of 2013 and 2014 (BZ $’000) S.I.T.C Section Imports (C.I.F) Exports (F.O.B) Balance of Trade Domestic Re-Exports Total Mar-14 Mar-13 Mar-14 Mar-13 Mar-14 Mar-13 Mar-14 Mar-13 Mar-14 Mar-13 Food and Live Animals 19,820.1 16,278.4 46,001.0 53,027.5 - - 46,001.0 53,027.5 26,180.9 36,749.2 Beverages and Tobacco 4,372.7 3,273.5 5.6 14.6 1,324.3 376.1 1,329.9 390.7 -3,042.9 -2,882.8 Crude Materials 2,151.6 1,482.4 1,871.1 1,054.9 - 101.2 1,871.1 1,156.2 -280.4 -326.2 Mineral Fuels & Lub. 25,511.5 27,988.8 37.6 14,834.5 2,237.1 2,316.7 2,274.7 17,151.2 -23,236.8 -10,837.6 Oils and Fats 1,137.1 1,132.7 24.4 - - - 24.4 - -1,112.7 -1,132.7 Chemical Products 17,123.7 11,091.7 615.1 233.3 47.3 44.3 662.4 277.6 -16,461.4 -10,814.1 Manufactured Goods 19,912.5 17,975.3 69.6 132.9 873.7 466.5 943.3 599.4 -18,969.2 -17,375.9 Mach. & Transp. Eqt 28,725.5 33,265.0 - - 822.1 958.0 822.1 958.0 -27,903.4 -32,307.0 Other Manufactures 12,440.2 8,248.5 53.5 14.8 1,149.4 0.0 1,202.9 14.8 -11,237.3 -8,233.7 Commodities n.e.s 555.2 - - - - - - - -555.2 - Commercial Free Zone 23,883.9 23,061.6 - - 1,692.0 11,225.3 1,692.0 11,225.3 N.A N.A. Export Processing Zones 6,649.5 5,343.2 - - - - - - -6,649.5 -5,343.2 Personal Goods 634.4 326.3 - - 11.1 156.3 11.1 156.3 -623.4 -170.0 Total 162,917.9 149,467.4 48,677.9 69,312.6 8,157.0 15,644.5 56,834.9 84,957.0 -83,891.1* -52,674.1* Source: Statistical Institute of Belize Figures may not add up to total due to rounding *Excluding CFZ figures. Table 2: Value of Belize’s Imports and Exports by Major Trading Partners for March of 2013 and 2014 (BZ $ ‘000) Country Imports (C.I.F) Exports (F.O.B) Domestic Re-Exports Total Mar-14 Mar-13 Mar-14 Mar-13 Mar-14 Mar-13 Mar-14 Mar-13 United States of America 54,040.2 54,441.2 5,352.1 23,297.3 4,836.6 3,252.4 10,188.7 26,549.7 Mexico 20,767.4 16,031.9 5,408.2 2,029.5 39.7 521.3 5,447.9 2,550.7 United Kingdom 1,942.3 574.3 16,608.2 23,493.6 348.2 139.5 16,956.4 23,633.2 Other European Union 4,369.3 2,681.4 6,235.5 6,595.4 100.8 23.2 6,336.3 6,618.6 Panama 7,106.5 5,949.3 5.6 - - 812.6 5.6 812.6 Costa Rica 2,663.6 2,476.0 - 3.2 - - - 3.2 Other Central America 20,637.5 14,084.0 236.3 532.7 309.2 800.0 545.5 1,332.7 Caricom 4,558.5 4,240.7 11,903.8 10,771.9 407.5 423.2 12,311.3 11,195.1 Canada 1,323.3 478.0 76.3 48.3 0.7 1.0 77.0 49.3 Curacao 19,152.0 24,865.6 - - - 32.6 - 32.6 China 14,053.0 11,827.8 639.9 - 870.2 3,116.9 1,510.1 3,116.9 Other 12,304.5 11,817.1 2,212.0 2,540.6 1,244.2 6,521.8 3,456.2 9,062.5 Total 162,917.9 149,467.4 48,677.9 69,312.6 8,157.0 15,644.5 56,834.9 84,957.0 Source: Statistical Institute of Belize Figures may not add up to total due to rounding
- 4. Statistical Institute of Belize .............................................................................. Belize External Trade Bulletin March 2014 4 Table 3: Value of Belize’s Caricom Imports and Exports by Section of The S.I.T.C for March of 2013 and 2014 (BZ $ ‘000) S.I.T.C Section Imports (C.I.F) Exports (F.O.B) Balance of Trade Domestic Re-Exports Total Mar-14 Mar-13 Mar-14 Mar-13 Mar-14 Mar-13 Mar-14 Mar-13 Mar-14 Mar-13 Food and Live Animals 440.1 202.1 2,667.5 4,939.3 30.8 - 2,698.3 4,939.3 2,258.2 4,737.2 Beverages and Tobacco 1,536.6 2,048.7 0.0 - 3.6 - 3.7 - -1,533.0 -2,048.7 Crude Materials 0.1 - 59.9 - - - 59.9 - 59.8 0.0 Chemical Products 415.3 464.1 - - - - - - -415.3 -464.1 Manufactured goods 2,387.4 1,572.6 37.3 87.8 192.9 878.9 230.2 966.8 -2,157.3 -605.8 Mach. & Transp. Eqt 705.0 298.2 - - - - - - -705.0 -298.2 Oth. Manufactures 213.5 189.8 - - - - - - -213.5 -189.8 Commercial Free Zone - 106.7 - - - 21.0 - 21.0 N.A N.A Export Processing Zones 0.3 - - - - - - - -0.3 0.0 Personal Goods - 2.1 - - 6.1 - 6.1 - 6.1 -2.1 Total 5,698.5 4,884.3 2,764.7 5,027.1 233.4 899.9 2,998.2 5,927.0 -2,700.4* 1,128.5* Source: Statistical Institute of Belize Figures may not add up to total due to rounding *Excluding CFZ figures. Table 4: Value of Belize’s Imports and Exports to Caricom Countries for March of 2013 and 2014 (BZ $ ‘000) S.I.T.C Section Imports (C.I.F) Exports (F.O.B) Domestic Re-Exports Total Mar-14 Mar-13 Mar-14 Mar-13 Mar-14 Mar-13 Mar-14 Mar-13 Antigua & Barbuda 4.0 - 34.6 - - - 34.6 - Barbados 661.3 158.5 138.7 418.8 0.7 - 139.5 418.8 Dominica 1.3 - - - - - - - Grenada 132.3 - - - 6.1 - 6.1 - Guyana 358.1 100.8 463.4 1,073.1 - - 463.4 1,073.1 Haiti - 0.0 - - - - - - Jamaica 2,207.1 2,127.6 1,490.3 2,292.7 226.6 878.9 1,717.0 3,171.6 St-Kitts & Nevis 67.8 - - - - - - - St-Lucia 265.3 385.7 2.7 - - - 2.7 - Surinam 0.4 - - - - - - - Trinidad & Tobago 2,000.9 2,111.7 635.0 1,242.5 - 21.0 635.0 1,263.5 TOTAL 5,698.5 4,884.3 2,764.7 5,027.1 233.4 899.9 2,998.2 5,927.0 Source: Statistical Institute of Belize Figures may not add up to total due to rounding
- 5. ..............................................................................Statistical Institute of Belize 5 Belize External Trade Bulletin March 2014 Table 5: Belize’s Major Domestic Exports by Value of the Total Gross Domestic Exports for March of 2013 and 2014 and January to March of 2013 and 2014 (BZ $ ‘000) Commodity March January - March 2014 2013 2014 2013 Marine Products Lbs '000 1,101.4 1,252.1 3,467.9 3,208.2 Value 6,585.2 4,953.7 22,108.5 17,279.3 Sugar L/Ton 11,083.6 18,039.5 19,449.4 34,858.7 Value 11,855.5 19,169.8 19,618.5 36,507.0 Molasses Gals '000 1,076.8 1,018.7 1,113.3 1,109.3 Value 710.4 1,080.8 737.7 1,148.6 Orange Concentrate Gals '000 255.8 470.1 999.4 1,295.3 Value 5,349.7 9,090.8 20,798.2 26,012.8 Grapefruit Concentrate Gals '000 77.7 36.7 109.3 215.6 Value 1,639.5 884.0 2,407.5 5,158.8 Bananas M/Ton 7,288.4 7,080.7 20,680.3 22,356.1 Value 6,507.6 6,322.1 18,464.9 19,961.1 Sawn Wood Bd Ft '000 210.3 149.2 256.5 191.1 Value 1,623.9 943.0 2,024.0 1,219.6 Papayas Lbs '000 1,822.8 5,394.3 6,430.6 13,833.6 Value 695.1 1,981.7 2,450.5 5,028.9 Crude Oil Gallons '000 - 2,849.8 5,659.7 8,499.0 Value - 14,834.5 27,047.0 44,848.9 Other Export Value 13,711.0 10,052.2 23,634.7 22,040.1 Total Value 48,677.9 69,312.6 139,291.5 179,205.0 Source: Statistical Institute of Belize
- 6. Statistical Institute of Belize .............................................................................. Belize External Trade Bulletin March 2014 6 Table 6: Value of Belize’s Other Exports for March 2013 and 2014 and January to March 2013 and 2014 (BZ $ ‘000) Commodity March January - March 2014 2013 2014 2013 Pepper Sauce Lbs 135.6 69.5 281.4 216.2 Value 301.6 186.7 653.1 556.0 Orange Oil Lbs 463.9 210.5 842.8 1,018.4 Value 612.9 187.2 870.0 1,173.4 Grapefruit Oil Lbs - 0.6 0.6 1,018.4 Value - 5.9 5.9 607.3 R.K. Beans Lbs 2,912.4 1,877.6 3,194.9 2,471.3 Value 5,600.5 2,625.8 6,113.7 3,277.4 Black Eye Peas Lbs 567.5 343.5 1,393.7 919.8 Value 494.8 248.0 1,209.7 765.5 Pulp Cells Lbs 0.9 232.2 212.1 1,951.4 Value 0.9 171.6 1,209.7 1,213.9 Animal Feed Lbs 11,994.6 21,181.8 28,482.2 45,142.5 Value 2,378.6 4,734.3 6,055.4 10,210.2 Corn Meal Lbs 675.0 714.7 2,011.0 2,021.0 Value 327.9 379.3 976.6 1,069.5 Other Value Value 3,993.6 1,513.5 6,540.8 3,166.9 Total Value 13,711.0 10,052.2 23,634.7 22,040.1 Source: Statistical Institute of Belize
- 7. ..............................................................................Statistical Institute of Belize 7 Belize External Trade Bulletin March 2014 Table 7: Direction of Trade for Selected Countries for March of 2013 and 2014 (BZ $ ‘000) Country Imports (C.I.F) Exports (F.O.B) Domestic Re-Exports Total Mar-14 Mar-13 Mar-14 Mar-13 Mar-14 Mar-13 Mar-14 Mar-13 United Arab Emirates 50.8 299.8 - - - 99.4 - 99.4 Republic Of Austria 881.5 305.3 - - - - - - Brazil 514.8 286.9 - - - - - - Chile 485.4 369.3 - - 231.5 1.7 231.5 1.7 Germany,Fedl.Rep.of 237.5 431.7 311.5 10.0 1.2 7.4 312.7 17.5 Denmark 566.0 772.3 - - - - - - Guatemala 13,959.3 10,610.6 201.4 437.2 132.6 800.0 334.1 1,237.2 Honduras 4,071.7 1,737.1 - 33.8 164.8 - 164.8 33.8 India 1,544.8 2,686.9 18.8 - 423.2 5,443.6 442.0 5,443.6 Japan 1,810.2 1,543.9 275.6 379.8 13.6 - 289.3 379.8 South Korea 1,230.9 739.5 - - - - - - Lithuania 315.5 12.8 - - 17.3 15.3 17.3 15.3 Malaysia 287.8 148.6 - - - - - - Netherlands (Holland) 1,559.4 429.1 3,899.6 4,224.5 2.8 - 3,902.4 4,224.5 Russian Federation 0.4 - - - - - - - El Salvador 2,464.3 1,692.7 34.9 61.8 - - 34.9 61.8 Thailand 988.3 1,172.8 - - - - - - New Taiwan 354.7 561.5 240.6 83.6 120.9 246.8 361.6 330.4 Venezuela 2.0 - - - - - - - Vietnam 548.5 328.7 - - 116.5 - 116.5 - Source: Statistical Institute of Belize
- 8. Statistical Institute of Belize .............................................................................. Belize External Trade Bulletin March 2014 8 Table 9: Value of Belize’s Imports and Exports by Major Trading Partners for January to March of 2013 and 2014 (BZ $ ‘000) Country Imports (C.I.F) Exports (F.O.B) Domestic Re-Exports Total Jan-Mar Jan-Mar Jan-Mar Jan-Mar Jan-Mar Jan-Mar Jan-Mar Jan-Mar 2014 2013 2014 2013 2014 2013 2014 2013 United States of America 134,743.7 137,000.6 46,897.4 72,051.2 13,756.1 19,828.8 60,653.5 91,880.0 Mexico 49,840.0 45,618.4 15,382.9 4,913.6 448.3 959.0 15,831.2 5,872.7 United Kingdom 7,162.6 4,417.2 32,676.1 51,491.4 539.2 604.1 33,215.3 52,095.5 Other European Union 12,680.4 11,900.0 18,846.4 19,081.8 296.1 46.8 19,142.5 19,128.6 Panama 12,318.7 11,840.7 5.6 5.6 5.5 1,367.0 11.1 1,372.6 Costa Rica 5,442.8 7,480.0 - 6.1 - 2.0 - 8.1 Other Central America 45,269.6 39,825.1 1,129.2 1,815.7 808.2 2,842.8 1,937.4 4,658.5 Caricom 14,790.0 12,000.1 19,473.9 23,619.8 1,077.2 1,328.8 20,551.1 24,948.6 Canada 3,801.0 2,430.8 115.0 138.9 254.2 119.2 369.2 258.1 Curacao 61,617.9 59,553.9 - - - 32.6 - 32.6 China 44,338.3 44,056.8 702.2 35.4 2,651.8 9,346.4 3,354.0 9,381.8 Other 50,177.5 41,880.3 4,062.7 6,045.5 3,073.5 13,521.9 7,136.2 19,567.3 TOTAL 442,182.3 418,003.9 139,291.5 179,205.0 22,910.2 49,999.4 162,201.7 229,204.4 Source: Statistical Institute of Belize Figures may not add up to total due to rounding Table 8: Value of Belize’s Imports and Exports by Section of the S.I.T.C for January to March of 2013 and 2014 (BZ $ ‘000) S.I.T.C Section Imports (C.I.F) Exports (F.O.B) Balance of Trade Domestic Re-Exports Total Jan-Mar Jan-Mar Jan-Mar Jan-Mar Jan-Mar Jan-Mar Jan-Mar Jan-Mar Jan-Mar Jan-Mar 2014 2013 2014 2013 2014 2013 2014 2013 2014 2013 Food and Live Animals 49,474.2 47,637.9 107,272 130,243.5 239.5 131.6 107,511.4 130,375.1 58,037.2 82,737.2 Beverages and Tobacco 14,304.0 10,501.3 23 90.2 2,492.4 1,328.5 2,514.9 1,418.7 -11,789.1 -9,082.7 Crude Materials 5,455.1 3,813.7 2,681 1,530.5 0.1 411.1 2,680.6 1,941.6 -2,774.5 -1,872.1 Mineral Fuels & Lub. 75,269.0 69,938.9 27,163 44,848.9 6,155.8 6,284.0 33,319.3 51,132.9 -41,949.8 -18,806.0 Oils and Fats 3,563.0 3,283.9 27 - 0.1 - 26.8 - -3,536.1 -3,283.9 Chemical Products 37,574.2 32,818.1 1,857 2,143.9 211.6 431.0 2,069.0 2,574.9 -35,505.2 -30,243.2 Manufactured goods 50,050.1 50,301.0 204 321.1 1,847.4 2,071.6 2,051.7 2,392.6 -47,998.4 -47,908.3 Mach. & Transp. Eqt 87,754.3 76,931.1 - - 3,482.1 10,257.1 3,482.1 10,257.1 -84,272.2 -66,674.0 Oth. Manufactures 32,978.5 25,186.2 65 27.0 2,180.3 938.1 2,244.9 965.1 -30,733.6 -24,221.1 Commodities n.e.s 555.2 - - - - - - - -555.2 0.0 Commercial Free Zone 65,884.9 77,811.2 - - 6,040.7 27,854.3 6,040.7 27,854.3 N.A. N.A. Export Processing Zones 17,429.0 17,969.8 - - - - - - -17,429.0 -17,969.8 Personal Goods 1,890.8 1,810.8 - - 260.2 292.1 260.2 292.1 -1,630.6 -1,518.7 Total 442,182.3 418,003.9 139,291.5 179,205.0 22,910.2 49,999.4 162,201.7 229,204.4 -220,136.5* -138,842.6* Source: Statistical Institute of Belize Figures may not add up to total due to rounding *Excluding CFZ figures.
- 9. ..............................................................................Statistical Institute of Belize 9 Belize External Trade Bulletin March 2014 Table 11: Value of Belize’s Imports and Exports to Caricom Countries for January to March of 2013 and 2014 (BZ $ ‘000) S.I.T.C Section Imports (C.I.F) Exports (F.O.B) Domestic Re-Exports Total Jan-Mar Jan-Mar Jan-Mar Jan-Mar Jan-Mar Jan-Mar Jan-Mar Jan-Mar 2014 2013 2014 2013 2014 2013 2014 2013 Antigua & Barbuda 4.0 - 34.6 - - - 34.6 - Barbados 1,107.7 309.6 235.9 513.9 0.7 - 236.6 513.9 Dominica 251.1 169.7 - - 15.8 - 15.8 - Grenada 132.7 0.2 - - 6.1 - 6.1 - Guyana 502.5 153.1 1,649.3 2,129.2 - - 1,649.3 2,129.2 Haiti - 0.0 - - - - - - Jamaica 3,208.6 2,681.0 3,587.6 3,344.0 645.8 878.9 4,233.4 4,222.9 St. Kitts & Nevis 194.9 - - - 0.2 - 0.2 - St. Lucia 488.6 653.4 2.7 - - 5.7 2.7 5.7 Montserrat - - - - - - Suriname 14.7 - 427.1 180.8 - - 427.1 180.8 Trinidad & Tobago 4,326.8 3,792.5 1,632.9 6,680.1 1.1 21.0 1,634.0 6,701.1 St Vincent & Gren. - - - - - - TOTAL 10,231.5 7,759.5 7,570.2 12,847.9 669.7 905.6 8,239.9 13,753.5 Source: Statistical Institute of Belize Figures may not add up to total due to rounding Table 10: Value of Belize’s Caricom Imports and Exports by Section of the S.I.T.C for January to March of 2013 and 2014 (BZ $ ‘000) S.I.T.C Section Imports (C.I.F) Exports (F.O.B) Balance of Trade Domestic Re-Exports Total Jan-Mar Jan-Mar Jan-Mar Jan-Mar Jan-Mar Jan-Mar Jan-Mar Jan-Mar Jan-Mar Jan-Mar 2014 2013 2014 2013 2014 2013 2014 2013 2014 2013 Food and Live Animals 615.9 309.8 7,451.0 12,740.3 30.8 - 7,481.8 12,740.3 6,865.9 12,430.4 Beverages and Tobacco 4,069.8 3,757.8 0.0 - 3.6 - 3.7 - -4,066.1 -3,757.8 Crude Materials 0.1 - 59.9 - - - 59.9 - 59.8 0.0 Mineral Fuels & Lub. - - - - 47.9 - 47.9 - 47.9 0.0 Oils and Fats - 1.0 - - - - - - 0.0 -1.0 Chemical Products 1,037.3 848.5 22.0 19.8 - - 22.0 19.8 -1,015.4 -828.7 Manufactured goods 3,204.8 1,880.2 37.3 87.8 580.0 884.6 617.3 972.5 -2,587.5 -907.7 Mach. & Transp. Eqt 765.6 524.3 - - - - - - -765.6 -524.3 Oth. Manufactures 439.5 278.2 - - 1.1 - 1.1 - -438.4 -278.2 Commodities n.e.s - - - - - - - - 0.0 0.0 Commercial Free Zone 97.9 106.7 - - - 21.0 - 21.0 N.A. N.A. Export Processing Zones 0.5 50.8 - - - - - - -0.5 -50.8 Personal Goods - 2.1 - - 6.3 - 6.3 - 6.3 -2.1 TOTAL 10,231.5 7,759.5 7,570.2 12,847.9 669.7 905.6 8,239.9 13,753.5 -1,893.7* 6,079.8* Source: Statistical Institute of Belize Figures may not add up to total due to rounding *Excluding CFZ figures.
- 10. Statistical Institute of Belize .............................................................................. Belize External Trade Bulletin March 2014 10 Table 12: Value of Belize’s Imports by Economic End-Use (BZ $ ‘000) Imports Annual March January - March 2012 2013 2014 2013 2014 2013 Consumer Goods 11: Food and beverages 154,315.3 165,835.4 18,623.5 11,362.2 47,765.8 37,427.4 12: Transport equipment 14,258.0 14,521.1 1,077.5 910.6 4,577.5 3,009.5 13: Durable goods 41,841.3 59,262.7 3,744.9 3,249.8 8,984.1 9,219.9 14: Semi-durable goods 39,624.3 44,634.8 3,899.3 2,658.7 11,713.3 7,357.0 15: Non-durable goods 107,261.7 124,065.4 11,831.3 8,910.2 28,323.9 23,705.9 Intermediate Goods 21: Food and beverages 39,690.1 34,995.3 2,117.7 5,264.5 6,582.5 10,733.1 22: Fuels and lubricants 169,681.9 169,906.0 15,684.5 15,321.5 47,240.2 37,651.3 23: Parts and accessories 90,615.8 86,241.6 6,304.3 8,098.3 19,338.5 19,785.1 24: Industrial supplies nes 345,157.3 379,929.3 35,792.6 27,228.0 84,820.0 81,806.9 Capital Goods 31: Transport equipment 37,309.5 56,417.3 4,739.4 6,535.8 17,872.2 12,514.7 32: Other capital goods 123,540.0 156,638.7 14,114.9 15,514.3 38,330.8 37,012.4 Other Goods 41: Passenger motor cars 30,258.7 33,520.1 3,361.6 2,775.5 12,120.2 7,445.3 42: Motor spirit 104,036.3 106,805.2 8,887.1 12,788.5 26,763.6 32,498.5 43: Goods to EPZ 64,891.7 80,633.4 6,649.5 5,343.2 17,429.0 17,969.8 44: Goods to CFZ 351,329.6 332,776.3 23,883.9 23,061.6 65,884.9 77,811.2 45: Household goods 5,366.7 6,947.2 634.4 326.3 1,890.8 1,810.8 46: Goods nes 3,070.6 2,517.8 1,571.5 118.7 2,544.8 245.2 Total Imports 1,722,248.9 1,855,647.6 162,917.9 149,467.4 442,182.3 418,003.9 Total Exports 805,068.9 820,551.7 56,834.9 84,957.0 162,201.7 229,204.4 Visible Trade Gap -629,561.4* -794,618.0* -83,891.1* -52,674.1* -220,136.5* -138,842.6* Source: Statistical Institute of Belize Figures may not add up to total due to rounding *Excluding CFZ figures.
- 11. ..............................................................................Statistical Institute of Belize 11 Belize External Trade Bulletin March 2014 Table 13: Value of Belize’s Imports by Economic End Use for the Previous Five Quarters (BZ $ ‘000) Imports Quarter 1 Quarter 2 Quarter 3 Quarter 4 Quarter 1 2013 2013 2013 2013 2014 Consumer Goods 11. Food and beverages 37,427.4 41,383.6 40,333.1 46,691.3 47,765.8 12. Transport equipment 3,009.5 3,895.3 3,622.4 3,993.9 4,577.5 13. Durable goods 9,219.9 11,757.4 9,731.8 28,553.5 8,984.1 14. Semi-durable goods 7,357.0 11,356.6 11,207.6 14,713.5 11,713.3 15. Non-durable goods 23,705.9 33,343.1 35,802.3 31,214.1 28,323.9 Intermediate Goods 21. Food and beverages 10,733.1 9,347.5 4,314.4 10,600.4 6,582.5 22. Fuels and lubricants 37,651.3 46,699.3 40,607.5 44,947.8 47,240.2 23. Parts and accessories 19,785.1 23,267.2 23,046.7 20,142.7 19,338.5 24. Industrial supplies nes 81,806.9 104,048.3 96,110.1 97,964.0 84,820.0 Capital Goods 31. Transport equipment 12,514.7 14,203.8 14,928.8 14,770.0 17,872.2 32. Other capital goods 37,012.4 43,427.8 37,225.3 38,973.2 38,330.8 Other Goods 41. Passenger motor cars 7,445.3 8,534.9 7,828.7 9,711.3 12,120.2 42. Motor spirit 32,498.5 17,711.2 29,251.1 27,344.5 26,763.6 43. Goods to EPZ 17,969.8 18,692.0 24,715.0 19,256.6 17,429.0 44. Goods to CFZ 77,811.2 84,811.0 87,084.8 83,069.3 65,884.9 45. Household goods 1,810.8 1,370.9 2,265.3 1,500.2 1,890.8 46. Goods nes 245.2 1,450.4 565.2 257.0 2,544.8 Total Imports 418,003.9 475,300.2 468,640.2 493,703.3 442,182.3 Total Exports 229,204.4 254,787.9 183,572.3 152,987.1 162,201.7 Visible Trade Gap -138,842.6* -161,841.7* -214,745.4* -257,646.8* -220,136.5* Source: Statistical Institute of Belize Figures may not add up to total due to rounding *Excluding CFZ figures.