A comprehensive review on passive heat transfer enhancements in pipe exchangers
Experimental study of heat transfer in pulsating turbulent pipe flow
1. Experimental study of heat transfer in pulsating turbulent flow in a pipe
Elsayed A.M. Elshafei, M. Safwat Mohamed, H. Mansour, M. Sakr *
Mechanical Engineering Department, Mansoura University, Faculty of Engineering, Mansoura 35516, Egypt
a r t i c l e i n f o
Article history:
Received 5 February 2007
Received in revised form 12 February 2008
Accepted 31 March 2008
Available online 21 May 2008
Keywords:
Pulsating flow in a pipe
Convective heat transfer
Turbulent flow
a b s t r a c t
Heat transfer characteristics of pulsating turbulent air flow in a pipe heated at uniform heat flux were
experimentally investigated. The experiments were performed over a range of 104
< Re < 4 Â 104
and
6.6 6 f 6 68 Hz. This situation finds applications in modern power generation facilities and industrial pro-
cesses. With installing the oscillator downstream of the tested tube exit, results showed that Nu is
strongly affected by both pulsation frequency and Reynolds number. Its local value either increases or
decreases over the steady flow value. The variation is more pronounced in the entrance region than that
in the downstream fully developed region. It is observed also that the relative mean Nu either increases or
decreases, depending on the frequency range. Although the deviations are small, it seems to be obvious at
higher values of Reynolds number. The obtained heat transfer results are classified according to turbulent
bursting model and looked to be qualitatively consistent with previous investigations.
Ó 2008 Elsevier Inc. All rights reserved.
1. Introduction
There are many engineering practical situations where heat is
being transferred under conditions of pulsating and reciprocating
flows such as the operation of modern power producing facilities
and industrial equipment used in metallurgy, aviation, chemical
and food technology. Cavitations in hydraulic pipelines, pressure
surges and flow of blood are also some of familiar instance of such
flows. The performance of this equipment in thermal engineering
applications is affected by the pulsating flow parameters (Al-Had-
dad and Al-Binally, 1989).
During the past few decades, numerous studies have been de-
voted to this pulsating flow and its associated heat transfer prob-
lems. A review of these studies with emphases on the onset of
turbulence, velocity distribution and pipe flow as well as the heat
transfer characteristics including axial heat transfer enhancement
and convective heat transfer are presented in the following
sections.
Pulsating flows can be produced by reciprocating pump or by
steady flow pump together with some mechanical pulsating de-
vices. It may normally be expected that the heat transfer to or from
the flow would be changed since the pulsation would alter the
thickness of the boundary layer and hence the thermal resistance.
Pulsating flow is assumed to be consisted of a steady Poiseuille
flow and purely oscillatory (Zhao and Cheng, 1998). The amplitude
of the oscillatory velocity is less than the time mean velocity and
flow direction never reverse. Pulsating flow is one of the unsteady
flows that are characterized by periodic fluctuations of the mass
flow rate and pressure.
Most of investigators (Al-Haddad and Al-Binally, 1989; Zhao
and Cheng, 1998; Hesham et al., 2005a; Habib et al., 1999; Gupa
et al., 1982; Barid et al., 1996; Gbadebo et al., 1999; Zheng et al.,
2004; Zohir et al., 2005; Erdal and Gainer, 1979; Habib et al.,
2004, 2002) considered in their studies a small number of operat-
ing variables and confined it to relatively narrow range. As a result,
some investigators reported little increase, no increase, and even
decrease in the rate of heat transfer. These conflicting in results
showed that the heat transfer characteristics in pulsating flow
are still not clearly understood. Due to the complicated nature of
unsteady turbulent flow, too much theoretical investigations are
needed to find a solution for the problems of hydrodynamics and
heat transfer of such a flow. Therefore the experimental investiga-
tion is still the most reliable way to deal with the pulsating flow.
Several researchers have presented experimental, analytical
and numerical studies on the effect of pulsation on heat transfer
characteristics. The characteristic of laminar pulsating flow inside
tube under uniform wall heat flux have been experimentally inves-
tigated by Habib et al. (2002), 6.6 6 f 6 68 Hz. It is reported that an
increase and reduction in Nusselt number are observed, depending
on the values of both the frequency and Reynolds number. Zheng
et al. (2004) used self-oscillator in their investigations and con-
cluded that the convective heat transfer rate is greatly affected
by the configuration of the resonator.
An analytical study on laminar pulsating flow in a pipe by Fag-
hri et al. (1979) reported that higher heat transfer rates are pro-
duced. They related that to the interaction between the velocity
and temperature oscillation which introduces an extra term in
the energy equation that reflects the effect of pulsations. On the
0142-727X/$ - see front matter Ó 2008 Elsevier Inc. All rights reserved.
doi:10.1016/j.ijheatfluidflow.2008.03.018
* Corresponding author.
E-mail addresses: eelshafei@mans.edu.eg (E.A.M. Elshafei), msafwat@mans.
edu.eg (M. Safwat Mohamed), moh_saker1981@yahoo.com (M. Sakr).
International Journal of Heat and Fluid Flow 29 (2008) 1029–1038
Contents lists available at ScienceDirect
International Journal of Heat and Fluid Flow
journal homepage: www.elsevier.com/locate/ijhff
2. other hand, Chang et al. (2004) reported that the pulsation has no
effect on the time averaged Nusselt number.
An investigation to pulsating pipe flow with different amplitude
was carried out by Guo and Sung (1997). In case of small ampli-
tudes, both heat transfer enhancement and reduction were de-
tected, depending on the pulsation frequency. However, with
large amplitudes, the heat transfer rates are always enhanced.
Hemeada et al. (2002) analyzed heat transfer in laminar incom-
pressible pulsating flow, the overall heat transfer coefficient in-
creases with increasing the amplitude and decreases with
increasing the frequency and Prandtl number.
The effect of many parameters on time average Nusselt number
was numerically studied by Cho and Hyun (1990), Moschandreou
and Zamir (1997), Lee et al. (1998), Chattopadhyay et al. (2006)
and Hesham et al. (2005b). It is reported that the increase of Nus-
selt number depends on the value of the pulsation frequency and
its amplitude. With amplitude less than unity, pulsation has no ef-
fect on time averaged Nusselt number (Chattopadhyay et al.,
2006). In the thermally fully developed flow region, a reduction
of the local Nusselt number was observed with pulsation of small
amplitude. However, with large amplitude, an increase in the value
of Nusselt number was noticed.
In summary, the time average Nusselt number of a laminar pul-
sating internal flow may be higher or lower than that of the steady
flow one, depending on the frequency. The discrepancies of heat
transfer rate from that of the steady flow is increased as the veloc-
ity ratio (D) is increased. For hydrodynamically and thermally fully
developed laminar pulsating internal flow, the local heat transfer
rate in the axial locations for X/D < pRe/20 k2
can be obtained based
on a quasi-steady flow (Zhao and Cheng, 1998).
Numerical investigations on turbulent pulsating flow have been
carried out by several researchers (Xuefeng and Nengli, 2005, 2001,
2003). It is reported that there is an optimum Womersly number at
which the rate of heat transfer is enhanced (Xuefeng and Nengli,
2005, 2001). In pulsating turbulent flow through an abrupt pipe
expansion, Said et al. (2003) reported that the percentage enhance-
ment in the rate of heat transfer of about 10 was observed for fluids
having a Prandtl number less than unity.
Experimental investigations on pulsating turbulent pipe flow
have been conducted by many authors (Al-Haddad and Al-Binally,
1989; Hesham et al., 2005a; Barid et al., 1996; Gbadebo et al.,
1999; Zheng et al., 2004; Zohir et al., 2005; Erdal and Gainer, 1979;
Habib et al., 2004, 2002; Faghri et al., 1979). The results of Hesham
et al. (2005a, 1996, 1999, 2004,) showed an increase and reduction
in the mean Nusselt number with respect to that of the steady flow.
Many parameters have an influence on heat transfer character-
istics of pulsating turbulent flow. Among those, pulsation fre-
quency, its amplitude, axial location, Reynolds number, Prandtl
number and pulsator type and its location. In order to understand
the phenomena of the effect of pulsation on the heat transfer coef-
ficient and to resolve these problems of contradictory results, dif-
ferent models of turbulence for pulsating flows were considered.
Two of these models are well known and mostly applied; the qua-
si-steady flow model (Shemer, 1985) and the bursting model (Ha-
bib et al., 1999, 2004; Gbadebo et al., 1999; Zohir et al., 2005).
In order to check whether the steady flow analysis is applicable
to the prediction of heat transfer analysis in a pulsating turbulent
flow, Park et al. (1982) carried out a series of measurements on
heat transfer to a pulsating turbulent flow in a vertical pipe sub-
jected to a uniform heat flux over a range of 1.9 Â 104
6 Re 6 9.5
 104
. Their data are presented in the form of the ratio gm(Nupm/
Nusm) as a function of the Womersly number, k. It is reported that
for the cases of high mean Reynolds number (Re > 5.5 Â 104
), the
experimental data approaches to the quasi-steady predictions.
However, at low mean Reynolds number (Re < 4 Â 104
), the data
show an increasing discrepancy as k is increased.
Nomenclature
A0 dimensionless pulsation amplitude; xmax/D
A area of the orifice meter (m2
)
Cp specific heat capacity of air (J kgÀ1
KÀ1
)
D pipe diameter (m)
f frequency (Hz)
hm mean heat transfer coefficient; (W mÀ2
KÀ1
)
hx local heat transfer coefficient; (W mÀ2
KÀ1
)
k thermal conductivity of air (W mÀ1
KÀ1
)
L length of the test section (m)
Le effective length of the test section (m)
m mass flow rate (kg sÀ1
)
N revolution of rotating valve spindle per minute (rpm)
Num mean Nusselt number; (hm D/k)
Nusx local Nusselt number without pulsation (hsx D/k)
Nupx local Nusselt number with pulsation (hpx D/k)
Nusm mean Nusselt number without pulsation (hsa D/k)
Nupm mean Nusselt number with pulsation (hpa D/k)
Pr Prandtl number
Dp pressure drop across the orifice meter (N mÀ2
)
Q input heat (W)
Qtrans total net heat transfer (W)
Qloss total heat loss through insulation (W)
qo total heat transfer heat flux (W mÀ2
)
Re Reynolds number
Rew kinetic Reynolds number, xD2
/m
Tbi mean inlet air temperature (K)
Tbx local mean temperature (K)
Tsx local pipe surface temperature (K)
x local distance along the test section (m)
xmax amplitude of fluid displacement (m)
umax max cross sectional mean velocity of pulsating flow
(m sÀ1
)
U*
friction velocity (m sÀ1
)
Um Mean velocity of mean flow (m sÀ1
)
UA Amplitude velocity of pulsating component (m sÀ1
)
U time average velocity, UA = (1.63–31.81) (m sÀ1
)
U(t) velocity component at time t (m sÀ1
)
Greek symbols
b (orifice diameter/pipe diameter) ratio
D velocity ratio, umax/us = (A0Rew/2Re)
e velocity ratio = umax/u1
g local relative enhancement ratio, (Nupx/Nusx)
gm average relative Enhancement ratio, (Nupm/Nusm)
k Womersly number, D=2
ffiffiffiffiffiffiffiffi
x=m
p
l dynamic viscosity of air (N s mÀ2
)
m kinematic viscosity (m2
sÀ1)
x angular pulsation frequency (sÀ1
)
x* dimensionless frequency (x D/U*)
Subscripts
b bursting
I inner
m mean
p pulsating state conditions
s steady sate conditions
x local
1030 E.A.M. Elshafei et al. / International Journal of Heat and Fluid Flow 29 (2008) 1029–1038
3. In the previous studies, few of operating parameters are consid-
ered and were confined to relatively narrow range. Thus, in order
to have a complete understanding of introducing pulsation into a
flow with heat transfer, it is necessary to consider various param-
eters and cover a wide range of these controlling parameters.
Therefore, the present work aims to investigate experimentally
the effect of pulsation frequency as well as the Reynolds number
on the heat transfer characteristics of turbulent pulsating pipe flow
over a range of the frequency (6.6–68 Hz) and Reynolds number
(10,850–37,100). The experiments are carried out while the outer
surface of the pipe is subjected to a uniform heat flux.
2. Experimental setup and instrumentation
2.1. Test rig
The experimental facility shown in Fig. 2 is designed and con-
structed to investigate the effect of pulsation on the convective
heat transfer from a heated pipe over a range of 104
< Re < 4 Â
104
. It is an open loop in which air as a working fluid is pumped
and passed the test section to the atmosphere after being heated.
The rig basically consists of three part; the air supply unit with
necessary adoption and measuring devices, the test section and
the pulsating mechanism.
The air supply unit and its accessories consists of an air com-
pressor, storage tanks, flow control valves, orifice meter, settling
chamber and calming joints.
2.1.1. Air supply unit
Air is pumped by a compressor (1) into storage tanks (2), from
which the air is discharged to the system as shown in Fig. 2. The
airflow rate was controlled by a two flow control valves (3) and
(4), placed upstream of a calibrated orifice meter (6) which mea-
sured the flow rate of the air using a U-tube manometer connected
to a two static pressure taps, one 1.0 D upstream and the other 0.5
D down stream of that sharp edged orifice plate. Besides control-
ling the flow, the control valves also served as a major pressure
drop in the system.
The air flow passes through a settling chamber (7) to reduce the
disturbance of the flow in the pipe. Afterward the air was passed
over the test section (9) via the upstream clamping joint (8) and
then exhausted to the atmosphere after being passed through the
pulsating valve (14).
The flow measuring sections as well as rest of test loop were
completely isolated from vibrations source by two flexible connec-
tions (5). The flow enters the test section at uniform temperature
and fully developed turbulent after being stabilized and adjusted.
2.1.2. Test section
The test section (9) is shown schematically in Fig. 3. It is a cop-
per tube of 15.5 mm inner diameter, 22 mm outer diameter and
1200 mm in length (L/Di = 77). The test section is clamped from
both sides by flexile joints.
The pipe wall temperatures are measured by 12 k-type thermo-
couples distributed along the tube surface from outside as shown
in Fig. 2. Thermocouple junctions were fitted into 12 holes along
the outer surface of the pipe, each of 2 mm in diameter and
2.5 mm in depth.
The thermocouple wires were then embedded inside the
grooves milled in the outer pipe surface parallel to its axis by epoxy
collected out of the test section and connected to a multi-channel
temperature recorder via a multipoint switch.
The main heater of 17.3 m total length is a nickel chromium
wire which has a resistivity of 15.5 X/m was divided into four
equal lengths to heat up the test section tube. The tapes of the
heaters were electrically insulated by fitting them inside very duc-
tile Teflon pipes of 0.1 mm thickness and 2 mm in diameter and
wrapped uniformly along the outside tube surface. These heater
tapes were sandwiched by aluminum foils of 0.2 mm thickness
for achieving a uniform heat distribution. Two auto-transformers
were used to supply and control the power of the four electric hea-
ter sections, which are connected in parallel with the required
voltage.
A layer of glass wool insulation of 35 mm thickness was applied
over the heater, followed by a thin sheet of aluminum foil. More-
over, another 45 mm layer of glass wool was applied to assure per-
fect insulation of the tested pipe.
The distribution of thermocouples along the tested tube was
concentrated at the beginning to measure the dramatic change of
the temperature in the entrance region. The locations of these ther-
mocouples relative to pipe diameter are shown in Fig. 2, and are as
0
10
20
30
40
50
U(t)[m/s]
U m
U A
Fig. 1. Variations of inlet velocity.
1 Air compressor 10 Down stream calming
section
2 Storage tanks 11 Pulleys
3 By-pass valve 12 V-belts
4 Flow control valve 13 Electric motor
5 Flexible connection 14 Pulsating valve
6 Orifice meter 15 Voltmeter
7 Settling chamber 16 Auto-transformer
8 Upstream Calming section 17 Digital temperature
recorder
9 Test section
Bench
43 5 5 8
V
6 7 9 10 11 12
13
15 16 17
12
14
Fig. 2. Experimental equipment.
E.A.M. Elshafei et al. / International Journal of Heat and Fluid Flow 29 (2008) 1029–1038 1031
4. follows: X/Di = 0.5, 1.0, 2.0, 3.0, 4.6, 6.3, 8.0, 15.0, 20.0, 35.0, 45.0,
60.0.
The bulk air temperatures at inlet and outlet of the test section
were measured by two k-type thermocouples inserted in two holes
drilled through the flanges at the entrance and exit of this test
section.
2.1.3. Pulsating mechanism
The pulsating mechanism (11)–(14) shown in Fig. 1 is located
down stream at the exit of the tested pipe. It is constructed of three
main parts; an AC electric variable speed motor (13), a variable
speed transmission mechanism 11, 12, and a rotating butterfly
valve (14) of 15.5 mm inner diameter. The valve spindle was con-
nected to the motor through two stepped pulleys and two V-belts.
The output of the transmission mechanism, which is connected to
the pulsator valve spindle through a sleeve, could be adjusted
manually to rotate the butterfly valve with variable speed within
the range of 200 up to 2050 rpm.
Pulsation in the air stream was generated by the butterfly valve.
The pulsator valve could be adjusted to rotate to give different fre-
quencies, which were measured by a digital tachometer. The valve
has the same inner diameter of the test section pipe and was lo-
cated at 300 mm downstream the end of the test section tube.
For each revolution of the butterfly valve, the flow is stopped
and released twice, so the frequency of pulsation can be expressed
as
f ¼
ðN Â 2Þ
60
ð1Þ
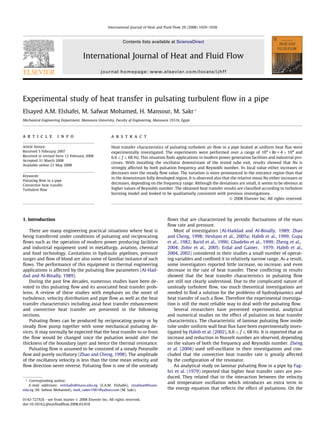
Sinusoidal pulsating flow is assumed to be entering to the pipe
as shown in Fig. 1, where the velocity only is oscillating. This
assumption is considered when comparing the experimental re-
sults with numerical predictions reported by Elshafei et al.
(2007), (illustrated in Figs. 22–25). Thus the velocity of flow is a
periodic function of time and can be expressed as
UðtÞ ¼ Um þ absðUA sin xtÞ ð2Þ
3. Procedure and calculations
3.1. Experimental procedure
In this investigation, an experimental program is conducted to
study the heat transfer characteristics of steady and pulsating tur-
bulent pipe air flow. Several parameters affect the performance of
heat transfer of such a flow. Among all the amplitude and fre-
quency of pulsation, Reynolds number and the location of pulsa-
tion mechanism relative to the test-section may have the great
effect. Experiments in both cases, steady and pulsating flow were
executed while the pipe wall is heated with a fixed uniform heat
flux of 922 W/m2
and the pulsation mechanism was located down-
stream of the test section. The mass flow rate of air was adjusted
and held unvaried while varying the pulsation frequency from
0.0 up to 68 Hz. The investigation covered different values of Rey-
nolds numbers in the range of 104
< Re < 4 Â 104
.
3.2. Data collection
The pressure drop across the orifice plate (Dp), is measured and
used to calculate the maximum mass flow rate of air as White
(2003).
_m ¼ CdqairA
2Dp
qairð1 À b4
Þ
5.
6.
7.
8.
9.
10.
11.
12.
13.
14. 1
2
ð3Þ
The discharge coefficient; Cd is obtained form calibration of the
orifice meter. To measure the heat input to the test section through
the heating tapes segments, the digital multi-meter that measures
input currents, voltages and power simultaneously was used. The
voltage coming from the main voltage stabilizer was adjusted
through the two auto-transformers to achieve uniform wall heat
flux.
The results are parameterized by the factors having more influ-
ence on heat transfer characteristics of flow under investigation.
Reynolds number and dimensional frequency of turbulent flow
are playing important roles. The maximum Reynolds number of
air flowing in a pipe of diameter Di is given by
Re ¼
4 _m
pDil
ð4Þ
The dimensional frequency of turbulent pipe flow is defined as
xÃ
¼ xD=UÃ
ð5Þ
where x is the angular pulsation frequency, given by
x ¼ 2pf; ð6Þ
and U*
is the friction velocity described as Habib et al. (2004)
UÃ
¼ 0:199Um=Re0:125
ð7Þ
Axial heat loss by conduction from both ends of the tested tube
was eliminated by a two Teflon washers located between the test
section flanges. The heat loss in radial direction through insulation
was checked and found to be about 2% of heat input that can be ig-
nored. So
Qtrans ¼ ðQ À QlossÞ ¼ _mcpmðTbo À TbiÞ ð8Þ
The local bulk mean temperature of the air at the end of each
segment was determined using energy balance (Incropera and De-
witt, 1996) as follows:
15.5
22
110
200
LH=1160
1 2 3 4 5
Thermocouples locations
Dimensions in mm
Flow
In
Fig. 3. Test section.
1032 E.A.M. Elshafei et al. / International Journal of Heat and Fluid Flow 29 (2008) 1029–1038
15. qo ¼
_mCpmðTbx À TbiÞ
pDLx
; ð9Þ
Tbx ¼
_qpDLx
_mCpm
þ Tbi ð10Þ
The local mean bulk temperatures at the corresponding points
along the test section are determined by linear interpolation of
the mean temperature at the end of the heater segments, where
the pipe wall temperature is measured. The local and mean heat
transfer coefficients are determined, respectively by
hx ¼
_q
Tsx À Tbx
; ð11Þ
h
¼
m
1
L
Z L
0
hxdx ð12Þ
Since the values of the local heat transfer coefficient are dis-
crete, the above integration is carried out numerically using trape-
zoidal rule (Chapra and Canale, 1998). The local and mean values of
Nusselt numbers are calculated, respectively as
Nux ¼
hxD
ka
; ð13Þ
Num ¼
hmD
ka
ð14Þ
The value of ka is detected at the mean bulk temperature of the
flowing air.
The frequency of pulsation; f is determined by employing a dig-
ital tachometer. A photo electric probe emits light on to the flange
that connected by the butterfly valve, which is taped at one side
with a reflector. As the flange rotates, the reflection is counted by
the probe. The number of reflections per minute is a measure of
the speed of the motor, hence the frequency of pulsation.
Uncertainty analyses of various measured parameters were car-
ried out based on method of Kline and McClintock (1953). The
uncertainty levels in the mean Nusselt number is ±5.2%.
4. Results and discussion
The present investigation includes 82 runs for different values
of Reynolds number and frequency. Each pulsation test was pre-
ceded by steady flow one at the same Reynolds number. For the
sake of validating the present experimental data, it has been com-
pared with that reported in literature (Dittus and Boellter, 1930)
for the steady flow, which is given by
Num ¼ 0:023Re0:8
Pr0:4
ð15Þ
It is shown from Fig. 4 that the present data for the steady flow are
in good agreement with the published data.
4.1. Pulsating flow
The effect of pulsation on the heat transfer characteristics are
presented in terms of both relative local and relative mean Nusselt
number defined as the ratio of the value of local and mean Nusselt
number for pulsated flow to the corresponding ones for steady
flow at the same Reynolds numbers. The mean Nusselt number is
calculated by integrating the local Nusselt number along the pipe
as explained earlier. The thermally fully developed flow was at-
tached at X/D P 15, because the value of the local Nusselt number
is normally constant.
Results showed that the relative local value of Nu either in-
creased or decreased with increasing both the value of Reynolds
number and pulsation frequency. This can be declared from the fol-
lowing sections.
For pulsation frequency of 6.7 Hz, it can be seen from Fig. 5 that
little enhancement in the ratio of local Nusselt numbers was
accompanied with Reynolds number of 16,800, 22,500 and
37,100 in the entrance region; with about 8% for Re equals to
37,100 and the percentage of enhancement smoothly decreased
with X/D. However, for the rest of the tested flow Reynolds num-
ber, a reduction in the local Nu with X/D was observed (with max-
imum reduction of about 11% at the tested pipe end for Re of about
13,350.
For f = 13.3 Hz, the enhancement was raised up to 14% for the
highest value of Reynolds number of about 37,100 at X/D equal
0.5 and 15, the maximum reduction in the local Nu of 11%, at Rey-
nolds number of 13,350 as can be seen from Fig. 6.
For f = 20.7 Hz, the % age of enhancement is about 8% at inlet for
Reynolds number of 37,100, while suffering reduction for the other
values of Reynolds number as indicated in Fig. 7.
Another set of experiments have been carried out at higher fre-
quencies to assess such ambiguous phenomena. For f equals to 28.3
and 39.3 Hz, Nu increased only for Reynolds numbers of 22,500 and
37,100, respectively. As can be seen from Figs. 8 and 9, the
enhancement at Reynolds number of 37,100 was of about 19%
and 14% at the inlet of the tested pipe, respectively.
For 42.5 6 f 6 49.2 Hz, over a range of 10,850 6 Re 6 37,100, an
enhancement and reduction in the value of local Nu are observed
as shown in Figs. 10–12. The maximum enhancement was of about
7% for the operating conditions of f = 42.5 Hz, Re = 22,500 and the
maximum reduction of about 17% for the case when f = 42.5 Hz
and Re = 13,350. The enhancement is always noticed at the en-
trance of the pipe.
1- Testsection pipe 4-Internal Insulation
2-Thermocouples junctions 5-External Insulation
3-Electeric Main heater
10000 100000
1
10
100
1000
Present corr.
Present data.
Num
Re
Fig. 4. Comparison of measured fully developed Nusselt numbers and correlated
data of Eq. (13) (steady flow), refer to Dittus and Boelter correlation.
X/D
0.8
0.9
1.0
1.1
1.2
0 20 40 60
η
Re=10850 Re=13350 Re=16800 Re=22500
Re=24650 Re=31560 Re=37100
Fig. 5. Relative local Nusselt number of pulsated flow for different Re (f = 6.7 Hz).
E.A.M. Elshafei et al. / International Journal of Heat and Fluid Flow 29 (2008) 1029–1038 1033
16. The same trend can be observed in Figs. 13–15 for frequency
53.3 6 f 6 68 Hz respectively.
The always happening of enhancement in Nusselt number for
certain operating conditions (frequency Reynolds number combi-
nation) close to the pipe entrance may be argued to the agitation
of the thermal boundary layer whose growth has just begun by
those imposed matched frequency with Reynolds number.
The effect of pulsation frequency on the ratio of the mean Nus-
selt number for pulsated turbulent flow to that for steady flow; gm
at various Reynolds number is shown in Figs. 16 and 17. Over the
tested range of 6.7 6 f 6 68 Hz and for 10,850 6 Re 6 22,500, it can
be seen from Fig. 16 that for Reynolds number equals to 10,850 and
13,350, the ratio gm is slightly decreases with increasing pulsation
frequency. At any pulsation frequency it can be noticed that the
value of gm is firstly less than unity at Reynolds number of
10,850 after which it slightly decreases for Reynolds number of
13,500, followed by a noticeable increase at Reynolds number of
16,800 and 22,500. Also the same trend for gm as a function of pul-
sation frequency can be noted in Fig. 17 for a range of 24,650
6 Re 6 37,100.
X/D
0.8
0.9
1
1.1
1.2
0 5 10 15 20
η
Re=10850 Re=13350 Re=16800 Re=22500
Re=24650 Re=31560 Re=37100
Fig. 6. Relative local Nusselt number of pulsated flow for different Re (f = 13.3 Hz).
X/D
0 5 10 15 20
0.8
0.9
1
1.1
1.2
η
Re=10850 Re=13350 Re=16800 Re=22500
Re=24650 Re=31560 Re=37100
Fig. 7. Relative local Nusselt number of pulsated flow for different Re (f = 20.7 Hz).
X/D
0 5 10 15 20
0.8
0.9
1
1.1
1.2
η
Re=10850 Re=13350 Re=16800 Re=22500
Re=24650 Re=31560 Re=37100
Fig. 8. Relative local Nusselt number of pulsated flow for different Re (f = 28.3 Hz).
X/D
0 5 10 15 20
0.8
0.9
1
1.1
1.2
η
Re=10850 Re=13350 Re=16800 Re=22500
Re=24650 Re=31560 Re=37100
Fig. 9. Relative local Nusselt number of pulsated flow for different Re (f = 39.3 Hz).
X/D
0 5 10 15 20
0.8
0.9
1
1.1
1.2
η
Re=10850 Re=13350 Re=16800 Re=22500
Re=24650 Re=31560 Re=37100
Fig. 10. Relative local Nusselt number of pulsated flow for different Re (f = 42.5 Hz).
X/D
0 5 10 15 20
0.8
0.9
1
1.1
1.2
η
Re=10850 Re=13350 Re=16800 Re=22500
Re=24650 Re=31560 Re=37100
Fig. 11. Relative local Nusselt number of pulsated flow for different Re (f = 45.7 Hz).
1034 E.A.M. Elshafei et al. / International Journal of Heat and Fluid Flow 29 (2008) 1029–1038
17. An interesting observation in Fig. 17 is that at any value of pul-
sation frequency, the value of gm is less than unity at Re equals to
24,650 and 31,560 after which it suddenly increases to more than
unity in the range of 0 6 f 6 40 Hz.
The variation of gm versus Reynolds number over a pulsation
frequency range of 6.7 6 f 6 68 is shown in Figs. 18 and 19 from
which the previous obtained results can be clearly noticed having
the same trend. These results agree enough with that reported by
Zhao and Cheng (1998), Gbadebo et al. (1999) and Faghri et al.
(1979).
The heat transfer results are also presented in the form relative
mean Nu as a function of turbulent dimensionless frequency; x*
that combine the effect of both Reynolds number and pulsation
frequency. In the frequency range of 6.7 up to 68 Hz and Reynolds
number of 10,850 6 Re 6 24,650 (0.28 x* 8.4), the experimen-
tal data are shown in Figs. 20–22. It is generally seen for all tested
Reynolds numbers that the value of gm slightly decreases with
increasing x*. In the mean time, at a fixed value of x*, gm fluctuates
periodically as Reynolds number changed.
The noticed enhancement and reduction of heat transfer rate
accompanied with pulsating turbulent flow need to be discussed
and analyzed.
The heat transfer characteristics of such a flow are influenced by
several parameters. These are: Reynolds number, the imposed
Re=10850 Re=13350 Re=16800 Re=22500
Re=24650 Re=31560 Re=37100
0.8
0.9
1
1.1
1.2
η
X/D
0 5 10 15 20
Fig. 12. Relative local Nusselt number of pulsated flow for different Re (f = 49.2 Hz).
0.8
0.9
1
1.1
1.2
η
X/D
0 5 10 15 20
Re=10850 Re=13350 Re=16800 Re=22500
Re=24650 Re=31560 Re=37100
Fig. 13. Relative local Nusselt number of pulsated flow for different Re (f = 53.3 Hz).
0.8
0.9
1
1.1
1.2
η
X/D
0 5 10 15 20
Re=10850 Re=13350 Re=16800 Re=22500
Re=24650 Re=31560 Re=37100
Fig. 14. Relative local Nusselt number of pulsated flow for different Re (f = 61.7 Hz).
0.8
0.9
1
1.1
1.2
η
X/D
0 5 10 15 20
Re=10850 Re=13350 Re=16800 Re=22500
Re=24650 Re=31560 Re=37100
Fig. 15. Relative local Nusselt number of pulsated flow for different Re (f = 68 Hz).
0 20 40 60 80
0.8
0.9
1
1.1
1.2
Re=10850
Re=13350
Re=16800
Re=22500
f (Hz)
mη
Fig. 16. Relative mean Nusselt number as a function of pulsation frequency.
0.8
0.9
1
1.1
1.2
m
0 20 40 60 80
f (Hz)
Re=24650
Re=31560
Re=37100
η
Fig. 17. Relative mean Nusselt number as a function of pulsation frequency.
E.A.M. Elshafei et al. / International Journal of Heat and Fluid Flow 29 (2008) 1029–1038 1035
18. frequency and its amplitude, Prandtl number, length to diameter
ratio, location of pulsator, pipe diameter and type of pulsator.
A comparison between the present experimental results with
the numerical ones (Elshafei et al., 2007), over a ranges of
16.8 Â 103
6 Re 6 37.1 Â 103
and 6.67 6 f 6 68 Hz are described
in Figs. 23–25. The data are presented in the form of gm as a func-
tion of bursting frequency x*. It can be observed that for all values
of Reynolds number, the numerical predictions of gm as a function
of x* have the same trend as those for the experimental data. The
discrepancies between the experimental data and the computed
ones at low bursting turbulent frequency are of about 10%. As x*
increases, the computed results closes to the experimental ones,
specially, at higher value of Reynolds number.
The pulsation of this turbulent flow is related to bursting phe-
nomenon that occurs in the turbulent boundary layer. These turbu-
lent bursts are a series of quasi-cyclic or periodic activities near the
wall. Therefore, affecting the heat transfer processes.
The bursting model (Hemeada et al., 2002) is widely used in the
analysis of heat transfer characteristics of such pulsating turbulent
Re
0.88
0.92
0.96
1.00
1.04
1.08
10000 15000 20000 25000 30000 35000 40000
f=6.7 f=13.3 f=20.7
f=28.3 f=39.3
mη
Fig. 18. Relative mean Nusselt number as a function of flow Reynolds number.
0.88
0.92
96
1.00
1.04
10000 20000 30000 4000
f=42.5 f=45.7 f=49.2
f=53.3 f=61.7 f=68
Re
ηm
Fig. 19. Relative mean Nusselt number as a function of flow Reynolds number.
m
0 2 4 6 8 10
0.8
0.9
1
1.1
1.2
Re=10850
Re=13350
Re=16800
ω*
η
Fig. 20. Relative mean Nusselt numbers as a function of dimensionless turbulent
frequency.
m
0 1 2 3 4 5
0.8
0.9
1
1.1
1.2
Re=22500
Re=24650
ω*
η
Fig. 21. Relative mean Nusselt numbers as a function of dimensionless turbulent
frequency.
m
0 1 2 3 4
0.8
0.9
1
1.1
1.2
Re=31560
Re=37100
ω*
η
Fig. 22. Relative mean Nusselt numbers as a function of dimensionless turbulent
frequency.
0 2 4 6
ω*
0.8
0.9
1
1.1
1.2
Re=16800
Experimental
Numerical
mη
Fig. 23. Comparison between experimental and numerical values at Re = 16,800.
0 1 2 3 4 5
Re=22500
Experimental
Numerical
ω*
0.8
0.9
1
1.1
1.2
mη
Fig. 24. Comparison between experimental and numerical values at Re = 22,500.
1036 E.A.M. Elshafei et al. / International Journal of Heat and Fluid Flow 29 (2008) 1029–1038
19. flow. Liao and Wang (1985) and Genin et al. (1992) investigated
the hydrodynamics and heat transfer with pulsating turbulent fluid
flow in pipes and reported that, when the imposed frequency is
close to the bursting frequency, resulting in a renewable viscous
sub-layer, and hence causes the occurrence of certain resonance
interaction. This interaction may change strongly the heat transfer
characteristics of turbulent flow.
The heat transfer results of the present study and that obtained
by other investigators (Habib et al., 1999, 2004; Gbadebo et al.,
1999; Liao and Wang, 1985; Havemann and Rao, 1954; Artineelli
et al., 1943) are discussed and analyzed in view of that turbulent
bursting model presented in Fig. 26. These collected heat transfer
data are classified and presented in the form of dimensionless fre-
quency; x* versus Re for each investigation. As shown in Fig. 22,
there are three lines bounding the level of bursting frequency;
the upper limit, the mean and the lower limit of this bursting
frequency.
Ordinates of x* as function of Re for different regions are given
to define pulsating flow regimes. In quasi-steady condition; repre-
sented by region (A), the rate of heat transfer will be reduced due
to pulsation of the turbulent flow (Barid et al., 1996; Liao and
Wang, 1985). Regions (B) and (C) are categorized as preferred re-
gions in which the imposed pulsation frequency becomes close
to the bursting frequency, leading to a resonance interaction of
both frequencies. This interaction agitates the boundary layer
and therefore the rate of heat transfer is expected to increase with
the imposed pulsation, as reported by Liao and Wang (1985), Genin
et al. (1992) and Mamayev et al. (1976).
Few experiments have been carried out in region D (Gbadebo et
al., 1999; Ramaprian and Tu, 1983) who reported that the heat
transfer coefficient is increased by about 27% due to pulsation.
The heat transfer rate is expected to increase in this region due
to the strong interaction between the imposed frequency and the
turbulent bursting processes at the wall as reported by Ramaprian
and Tu (1983).
Most of the data belong to Habib et al. (1999, 2004) and Have-
mann and Rao (1954) lay in regions B and C, where the heat trans-
fer coefficient increases with pulsating frequency above a certain
value. This conclusion is supported by Liao and Wang (1985)
who reported that the rate of heat transfer might be increased with
higher imposed frequency than that of bursting for the correspond-
ing steady flow.
The bulk of the present data fall in one of the suggested
preferred regime of bursting frequency, especially, in the inter-
mediate frequency region represented by regime (B) shown in
Fig. 26. In this regime, the mean bursting frequency is subdued
to the pulsation frequency leading to the occurring of reso-
nance that is dependent only on the pulsation frequency.
Accordingly, the heat transfer process is expected to be af-
fected resulting in either reduction or enhancement in the rate
of heat transfer.
5. Conclusion
The effects of frequency and Reynolds number on heat transfer
characteristics of pulsating turbulent pipe flow are experimentally
investigated. The pipe was subjected to a uniform heat flux and the
pulsator was placed down stream of the tested pipe. From the ob-
tained results, the following may be concluded:
0.8
0.9
1
1.1
1.2
Re=37100
Experimental
Numerical
m
0 1 2 3
ω*
η
Fig. 25. Comparison between experimental and numerical values at Re = 37,100.
1000 10000 100000
0.001
0.01
0.1
1
10
100
1000
Gbadedo[7]
Liowang[28]
Mamayev et al.[31]
Present data
HavemannRao[30]
Re
b
D/U*
S.A.M.Said[4]
M.A.Habib[11]
A
B
C
D
ω
Fig. 26. Classification of data of heat transfer with turbulent pulsating flow.
E.A.M. Elshafei et al. / International Journal of Heat and Fluid Flow 29 (2008) 1029–1038 1037
20. Observations of the local Nusselt number revealed that the heat
transfer coefficient may be increased or decreased, depending
on the value of frequency and Reynolds number.
Higher values of the local heat transfer coefficient occurred in
the entrance of the tested tube.
The maximum enhancement in gm of about 9% is observed at
Re = 37,100, f = 13.3 Hz and x*
of about 0.5 where the interaction
between the bursting and pulsation frequencies is expected.
The maximum reduction in gm of about 12% was detected for
Re = 13,350, f = 42.5 Hz and x*
of about 4.4.
References
Al-Haddad, A., Al-Binally, N., 1989. Prediction of heat transfer coefficient in
pulsating flow. Int. J. Heat Fluid Flow 10 (2), 131–133.
Artineelli, M., Boeleter, R.C., Weinberg, L.M.K., Yakahi, S.E.B., 1943. Heat transfer to a
fluid flowing periodical at low frequencies in a vertical tube. Trans. Asme, 789–
798.
Barid, M.H.I., Duncan, G.J., Smith, J.I., Taylor, J., 1996. Heat transfer in pulsed
turbulent flow. Chem. Eng. Sci. 21, 197–199.
Chang, J., Zhi, X.Y.L., Zhaoan, T.S., 2004. Analytical study of pulsating laminar heat
convection in a circular tube with constant heat flux. J. Heat Mass Transf. 47,
5297–5301.
Chapra, S.C., Canale, R.P., 1998. Numerical Methods for Engineering with
Programming and Software. Wcb/McGraw-Hill.
Chattopadhyay, H., Durst, F., Ray, S., 2006. Analysis of heat transfer in
simultaneously developing pulsating laminar flow in a pipe with constant
wall temperature. J. Heat Mass Transf. 33, 475–481.
Cho, H.W., Hyun, J.M., 1990. Numerical solutions of pulsating flow and heat transfer
characteristics in a pipe. Int. J. Heat fluid flow (4), 321–330.
Dittus, F.W., Boellter, L.M.K., 1930. University of California, Berkeley, Publications
on Engineering, vol. 2. p. 443.
Elshafei, E., Safwat, M., Mansour, H., Sakr, M., 2007. Numerical study of heat
transfer in pulsating turbulent air flow. In: ThETA 1. Cairo, Egypt, January 3–
6, No. 68.
Erdal, O.K., Gainer, J.L., 1979. The effect of pulsation on heat transfer. Int. Eng. Chem.
Fundam. 18 (10), 11–15.
Faghri, M., Javdani, K., Faghri, A., 1979. Heat transfer with laminar pulsating flow in
pipe. Lett. Heat Mass Transf. 6 (4), 259–270.
Gbadebo, S.A., Said, S.A.M., Habib, M.A., 1999. Average Nusselt number correlation
in the thermal entrance region of steady and pulsating turbulent pipe flows. J.
Heat Mass Transf. 35, 377–381.
Genin, L.G., Koval, A.P., Manachkha, S.P., Sviridov, V.G., 1992. Hydrodynamics and
heat transfer with pulsating fluid flow in tubes. Thermal Eng. 39950, 30–34.
Guo, Z., Sung, H.J., 1997. Analysis of the Nusselt number in pulsating pipe flow. J.
Heat Mass Transf. 40 (10), 2486–2489.
Gupa, S.K., Patel, R.D., Ackerberg, R.C., 1982. Wall heat/mass transfer in pulsating
flow. Chem. Eng. Sci. 37 (12), 1727–1739.
Habib, M.A., Said, S.A.M., Al-Dini, S.A., Asghar, A., Gbadebo, S.A., 1999. Heat transfer
characteristics of pulsated turbulent pipe flow. J. Heat Mass Transf. 34 (5), 413–
421.
Habib, M.A., Attya, A.M., Said, S.A.M., Eid, A.l., Aly, A.Z., 2002. Convective heat
transfer characteristics of laminar pulsating air flow. J. Heat Mass Transf. 38,
221–232.
Habib, M.A., Attya, A.M., Said, S.A.M., Eid, A.l., Aly, A.Z., 2004. Heat transfer
characteristics and Nusselt number correlation of turbulent pulsating air flows.
J. Heat Mass Transf. 40, 307–318.
Havemann, H.A., Rao, N.N., 1954. Heat transfer in pulsating flow. Nature 7 (4418), 41.
Hemeada, H., Sabry, M.N., AbdelRahim, A., Mansour, H., 2002. Theoretical analysis of
heat transfer in laminar pulsating flow. J. Heat Mass Transf. 45, 1767–1780.
Hesham, M., Mostafa, A., Torki, M., Abd-Elsalam, K.M., 2005a. Experimental study
for forced convection heat transfer of pulsating flow inside horizontal tube. In:
Fourth International Conference on Heat Transfer, Fluid Mechanics and
Thermodynamics. Cario, Ak3.
Hesham, M., Mostafa, A., Torki, M., Abd-Elsalam, K.M., 2005b. Theoretical study of
laminar pulsating flow in pipe. In: Fourth International Conference on Heat
Transfer, Fluid Mechanics and Thermodynamics. Cario.
Incropera, J., Dewitt, M., 1996. Introduction to Heat Transfer. Wiley and Sons, Inc.,
NY.
Kline, J., McClintock, A., 1953. Describing uncertainties in single-sample
experiments. Mech. Eng., 3.
Lee, D.Y., Park, S.J., Ro, S.T., 1998. Heat transfer in the thermally region of a laminar
oscillating pipe flow. Ctyogenics 38, 585–594.
Liao, N.S., Wang, C.C., 1985. An investigation of the heat transfer in pulsating
turbulent pipe flow. Fundamentals of forced and mixed convection. In: The 23rd
National Heat Transfer Conference. Denver. Co., USA, August 4–7. pp. 53–59.
Mamayev, V., Nosov, V.S., Syromyatnikov, N.I., 1976. Investigation of heat transfer in
pulsed flow of air in pipes. Heat Transf., Soviet Res. 8 (3), 111.
Moschandreou, T., Zamir, 1997. Heat transfer in a tube with pulsating flow and
constant heat flux. J. Heat Mass Transf. 35 (10), 2461–2466.
Park, J.S., Taylor, M.F., McEligot, D.M., 1982. Heat transfer to pulsating turbulent gas
flow. In: Seventh International Heat Transfer Conference, vol. 3. Munich, W.G.
pp. 105–110.
Ramaprian, B., Tu, S., 1983. Fully developed periodic turbulent pipe flow. J. Fluid
Mech. 137, 59–81.
Said, S.A.M., Habib, M.A., Iqbal, M.O., 2003. Heat transfer to pulsating flow in an
abrupt pipe expansion. Int. J. Num. Heat, Fluid Flow 13 (3), 286–308.
Scotti, A., Piomelli, U., 2001. Numerical simulation of pulsating turbulent channel
flow. Phys. fluid 13 (5), 1367–1384.
Shemer, L., 1985. Laminar-turbulent transition in a slowly pulsating pipe flow. Phys.
Fluid 28 (12), 3506–3509.
White, F., 2003. Fluid Mechanics, fifth ed. McGraw-Hill.
Xuefeng, W., Nengli, Z., 2005. Numerical analysis of heat transfer in pulsating
turbulent flow in a pipe. J. Heat Mass Transf. 48, 3957–3970.
Zhao, T.S., Cheng, P., 1998. Heat transfer in oscillatory flows. Annu. Rev. Heat Transf.
IX (7), 1–64.
Zheng, J., Zeng, D., Wang, P., Gao, H., 2004. An experimental study of heat transfer
enhancement with pulsating flow. Heat Transf. – Asian Res. 23 (5), 279–286.
Zohir, A.E., Habib, M.A., Attya, A.M., Eid, A.l., 2005. An experimental investigation of
heat transfer to pulsating pipe air flow with different amplitudes. J. Heat Mass
Transf. 42 (7), 625–635.
1038 E.A.M. Elshafei et al. / International Journal of Heat and Fluid Flow 29 (2008) 1029–1038