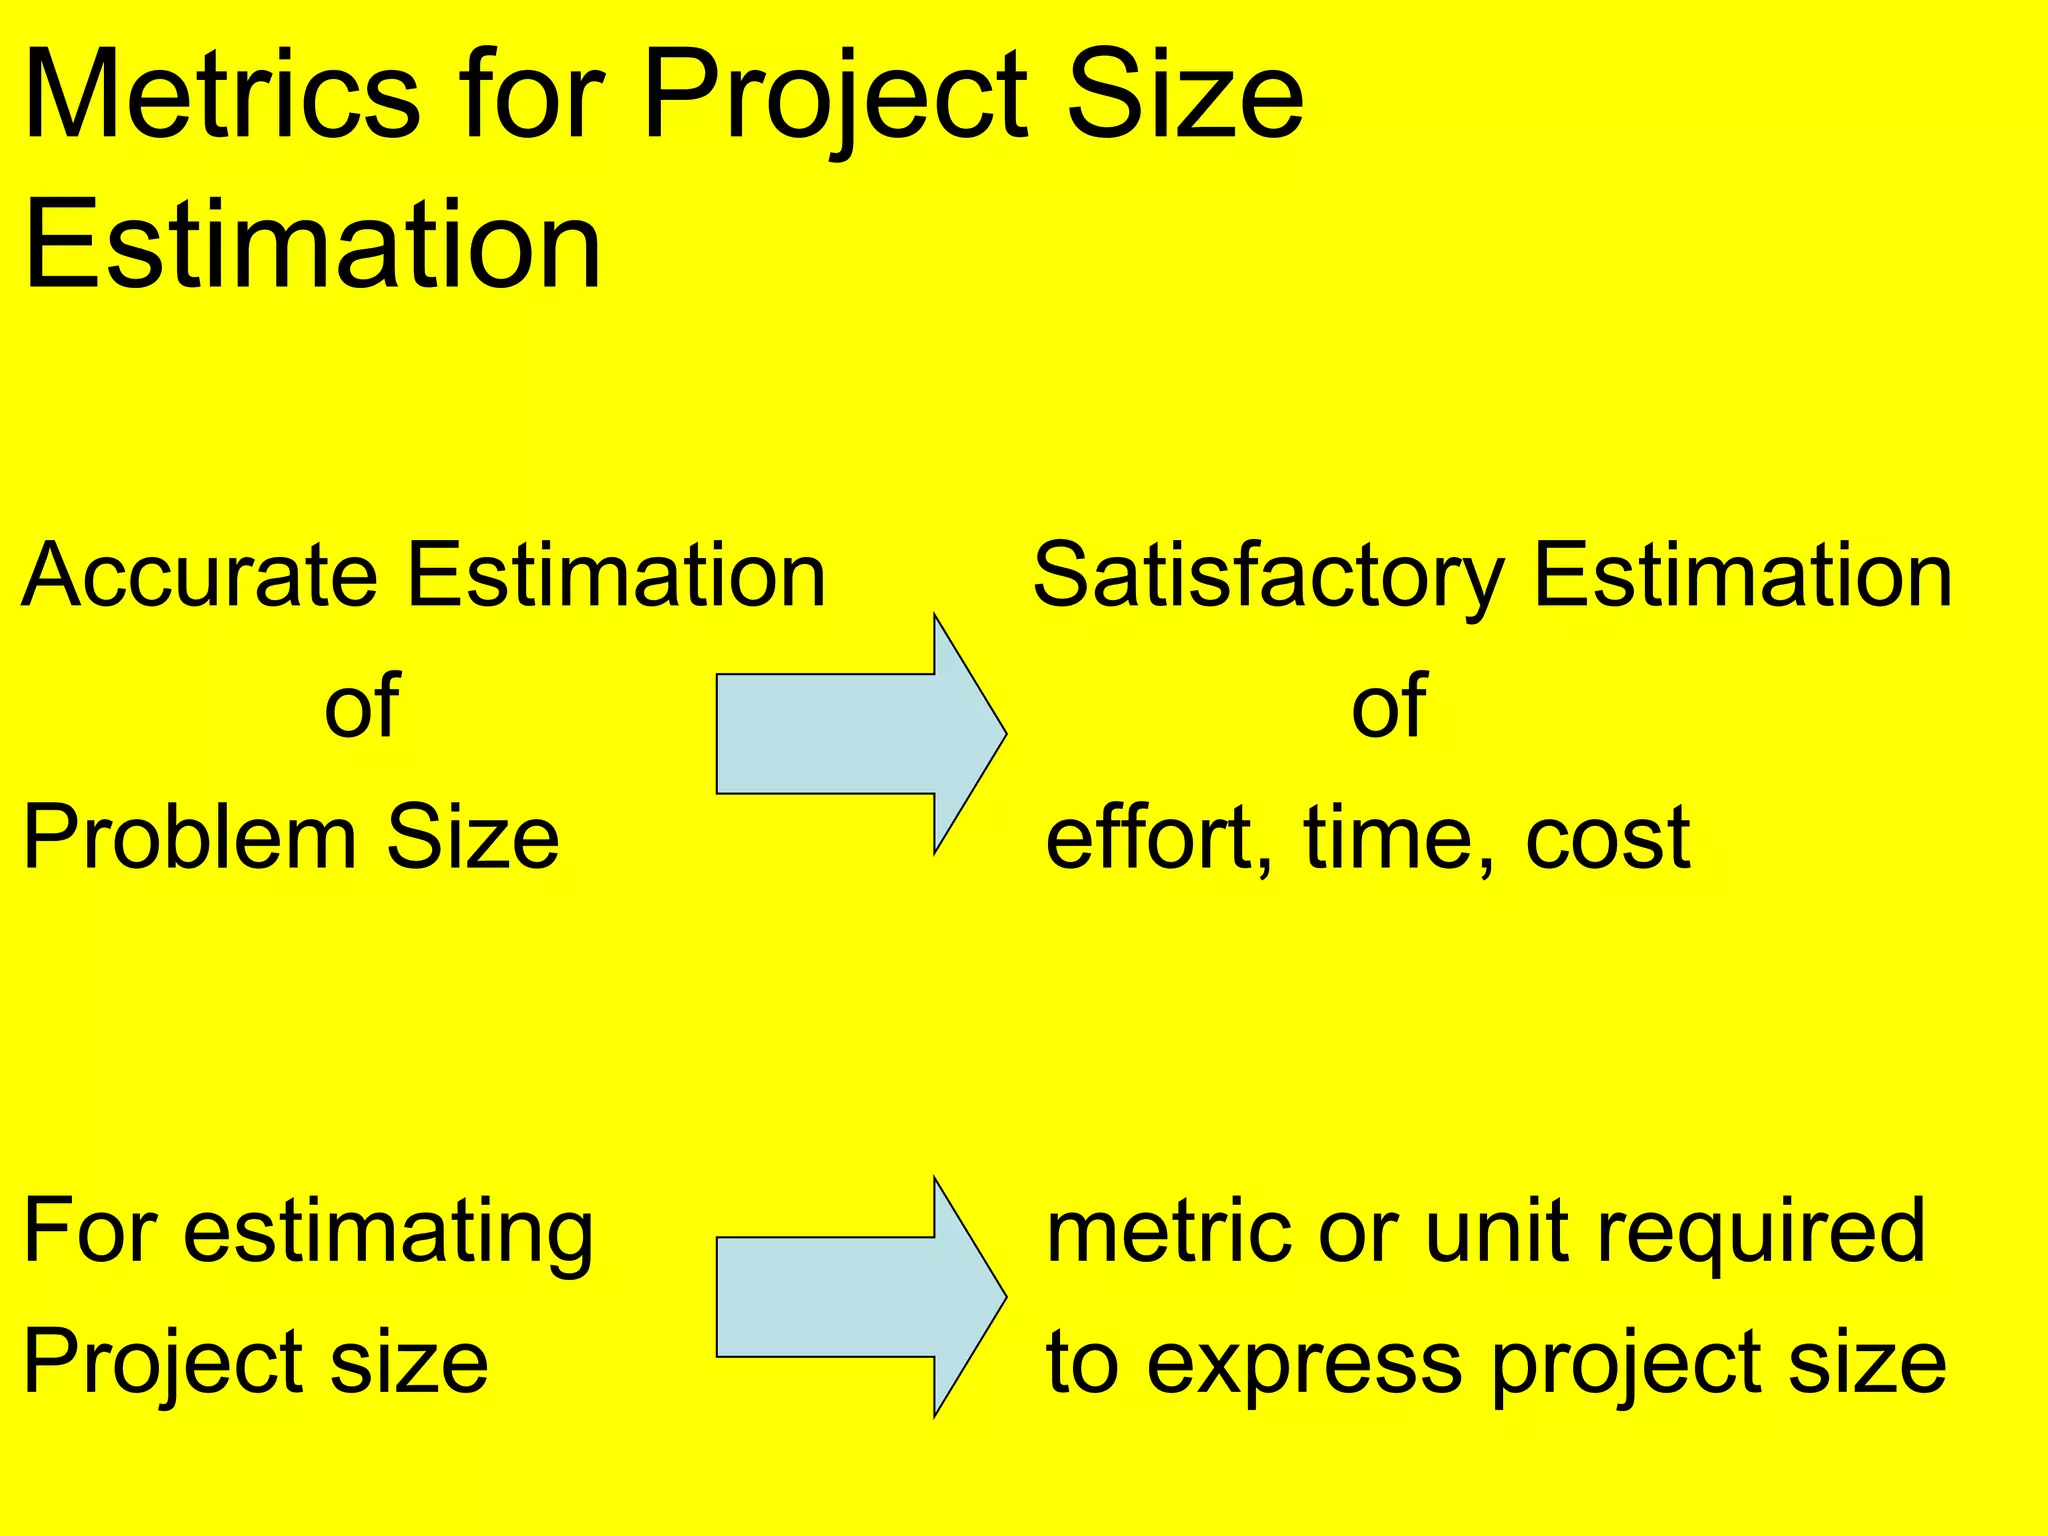
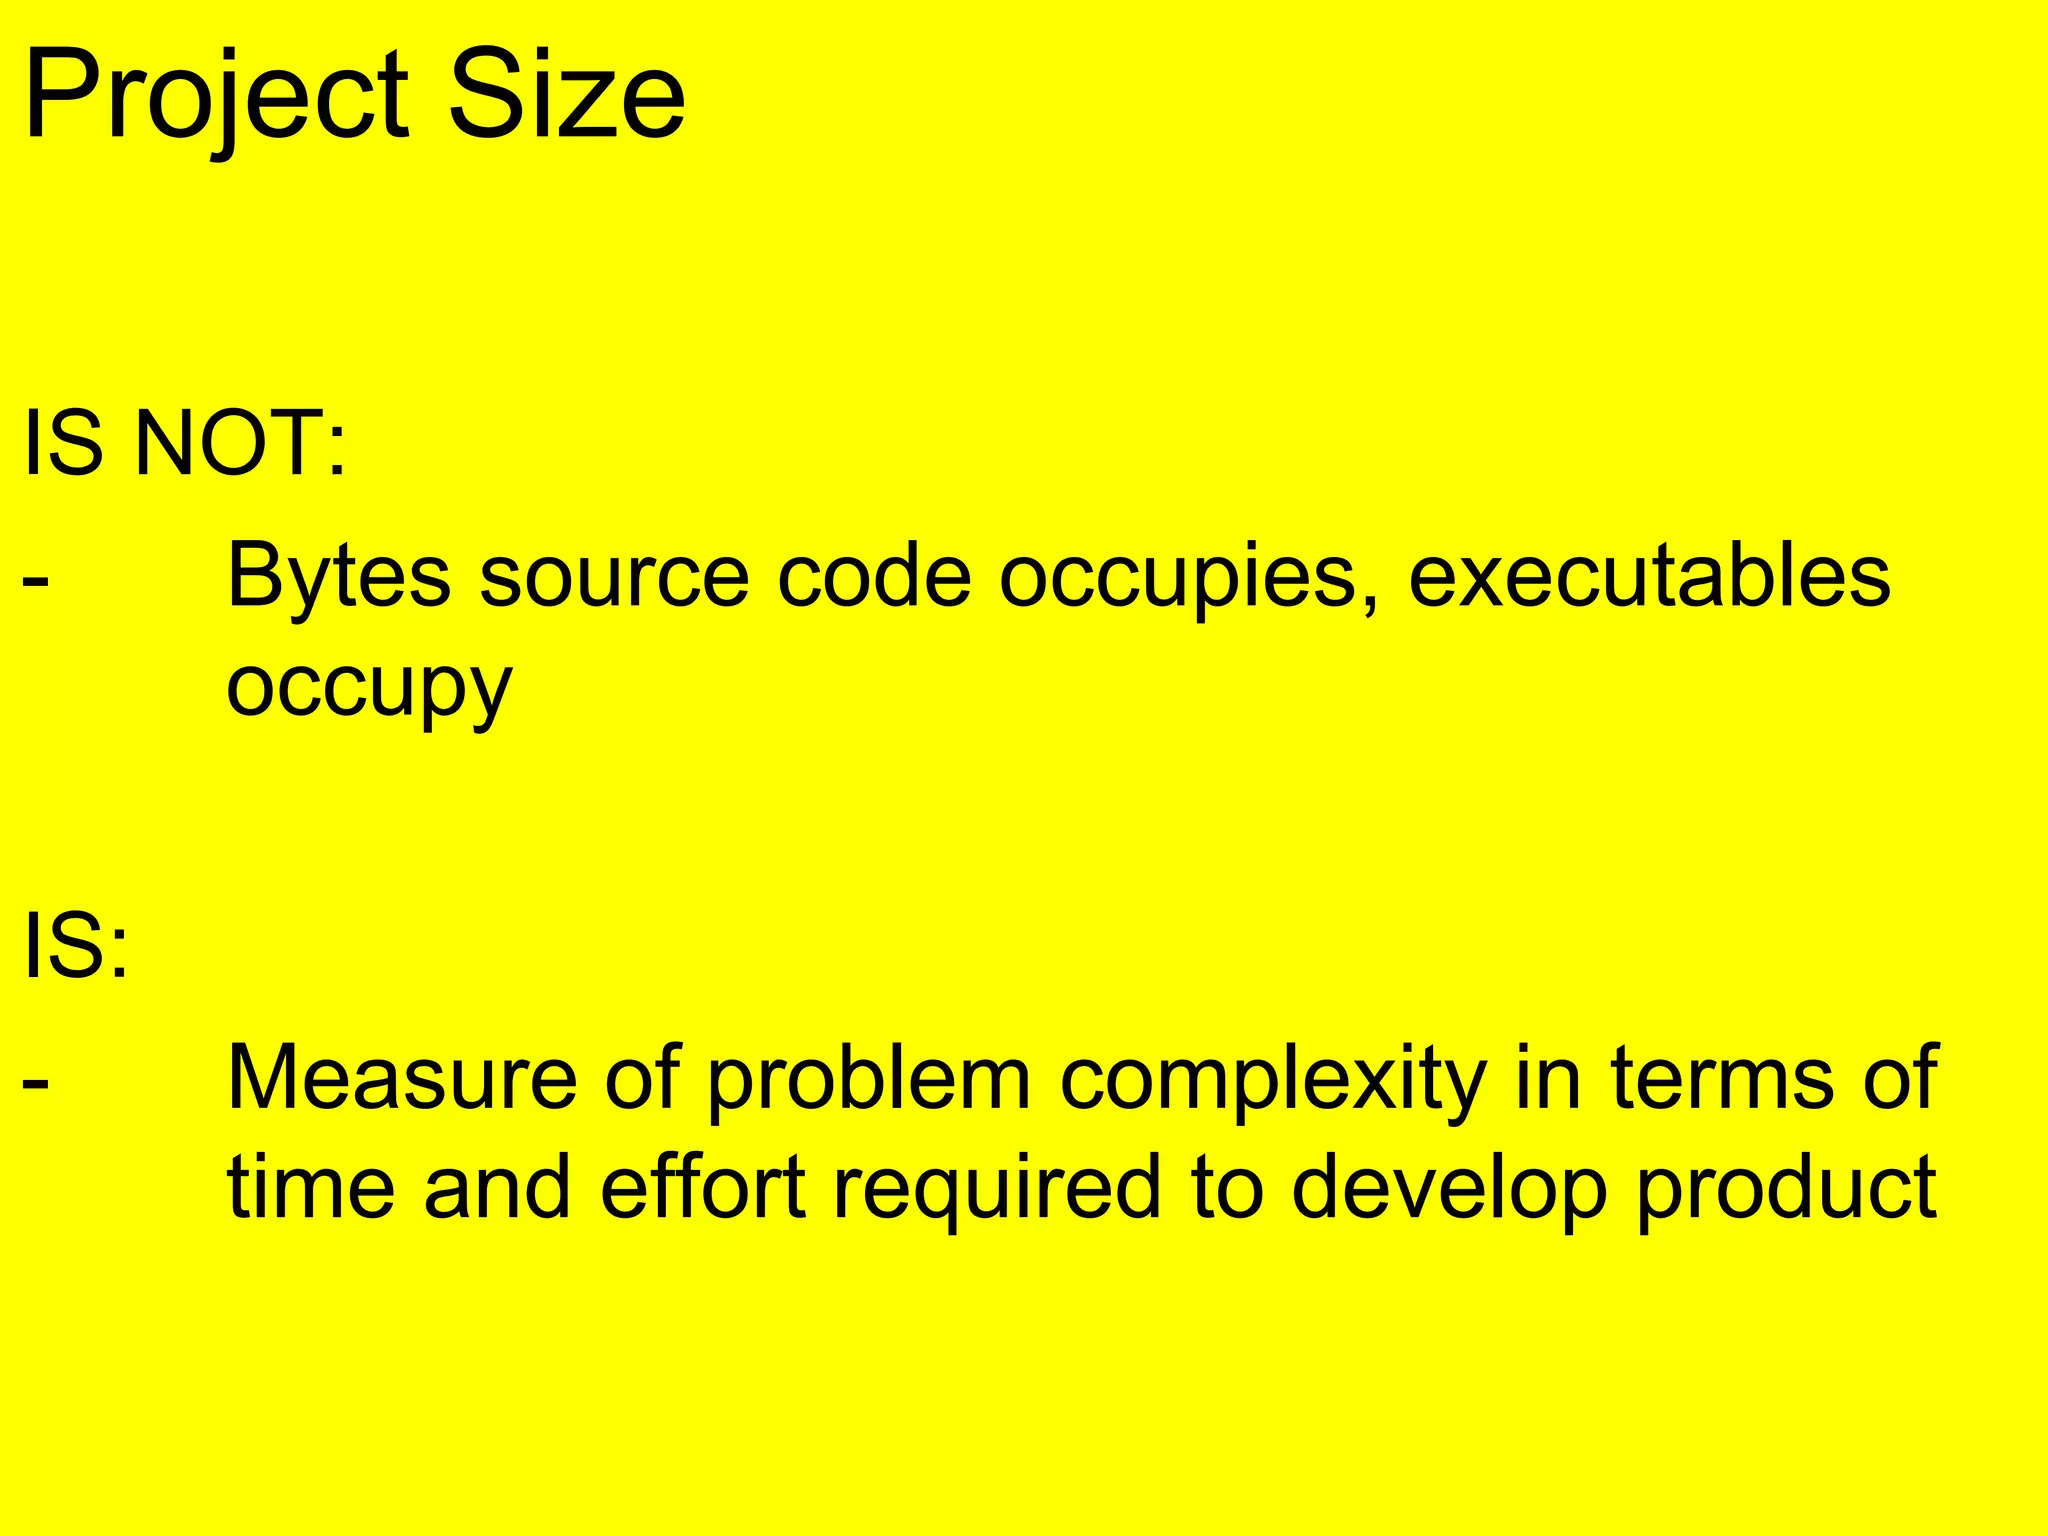
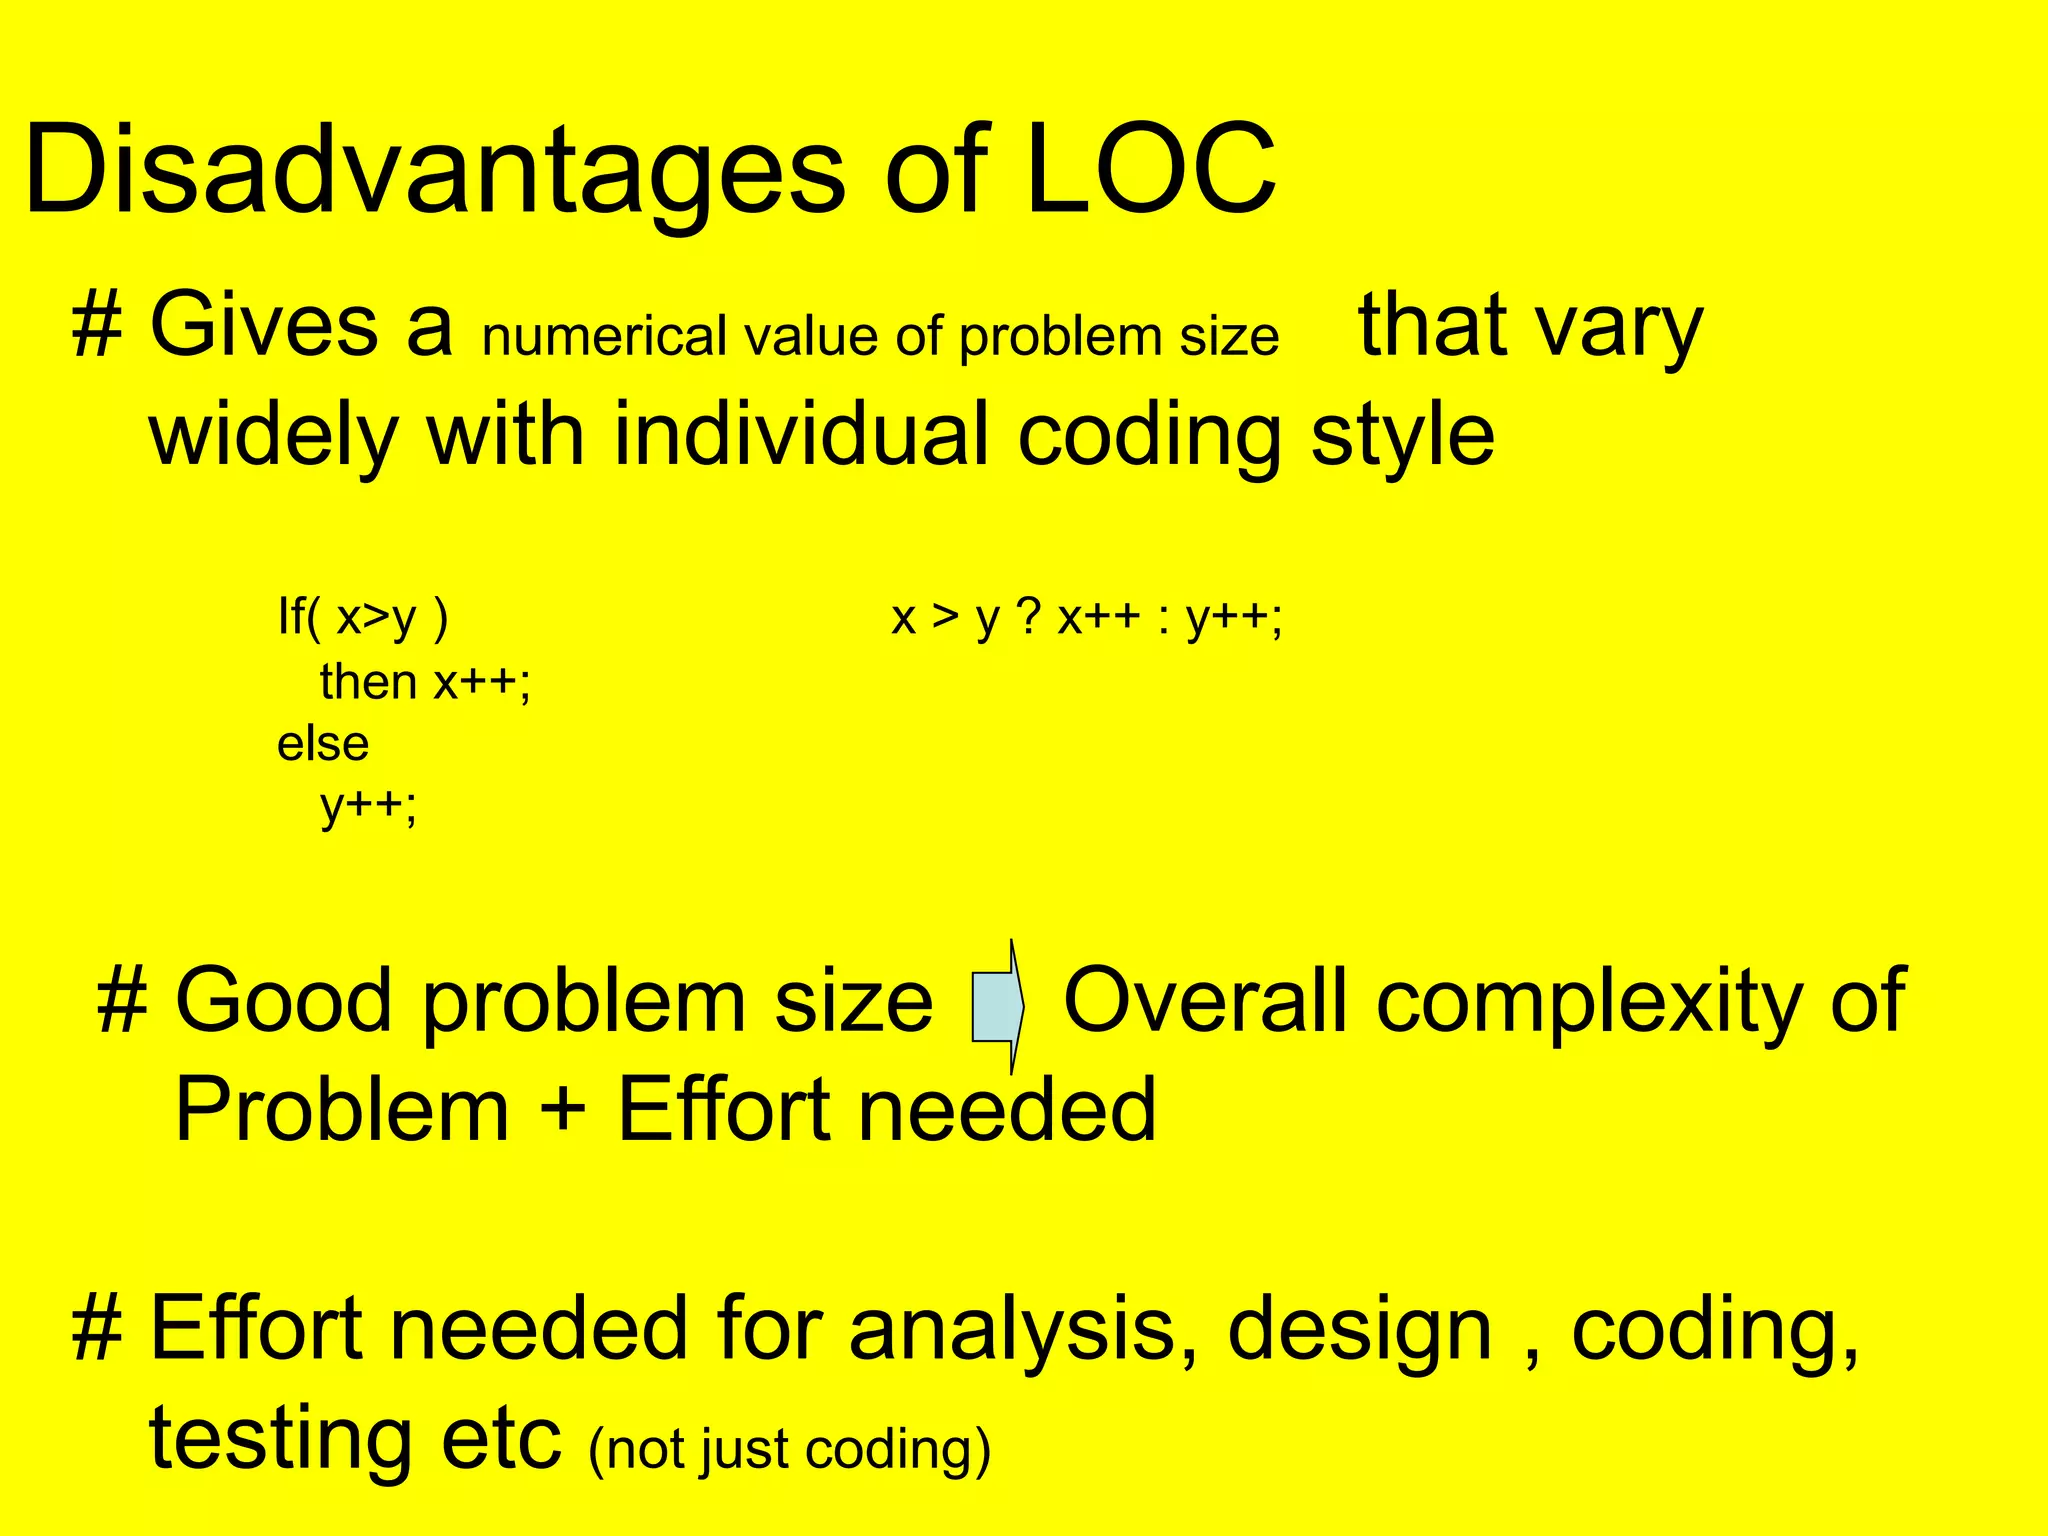
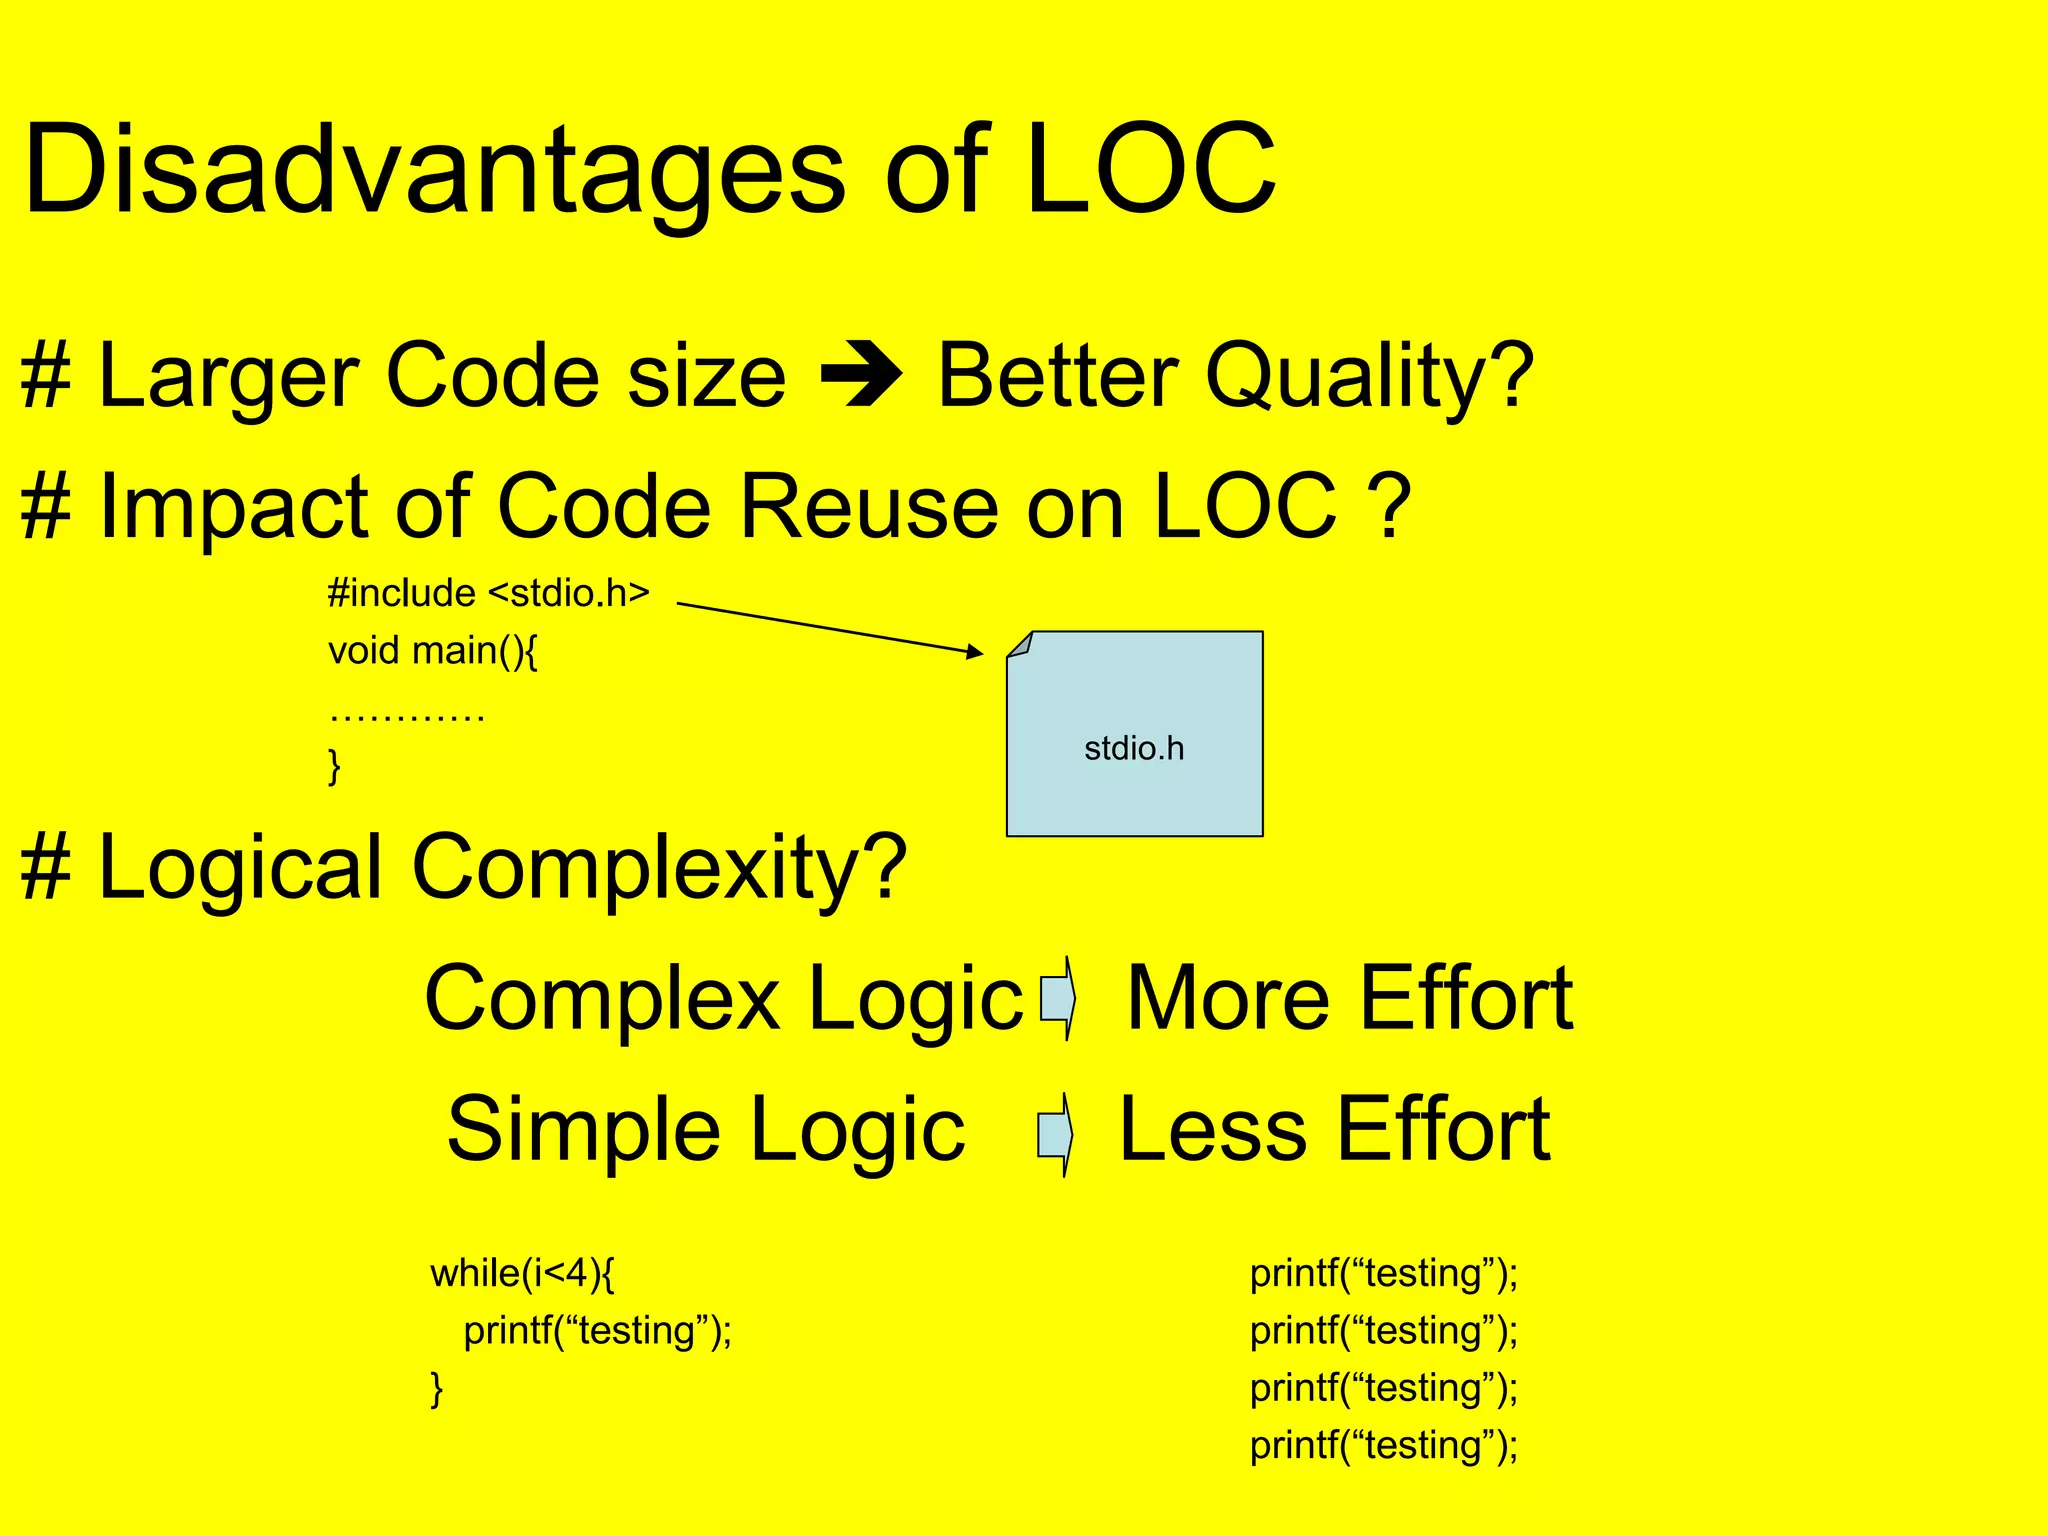
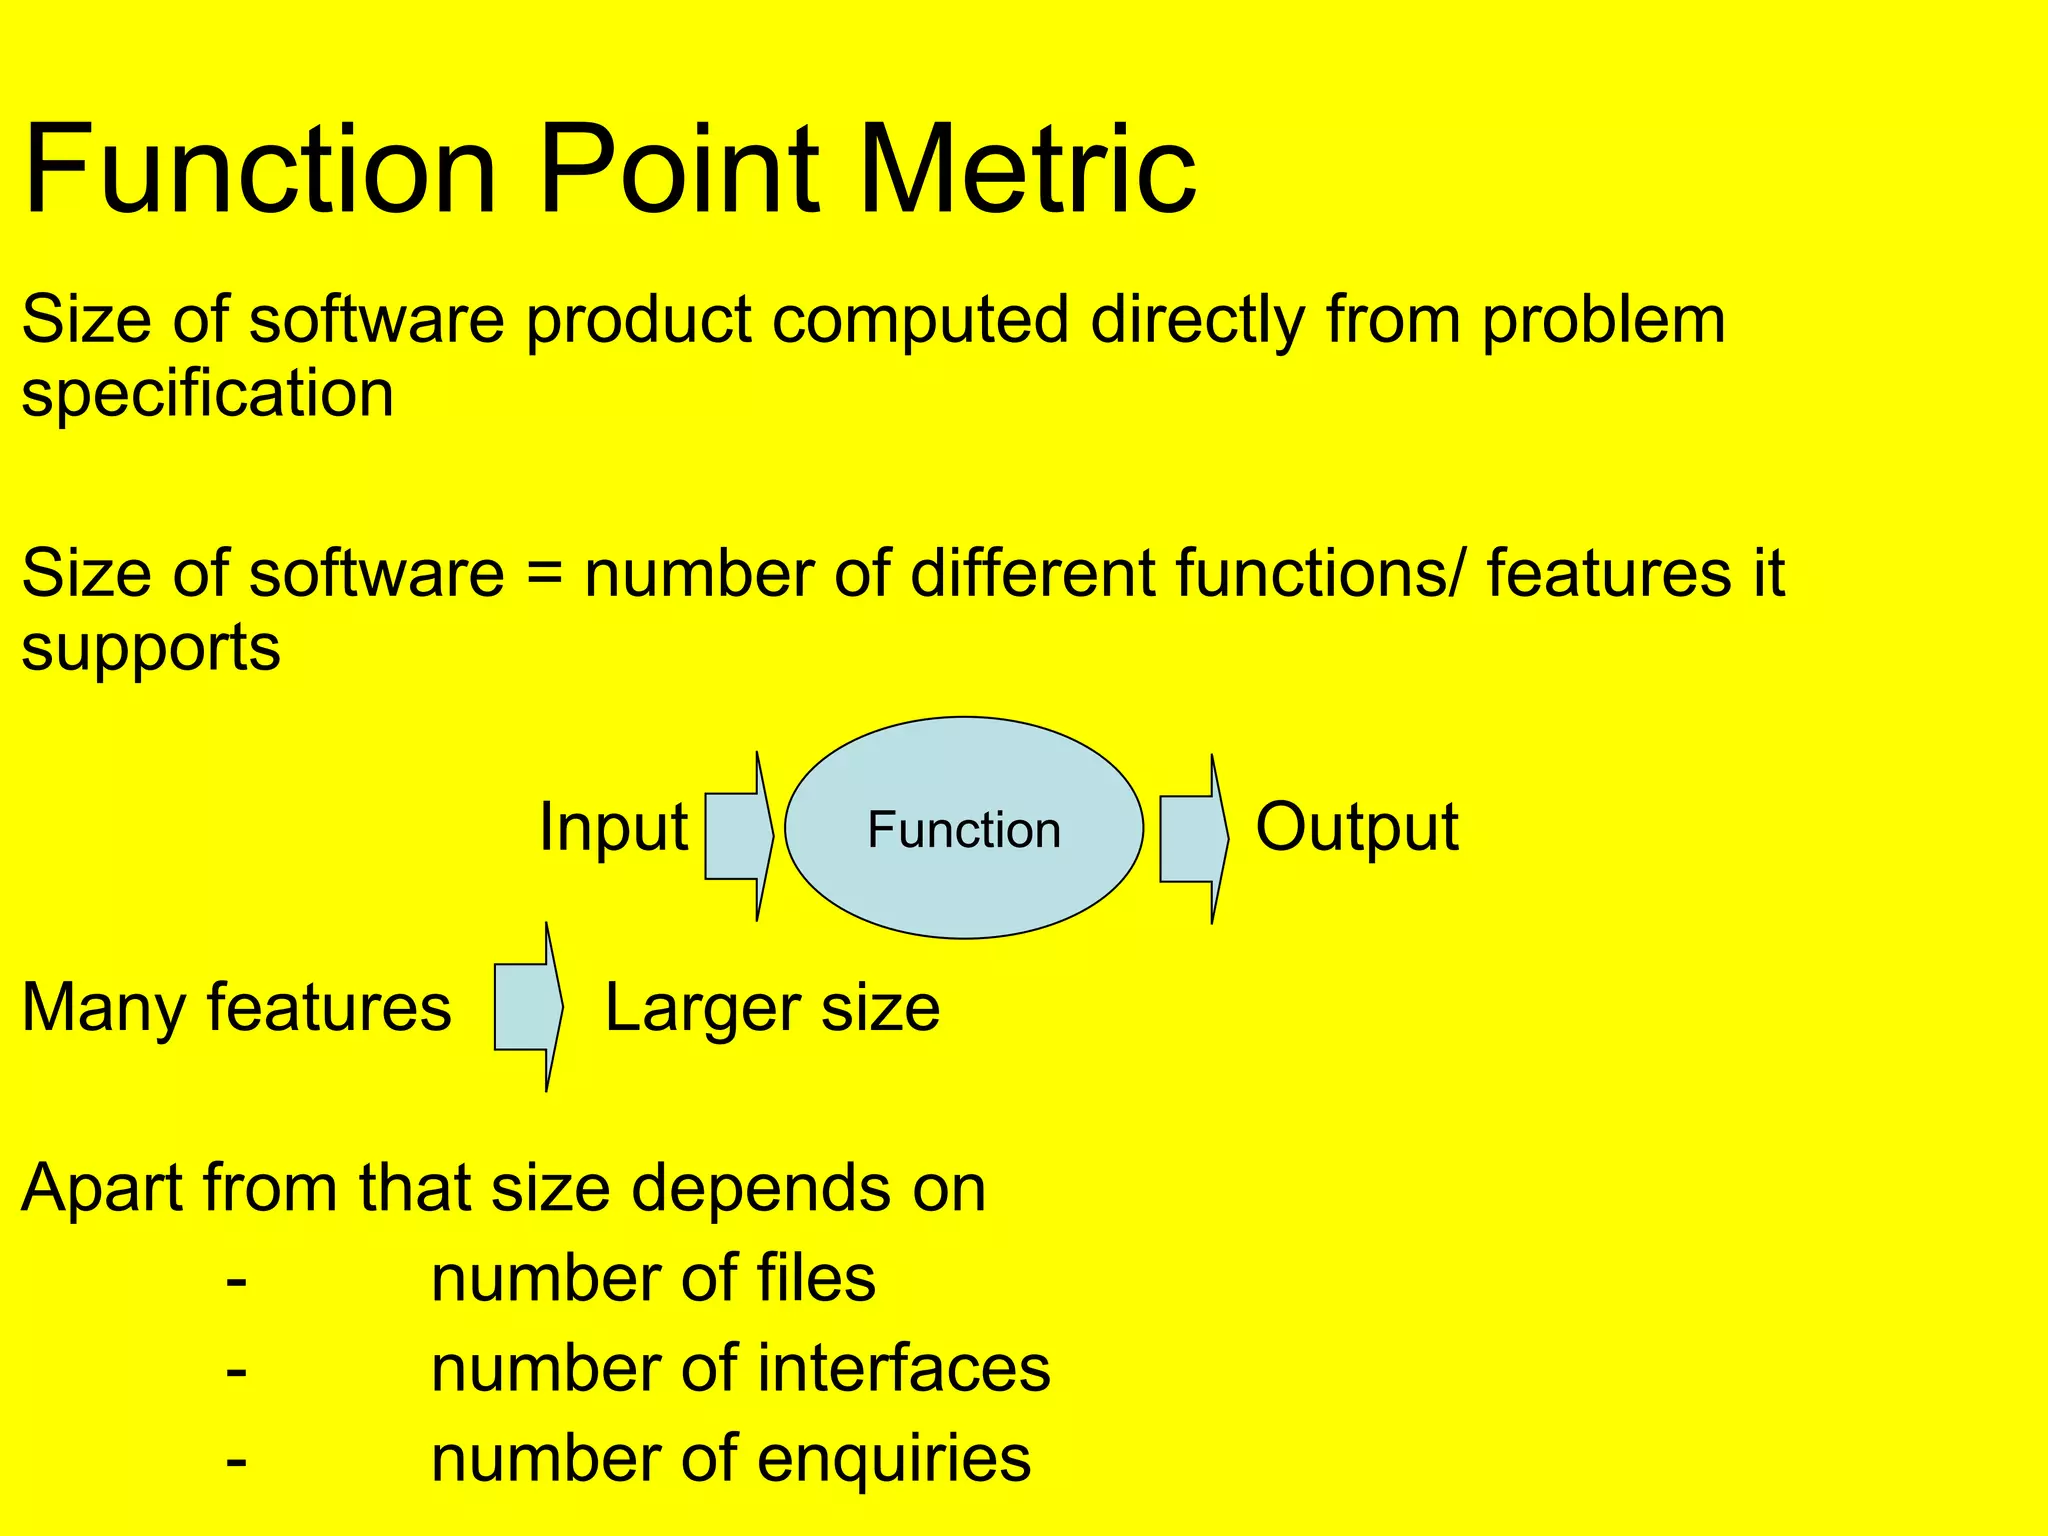
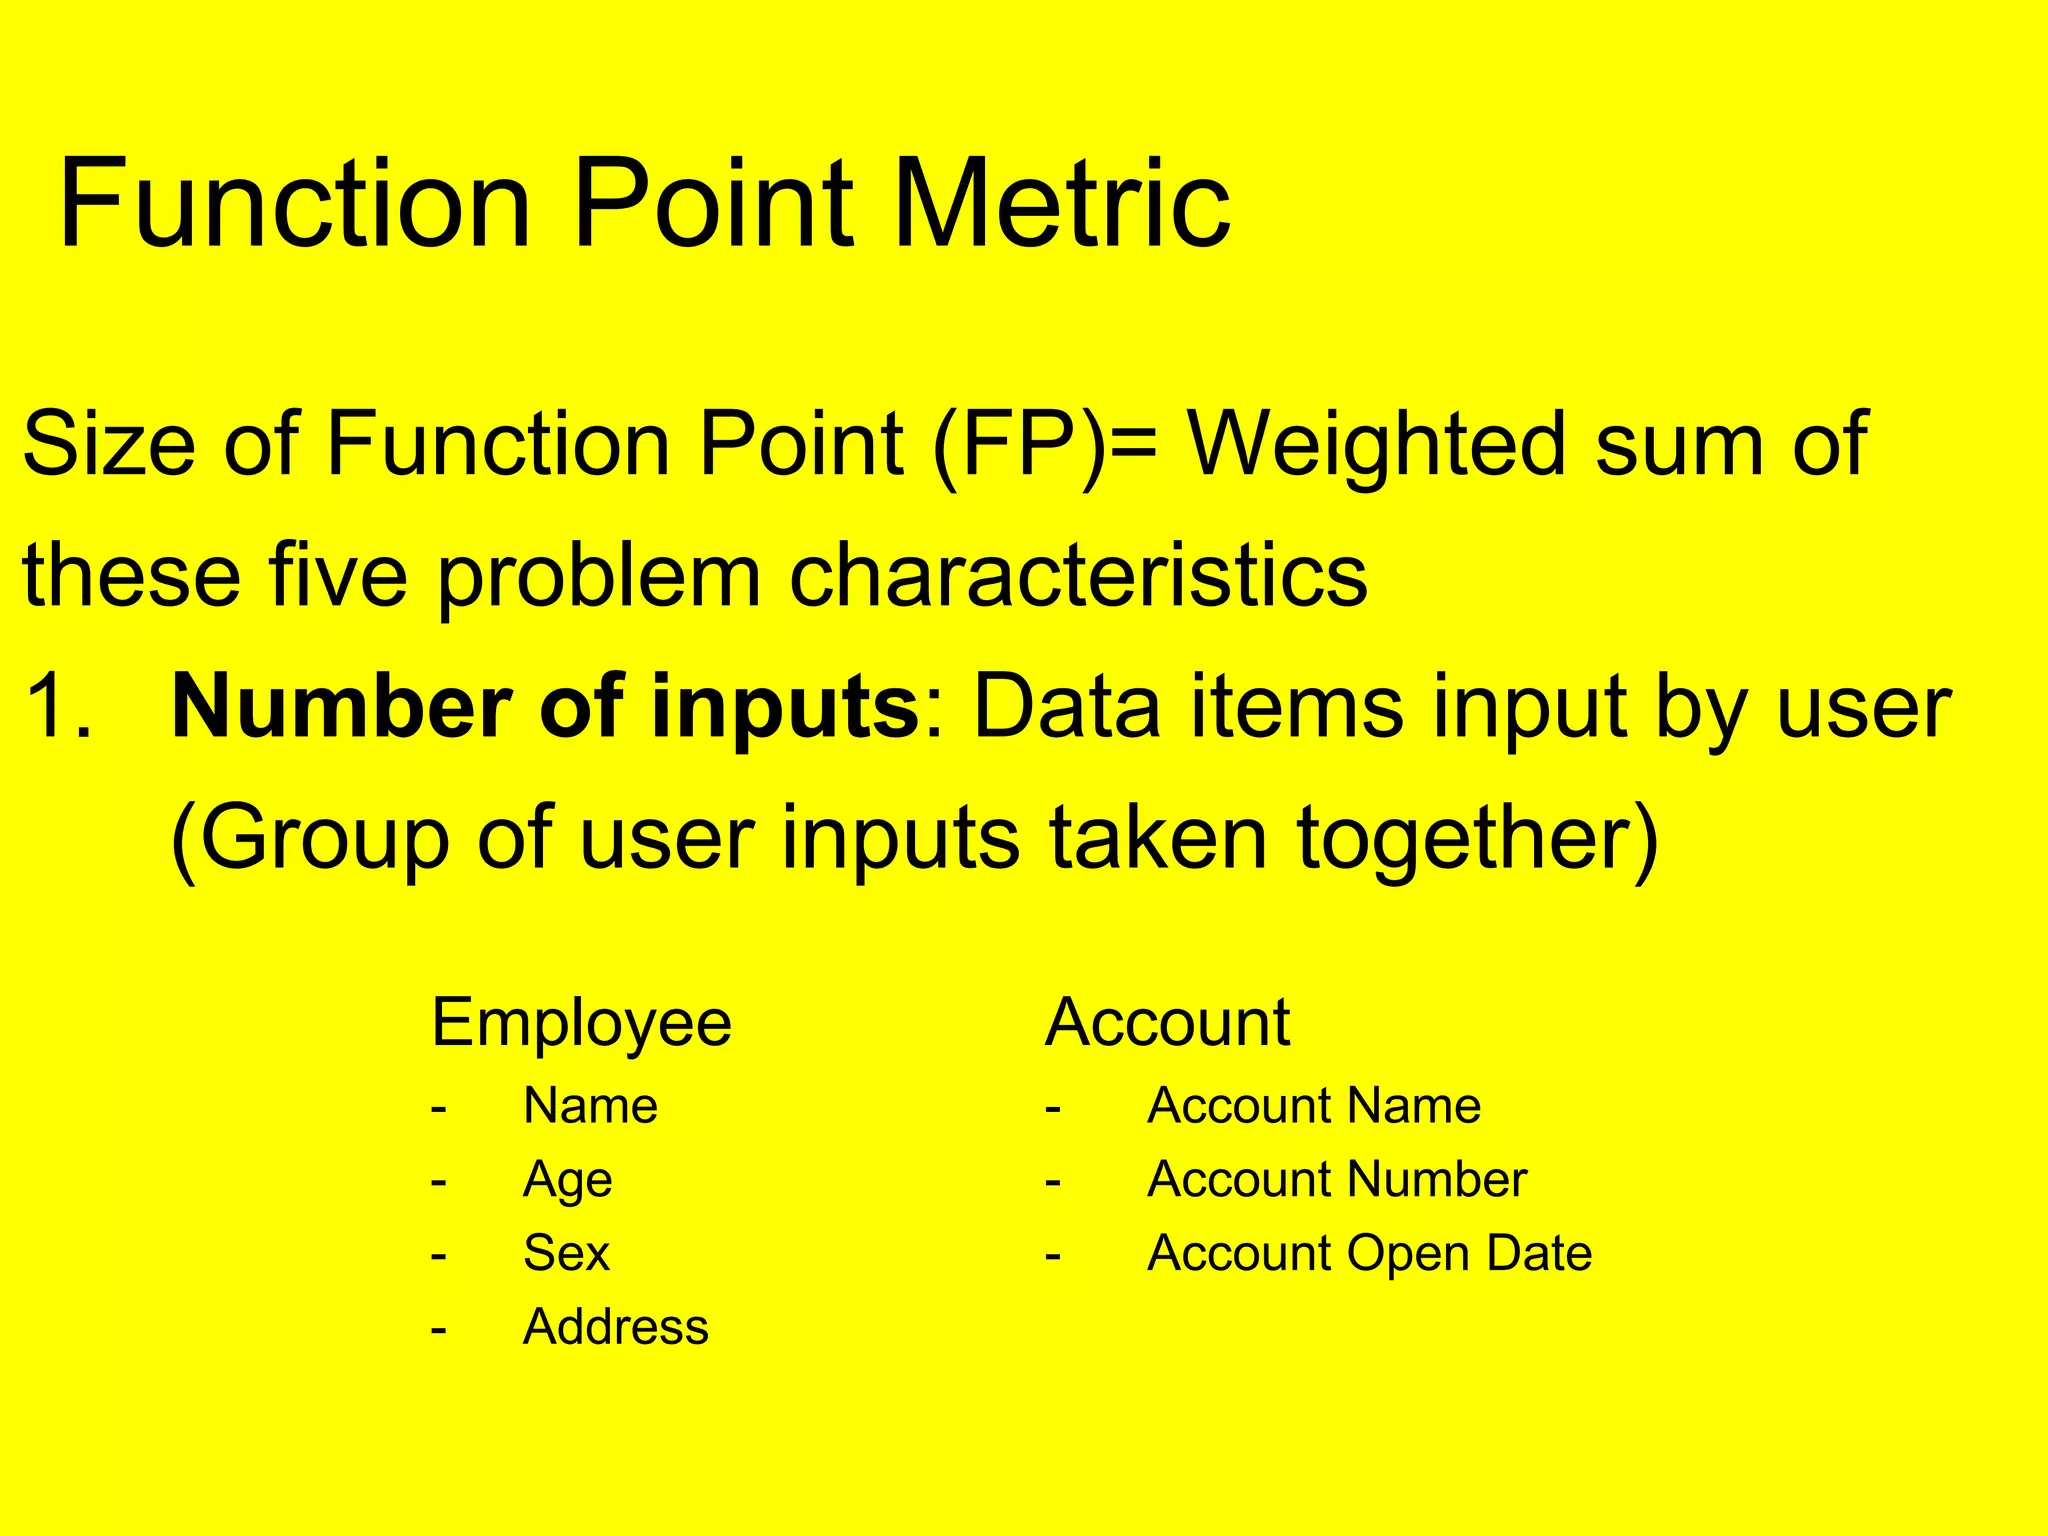
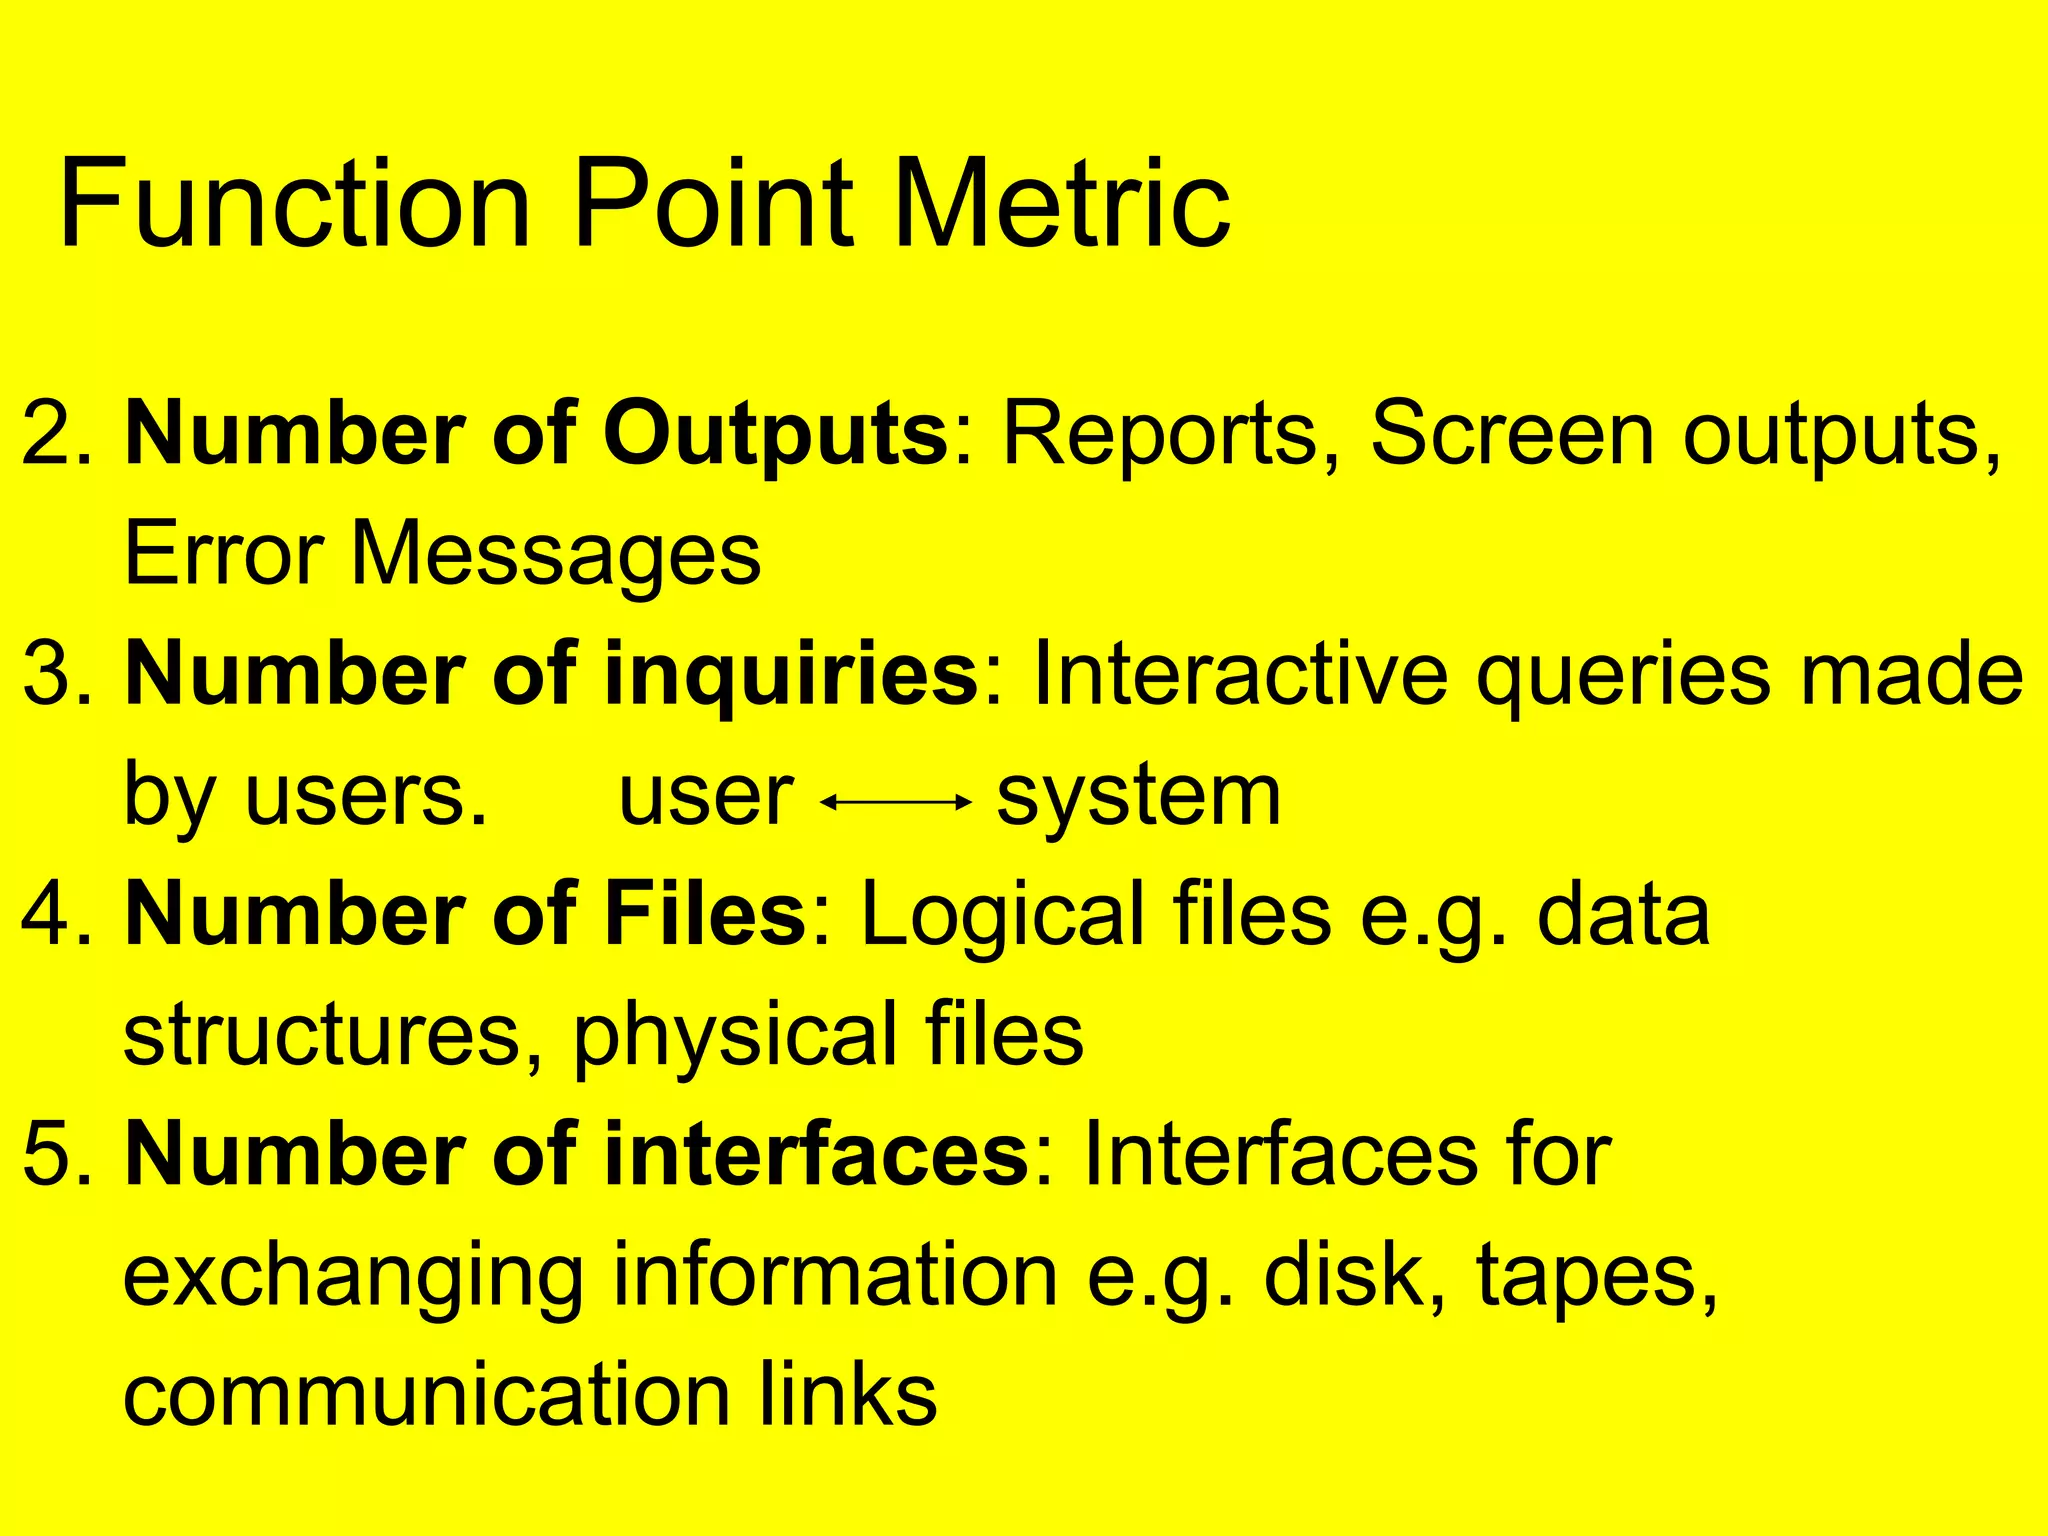
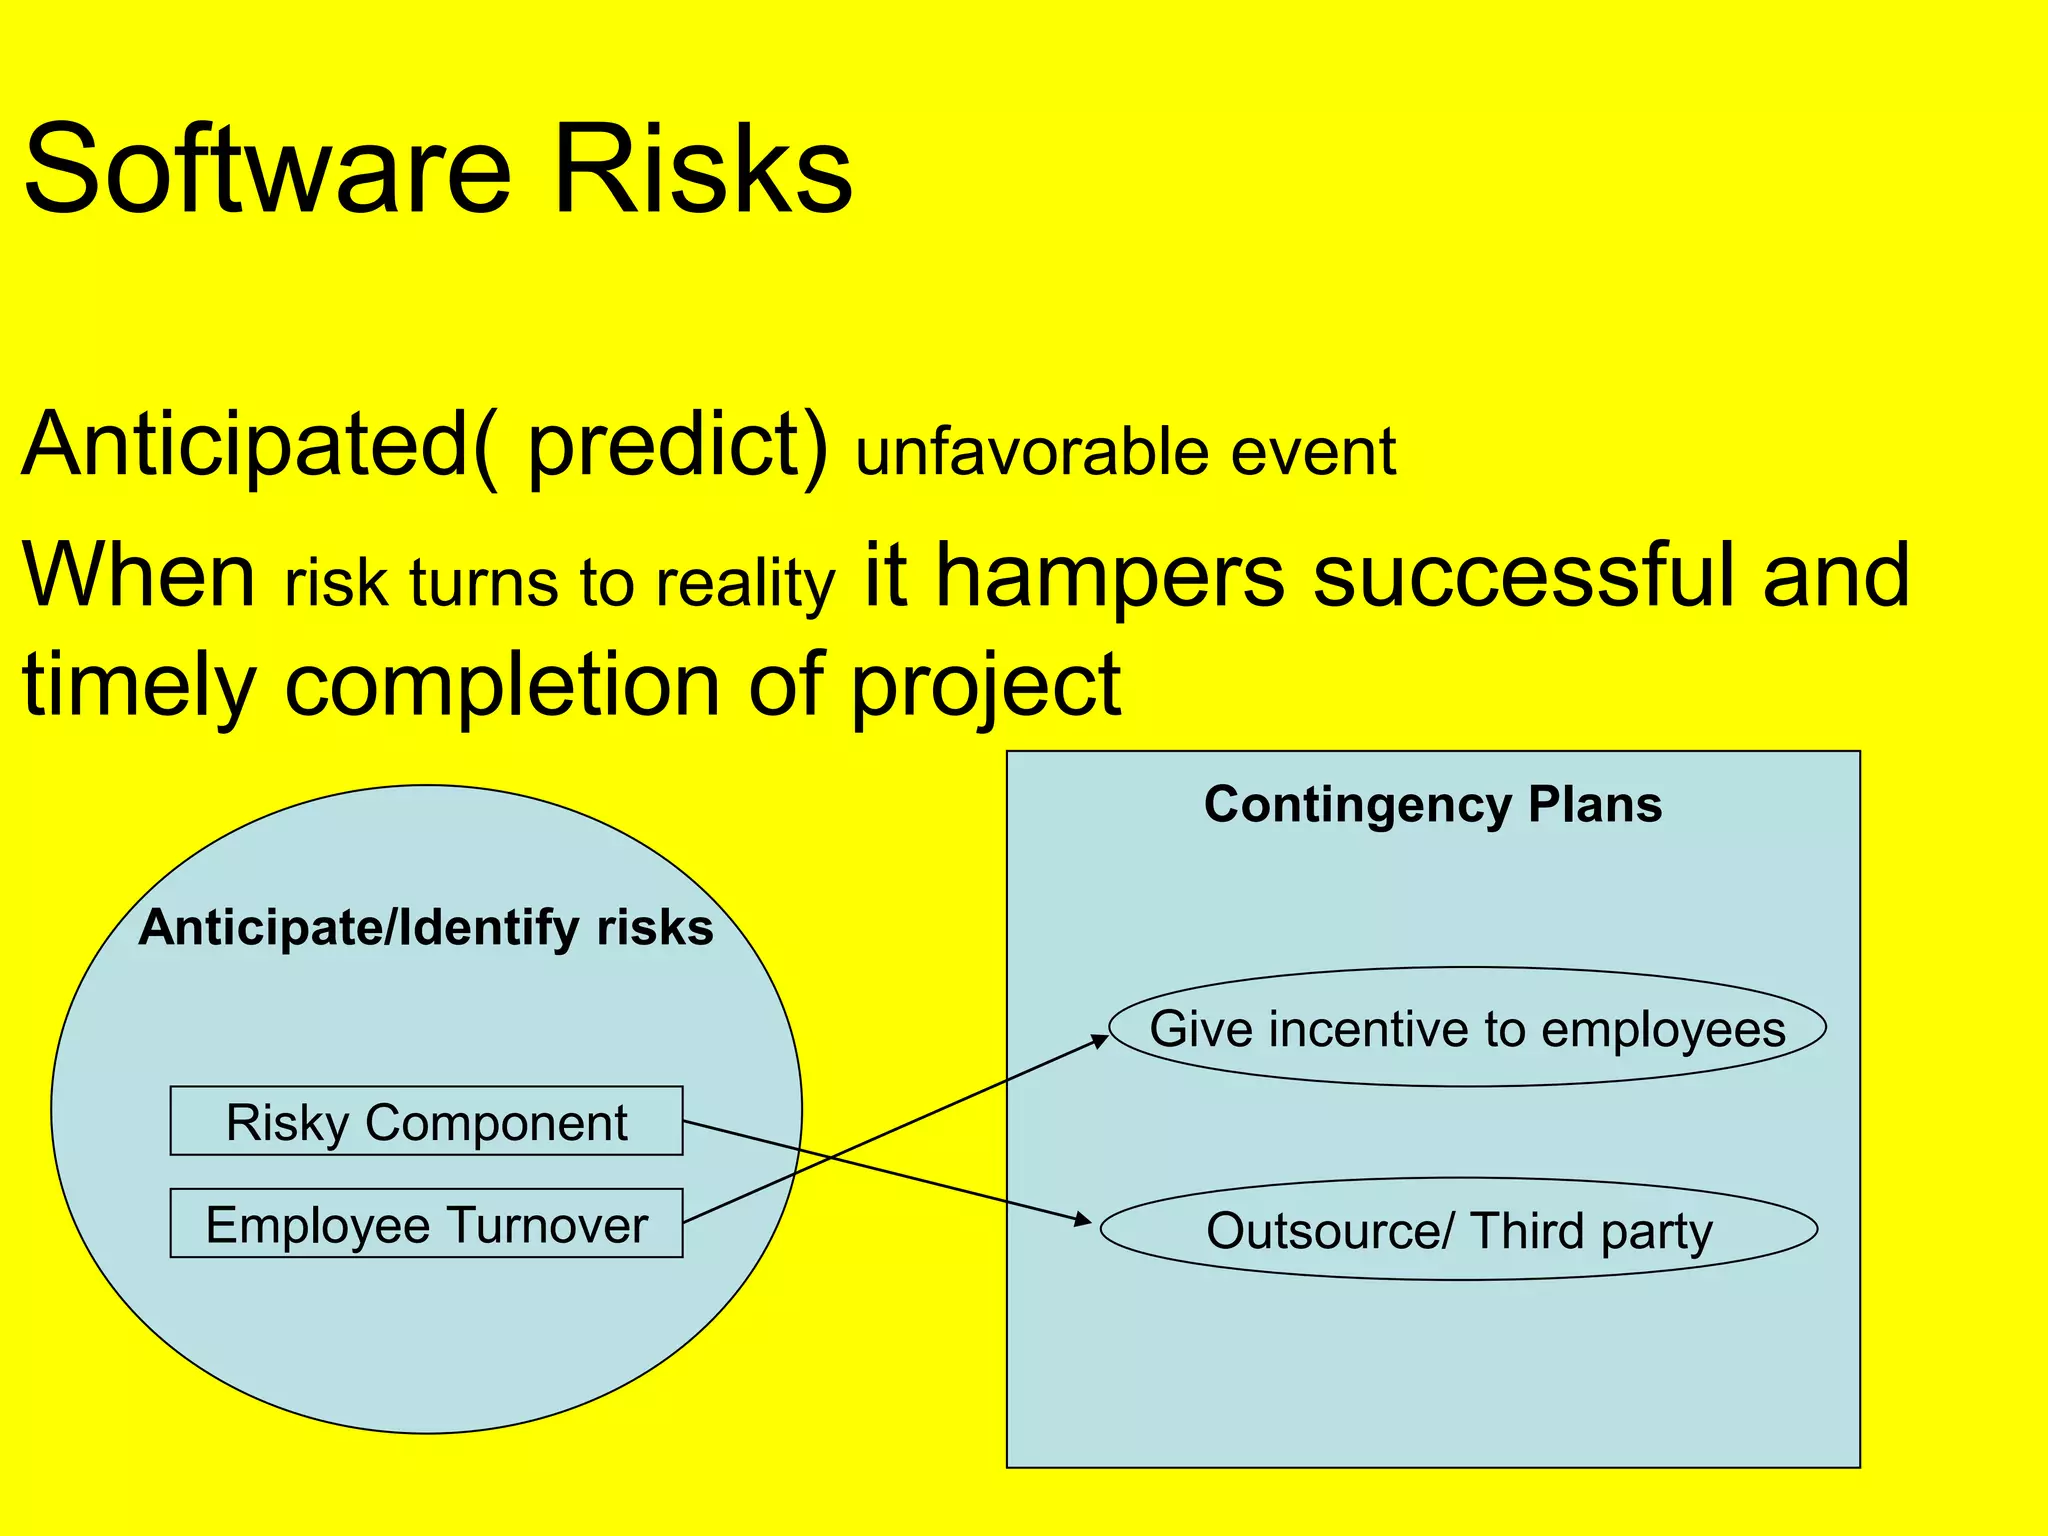
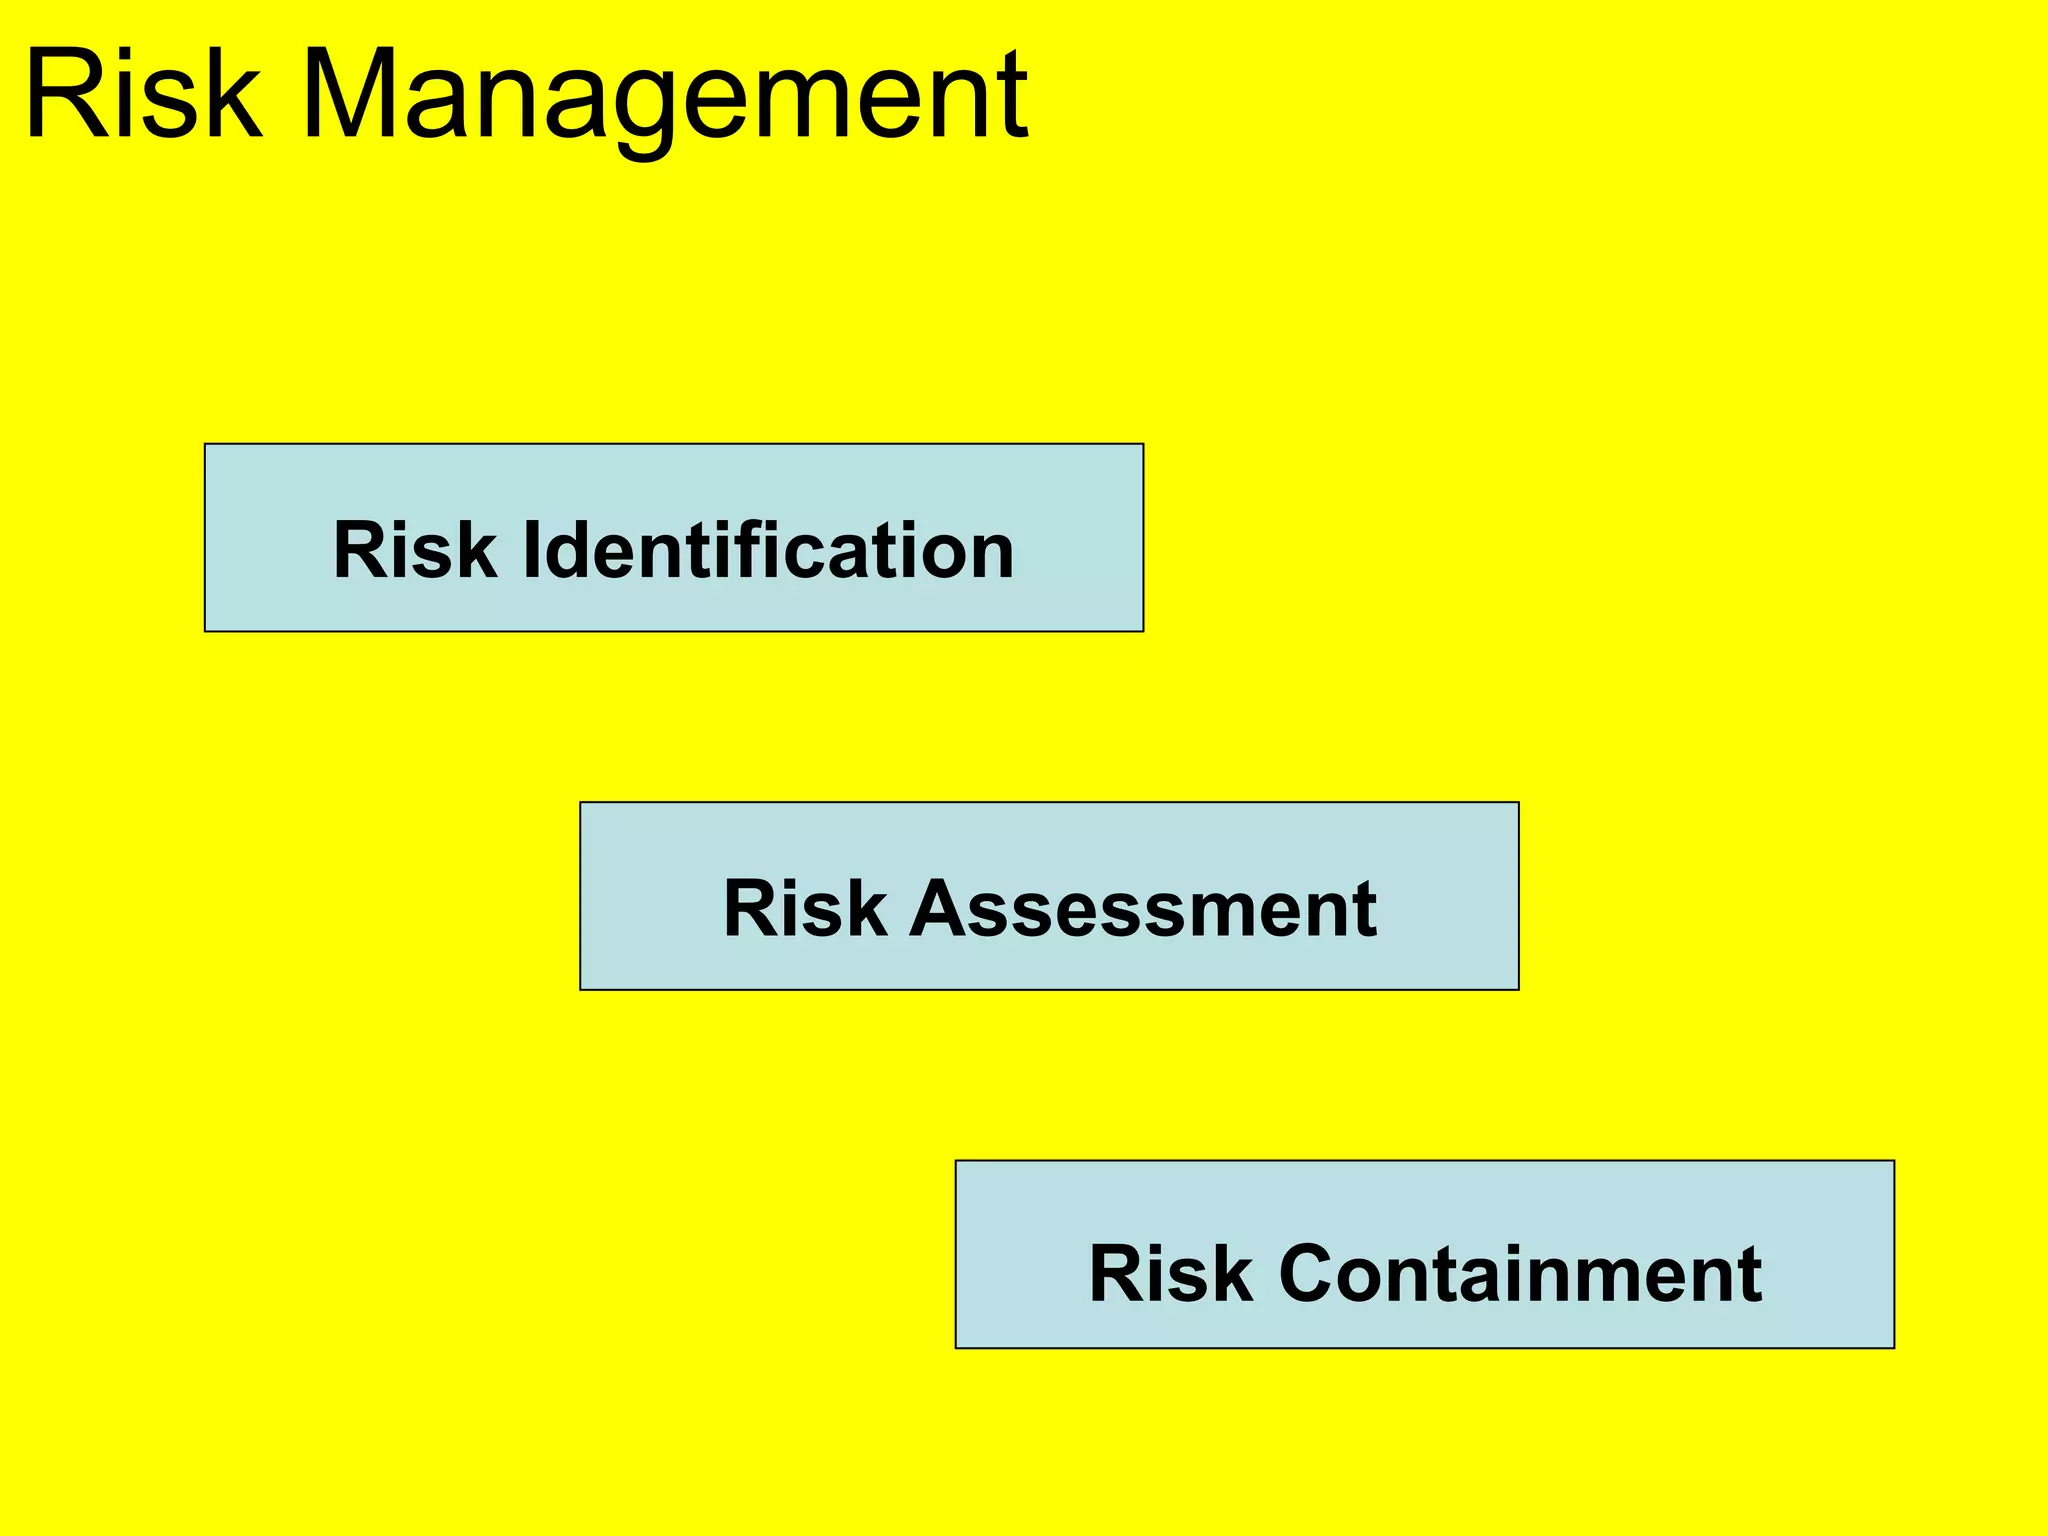
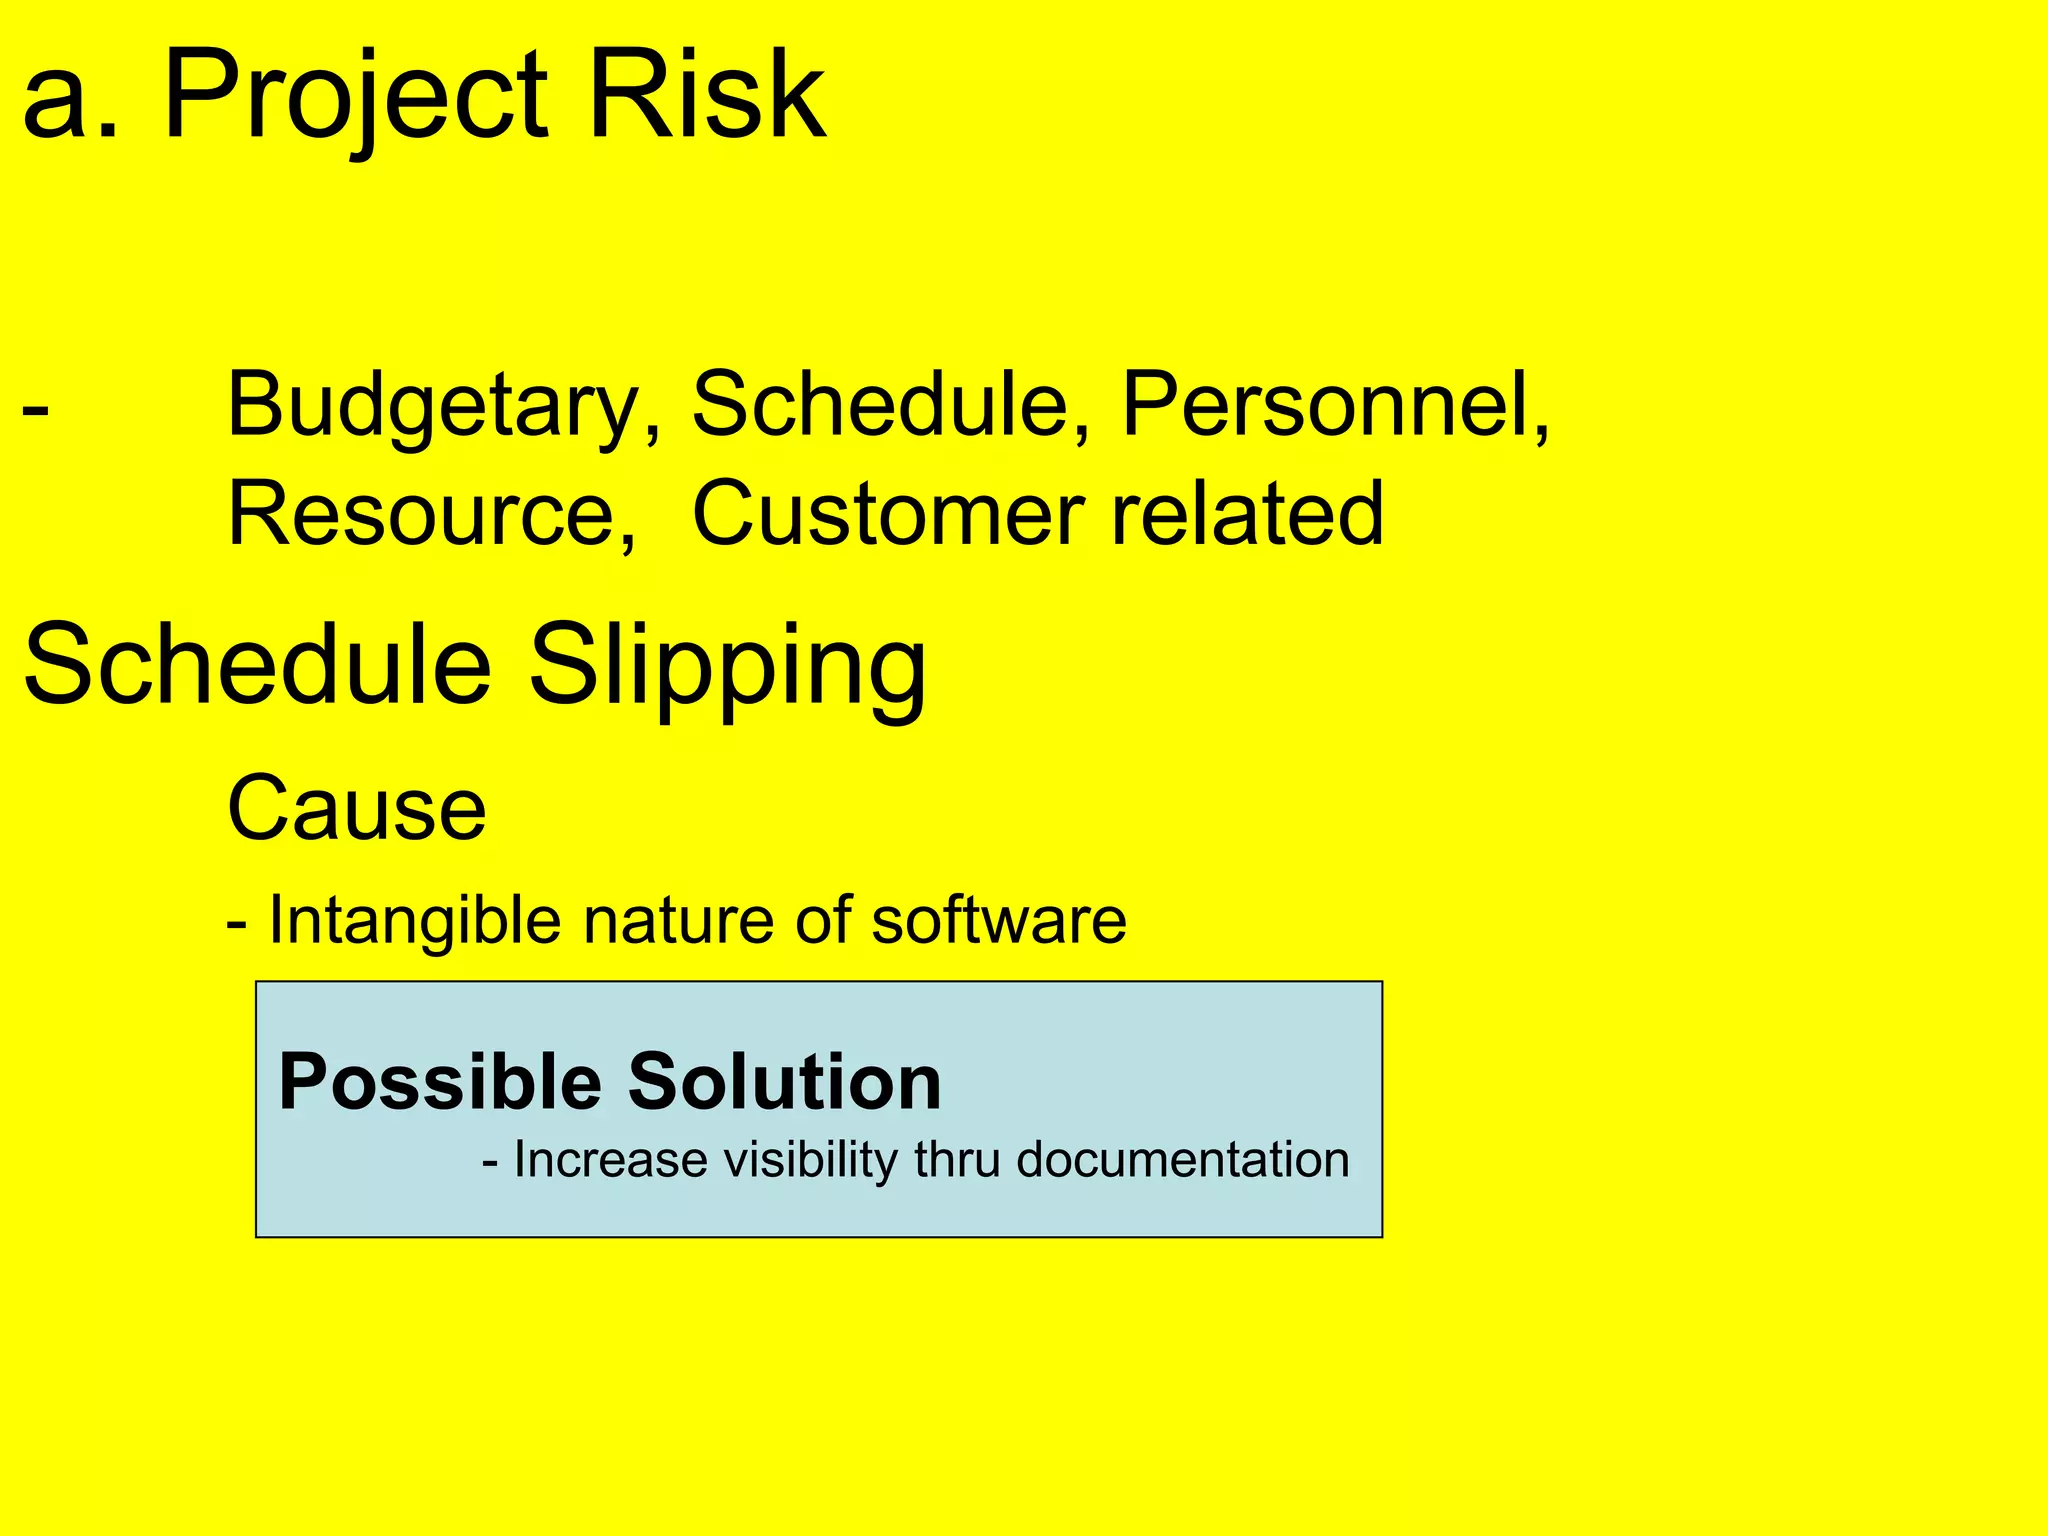
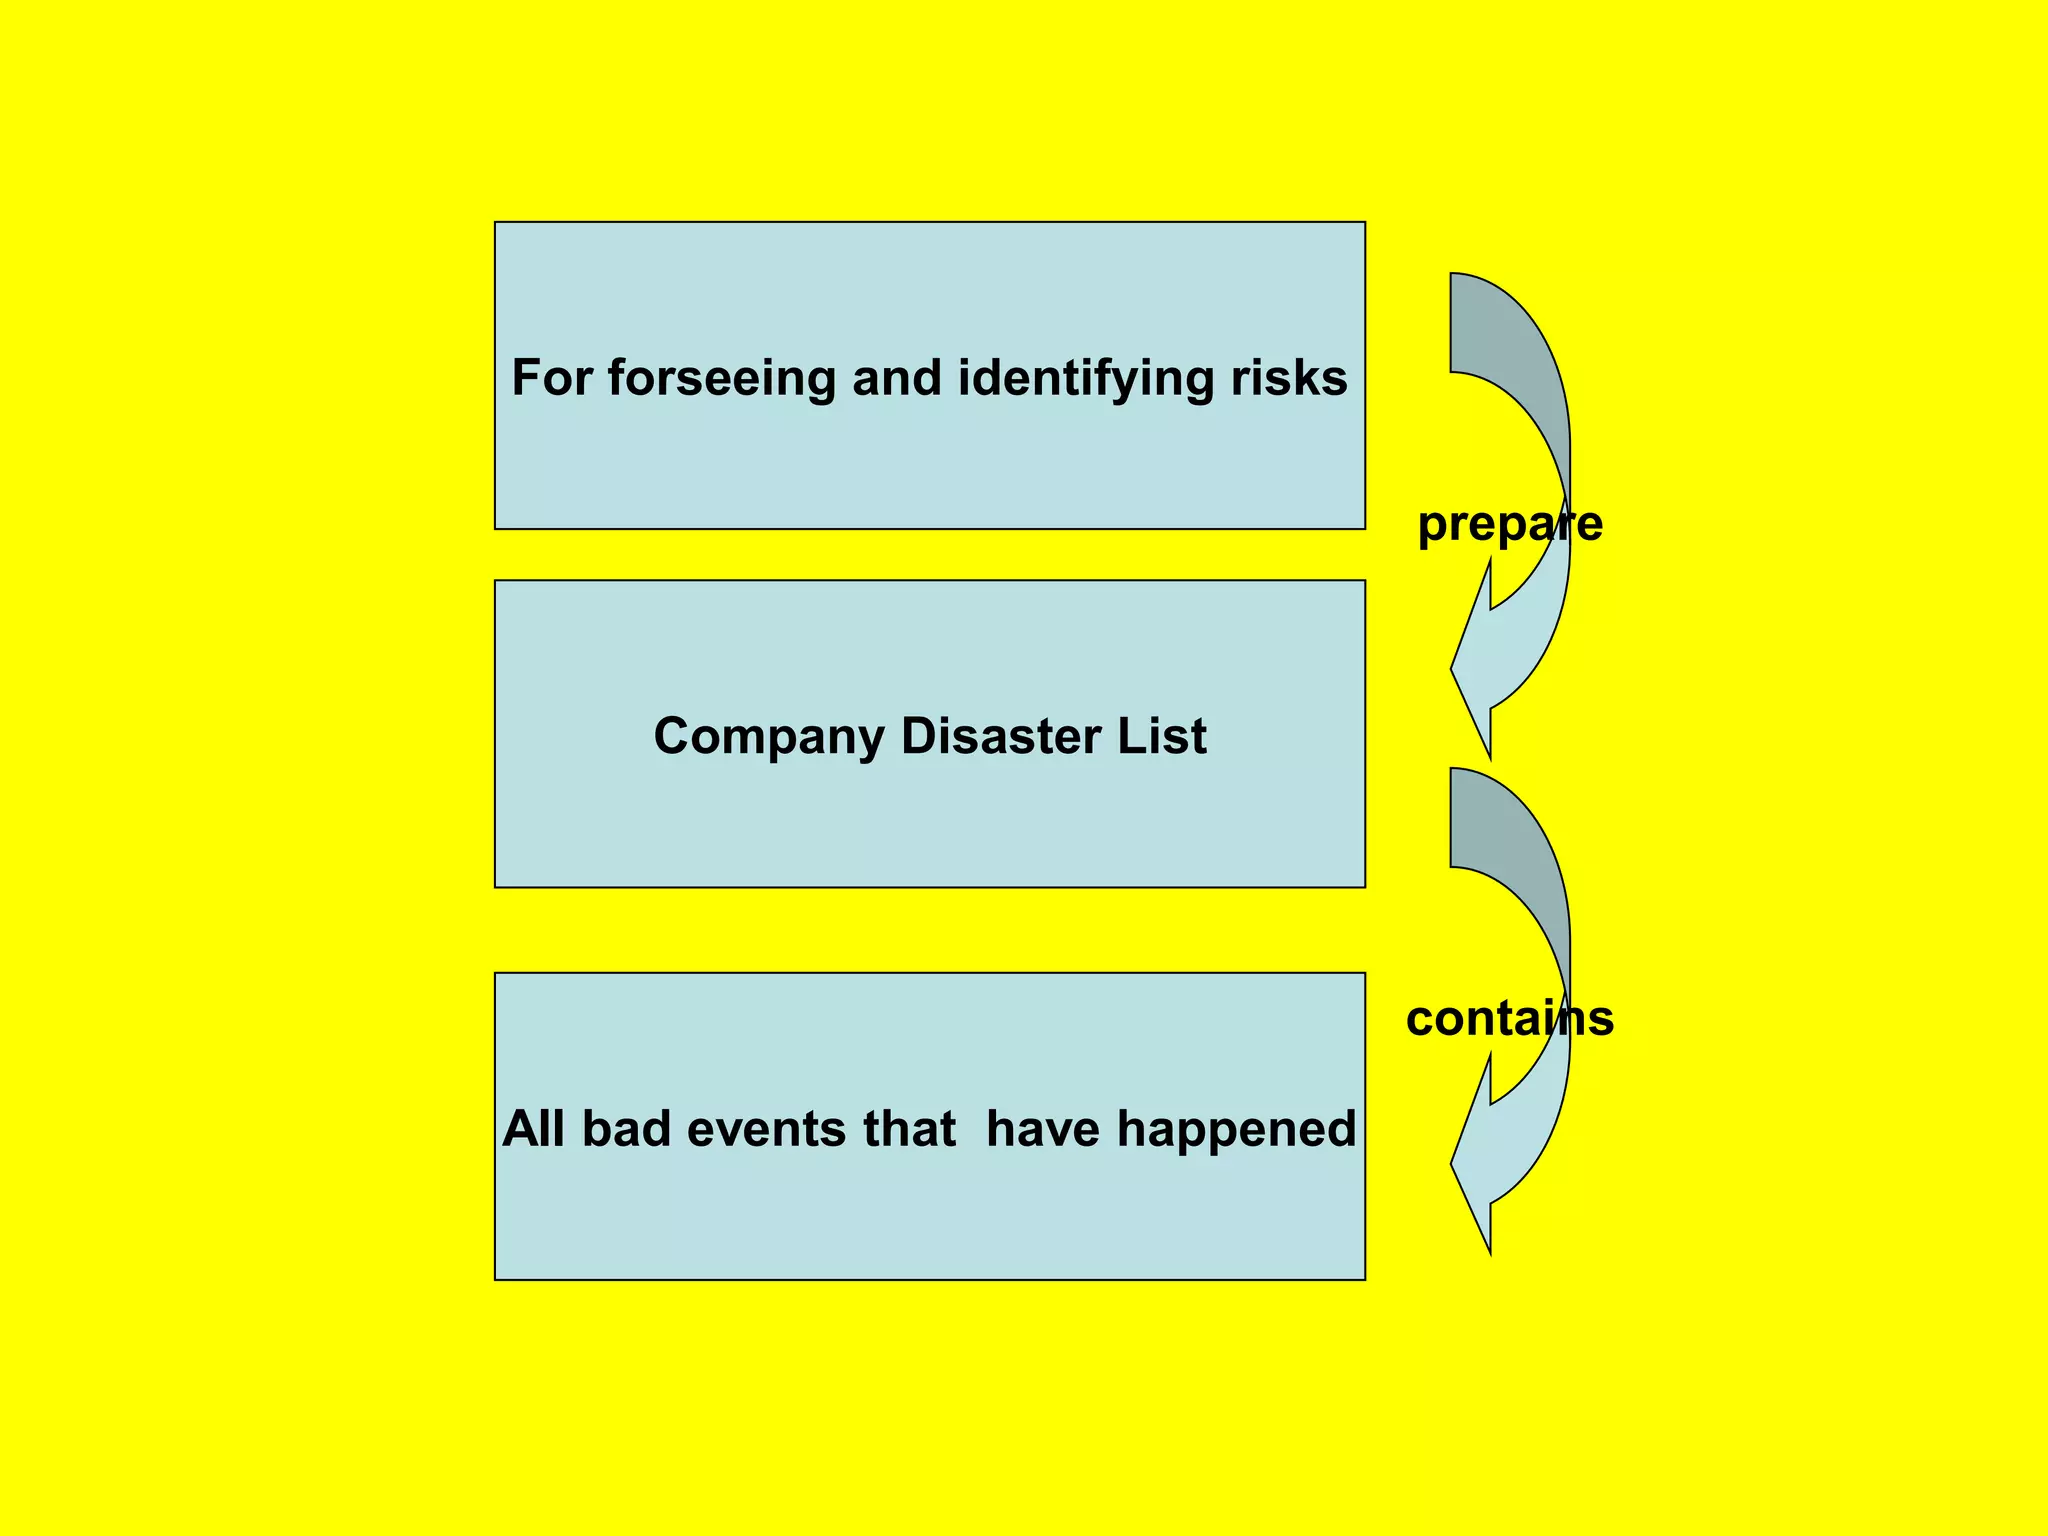
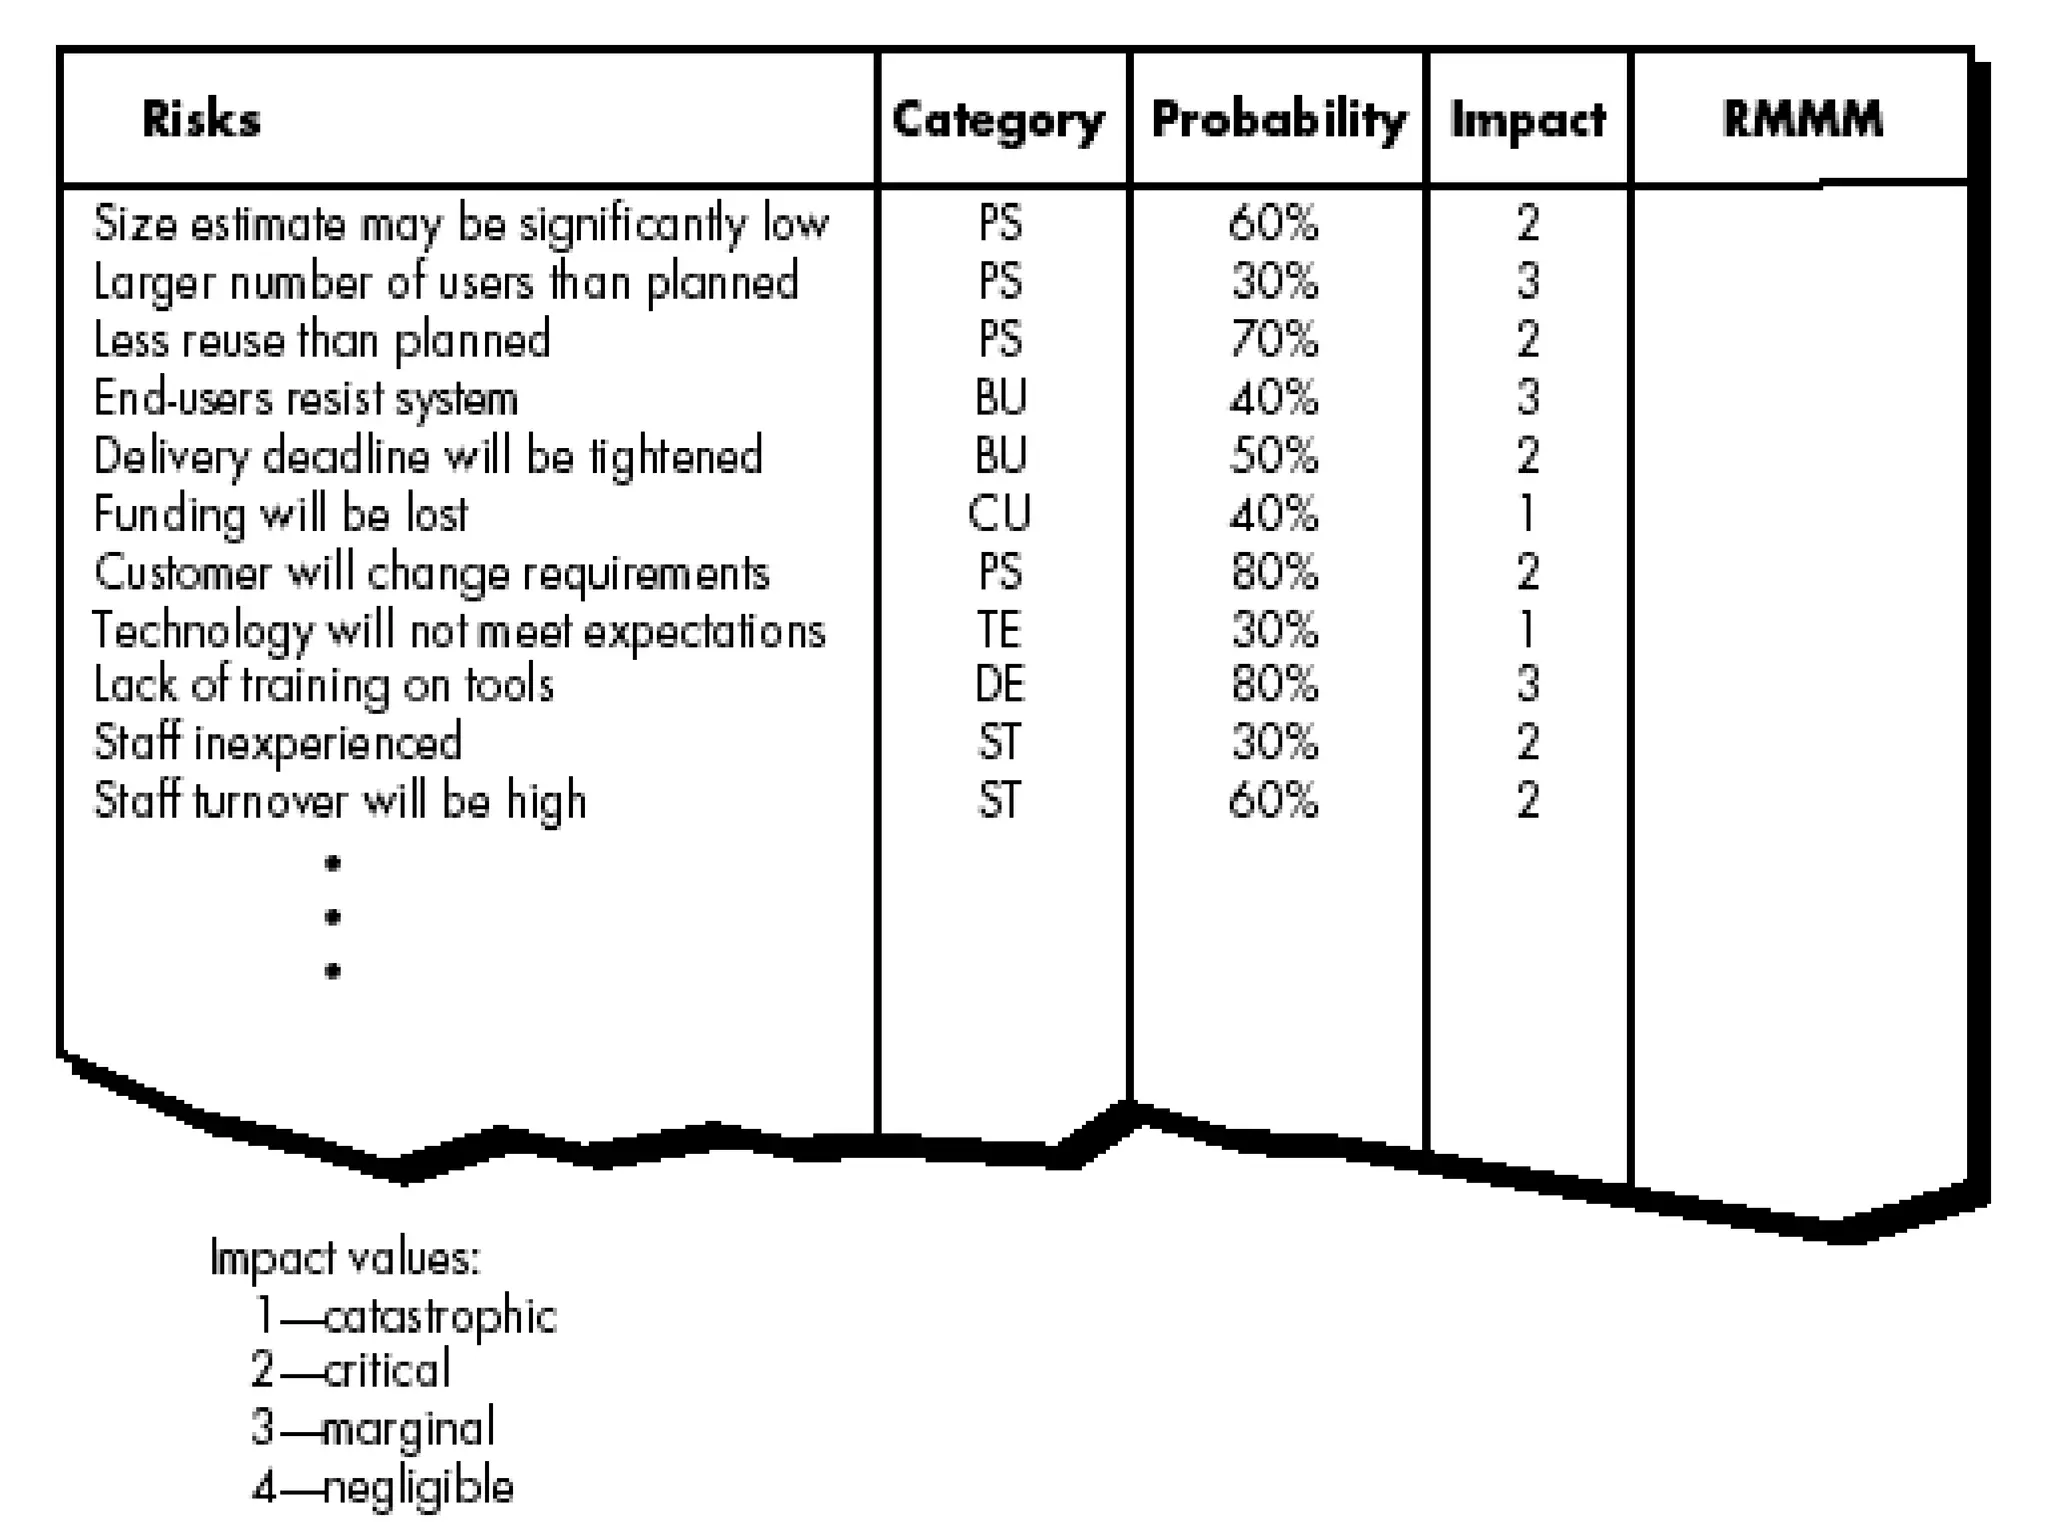
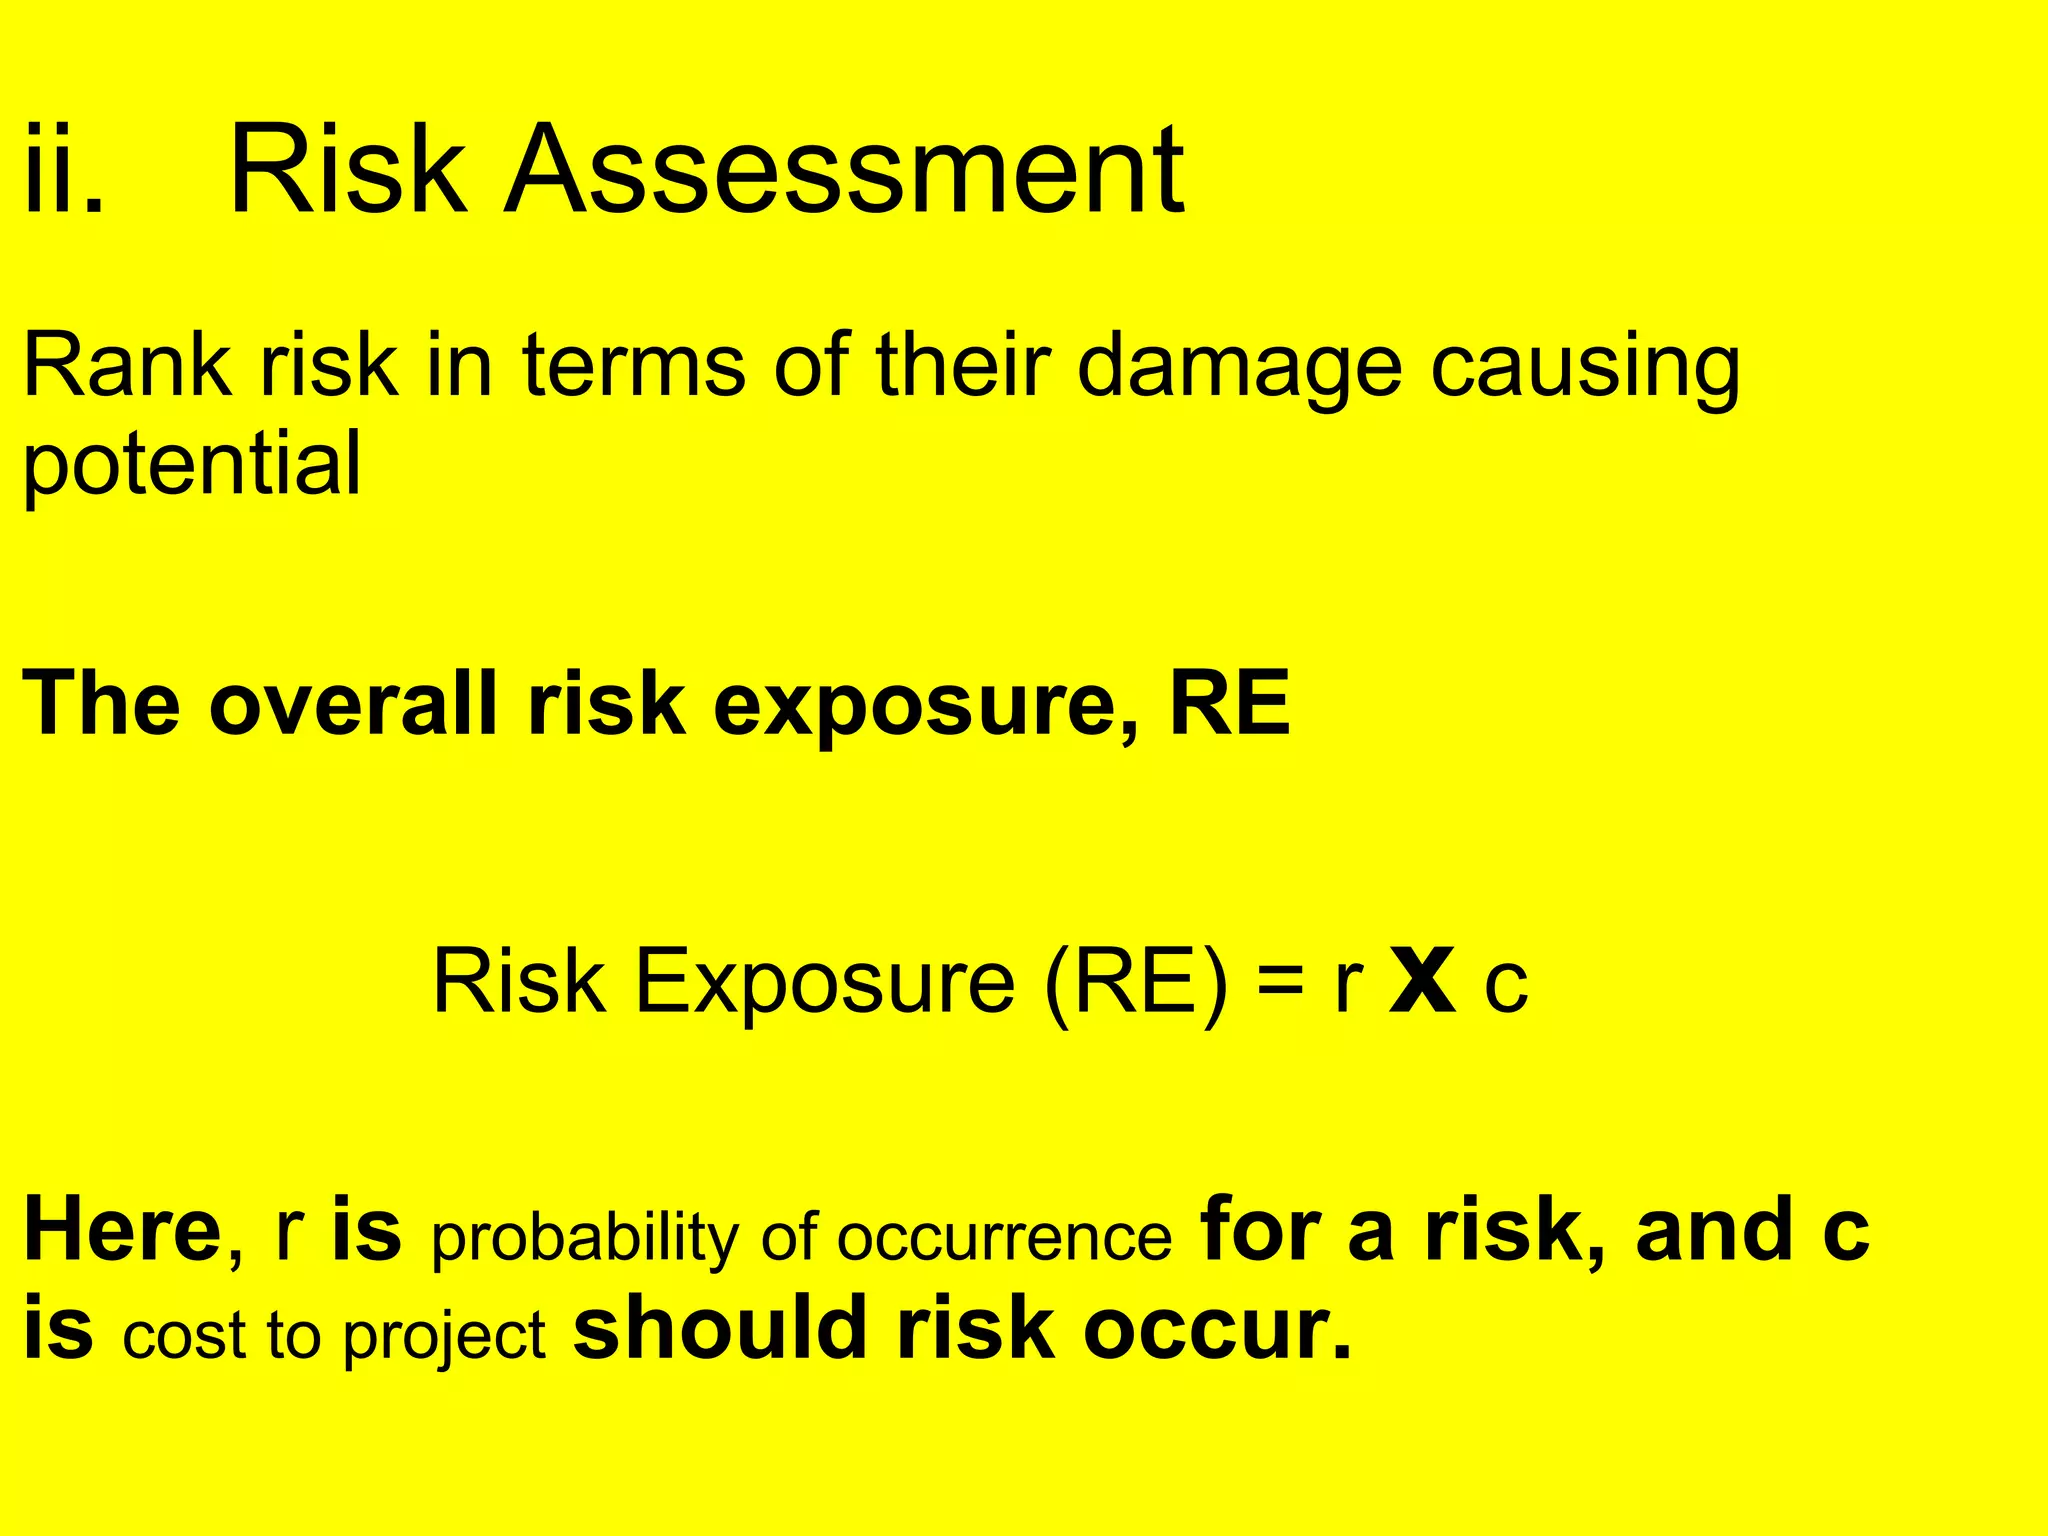
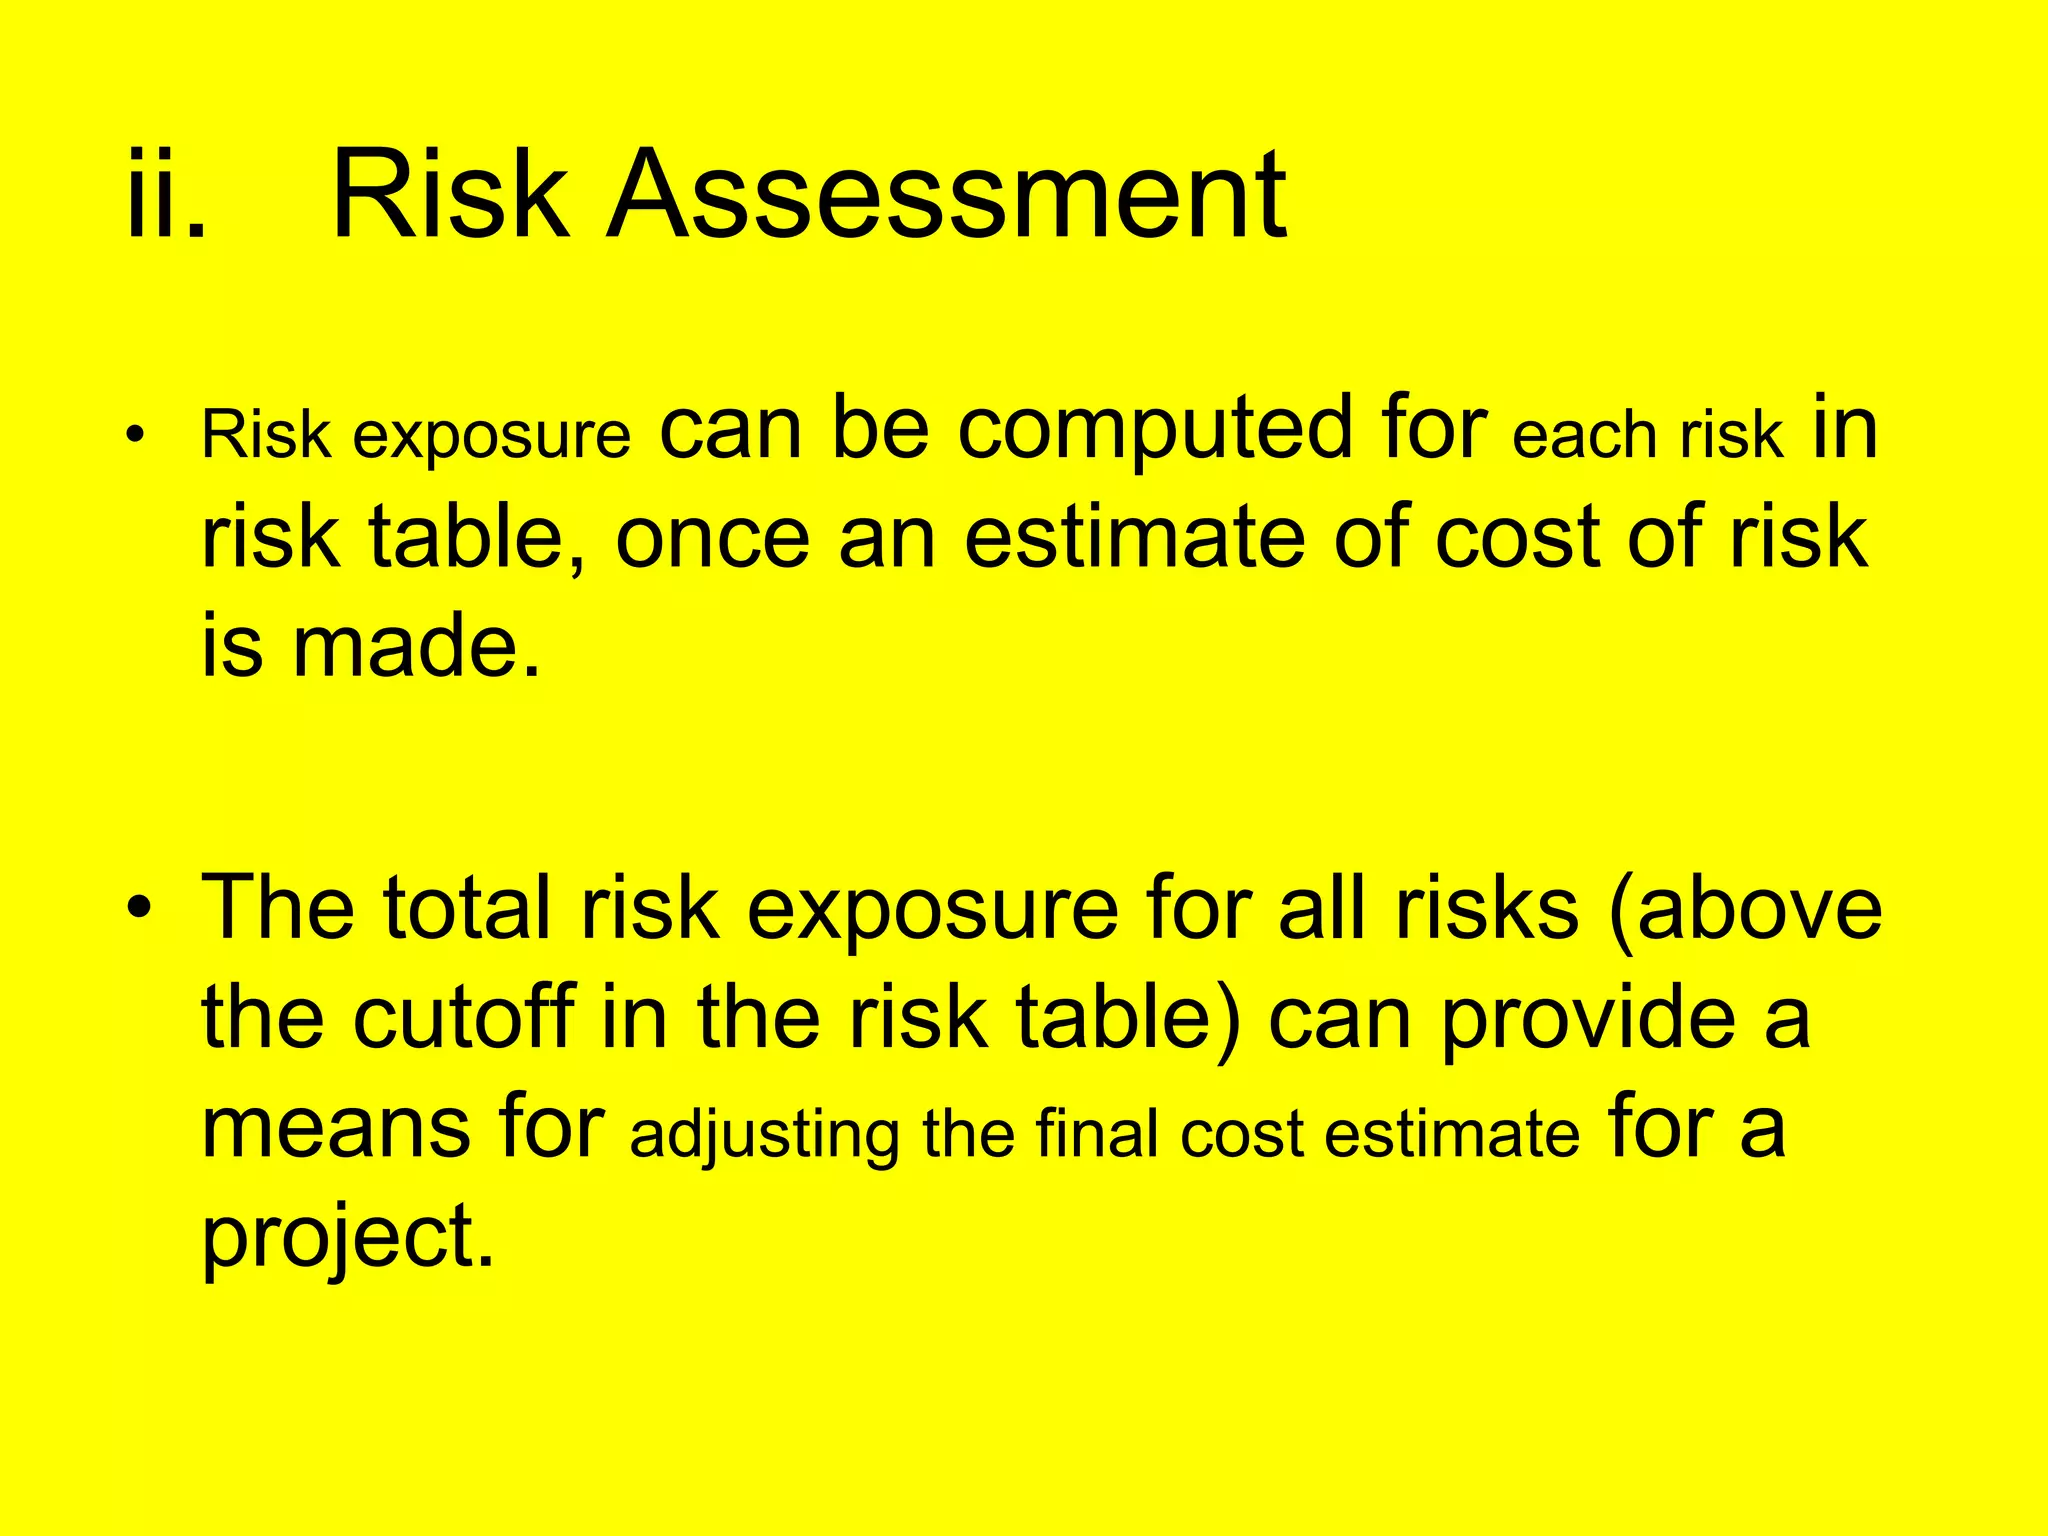
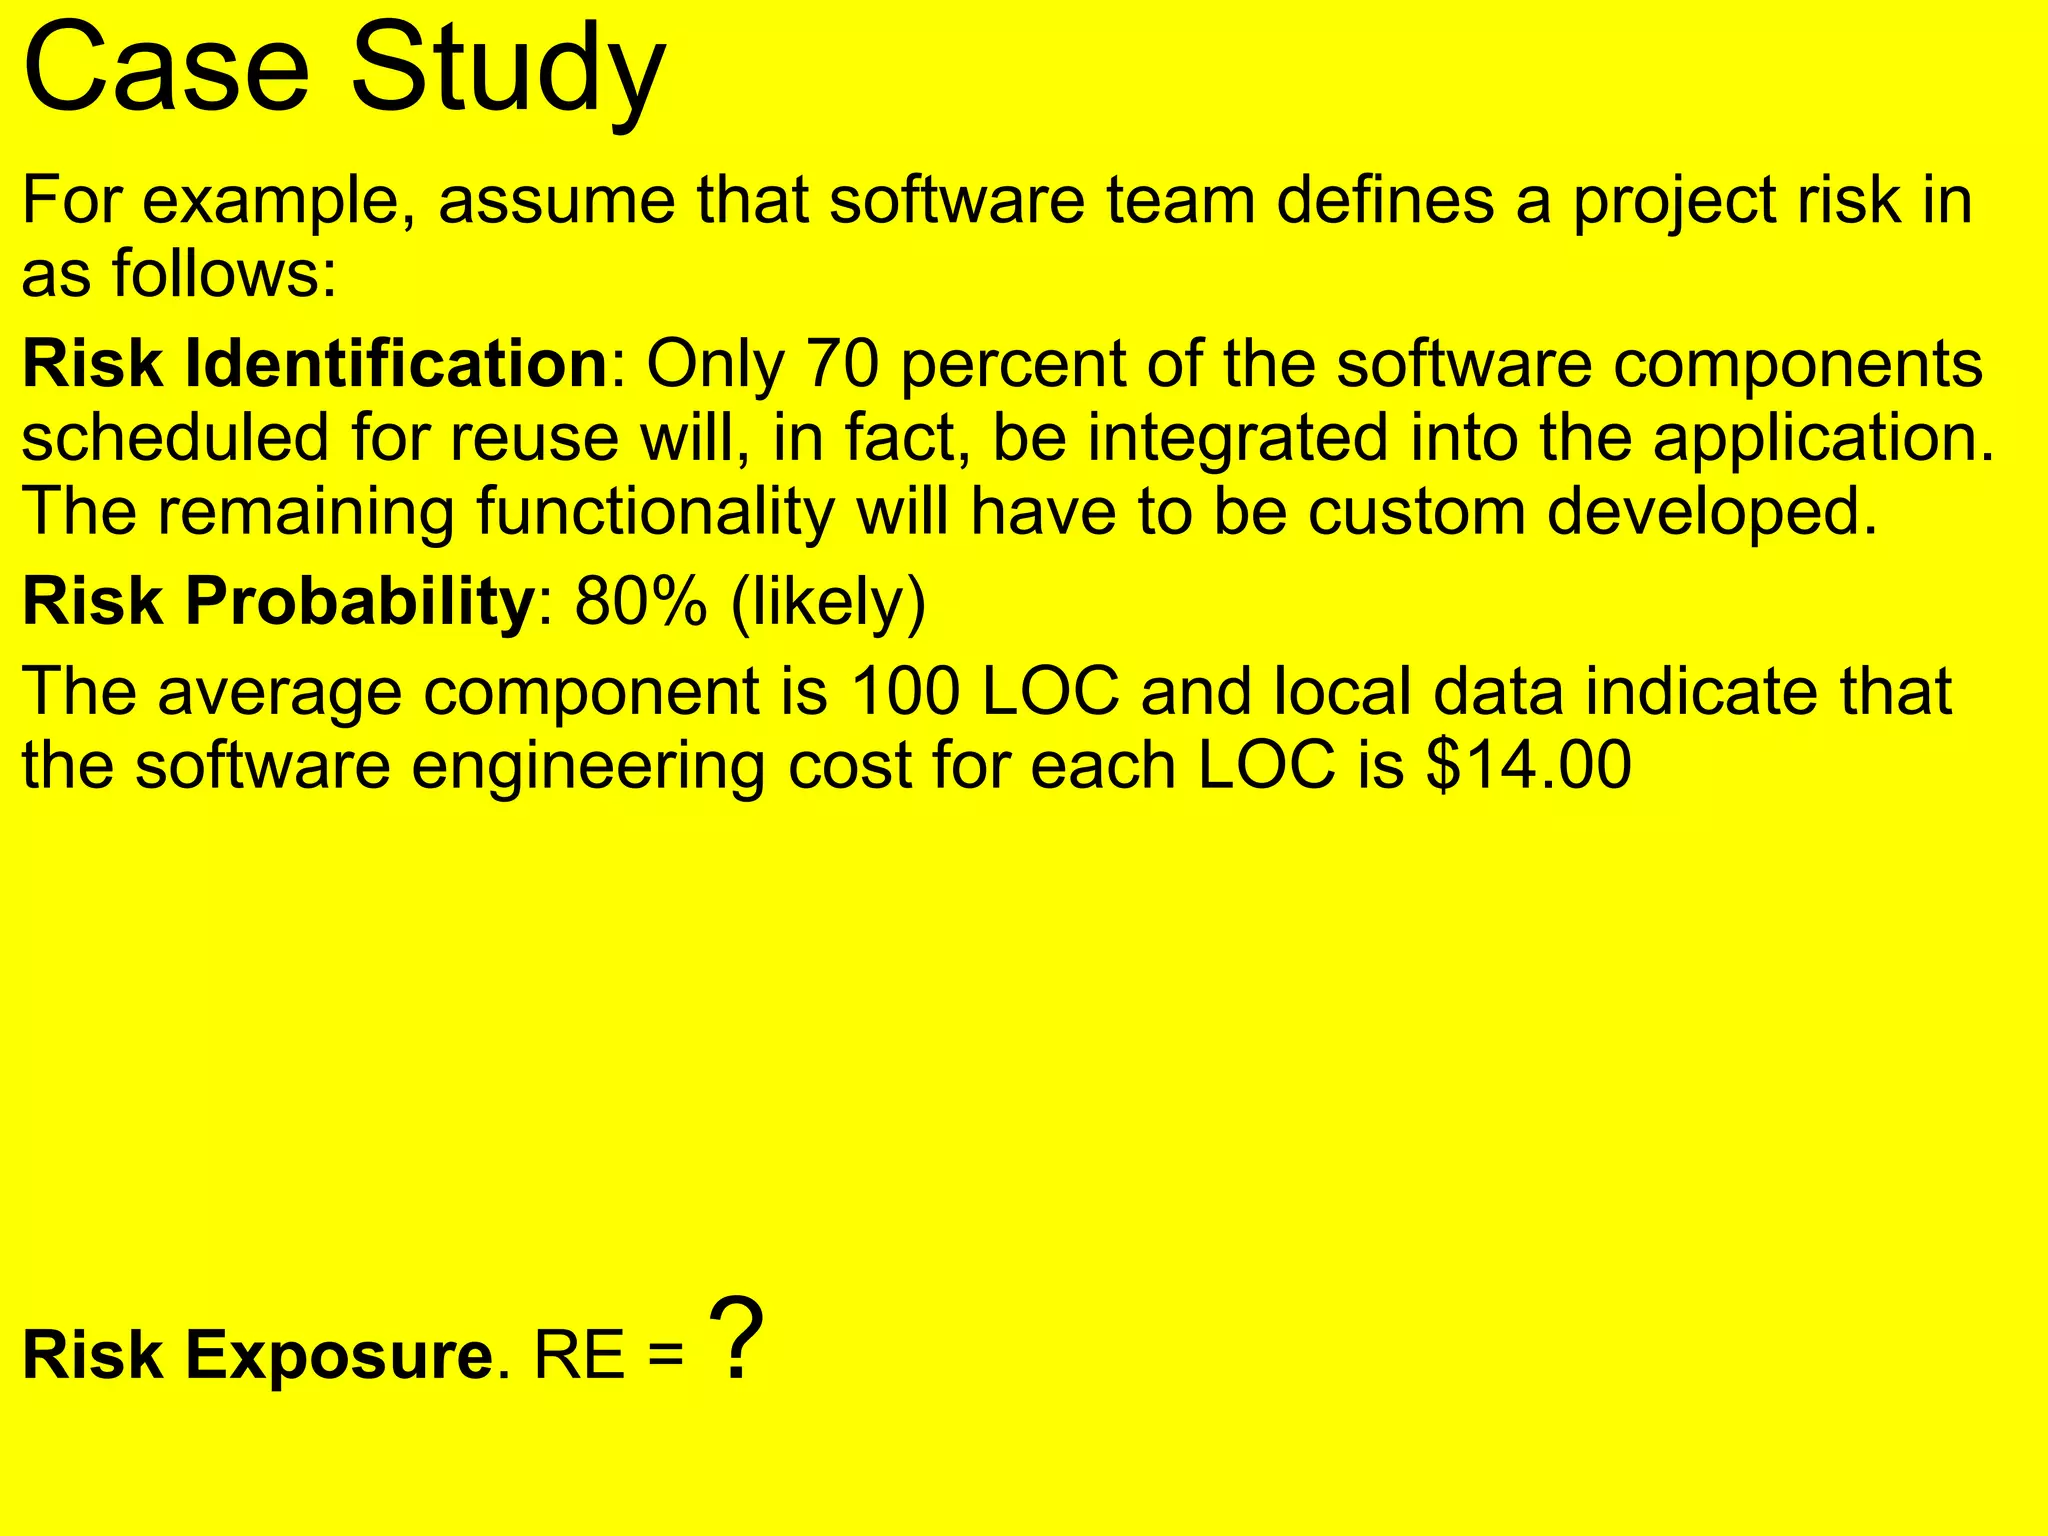
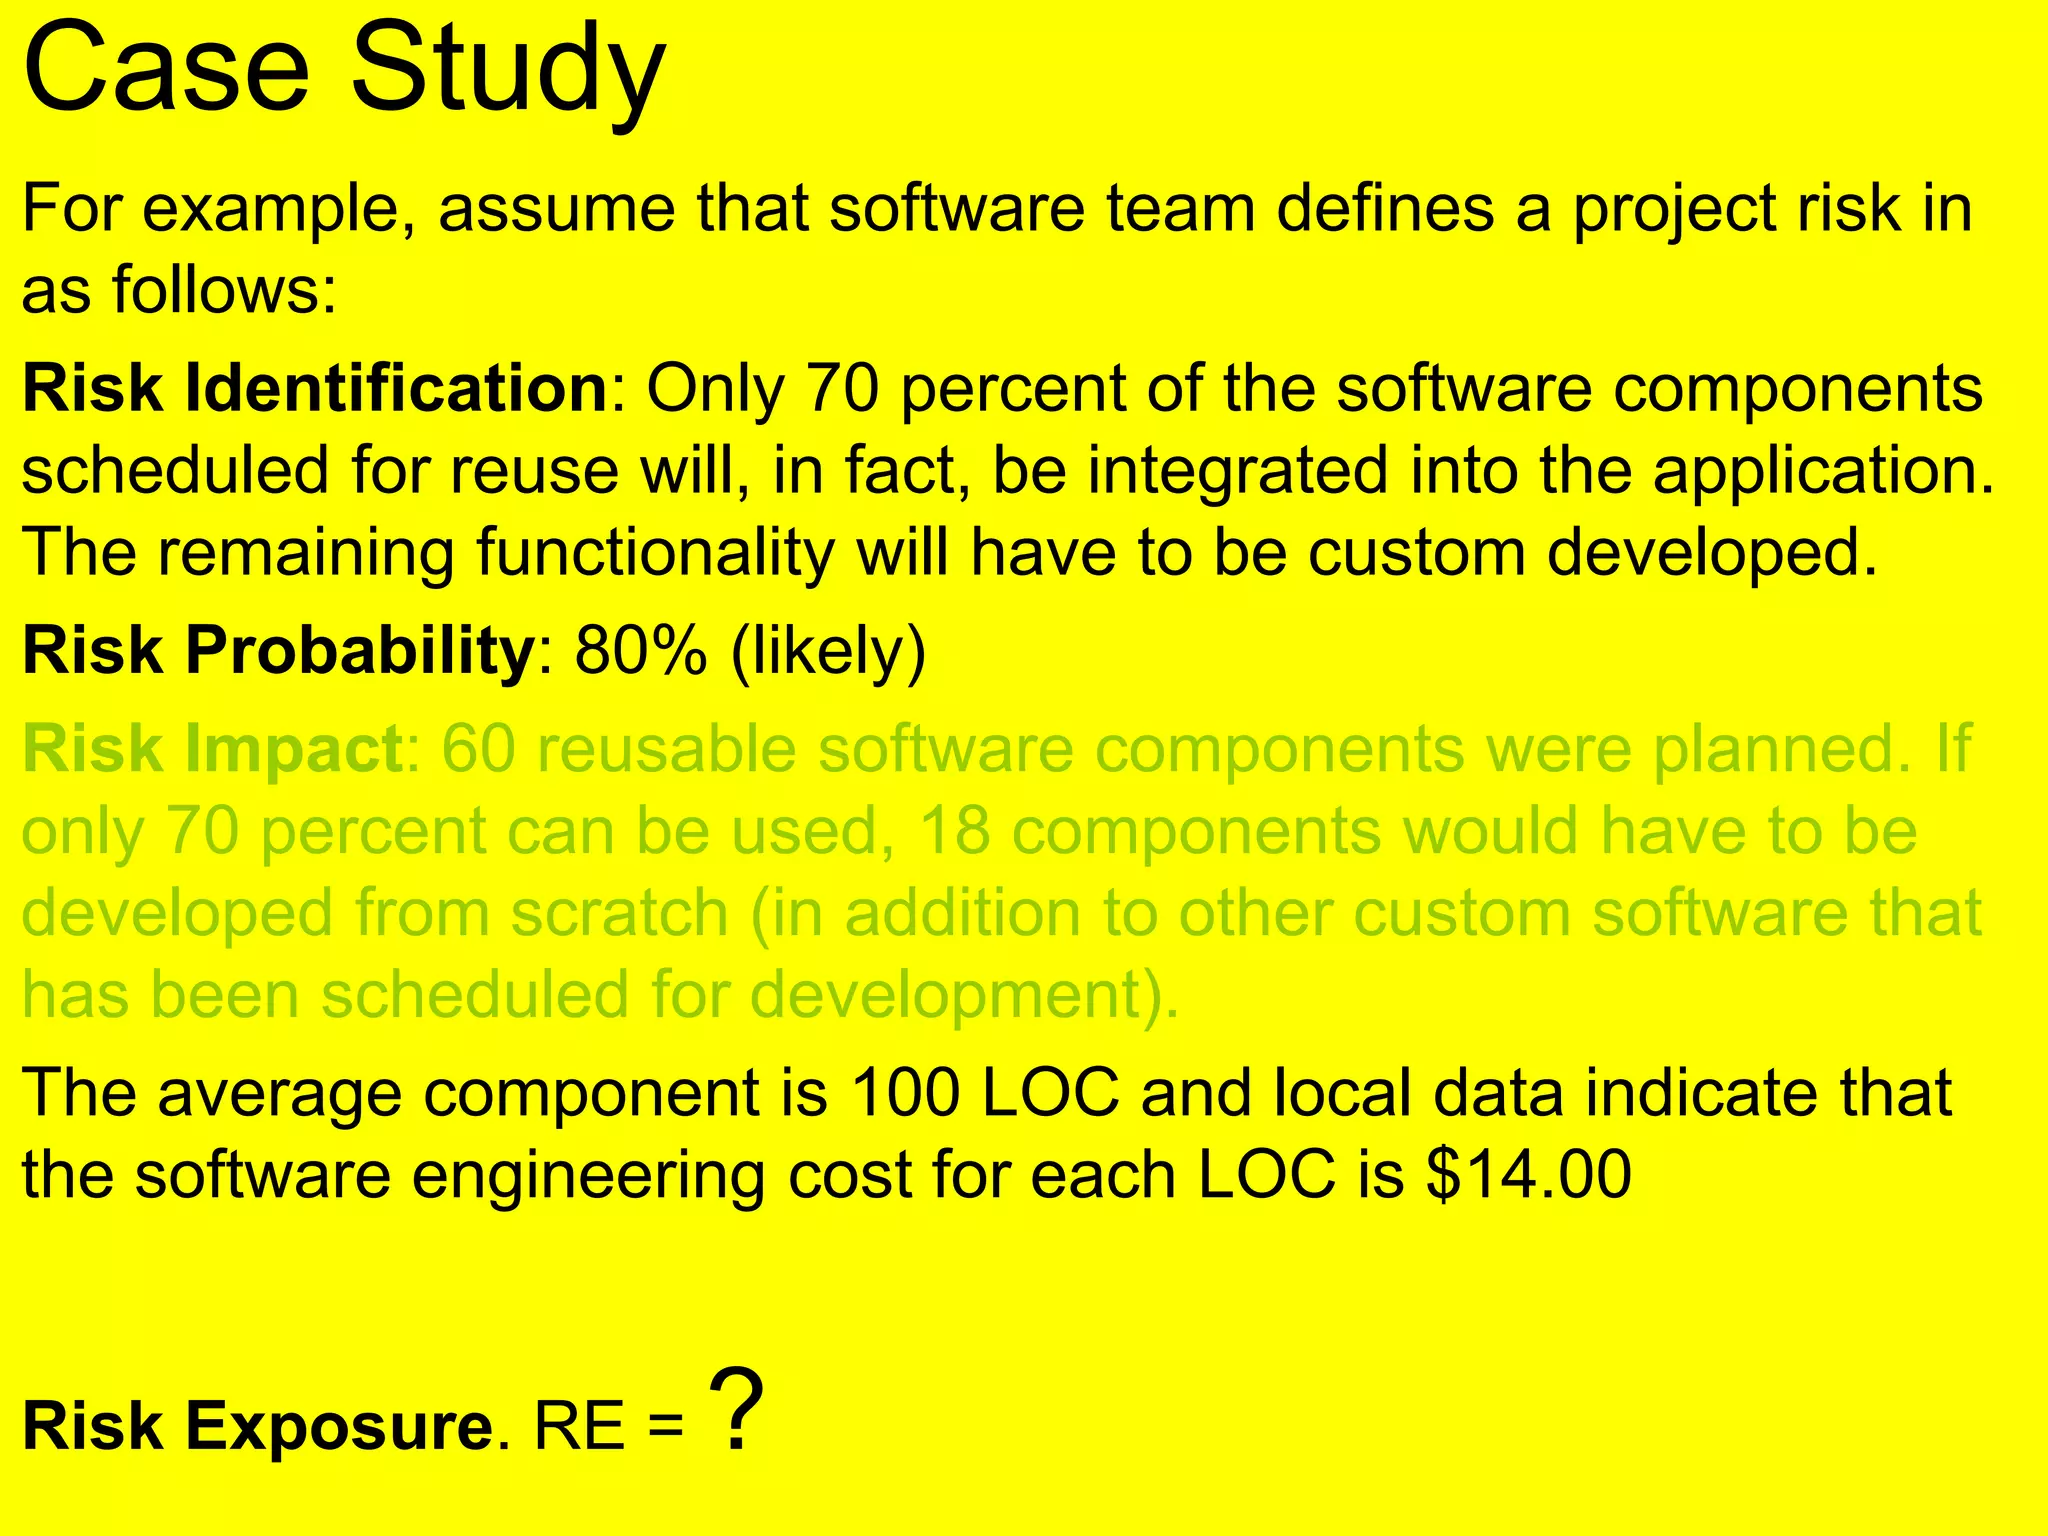
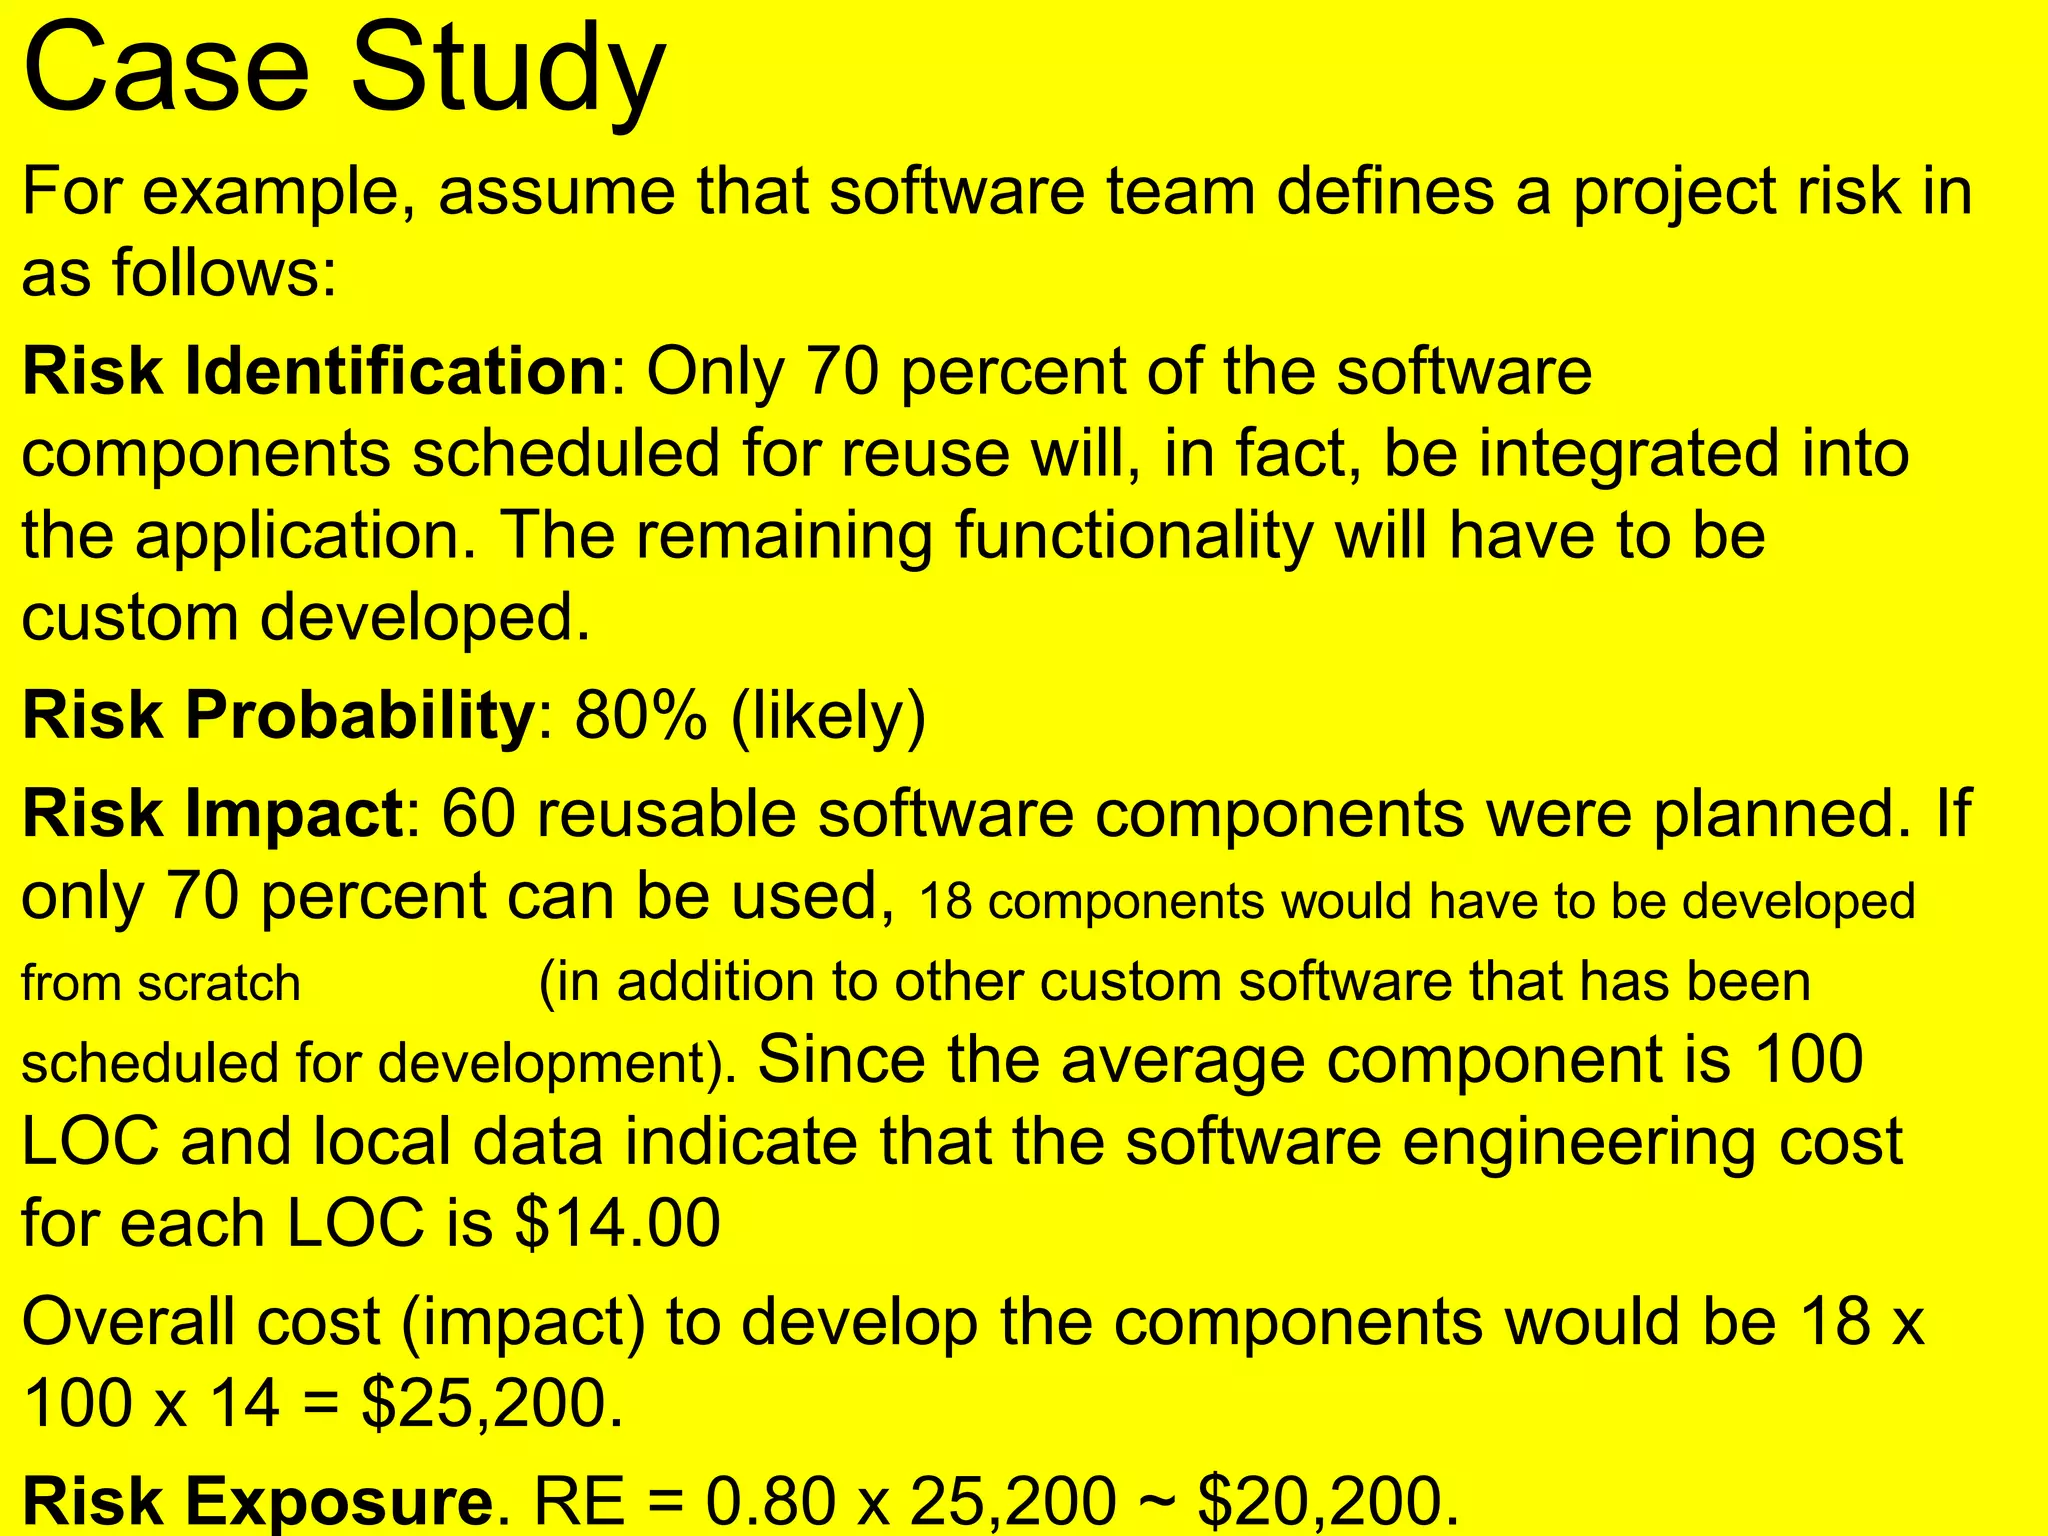
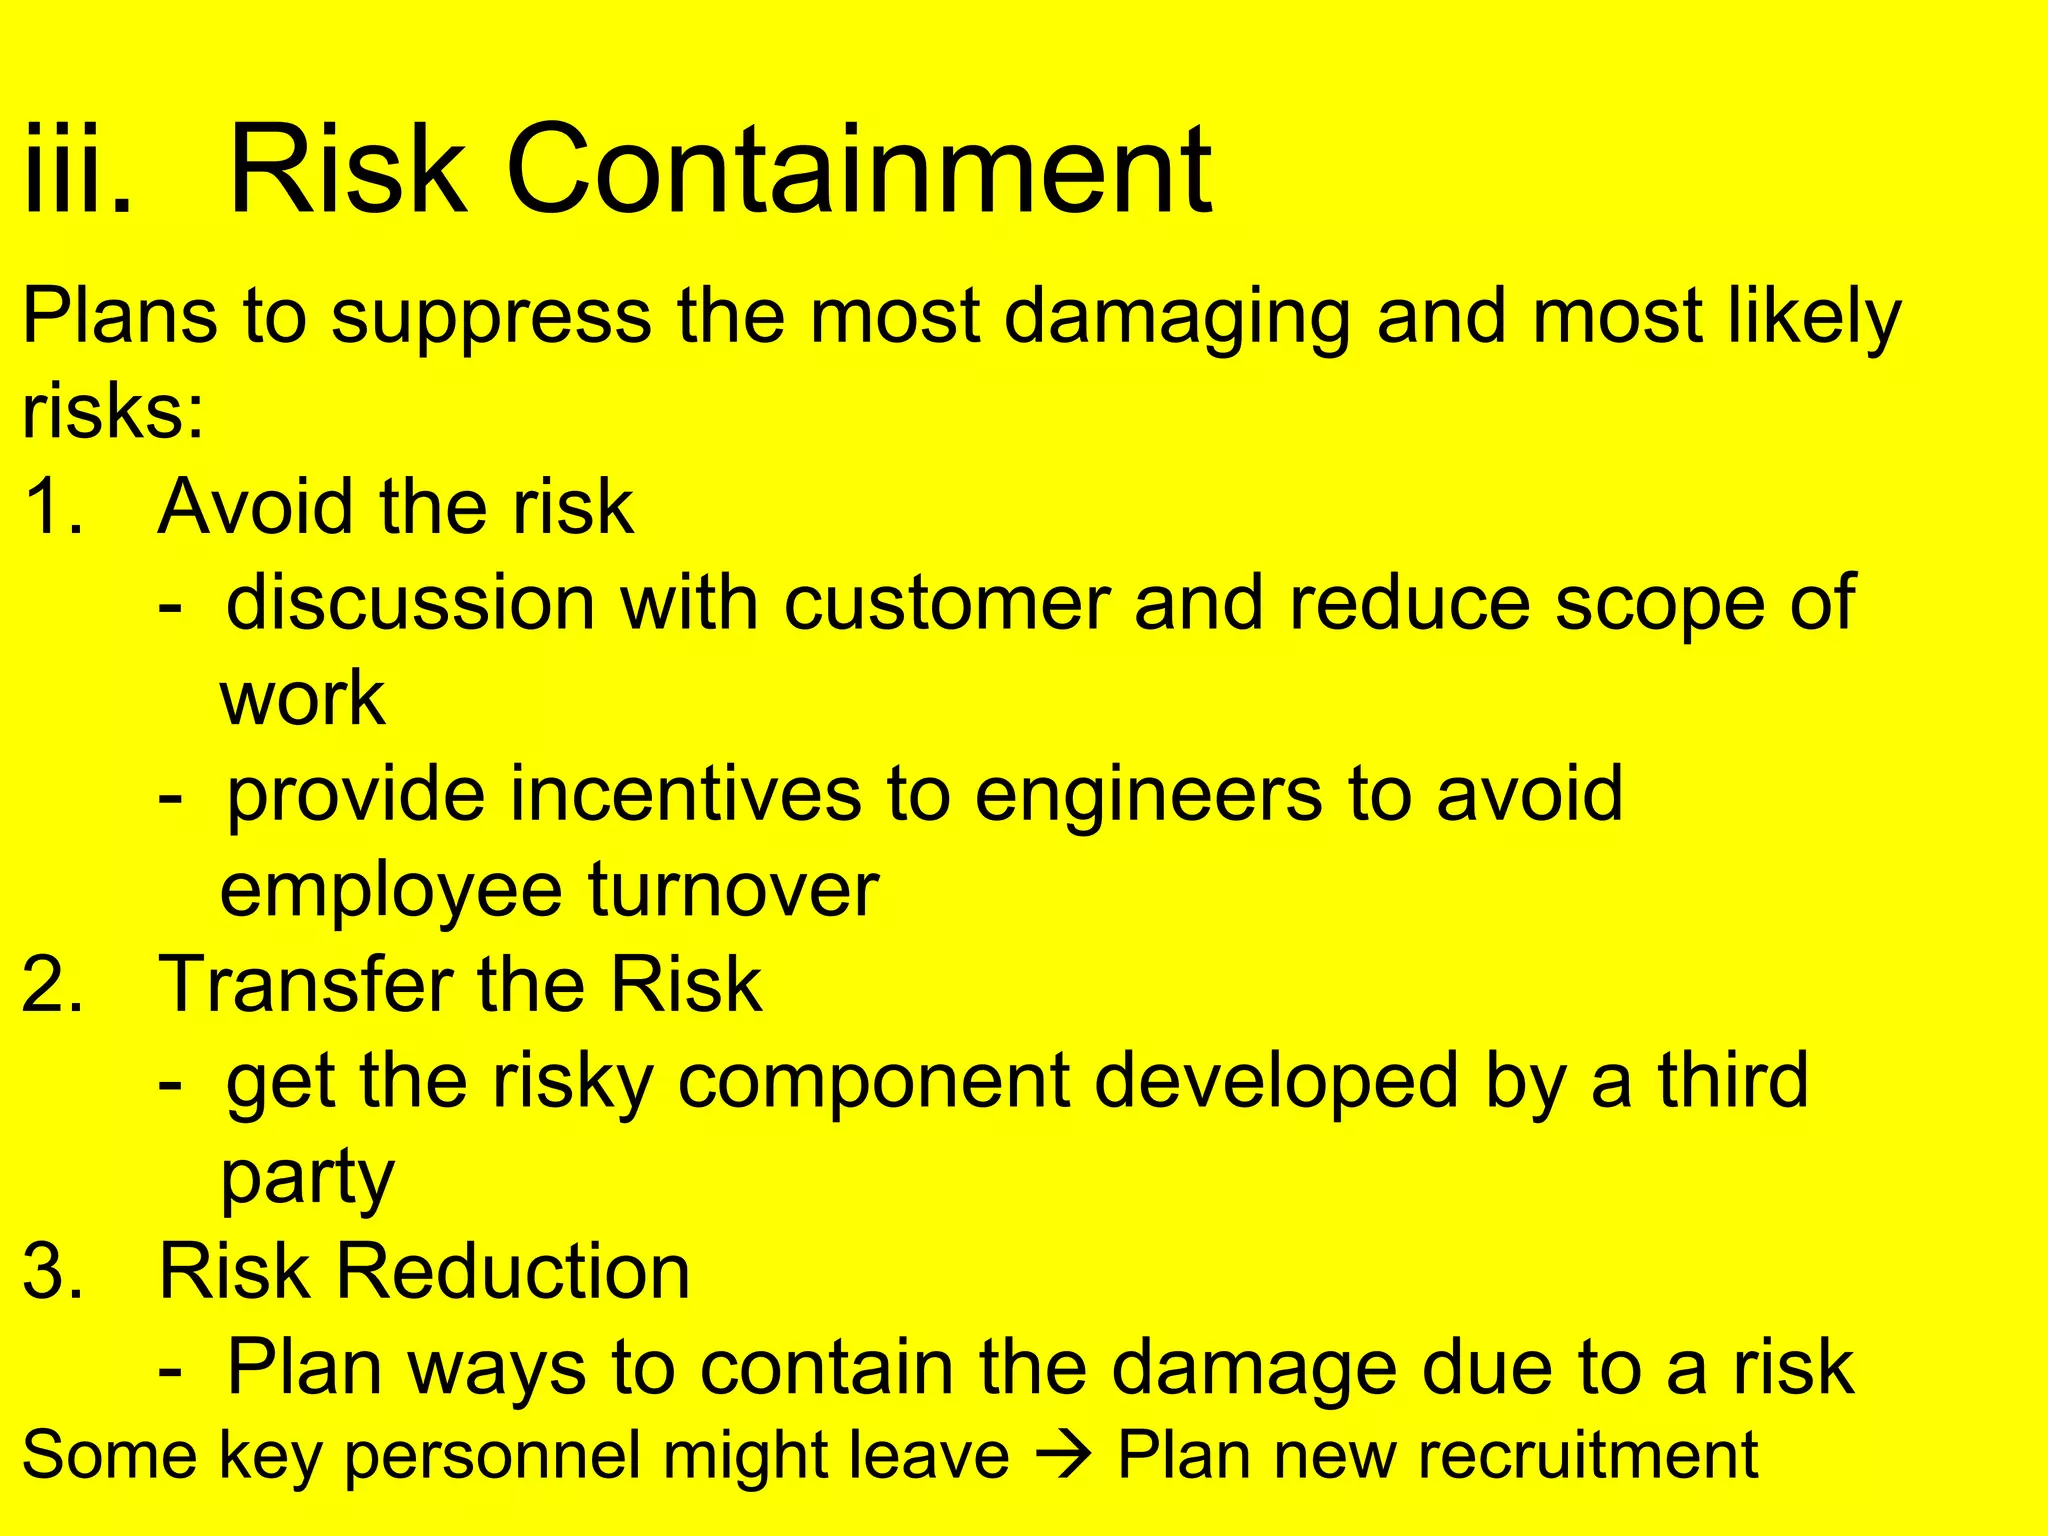
Metrics for Project Size
Estimation
Accurate Estimation Satisfactory Estimation
of of
Problem Size effort, time, cost
For estimating metric or unit required
Project size to express project size
Project Size
IS NOT:
- Bytes source code occupies, executables
occupy
IS:
- Measure of problem complexity in terms of
time and effort required to develop product
LINES OF CODE (LOC)
• The simplest among all metrics available to
estimate project size
• Project size estimated by counting the number of
source instructions
• Lines used for commenting, header lines ignored
• To find LOC at the beginning of a project divide
module into sub modules and so on until size of each
module can be predicted
Disadvantages of LOC
# Gives a numerical value of problem size that vary
widely with individual coding style
If( x>y ) x > y ? x++ : y++;
then x++;
else
y++;
# Good problem size Overall complexity of
Problem + Effort needed
# Effort needed for analysis, design , coding,
testing etc (not just coding)
Disadvantages of LOC
# Larger Code size  Better Quality?
# Impact of Code Reuse on LOC ?
#include <stdio.h>
void main(){
…………
}
# Logical Complexity?
Complex Logic More Effort
Simple Logic Less Effort
while(i<4){ printf(“testing”);
printf(“testing”); printf(“testing”);
} printf(“testing”);
printf(“testing”);
stdio.h
# Accurate computation of LOC only after
project completion!!
Disadvantages of LOC
Function Point Metric
Size of software product computed directly from problem
specification
Size of software = number of different functions/ features it
supports
Input Output
Many features Larger size
Apart from that size depends on
- number of files
- number of interfaces
- number of enquiries
Function
Size of Function Point (FP)= Weighted sum of
these five problem characteristics
1. Number of inputs: Data items input by user
(Group of user inputs taken together)
Employee Account
- Name - Account Name
- Age - Account Number
- Sex - Account Open Date
- Address
Function Point Metric
2. Number of Outputs: Reports, Screen outputs,
Error Messages
3. Number of inquiries: Interactive queries made
by users. user system
4. Number of Files: Logical files e.g. data
structures, physical files
5. Number of interfaces: Interfaces for
exchanging information e.g. disk, tapes,
communication links
Function Point Metric
Software Risks
Anticipated( predict) unfavorable event
When risk turns to reality it hampers successful and
timely completion of project
Anticipate/Identify risks
Contingency Plans
Risky Component
Employee Turnover
Give incentive to employees
Outsource/ Third party
Software Risks
Basic Characteristics of Risks:
i. Uncertainty: Risk may or may not happen
ii. Loss: If risk becomes a reality losses will occur
Risk Management
Risk Identification
Risk Assessment
Risk Containment
i. Risk Identification
- Early identification is important
- Equivalent to listing your nightmares
- To systematically identify important risks
categorize them into classes
Project Risks Business Risk Technical Risks
Types of Risks
a. Project Risk
- Budgetary, Schedule, Personnel,
Resource, Customer related
Schedule Slipping
Cause
- Intangible nature of software
Possible Solution
- Increase visibility thru documentation
b.Technical Risk
- Ambiguous, incomplete, changing
specification
- Potential Flaws in Design
- Implementation
- Interfacing
- Testing, maintenance
- Technical uncertainty/obsolesce
c.Business Risks
- Excellent product but no one wants!!
- Losing budgetary commitment
- Losing personnel commitment
For forseeing and identifying risks
Company Disaster List
All bad events that have happened
contains
prepare
ii. Risk Assessment
Rank risk in terms of their damage causing
potential
The overall risk exposure, RE
Risk Exposure (RE) = r x c
Here, r is probability of occurrence for a risk, and c
is cost to project should risk occur.
ii. Risk Assessment
• Risk exposure can be computed for each risk in
risk table, once an estimate of cost of risk
is made.
• The total risk exposure for all risks (above
the cutoff in the risk table) can provide a
means for adjusting the final cost estimate for a
project.
Case Study
For example, assume that software team defines a project risk in
as follows:
Risk Identification: Only 70 percent of the software components
scheduled for reuse will, in fact, be integrated into the application.
The remaining functionality will have to be custom developed.
Risk Probability: 80% (likely)
The average component is 100 LOC and local data indicate that
the software engineering cost for each LOC is $14.00
Risk Exposure. RE = ?
Case Study
For example, assume that software team defines a project risk in
as follows:
Risk Identification: Only 70 percent of the software components
scheduled for reuse will, in fact, be integrated into the application.
The remaining functionality will have to be custom developed.
Risk Probability: 80% (likely)
Risk Impact: 60 reusable software components were planned. If
only 70 percent can be used, 18 components would have to be
developed from scratch (in addition to other custom software that
has been scheduled for development).
The average component is 100 LOC and local data indicate that
the software engineering cost for each LOC is $14.00
Risk Exposure. RE = ?
Case Study
For example, assume that software team defines a project risk in
as follows:
Risk Identification: Only 70 percent of the software
components scheduled for reuse will, in fact, be integrated into
the application. The remaining functionality will have to be
custom developed.
Risk Probability: 80% (likely)
Risk Impact: 60 reusable software components were planned. If
only 70 percent can be used, 18 components would have to be developed
from scratch (in addition to other custom software that has been
scheduled for development). Since the average component is 100
LOC and local data indicate that the software engineering cost
for each LOC is $14.00
Overall cost (impact) to develop the components would be 18 x
100 x 14 = $25,200.
Risk Exposure. RE = 0.80 x 25,200 ~ $20,200.
iii. Risk Containment
Plans to suppress the most damaging and most likely
risks:
1. Avoid the risk
- discussion with customer and reduce scope of
work
- provide incentives to engineers to avoid
employee turnover
2. Transfer the Risk
- get the risky component developed by a third
party
3. Risk Reduction
- Plan ways to contain the damage due to a risk
Some key personnel might leave  Plan new recruitment

estimation(Risk).ppt

  • 1.
    Metrics for ProjectSize Estimation Accurate Estimation Satisfactory Estimation of of Problem Size effort, time, cost For estimating metric or unit required Project size to express project size
  • 2.
    Project Size IS NOT: -Bytes source code occupies, executables occupy IS: - Measure of problem complexity in terms of time and effort required to develop product
  • 3.
    LINES OF CODE(LOC) • The simplest among all metrics available to estimate project size • Project size estimated by counting the number of source instructions • Lines used for commenting, header lines ignored • To find LOC at the beginning of a project divide module into sub modules and so on until size of each module can be predicted
  • 4.
    Disadvantages of LOC #Gives a numerical value of problem size that vary widely with individual coding style If( x>y ) x > y ? x++ : y++; then x++; else y++; # Good problem size Overall complexity of Problem + Effort needed # Effort needed for analysis, design , coding, testing etc (not just coding)
  • 5.
    Disadvantages of LOC #Larger Code size  Better Quality? # Impact of Code Reuse on LOC ? #include <stdio.h> void main(){ ………… } # Logical Complexity? Complex Logic More Effort Simple Logic Less Effort while(i<4){ printf(“testing”); printf(“testing”); printf(“testing”); } printf(“testing”); printf(“testing”); stdio.h
  • 6.
    # Accurate computationof LOC only after project completion!! Disadvantages of LOC
  • 7.
    Function Point Metric Sizeof software product computed directly from problem specification Size of software = number of different functions/ features it supports Input Output Many features Larger size Apart from that size depends on - number of files - number of interfaces - number of enquiries Function
  • 8.
    Size of FunctionPoint (FP)= Weighted sum of these five problem characteristics 1. Number of inputs: Data items input by user (Group of user inputs taken together) Employee Account - Name - Account Name - Age - Account Number - Sex - Account Open Date - Address Function Point Metric
  • 9.
    2. Number ofOutputs: Reports, Screen outputs, Error Messages 3. Number of inquiries: Interactive queries made by users. user system 4. Number of Files: Logical files e.g. data structures, physical files 5. Number of interfaces: Interfaces for exchanging information e.g. disk, tapes, communication links Function Point Metric
  • 10.
    Software Risks Anticipated( predict)unfavorable event When risk turns to reality it hampers successful and timely completion of project Anticipate/Identify risks Contingency Plans Risky Component Employee Turnover Give incentive to employees Outsource/ Third party
  • 11.
    Software Risks Basic Characteristicsof Risks: i. Uncertainty: Risk may or may not happen ii. Loss: If risk becomes a reality losses will occur
  • 12.
    Risk Management Risk Identification RiskAssessment Risk Containment
  • 13.
    i. Risk Identification -Early identification is important - Equivalent to listing your nightmares - To systematically identify important risks categorize them into classes Project Risks Business Risk Technical Risks Types of Risks
  • 14.
    a. Project Risk -Budgetary, Schedule, Personnel, Resource, Customer related Schedule Slipping Cause - Intangible nature of software Possible Solution - Increase visibility thru documentation
  • 15.
    b.Technical Risk - Ambiguous,incomplete, changing specification - Potential Flaws in Design - Implementation - Interfacing - Testing, maintenance - Technical uncertainty/obsolesce
  • 16.
    c.Business Risks - Excellentproduct but no one wants!! - Losing budgetary commitment - Losing personnel commitment
  • 17.
    For forseeing andidentifying risks Company Disaster List All bad events that have happened contains prepare
  • 19.
    ii. Risk Assessment Rankrisk in terms of their damage causing potential The overall risk exposure, RE Risk Exposure (RE) = r x c Here, r is probability of occurrence for a risk, and c is cost to project should risk occur.
  • 20.
    ii. Risk Assessment •Risk exposure can be computed for each risk in risk table, once an estimate of cost of risk is made. • The total risk exposure for all risks (above the cutoff in the risk table) can provide a means for adjusting the final cost estimate for a project.
  • 21.
    Case Study For example,assume that software team defines a project risk in as follows: Risk Identification: Only 70 percent of the software components scheduled for reuse will, in fact, be integrated into the application. The remaining functionality will have to be custom developed. Risk Probability: 80% (likely) The average component is 100 LOC and local data indicate that the software engineering cost for each LOC is $14.00 Risk Exposure. RE = ?
  • 22.
    Case Study For example,assume that software team defines a project risk in as follows: Risk Identification: Only 70 percent of the software components scheduled for reuse will, in fact, be integrated into the application. The remaining functionality will have to be custom developed. Risk Probability: 80% (likely) Risk Impact: 60 reusable software components were planned. If only 70 percent can be used, 18 components would have to be developed from scratch (in addition to other custom software that has been scheduled for development). The average component is 100 LOC and local data indicate that the software engineering cost for each LOC is $14.00 Risk Exposure. RE = ?
  • 23.
    Case Study For example,assume that software team defines a project risk in as follows: Risk Identification: Only 70 percent of the software components scheduled for reuse will, in fact, be integrated into the application. The remaining functionality will have to be custom developed. Risk Probability: 80% (likely) Risk Impact: 60 reusable software components were planned. If only 70 percent can be used, 18 components would have to be developed from scratch (in addition to other custom software that has been scheduled for development). Since the average component is 100 LOC and local data indicate that the software engineering cost for each LOC is $14.00 Overall cost (impact) to develop the components would be 18 x 100 x 14 = $25,200. Risk Exposure. RE = 0.80 x 25,200 ~ $20,200.
  • 24.
    iii. Risk Containment Plansto suppress the most damaging and most likely risks: 1. Avoid the risk - discussion with customer and reduce scope of work - provide incentives to engineers to avoid employee turnover 2. Transfer the Risk - get the risky component developed by a third party 3. Risk Reduction - Plan ways to contain the damage due to a risk Some key personnel might leave  Plan new recruitment

Editor's Notes

  • #16 Obsolesce-No longer wanted even it is working gud