Download to read offline


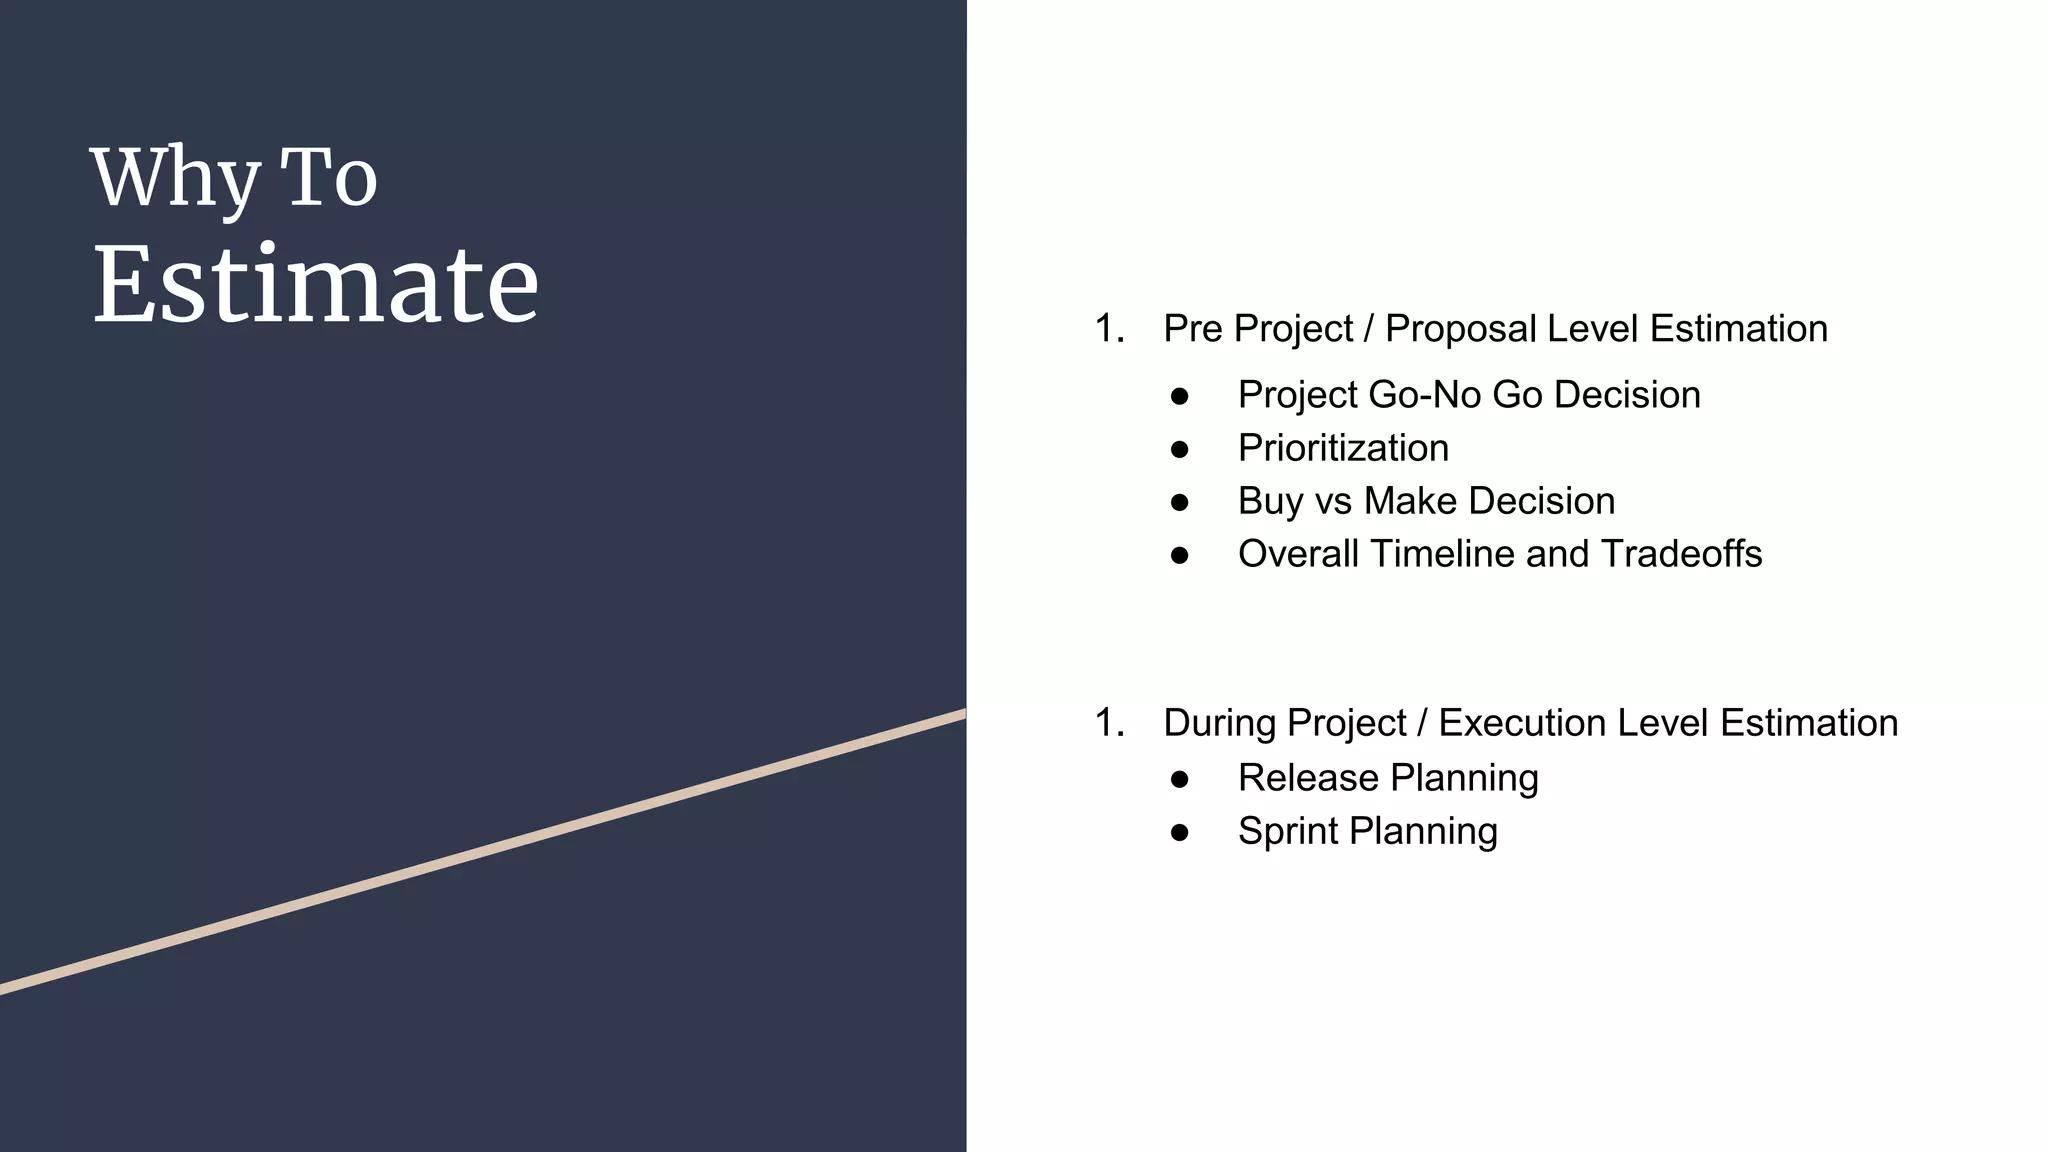
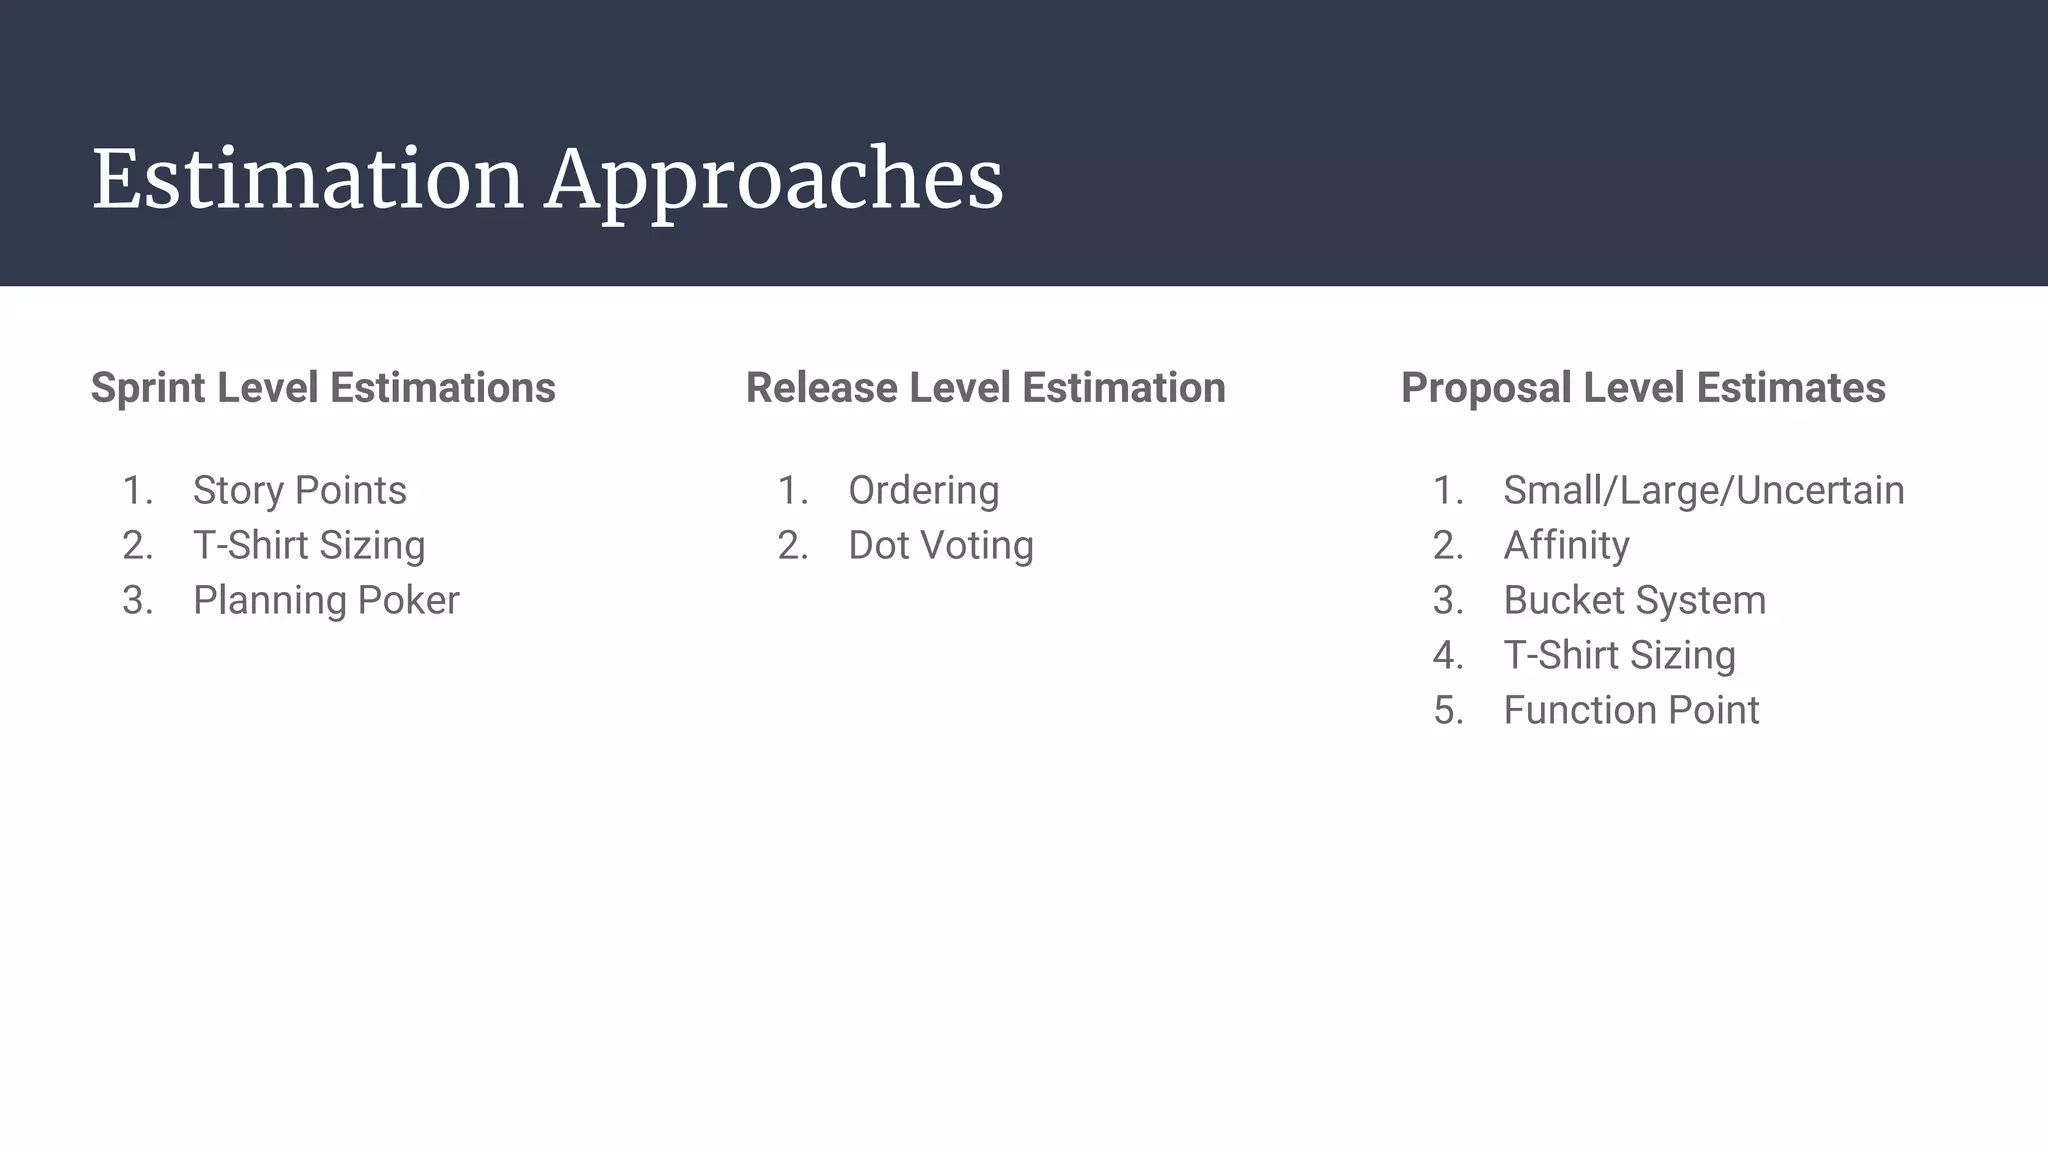


The document discusses estimation techniques for Agile project sizing and planning, highlighting the importance of estimates based on current knowledge, size, complexity, dependencies, and risks. It outlines various approaches like story points, t-shirt sizing, and planning poker for estimating tasks, along with strategies for release planning and prioritization. Additionally, it emphasizes the need for team consensus and collaboration during the estimation process while detailing methods for effectively conveying information and making informed planning decisions.


![[HCM Scrum Breakfast] Agile estimation - Story points](https://cdn.slidesharecdn.com/ss_thumbnails/storypointsestimations-160827052054-thumbnail.jpg?width=640&height=640&fit=bounds)


