SESSION 2.1
ESTIMATION OFPROJECT COSTS AND
BENEFITS
Introductory Course on Economic Analysis of
Investment Projects
Economics and Research Department (ERD)
2.
Project Statements
Comparisonof costs and benefits
Typically investment costs (equipment, land, buildings
etc) in early years with benefits arising after one or
two years
Start year when funds are committed to project
(eg year 1, sometimes year 0 if starts immediately)
Working capital for running project eg stocks
2
3.
Project Life
Needsto be identified
Can be based on technical life of main equipment or
estimated economic working life
Economic working life ends in year where running cost >
additional revenue
Where economic life < technical life need to add Terminal
Value for resale of assets in final year
3
4.
Constant Prices
Inflationusually ignored on assumption that all items rise
at same rate
Constant base year prices
Not strictly correct as fixed costs or revenues will be
reduced in real terms
Eg tax allowances or fixed interest debt
Also relative price changes eg oil price
4
5.
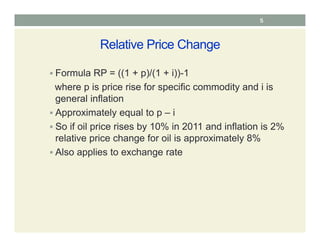
Relative Price Change
Formula RP = ((1 + p)/(1 + i))-1
where p is price rise for specific commodity and i is
general inflation
Approximately equal to p – i
So if oil price rises by 10% in 2011 and inflation is 2%
relative price change for oil is approximately 8%
Also applies to exchange rate
5
6.
6
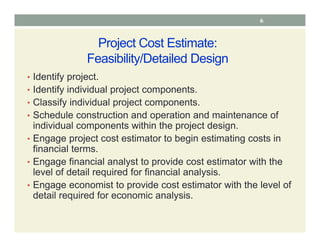
Project Cost Estimate:
Feasibility/DetailedDesign
• Identify project.
• Identify individual project components.
• Classify individual project components.
• Schedule construction and operation and maintenance of
individual components within the project design.
• Engage project cost estimator to begin estimating costs in
financial terms.
• Engage financial analyst to provide cost estimator with the
level of detail required for financial analysis.
• Engage economist to provide cost estimator with the level of
detail required for economic analysis.
8
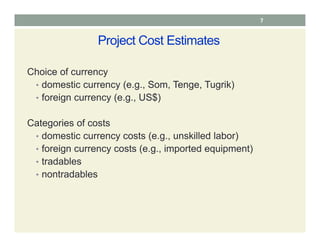
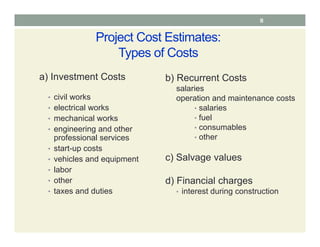
Project Cost Estimates:
Typesof Costs
a) Investment Costs
• civil works
• electrical works
• mechanical works
• engineering and other
professional services
• start-up costs
• vehicles and equipment
• labor
• other
• taxes and duties
b) Recurrent Costs
salaries
operation and maintenance costs
• salaries
• fuel
• consumables
• other
c) Salvage values
d) Financial charges
• interest during construction
9.
9
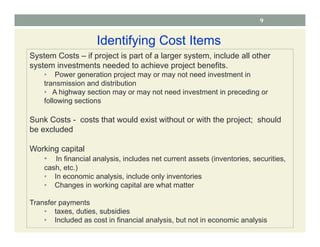
Identifying Cost Items
SystemCosts – if project is part of a larger system, include all other
system investments needed to achieve project benefits.
• Power generation project may or may not need investment in
transmission and distribution
• A highway section may or may not need investment in preceding or
following sections
Sunk Costs - costs that would exist without or with the project; should
be excluded
Working capital
• In financial analysis, includes net current assets (inventories, securities,
cash, etc.)
• In economic analysis, include only inventories
• Changes in working capital are what matter
Transfer payments
• taxes, duties, subsidies
• Included as cost in financial analysis, but not in economic analysis
10.
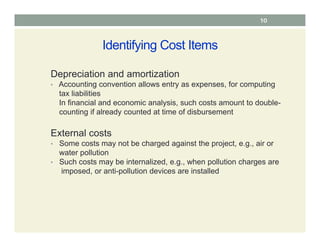
Identifying Cost Items
Depreciationand amortization
• Accounting convention allows entry as expenses, for computing
tax liabilities
In financial and economic analysis, such costs amount to double-
counting if already counted at time of disbursement
External costs
• Some costs may not be charged against the project, e.g., air or
water pollution
• Such costs may be internalized, e.g., when pollution charges are
imposed, or anti-pollution devices are installed
10
11.
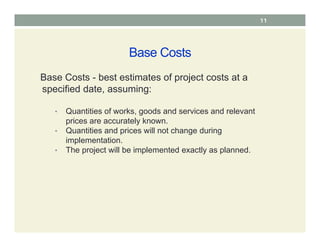
Base Costs
Base Costs- best estimates of project costs at a
specified date, assuming:
• Quantities of works, goods and services and relevant
prices are accurately known.
• Quantities and prices will not change during
implementation.
• The project will be implemented exactly as planned.
11
12.
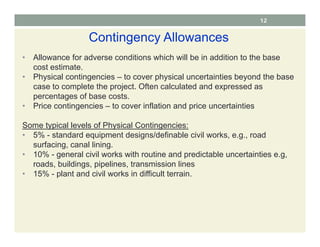
Contingency Allowances
• Allowancefor adverse conditions which will be in addition to the base
cost estimate.
• Physical contingencies – to cover physical uncertainties beyond the base
case to complete the project. Often calculated and expressed as
percentages of base costs.
• Price contingencies – to cover inflation and price uncertainties
Some typical levels of Physical Contingencies:
• 5% - standard equipment designs/definable civil works, e.g., road
surfacing, canal lining.
• 10% - general civil works with routine and predictable uncertainties e.g,
roads, buildings, pipelines, transmission lines
• 15% - plant and civil works in difficult terrain.
12
13.
13
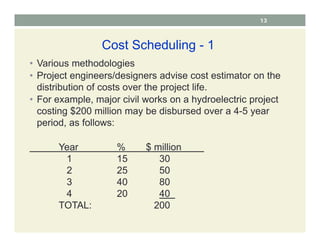
Cost Scheduling -1
• Various methodologies
• Project engineers/designers advise cost estimator on the
distribution of costs over the project life.
• For example, major civil works on a hydroelectric project
costing $200 million may be disbursed over a 4-5 year
period, as follows:
Year % $ million
1 15 30
2 25 50
3 40 80
4 20 40
TOTAL: 200
14.
14
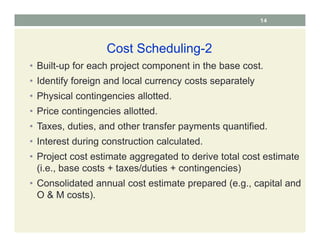
Cost Scheduling-2
• Built-upfor each project component in the base cost.
• Identify foreign and local currency costs separately
• Physical contingencies allotted.
• Price contingencies allotted.
• Taxes, duties, and other transfer payments quantified.
• Interest during construction calculated.
• Project cost estimate aggregated to derive total cost estimate
(i.e., base costs + taxes/duties + contingencies)
• Consolidated annual cost estimate prepared (e.g., capital and
O & M costs).
15.
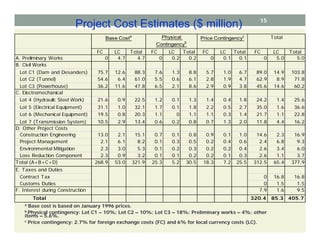
Project Cost Estimates($ million)
FC LC Total FC LC Total FC LC Total FC LC Total
A. Preliminary Works 0 4.7 4.7 0 0.2 0.2 0 0.1 0.1 0 5.0 5.0
B. Civil Works
Lot C1 (Dam and Desanders) 75.7 12.6 88.3 7.6 1.3 8.8 5.7 1.0 6.7 89.0 14.9 103.8
Lot C2 (Tunnel) 54.6 6.4 61.0 5.5 0.6 6.1 2.8 1.9 4.7 62.9 8.9 71.8
Lot C3 (Powerhouse) 36.2 11.6 47.8 6.5 2.1 8.6 2.9 0.9 3.8 45.6 14.6 60.2
C. Electromechanical
Lot 4 (Hydraulic Steel Work) 21.6 0.9 22.5 1.2 0.1 1.3 1.4 0.4 1.8 24.2 1.4 25.6
Lot 5 (Electrical Equipment) 31.1 1.0 32.1 1.7 0.1 1.8 2.2 0.5 2.7 35.0 1.6 36.6
Lot 6 (Mechanical Equipment) 19.5 0.8 20.3 1.1 0 1.1 1.1 0.3 1.4 21.7 1.1 22.8
Lot 7 (Transmission System) 10.5 2.9 13.4 0.6 0.2 0.8 0.7 1.3 2.0 11.8 4.4 16.2
D. Other Project Costs
Construction Engineering 13.0 2.1 15.1 0.7 0.1 0.8 0.9 0.1 1.0 14.6 2.3 16.9
Project Management 2.1 6.1 8.2 0.1 0.3 0.5 0.2 0.4 0.6 2.4 6.8 9.3
Environmental Mitigation 2.3 3.0 5.3 0.1 0.2 0.3 0.2 0.2 0.4 2.6 3.4 6.0
Loss Reduction Component 2.3 0.9 3.2 0.1 0.1 0.2 0.2 0.1 0.3 2.6 1.1 3.7
Total (A+B+C+D) 268.9 53.0 321.9 25.3 5.2 30.5 18.3 7.2 25.5 312.5 65.4 377.9
E. Taxes and Duties
Contract Tax 0 16.8 16.8
Customs Duties 0 1.5 1.5
F. Interest during Construction 7.9 1.6 9.5
Total 320.4 85.3 405.7
Base Costa Physical
Contingencyb
Price Contingencyc Total
a Base cost is based on January 1996 prices.
b Physical contingency: Lot C1 – 10%; Lot C2 – 10%; Lot C3 – 18%; Preliminary works – 4%; other
items – 5.6%.
c Price contingency: 2.7% for foreign exchange costs (FC) and 6% for local currency costs (LC).
15
16.
16
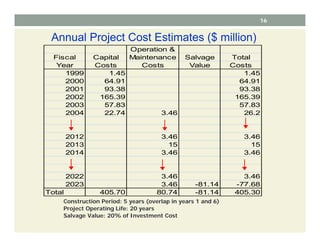
Annual Project CostEstimates ($ million)
Operation &
Fiscal Capital Maintenance Salvage Total
Year Costs Costs Value Costs
1999 1.45 1.45
2000 64.91 64.91
2001 93.38 93.38
2002 165.39 165.39
2003 57.83 57.83
2004 22.74 3.46 26.2
2012 3.46 3.46
2013 15 15
2014 3.46 3.46
2022 3.46 3.46
2023 3.46 -81.14 -77.68
Total 405.70 80.74 -81.14 405.30
Construction Period: 5 years (overlap in years 1 and 6)
Project Operating Life: 20 years
Salvage Value: 20% of Investment Cost
17.
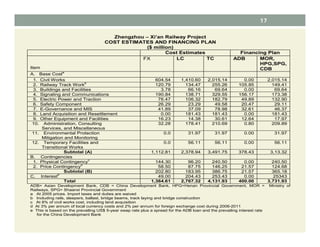
Zhengzhou – Xi’anRailway Project
COST ESTIMATES AND FINANCING PLAN
($ million)
Cost Estimates Financing Plan
Item
FX LC TC ADB MOR,
HPG,SPG,
CDB
A. Base Cost
a
1. Civil Works 604.54 1,410.60 2,015.14 0.00 2,015.14
2. Railway Track Work
b
120.79 134.47 255.26 105.85 149.41
3. Buildings and Facilities 3.78 66.16 69.64 0.00 69.64
4. Signaling and Communications 190.84 138.71 329.55 156.17 173.38
5. Electric Power and Traction 76.47 106.32 182.79 49.89 132.90
6. Safety Component 26.29 23.29 49.58 20.47 29.11
7. E-Governance and MIS 41.89 37.09 78.98 32.61 46.37
8. Land Acquisition and Resettlement 0.00 181.43 181.43 0.00 181.43
9. Other Equipment and Facilities 16.23 14.38 30.61 12.64 17.97
10. Administration, Consulting
Services, and Miscellaneous
32.28 178.41 210.69 0.80 209.89
11. Environmental Protection
Mitigation and Monitoring
0.0 31.97 31.97 0.00 31.97
12. Temporary Facilities and
Transitional Works
0.0 56.11 56.11 0.00 56.11
Subtotal (A) 1,112.81 2,378.94 3,491.75 378.43 3,13.32
B. Contingencies
1. Physical Contingency
c
144.30 96.20 240.50 0.00 240.50
2. Price Contingency
d
58.50 87.75 146.25 21.57 124.68
Subtotal (B) 202.80 183.95 386.75 21.57 365.18
C. Interest
e
49.00 204.43 253.43 0.00 25343
Total 1,364.61 2,767.32 4,131.93 400.00 3,731.93
ADB= Asian Development Bank, CDB = China Development Bank, HPG=Henan Provincial Government, MOR = Ministry of
Railways, SPG= Shaanxi Provincial Government
a At 2005 prices. Import taxes and duties are waived
b Including rails, sleepers, ballast, bridge beams, track laying and bridge construction
c At 8% of civil works cost, including land acquisition
d At 3% per annum of local currency costs and 2% per annum for foreign exchange cost during 2006-2011
e This is based on the prevailing US$ 5-year swap rate plus a spread for the ADB loan and the prevailing interest rate
for the China Development Bank
17
18.
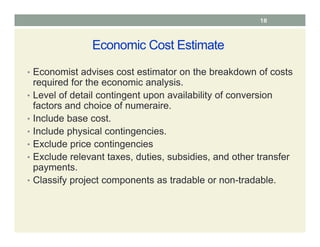
Economic Cost Estimate
•Economist advises cost estimator on the breakdown of costs
required for the economic analysis.
• Level of detail contingent upon availability of conversion
factors and choice of numeraire.
• Include base cost.
• Include physical contingencies.
• Exclude price contingencies
• Exclude relevant taxes, duties, subsidies, and other transfer
payments.
• Classify project components as tradable or non-tradable.
18
19.
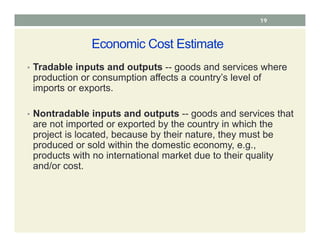
Economic Cost Estimate
•Tradable inputs and outputs -- goods and services where
production or consumption affects a country’s level of
imports or exports.
• Nontradable inputs and outputs -- goods and services that
are not imported or exported by the country in which the
project is located, because by their nature, they must be
produced or sold within the domestic economy, e.g.,
products with no international market due to their quality
and/or cost.
19
20.
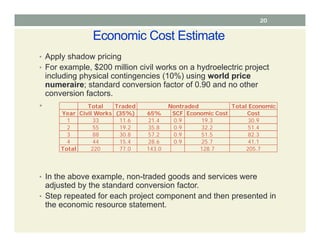
Economic Cost Estimate
•Apply shadow pricing
• For example, $200 million civil works on a hydroelectric project
including physical contingencies (10%) using world price
numeraire; standard conversion factor of 0.90 and no other
conversion factors.
•
• In the above example, non-traded goods and services were
adjusted by the standard conversion factor.
• Step repeated for each project component and then presented in
the economic resource statement.
Total Traded Total Economic
Year Civil Works (35%) 65% SCF Economic Cost Cost
1 33 11.6 21.4 0.9 19.3 30.9
2 55 19.2 35.8 0.9 32.2 51.4
3 88 30.8 57.2 0.9 51.5 82.3
4 44 15.4 28.6 0.9 25.7 41.1
Total 220 77.0 143.0 128.7 205.7
Nontraded
20
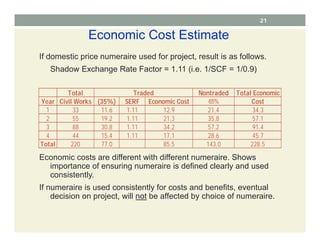
21.
Economic Cost Estimate
Ifdomestic price numeraire used for project, result is as follows.
Shadow Exchange Rate Factor = 1.11 (i.e. 1/SCF = 1/0.9)
Economic costs are different with different numeraire. Shows
importance of ensuring numeraire is defined clearly and used
consistently.
If numeraire is used consistently for costs and benefits, eventual
decision on project, will not be affected by choice of numeraire.
Total Nontraded Total Economic
Year Civil Works (35%) SERF Economic Cost 65% Cost
1 33 11.6 1.11 12.9 21.4 34.3
2 55 19.2 1.11 21.3 35.8 57.1
3 88 30.8 1.11 34.2 57.2 91.4
4 44 15.4 1.11 17.1 28.6 45.7
Total 220 77.0 85.5 143.0 228.5
Traded
21
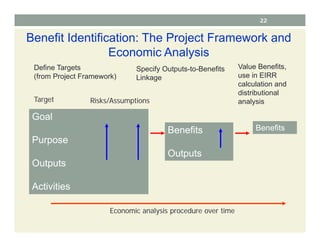
22.
22
Benefit Identification: TheProject Framework and
Economic Analysis
Goal
Purpose
Outputs
Activities
Benefits
Outputs
Benefits
Define Targets
(from Project Framework)
Specify Outputs-to-Benefits
Linkage
Value Benefits,
use in EIRR
calculation and
distributional
analysis
Target Risks/Assumptions
Economic analysis procedure over time
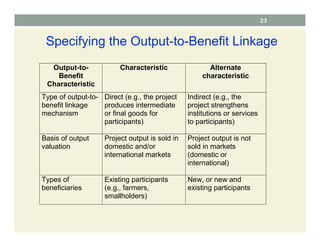
23.
23
Specifying the Output-to-BenefitLinkage
Output-to-
Benefit
Characteristic
Characteristic Alternate
characteristic
Type of output-to-
benefit linkage
mechanism
Direct (e.g., the project
produces intermediate
or final goods for
participants)
Indirect (e.g., the
project strengthens
institutions or services
to participants)
Basis of output
valuation
Project output is sold in
domestic and/or
international markets
Project output is not
sold in markets
(domestic or
international)
Types of
beneficiaries
Existing participants
(e.g., farmers,
smallholders)
New, or new and
existing participants
24.
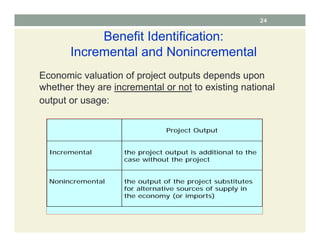
24
Benefit Identification:
Incremental andNonincremental
Economic valuation of project outputs depends upon
whether they are incremental or not to existing national
output or usage:
Project Output
Incremental the project output is additional to the
case without the project
Nonincremental the output of the project substitutes
for alternative sources of supply in
the economy (or imports)
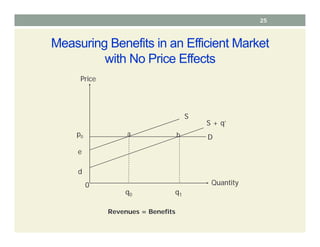
25.
Measuring Benefits inan Efficient Market
with No Price Effects
Revenues = Benefits
Price
Quantity
p0
e
d
q0 q1
S
S + q’
D
a b
0
25
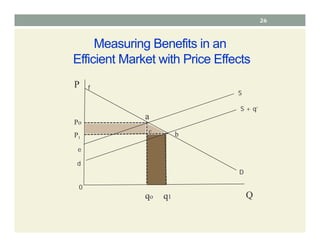
26.
Measuring Benefits inan
Efficient Market with Price Effects
e
d
S
S + q’
f
a
b
Po
P1
c
qo
D
q1
P
Q
0
26
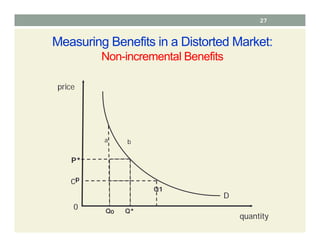
27.
Measuring Benefits ina Distorted Market:
Non-incremental Benefits
Q0 Q*
P*
cp
0
D
price
quantity
a b
Q1
27
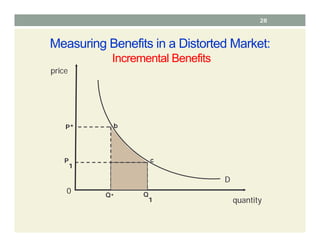
28.
Measuring Benefits ina Distorted Market:
Incremental Benefits
Q* Q
1
P
1
0
D
price
quantity
c
P* b
28
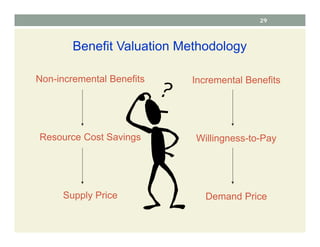
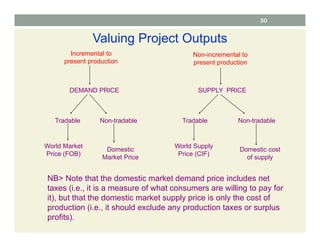
Valuing Project Outputs
Incrementalto
present production
Non-incremental to
present production
DEMAND PRICE SUPPLY PRICE
Tradable Tradable Non-tradable
Non-tradable
World Market
Price (FOB)
Domestic
Market Price
Domestic cost
of supply
World Supply
Price (CIF)
NB> Note that the domestic market demand price includes net
taxes (i.e., it is a measure of what consumers are willing to pay for
it), but that the domestic market supply price is only the cost of
production (i.e., it should exclude any production taxes or surplus
profits).
30
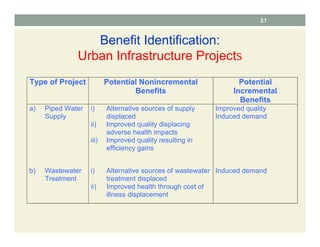
31.
Benefit Identification:
Urban InfrastructureProjects
Type of Project Potential Nonincremental
Benefits
Potential
Incremental
Benefits
a) Piped Water
Supply
i) Alternative sources of supply
displaced
ii) Improved quality displacing
adverse health impacts
iii) Improved quality resulting in
efficiency gains
Improved quality
Induced demand
b) Wastewater
Treatment
i) Alternative sources of wastewater
treatment displaced
ii) Improved health through cost of
illness displacement
Induced demand
31
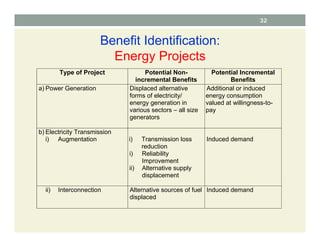
32.
Type of ProjectPotential Non-
incremental Benefits
Potential Incremental
Benefits
a) Power Generation Displaced alternative
forms of electricity/
energy generation in
various sectors – all size
generators
Additional or induced
energy consumption
valued at willingness-to-
pay
b) Electricity Transmission
i) Augmentation i) Transmission loss
reduction
i) Reliability
Improvement
ii) Alternative supply
displacement
Induced demand
ii) Interconnection Alternative sources of fuel
displaced
Induced demand
Benefit Identification:
Energy Projects
32
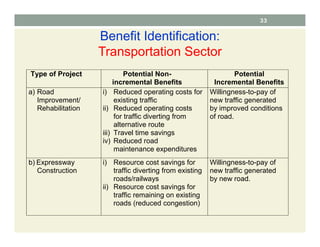
33.
Benefit Identification:
Transportation Sector
Typeof Project Potential Non-
incremental Benefits
Potential
Incremental Benefits
a) Road
Improvement/
Rehabilitation
i) Reduced operating costs for
existing traffic
ii) Reduced operating costs
for traffic diverting from
alternative route
iii) Travel time savings
iv) Reduced road
maintenance expenditures
Willingness-to-pay of
new traffic generated
by improved conditions
of road.
b) Expressway
Construction
i) Resource cost savings for
traffic diverting from existing
roads/railways
ii) Resource cost savings for
traffic remaining on existing
roads (reduced congestion)
Willingness-to-pay of
new traffic generated
by new road.
33
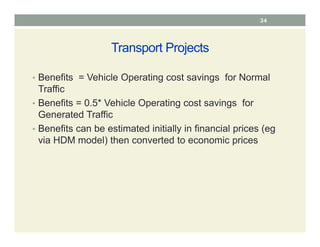
34.
Transport Projects
• Benefits= Vehicle Operating cost savings for Normal
Traffic
• Benefits = 0.5* Vehicle Operating cost savings for
Generated Traffic
• Benefits can be estimated initially in financial prices (eg
via HDM model) then converted to economic prices
34
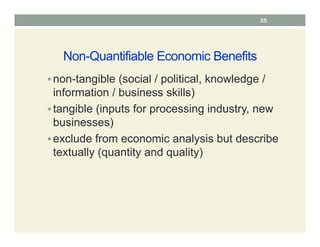
35.
Non-Quantifiable Economic Benefits
non-tangible(social / political, knowledge /
information / business skills)
tangible (inputs for processing industry, new
businesses)
exclude from economic analysis but describe
textually (quantity and quality)
35


![nidhi_economics[1].ppt](https://cdn.slidesharecdn.com/ss_thumbnails/nidhieconomics1-231230122929-54b4475f-thumbnail.jpg?width=640&height=640&fit=bounds)


