Download as PDF, PPTX


![BACK TO MATRIX To suggest amends/updates to content, email: Toby.Pickard@igd.com
Please give us feedback
Example of the percentage of embedded GHG
emissions within different products
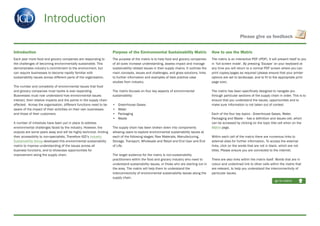
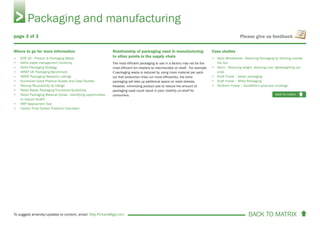
The table below shows the percentage of GHG emissions
produced by products at different stages of the supply chain. The
benefit of product analysis to this level is that ‘hot spots’ can be
identified. For example, the majority of the GHGs that are
embedded in a detergent occur in the ‘use by’ phase in the form
of energy used to heat the water, drive the washing machine etc.
Improved knowledge has resulted in the reformulation of some
detergents to enable consumers to wash at a lower temperature.
In contrast, the hot spot for milk is at the raw material (farm)
stage. The GHGs come from a variety of sources including
fertilisers applied to grassland, fossil fuels, energy in milking
parlours and methane emitted by dairy cattle.
Greenhouse gases
Raw material
production
Manufacture/
processing
Logistics/
distribution
Retail Use by
consumer
Recycling and
disposal
Detergent 21% 2% 2% 0.5% 67.5% 7%
Orange juice 28% 19% 47% 5% 1% 0%
Potato crisps 36% 51% 10% 0% 3%
Bread 45% 23% 4% 2% 23% 3%
Milk 73% 9% 3% 10% 3% 2%
back to matrix
page 2 of 2
Example of the percentage of embedded GHG emissions within different products
Source: The University of Manchester, Sustainable Consumption Institute, Report Consumers, business and climate change, 2009 [opens PDF, page 28]](https://image.slidesharecdn.com/21e034b0-2dcd-4b88-9663-4ebb36354e65-150715143437-lva1-app6891/85/Environmental_Sustainability_Matrix-4-6-320.jpg)
![BACK TO MATRIX To suggest amends/updates to content, email: Toby.Pickard@igd.com
Please give us feedback
Description of greenhouse gases from raw
materials
The greenhouse gases (GHGs) arising from raw materials in the
food and grocery supply chains are predominately from nitrous
oxide (from crops and livestock production), methane (from
livestock production and biodegradable waste) and carbon
dioxide (from energy use and land management).
What are the common issues with GHGs within the
supply chain?
Continued emissions of GHGs will further exacerbate the impact
of climate change, which presents businesses with additional
risks. There are national and international targets to reduce
GHGs. GHG emissions are a cost to business due to taxation,
less efficient energy use and rising costs.
To find out more about GHGs click here.
What are the key issues with GHGs and raw
materials?
GHG emissions associated with food raw materials come mainly
from the agricultural phase. Not all these emissions will be
created in the country in which the product is manufactured and
ultimately used/consumed. Supply chains are increasingly
global, and raw materials will be sourced from different
geographies reflecting availability, seasonality and cost.
Manufacturers therefore need to recognise their responsibilities
to work with suppliers of raw materials from all geographies to
reduce their GHG emissions.
Direct emissions from farming and changes in land use account
for about 7% of UK greenhouse gas emissions (Source: HM
Government). The Climate Change Act 2008 requires a reduction
in greenhouse gas emissions across the economy by at least
80% below 1990 levels by 2050, and agriculture will need to
play its part in achieving this.
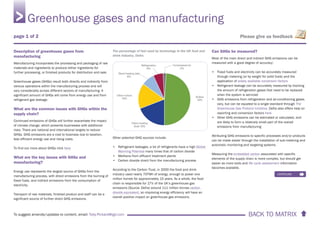
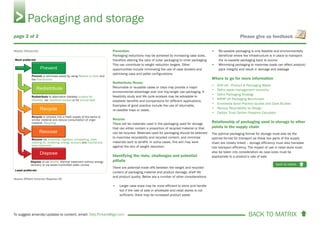
The nature of raw material GHG
emissions is very different from
other sectors of the economy such
as electricity generation, transport,
manufacturing, etc. The principal
GHG for most industries is carbon
dioxide from fossil fuel combustion,
while for agricultural systems
methane and nitrous oxide are the
main GHGs. These arise from
natural, biological processes that
are difficult to manage and subject to seasonal and annual
variability as a function of the weather, crop yield, and natural
processes in the case of methane from dairy cows.
For more in-depth information about global food and farming
meeting the challenges of a low emissions world click here.
Can GHGs be measured?
• The energy (fuel, electricity etc.) required to produce raw
materials for supply chains can be measured and this can be
converted into a GHG emission equivalent
• Determining emissions of methane and nitrous oxide is much
more complex and currently only coarse estimations of
emissions are possible, which are subject to considerable
uncertainty
What can be done to reduce the impact and what
are the opportunities?
Evidence suggests that by improving on-farm efficiency, farmers
can both save money and reduce emissions.
The UK agriculture industry’s GHG Action Plan [opens PDF] aims
to help farmers improve their use of energy and nutrients, their
management of crops and livestock and reduce emissions
without compromising domestic production.
This could be achieved by:
• Use of on-farm anaerobic digestion (AD)
• Use of bio-fuels in agricultural vehicles
• Increased energy efficiency
• Increased feed efficiency
Identifying the risks, challenges and potential
pitfalls
There is a risk that driving down emissions from agriculture in
the UK will compromise production, which could result in
‘exporting’ the UK’s production and emissions to other parts of
the world.
Greenhouse gases and raw materials
continues
page 1 of 2](https://image.slidesharecdn.com/21e034b0-2dcd-4b88-9663-4ebb36354e65-150715143437-lva1-app6891/85/Environmental_Sustainability_Matrix-4-7-320.jpg)
![BACK TO MATRIX To suggest amends/updates to content, email: Toby.Pickard@igd.com
Please give us feedback
Equally, just because food has been imported it does not
necessarily mean it will have more GHG emissions associated
with it compared to food grown in the UK. Food grown in a more
suitable climate may have lower emissions, even when including
transportation, than food grown locally. Examples of can be view
here.
However, whatever the country of origin of food there is a need to
improve agricultural GHG inventory that accurately reflects
progressive changes in farming practice, such as improvements
to livestock diets, nutrient management and manure
management.
A key challenge is establishing realistic goals for reducing
agricultural GHG emissions towards a minimum future level,
beyond which it may not be biologically possible to make further
reductions.
Industry needs to remain open to future technological
breakthroughs or innovative production systems that might be
possible in the long term.
There is a need to be mindful of potential conflicts with other
sustainability related issues, such as intensification to reduce
overall emissions versus animal welfare (i.e. lower GHG systems
are often the most intensive; which means that there may be a
trade off between lowering GHGs and animal welfare).
Where to go for more information
• Department for Environment Food and Rural Affairs
• Greenhouse Gas Action Plan [opens PDF]
• Agriculture and Horticulture Development Board (AHDB) e.g.
EBLEX’s work for the beef and sheep sectors
• Department for Energy and Climate Change
• The Milk Roadmap: One year down the Road [opens PDF]
• IGD’s Greenhouse Gas Management Report Library on igd.
com
Relationship of GHG emissions from raw materials
to other points in the supply chain
GHG emissions arising from raw materials in the food and
grocery supply chains are predominately from methane, nitrous
oxide and carbon dioxide and can contribute a significant
amount of GHG emissions compared to other areas of the supply
chain.
Case studies
• Müller - Sustainable Dairy Goodness
• Produce World Group - Managing non-financial information to
drive sustainability
• Sainsbury’s - first Carbon Trust certified carbon measure for
dairy farmers
Greenhouse gases and raw materials
back to matrix
page 2 of 2](https://image.slidesharecdn.com/21e034b0-2dcd-4b88-9663-4ebb36354e65-150715143437-lva1-app6891/85/Environmental_Sustainability_Matrix-4-8-320.jpg)
![BACK TO MATRIX To suggest amends/updates to content, email: Toby.Pickard@igd.com
Please give us feedback
What can be done to reduce the impact and what
are the opportunities?
There are a number of initiatives that can be implemented to
reduce the impact of GHG emissions directly associated with
manufacturing, such as:
• Improving energy efficiency
• Switching to lower carbon fuels
(e.g. coal or oil to natural gas) or on-site generation
(e.g. Combined Heat and Power)
• Using renewable energy sources
• Changing refrigerant gas types and minimising leakage
Energy efficiency opportunities will vary across individual sites
and processes. The potential areas for greatest improvement are
typically linked to the areas of greatest energy use, for example
cooking and refrigeration.
There are a number of options available for renewable energy
(for example through renewable tariffs, direct purchase and
installation of renewables on manufacturing sites, or third party
installation and operation on a host site). The business case for
some renewables has been improved through the introduction of
incentives such as the Feed-In Tariff and the Renewable Heat
Incentive.
The financial benefits of improving energy efficiency to reduce
GHGs make it an attractive area for companies to address.
Commercial buildings are responsible for approximately 17% of
UK energy use, but despite this, the Carbon Trust estimates that
businesses in the UK waste some 10-20% of the energy they buy
due to poor control of heating, air conditioning and ventilation
and through leaving lights and appliances on when not in use.
The Carbon Trust report The Business of Energy Efficiency is
available to download here
Identifying the risks, challenges and potential
pitfalls
Many of the new renewable options do not meet the relatively
short-term payback criteria for investment required by companies
(often two years). In order to progress in some of these
technologies there may be a requirement to go into relatively
long term third party finance/design/building/operating type
agreements, which could be from 5-25 years depending on the
type and scale of installation. This would bring inherent risks and
potential liabilities for commercial and private sector investors.
The projected uplift in biomass boilers and Combined Heat and
Power (CHP) plants carries a risk associated with securing a long
term supply of fuel, and the price of this in the medium to long
term as demand rises.
Energy prices are notoriously volatile, making longer investment
decisions in utilities infrastructure a difficult process. Current
uncertainty over future Climate Change Agreements and carbon
prices within the scheme add to this uncertainty.
Some organisations offset GHG emissions through specific
schemes. However, there is a need to check the validity of such
schemes. The Department of Energy and Climate Change does
recognise a number of organisations that offer such services,
however, best practice is to reduce the GHG emissions on site as
much as possible, rather than relying on offsets. Click here to
see The UK Government’s Quality Assurance Scheme for Carbon
Offsetting.
Where to go for more information
• Department of Energy & Climate Change
• Final submission of the Food Industry Sustainability Strategy
Champions’ Group on Energy and Climate Change [opens
PDF]
• The Carbon Trust
• The Environment Agency (Carbon Reduction Commitment)
• Renewable Energy Association
• Defra: F-gas Support (Refrigerants )
• IGD’s Greenhouse Gas Management Report Library on igd.
com
Relationship of GHG emissions from manufacturing
to other points in the supply chain
The GHG emissions from manufacturing will vary considerably
depending on the product or service.
Products that require more processing or refrigeration are likely
to have a higher GHG impact.
Case studies
• Alpro UK Ltd. - CO2 Neutrality
• Heinz - Cuts energy and carbon
• Kraft Foods - Energy and carbon savings
• United Biscuits - Reducing Carbon Emissions
Greenhouse gases and manufacturing
back to matrix
page 2 of 2](https://image.slidesharecdn.com/21e034b0-2dcd-4b88-9663-4ebb36354e65-150715143437-lva1-app6891/85/Environmental_Sustainability_Matrix-4-10-320.jpg)

![BACK TO MATRIX To suggest amends/updates to content, email: Toby.Pickard@igd.com
Please give us feedback
Description of greenhouse gases from transport
Transport takes place between all points of the supply chain.
However the main focus in this cell is heavy goods vehicle used
to transport raw materials and finished goods to point of
purchase. For the purpose of this cell, we refer to the movement
of resources, not people.
Transport covers different modes (road, water, air and rail) all of
which are relevant to the food and grocery industry.
What are the common issues with GHG within the
supply chain?
Continued emissions of greenhouse gas (GHG) will further
exacerbate the impact of climate change, which presents
businesses with additional risks. There are national and
international targets to reduce GHGs. GHG emissions are a cost
to business due to taxation, less efficient energy use and rising
costs.
To find out more about GHGs click here.
What are the key issues with GHGs and transport?
The food and grocery industry is accountable for approximately
25% of all HGV vehicle kilometers in the UK (Defra).
The transport of resources requires energy. This energy will be
provided in a number of different forms: liquid fuels, gaseous
fuels and electricity for example. Each fuel type has a different
GHG emissions factor. Vehicle design, size and weight, engine
size, fuel type, and driver style all play a role in the emissions
created. External factors, particularly congestion, can also be
significant factors.
Can GHGs be measured?
It is possible to measure the GHG emissions of transport by
knowing the type of fuel, the consumption rate of the mode of
travel and the distance travelled.
To see conversion factors click on the following link: July 2011
Guidelines to Defra/DECC’s Greenhouse Gas Conversion Factors
for Company Reporting [opens Excel 1.3 MB]
What can be done to reduce the impact and what
are the opportunities?
There are a number of strategies to reduce GHG emissions from
transport, these include:
• Reducing the absolute amount of transport required – better
loading patterns, route planning, redesigning products and
packaging to enhance the load factor
• Using alternative fuels, such as LPG and electric. Some
companies have started to use rail, waterways and double
deck trailers to reduce GHG associated with transportation
• Using waste product as a fuel, such as waste cooking oil
and/or second generation biofuels
• Reducing ‘empty running’
• Making best use of new technologies to improve vehicle
aerodynamics, route planning and load capacity
• Train drivers to reduce consumption through better driving
• Collaborating with other transport users and operators to
share transport
Identifying the risks, challenges and potential
pitfalls
Some lower GHG fuels may have worse air quality emissions
than the fuels they are replacing, though these can be mitigated
by new technologies.
Biofuels have been linked to increasing costs of some food
stuffs, causing ethical concerns around using food for fuel.
However, second generation biofuels could help alleviate this
challenge.
Electric vehicles do not create any emissions themselves (known
as ‘direct emissions’). However, depending on the source of
electricity used to charge them, there may be emissions
associated with this electricity from conventional power sources.
Recognising the difference between test conditions and ‘real
world’ running conditions and understanding why variations may
occur when purchasing vehicles.
Understanding the vehicle mix - goods are moved by a
combination of vans, fixed load trucks and articulated vehicles
Greenhouse gases and transport
continues
page 1 of 2](https://image.slidesharecdn.com/21e034b0-2dcd-4b88-9663-4ebb36354e65-150715143437-lva1-app6891/85/Environmental_Sustainability_Matrix-4-13-320.jpg)
![BACK TO MATRIX To suggest amends/updates to content, email: Toby.Pickard@igd.com
Please give us feedback
Where to go for more information
• The Guidance on measuring and reporting Greenhouse Gas
emissions from freight transport operations [PDF 3.7 MB –
Please note this is a large file. You may find it easier to save
this file to your computer before opening it]
• Quick reference guide for transport operators
• Toolkit for freight transport operators to calculate their Scope
3 emissions [opens Excel 1.3 MB]
• Optimising Load Fill: A Best Practice Guide
• Optimising Transport Modes
• Transport Technology User Guide & Assessment Tool
• Consolidated Distribution
• IGD’s Greenhouse Gas Management Report Library on igd.
com
Relationship of GHG emissions from transport to
other points in the supply chain
Depending on the type of transportation mode used and the
requirements of the products being transported the GHG
emissions will vary considerably.
If the product requires chilling during transportation its GHG
emissions will be higher.
Case studies
• ASDA - Being sustainable in a recessionary environment
• Asda ‘Fewer, Friendlier Miles’
• Warburtons - Reducing carbon by reducing road miles
• HEART of ENGLAND fine foods - reducing road miles through
supply chain collaboration
• Mars and Nestlé
• Nestlé and United Biscuits – Taking a unique approach to
collaboration
• Sainsbury’s – Food deliveries made by lorry running on
rubbish
• Convert2Green and 3663 - Turning waste into fuel
Greenhouse gases and transport
back to matrix
page 2 of 2](https://image.slidesharecdn.com/21e034b0-2dcd-4b88-9663-4ebb36354e65-150715143437-lva1-app6891/85/Environmental_Sustainability_Matrix-4-14-320.jpg)
![BACK TO MATRIX To suggest amends/updates to content, email: Toby.Pickard@igd.com
Please give us feedback
Description of greenhouse gases from wholesale
and retail
The greenhouse gas (GHG) emissions associated with wholesale
and retail premises depends on a number of factors. These
include: energy source used on site, energy consumption, hot or
cold water consumption, static diesel fuel on site, the type of
refrigerants used.
There are other factors that depend on location and proximity to
depots and customers, which are not considered in this cell.
What are the common issues with GHGs within the
supply chain?
Continued emissions of GHGs will further exacerbate the impact
of climate change, which presents businesses with additional
risks. There are national and international targets to reduce
GHGs. GHG emissions are a cost to business due to taxation,
less efficient energy use and rising costs.
To find out more about GHGs click here.
What are the key issues with GHGs and wholesale
and retail?
Commercial buildings are responsible for approximately 17% of
UK energy use, but despite this, the Carbon Trust estimates that
businesses in the UK waste some 10-20% of the energy they buy
due to poor control of heating, air conditioning and ventilation
and through leaving lights and appliances on when not in use.
The Carbon Trust report The Business of Energy Efficiency is
available to download here.
Individual wholesale and retail premises vary enormously in their
environmental performance. The age and the degree to which
the property has been modified to improve insulation and
building integrity as well as the upgrading of the key technologies
of air handling, refrigeration and heating are all major factors in
the amount of GHG emissions emitted.
The pie chart gives an indication of the percentage of fuel used
by technology within the food and drink industry.
The percentage of fuel used by technology in the UK food and
drink industry, Defra
The use of hydroflurocarbon refrigerants can contribute
significantly to GHG emissions due to refrigerant gas leakage
and their very high Global Warming Potential. The food and drink
industry is one of the main users of refrigeration. For many
businesses refrigeration costs can account for up to 50% of all
electricity used on site (Source: Carbon Trust).
Can GHGs be measured?
The consumption of electricity, hot or cold water, oil or gas is
generally well metered and this can be converted into GHG
equivalent carbon emission figures. To see conversion factors
click on the following link: July 2011 Guidelines to Defra/DECC’s
Greenhouse Gas Conversion Factors for Company Reporting
[opens Excel 1.3 MB]
The type and loss of refrigerants from air conditioning units and
fridge/freezers can easily be measured through annual
consumption figures as part of strict maintenance procedures.
To see conversion factors click here.
What can be done to reduce the impact and what
are the opportunities?
Lighting costs can be as much as 40% of a building’s electricity
consumption. The correct use of lighting controls to reflect actual
occupation and daylight linking can reduce operating costs by
between 25% and 50% (Source: Energy Services and Technology
Association).
Reductions can also be delivered by:
• Improved monitoring, such as smart electricity monitors
• Better use and control of consumption, i.e. turning
equipment off when not required
• Improved insulation of the building
• Staff training and the development of energy champions to
drive performance
• Heat reclamation and improved air handling technologies
Greenhouse gases and wholesale and retail
continues
page 1 of 2](https://image.slidesharecdn.com/21e034b0-2dcd-4b88-9663-4ebb36354e65-150715143437-lva1-app6891/85/Environmental_Sustainability_Matrix-4-15-320.jpg)
![BACK TO MATRIX To suggest amends/updates to content, email: Toby.Pickard@igd.com
Please give us feedback
• Converting to lower Global Warming Potential GHG
refrigerants and better maintenance to reduce leakage of
refrigerant gases
• The source and type of the energy is critical. Local generation
from renewable resources and the development of
community generation schemes can offer lower emissions
and other benefits
Identifying the risks, challenges and potential
pitfalls
Energy efficiency technologies to mitigate GHG emissions require
investment. Introducing new technologies can mean significant
reductions in GHG emissions, but payback periods may be long
and therefore the technology could be rejected using standard
‘return on investment’ criteria. Changes in legislation and/or
incentives (e.g. Feed-In Tariff and the Renewable Heat Incentive)
can change the economics significantly at short notice and
should be continually monitored.
Some organisations offset GHG emissions through specific
schemes. However, there is a need to check the validity of such
schemes. The Department of Energy and Climate Change does
recognise a number of organisations that offer such services,
however, best practice is to reduce the GHG emissions on site as
much as possible, rather than relying on offsets. Click here to
see The UK Government’s Quality Assurance Scheme for Carbon
Offsetting
Where to go for more information
• Guidance on how to measure and report your greenhouse
gas emissions
• The Carbon Trust
• Small Business User Guide: Guidance on how to measure
and report your greenhouse gas emissions [opens PDF 260
KB]
• RICS: Green Building Information Gateway
• BREEAM: the Environmental Assessment Method for
Buildings Around The World
• Building Research Establishment: Sustainable construction
of buildings
• Carbon Trust: Low Carbon Buildings Accelerators
• Carbon Trust: Low carbon refurbishment of buildings -
Management guide
• Building Regulations
• Business Link: Use resources efficiently in your retail
business
• IGD’s Greenhouse Gas Management Report Library on igd.
com
Relationship of GHG emissions from wholesale and
retail to other points in the supply chain
Overall, the GHG emissions associated with wholesale or retail
stores in relation to the total GHG emissions of a supply chain
will be relatively small.
For specific products the retail element can vary hugely: e.g. 0.5
% for washing powder to 10% for milk. See GHG definition page
for further information, click here
Case studies
• Morrisons – ‘Cut the Carbon Campaign’
• Sainsbury’s – Opens the UK’s greenest stores
• Tesco - Creating a Greener Store
• The Co-operative Food - Green Store CO² Refrigeration
Systems
Greenhouse gases and wholesale and retail
back to matrix
page 2 of 2](https://image.slidesharecdn.com/21e034b0-2dcd-4b88-9663-4ebb36354e65-150715143437-lva1-app6891/85/Environmental_Sustainability_Matrix-4-16-320.jpg)


![BACK TO MATRIX To suggest amends/updates to content, email: Toby.Pickard@igd.com
Please give us feedback
Definition and issues with Water
Water is a vital resource for the food and grocery industry. The
food industry uses an estimated 430 mega litres per day of
public water supply, and directly abstracts around 260 mega
litres of water a day, which equates to 10% of water abstracted
by industry in the UK (Defra 2007 [opens PDF]).
With the UK’s water resources coming under ever increasing
pressure from growing public, commercial and industrial
demand, there is a need for the industry to address the effects
of its water consumption on national water security and scarcity,
the impact on local wildlife habitats and water quality.
Direct water within the food and grocery industry
The illustration, Figure 1, highlights the different direct uses of
water across the major stages of the food and grocery supply
chain. Energy, and its associated water use, is linked to all
activities.
Water scarcity
Water scarcity is already an issue in the UK. Per person, the UK
has less water available than most EU countries. Most of the
south and east of England is already severely water stressed.
Waterwise states that the ‘South East of England has less water
available per person than the Sudan and Syria.’ This lack of
water within the south of England has seen a reduction in the
number of water abstraction licences issued to companies.
The combination of limited availability and high demand for
water, including the expected impacts of climate change, mean
many companies are subject to increasing water-related risks.
This will impact food companies specifically with global
agriculture being the biggest user of freshwater, accounting for
70% of worldwide use. This is unlikely to change as estimates
point to an increased need for irrigation in the future if we are to
feed a growing population.
Water
Figure 1: Examples of water use along the food and grocery supply chain
Source: IGD
continues
page 1 of 2](https://image.slidesharecdn.com/21e034b0-2dcd-4b88-9663-4ebb36354e65-150715143437-lva1-app6891/85/Environmental_Sustainability_Matrix-4-19-320.jpg)
![BACK TO MATRIX To suggest amends/updates to content, email: Toby.Pickard@igd.com
Please give us feedback
Water related risk
Water scarcity poses risks to companies as it means that they
may not have sufficient water, or water of the required quality, to
operate.
The water-related risks that companies face have been
summarised by WWF-UK as follows:
• Physical risks – deterioration in product quality/ safety; raw
material or product shortages
• Financial risks – escalating cost of direct water use,
fluctuating and/or escalating cost of raw materials/products/
services, requiring significant water input
• Regulatory risks – tightening regulation leading to cost
increases; outright bans on specific practices and
reputational risks associated with litigation
• Reputational risks – from actual or perceived irresponsible
use of water, either directly by companies or in their supply
chains
A report produced by Ceres, UBS and Bloomberg, called MURKY
WATERS? Corporate Reporting on Water Risk: A Benchmarking
Study of 100 Companies, 2010 [opens PDF], concludes that
most companies operating in water-intensive industries are
failing to provide investors with adequate information on the
water-related risks they face and in many cases have little idea
how their supply chains could be affected by water shortages.
The Earth Policy Institute believes that water scarcity is now the
single biggest threat to global food security. The World Bank has
predicted that by 2025 two-thirds of the world’s population will
not have enough drinking water.
Indirect water use
There is also an issue with indirect water use, (more commonly
known as embedded water), this is the amount of water used in
the entire process of producing, retailing and consuming
(cooking for example) a product. It is also referred to as virtual
water, water footprint, embodied water or shadow water.
The concept is very similar to embedded Greenhouse Gases but
not the same. Understanding and assessing the impact of water
is complicated. Unlike greenhouse gases the impact of water use
varies in location and time, and water can be of many different
qualities. In addition explaining the concept of embedded water
versus direct water consumption is complex.
It is estimated that the average Briton uses about 150 litres of
water per day. If the embedded water used in the production of
the goods people consume is taken into account the daily use
per person in the UK may be nearer 3,400 litres (Source:
Waterwise).
Table 1, shows the percentage of embedded water that goes into
a product, at each section of the supply chain. For example, it is
estimated that 170 litres of water is used in producing one pint
of beer, and one 150 gram burger requires 2,400 litres of water.
For more information and examples see IGD’s Embedded Water
in Food Production factsheet.
Table 1: Embedded water breakdown in different products
Source: WWF, Waterwise, Water Footprint Network and P&G
Water
RAW MATERIAL
PRODUCTION
MANUFACTURE/
PROCESSING
RETAIL USE BY
CONSUMER
RECYCLING
AND DISPOSAL
A sugar carbonated drink 97% 3% <1% <1% <1%
Potatoes 93% 7% <1% <1% <1%
A typical laundry product <1% <1% <1% 99% <1%
back to matrix
page 2 of 2](https://image.slidesharecdn.com/21e034b0-2dcd-4b88-9663-4ebb36354e65-150715143437-lva1-app6891/85/Environmental_Sustainability_Matrix-4-20-320.jpg)

![BACK TO MATRIX To suggest amends/updates to content, email: Toby.Pickard@igd.com
Please give us feedback
Table 3: Drinking water requirements for livestock
Sources: Luke (2003); National Research Council (1985; 1987; 1994; 1998;
2000); Pallas (1986); Ranjhan (1998).
Source: FAO
Can water be measured?
Volume, quality and water scarcity can be measured.
Volume: Measuring use rate is relatively straightforward, and can
be done through the use of water meters. Allowances should be
made for evaporation, transpiration and the efficiency of the
irrigation system.
Quality: There are a number of different measures of water quality
– the most common used by industry are Biochemical Oxygen
Demand, Chemical Oxygen Demand and Total Suspended Solids.
The degree of phosphates and nitrogen can also be measured in
discharge water, as these levels will have implications on soil
management. Key to the actual impact of these measures will be
the sensitivity of the local environment where the discharge
takes place.
Scarcity: There are different methods for measuring localised
water scarcity – physical water scarcity, economic water scarcity
or even political water scarcity can all be used to assess the
potential impacts (and there are different methods and
assumptions used to look at each of these). It is important that
consistent methods are applied when comparing regions. For
more information click here.
What can be done to reduce the impact and what
are the opportunities?
• Know where crops/raw materials are sourced from and what
the issues are within this area
• Consider crops/materials that are less water intensive in
their production
• Optimise irrigation, use boom or trickle irrigation
• Irrigate at night, ensuring the necessary safe working
systems are in place
• Level land to ensure even irrigation
• Manage droplet size on irrigation
• Avoid irrigating in windy conditions to best manage spray
patterns
• Develop water storage facilities
• Use drought resistant crop varieties
• Reduce evapotranspiration
• Form local water abstraction groups to collaborate on better
water management
• Manage wash down and cleaning techniques more efficiently
• Pre-soak vegetables prior to cleaning, this reduces water
needed for the final clean
Identifying the risks, challenges and potential
pitfalls
The FISS Champions Group on Water report [opens PDF],
published in May 2007 identifies the following challenges for
industry:
• Lack of data to enable conclusive economic decisions
• Lack of resources, time and budget
• Uncertainty about financial benefits
• Product quality issues
Water and raw materials
Species Physiological condition Average
weight
Air temperature o
C
15 25 35
Water requirements
(kg) (.......litres/animal/day.....)
Cattle African pastoral system-lactating - 2 litres milk/day
Large breed - Dry cows -279 days pregnancy
Large breed - Mid-lactation - 35 litres milk/day
200
680
680
21.8
44.1
102.8
25
73.2
114.8
28.7
102.3
126.8
Goat Lactating - 0.2 litres milk/day 27 7.6 9.6 11.9
Sheep Lactating - 0.4 litres milk/day 36 8.7 12.9 20.1
Camel Mid-lactation - 4.5 litres milk/day 350 31.5 41.8 52.2
Chicken Adult broilers (100 animals)
Laying eggs (100 animals)
17.7
13.2
33.1
25.8
62
50.5
Swine Lactating - daily weight gain of pigs 200g 175 17.2 28.3 46.7
continues
page 2 of 3](https://image.slidesharecdn.com/21e034b0-2dcd-4b88-9663-4ebb36354e65-150715143437-lva1-app6891/85/Environmental_Sustainability_Matrix-4-22-320.jpg)
![BACK TO MATRIX To suggest amends/updates to content, email: Toby.Pickard@igd.com
Please give us feedback
• Safety and hygiene issues
• Lack of awareness of the technical feasibility of change
• Customers’ perceptions and potential risks associated with
change
• Fear of potential negative public relations associated with the
above
• Managing effluent as well as water into facilities
• Be aware of flood risk
For further information on flooding click here.
Other risks and challenges are as follows:
• Water demand is likely to increase (due to increasing
population and changing diets)
• Climate change is likely to change rainfall patterns
• More intensive rainfall will increase the risk of flooding
• Public and industry understanding of the issues is low
Where to go for more information
• IGD: Guide to Understanding, Assessing and Managing Water
in Grocery Supply Chains
• Good water stewardship: guidance for agricultural suppliers
[opens PDF]
• Environment Agency: Saving water in agriculture and
horticulture
• NFU Water
• WBCSD Global Water Tool
• Water Footprinting Network
• Regional licensing – England and Wales
• EU Water Framework Directive
• Aqueduct - Measuring and mapping water risk
• CEO Water Mandate
• CDP Water Disclosure
• Water Report Library section within igd.com
Relationships of water and raw materials to other
points in the supply chain
Food raw material production often uses a lot of water. It is
important to be mindful however that using large volumes of
water is not necessarily an issue if water availability in the
location is high. In contrast, production of raw materials for use
in some grocery products (e.g. washing detergents) is relatively
low compared to water used in other parts of the supply chain
(e.g. end user).
Case studies
• Heinz - water conservation
Water and raw materials
back to matrix
page 3 of 3](https://image.slidesharecdn.com/21e034b0-2dcd-4b88-9663-4ebb36354e65-150715143437-lva1-app6891/85/Environmental_Sustainability_Matrix-4-23-320.jpg)
![BACK TO MATRIX To suggest amends/updates to content, email: Toby.Pickard@igd.com
Please give us feedback
Description of water used in manufacturing
Manufacturing incorporates the processing and packaging of raw
materials and ingredients to produce either ingredients for
further processing, or finished products for distribution and sale.
Water is a vital commodity for manufacturing with a variety of
essential uses such as washing, cleaning, hygiene and
sanitisation, heat transfer (heating and cooling), material
conveying and as an ingredient.
What are the common issues with water within the
supply chain?
The two main issues surrounding water are availability and
quality. Only 0.5% of global water is available as freshwater for
human use, with 97% salt water, and 2.5% locked into glaciers &
ice (WCBSD 2009).
With a rapidly growing global population the availability of fresh
water is an increasing problem for many parts of the world.
Nearly half of Europe’s population live in areas defined as ‘water-
stressed’ (EEA, 2010).
For more information on the common issues, click here.
What are the key issues with water and
manufacturing?
The availability of water for manufacturing is likely to become an
increasingly important issue.
The UK food manufacturing sector has an annual turnover of
around £70billion, and water consumption costs the sector
about 0.5% of this turnover. A 20% reduction in water use would
save the sector in excess of £60 million a year (Source: FISS,
2006 [opens PDF]).
Efficient use of water is an essential requirement for any
manufacturing process to be sustainable in the future.
Consideration needs to be given to the treatment of effluent, the
output quality and cost of treatment.
Manufacturing sites may also be subject to flooding, and should
aim to mitigate this issue. For further information on flooding
click here.
Can water be measured?
Direct water consumption can be relatively easily measured
through the use of meters and is typically measured and charged
for in units of cubic metres. A degree of sub-metering on a
manufacturing site enables a more effective monitoring and
targeting regime to be applied to fully assess the efficiency of
processes and the opportunities for improvement.
A large proportion of water used in manufacturing does not go
into the finished product and will go for treatment before
entering drainage systems. If this water is recycled, water use
can be significantly reduced. This has both cost and legal
compliance implications. With many manufacturing materials
being polluting, the environmental impact of untreated effluent
from manufacturing can be significant.
What can be done to reduce the impact and what
are the opportunities?
A useful exercise is to conduct a water mass balance of a
manufacturing site to help identify all areas of consumption and
assess losses through leakage and evaporation which can be
harder to directly measure (see figure 2 below).
There are a number of water conservation measures to make
more efficient use of water in manufacturing processes, such as:
• Sub-metering, monitoring and targeting, water mapping
• Identification and repair of leaks
• Cleaning – Cleaning in Place (CIP) – water recirculation
• Staff training
• Provide plugs for sinks, fit percussion taps, dual and
waterless toilet facilities
• Recycle water used for vehicle washing
• Capture rainwater and store for future use, known as rain
water harvesting
• Use ponds to collect storm water
• Train staff to address water usage
Water and manufacturing
Figure 2: Diagram of a water mass balance
continues
page 1 of 2](https://image.slidesharecdn.com/21e034b0-2dcd-4b88-9663-4ebb36354e65-150715143437-lva1-app6891/85/Environmental_Sustainability_Matrix-4-24-320.jpg)
![BACK TO MATRIX To suggest amends/updates to content, email: Toby.Pickard@igd.com
Please give us feedback
The Federation House Commitment (FHC) aims to reduce water
usage in companies and work towards an overall industry-wide
water reduction target of 20% by the year 2020. Any
manufacturer in the food and drink industry may join.
Identifying the risks, challenges and potential
pitfalls
The FISS Champions Group on Water report [opens PDF],
published in May 2007 identifies the following challenges for
industry:
• Lack of data to enable conclusive economic decisions
• Lack of resources, time and budget
• Uncertainty about financial benefits
• Product quality issues
• Safety and hygiene issues
• Lack of awareness of the technical feasibility of change
• Customers’ perceptions and potential risks associated with
change
• Fear of potential negative public relations associated with the
above
• Managing effluent as well as water into facilities
• Be aware of flood risk
For further information on flooding click here.
A report produced by Ceres, UBS and Bloomberg, called MURKY
WATERS? Corporate Reporting on Water Risk: A Benchmarking
Study of 100 Companies, 2010 [opens PDF], concludes that
most companies operating in water-intensive industries are
failing to provide investors with adequate information on the
water-related risks they face and in many cases have little idea
how their supply chains could be affected by water shortages.
Where to go for more information
• IGD: Guide to Understanding, Assessing and Managing Water
in Grocery Supply Chains
• Federation House Commitment
• WRAP: Water guides
• WRAP: Rippleffect
• Environmental permitting for discharges to surface water and
groundwater
• EA: Food and drink manufacturing industry environmental
management toolkit [opens PDF]
• EA: Water abstraction
• Regional licensing – England and Wales
• EU Water Framework Directive
• Aqueduct - Measuring and mapping water risk
• CEO Water Mandate
• CDP Water Disclosure
• Water Report Library section within igd.com
Relationships of water in manufacturing to other
points in the supply chain
Manufacturing relies on clean water to make quality products. In
general, manufacturers are in control of water once it enters the
factory. Projects can be carried out to reduce water consumption
by introducing a rigorous approach to water reduction.
Manufacturing companies need to appreciate the volume of
embedded water in their products, and where this embedded
water occurs, for example with food the highest volume of water
use is likely to be in the raw materials used, in laundry products
it is likely to be in the use phase, i.e. washing. For further
information click here.
Case studies
• Greenvale AP - Reducing water and energy use
• Kraft Foods - Water savings
• Warburtons - Measuring, managing and reducing water
usage
Water and manufacturing
back to matrix
page 2 of 2](https://image.slidesharecdn.com/21e034b0-2dcd-4b88-9663-4ebb36354e65-150715143437-lva1-app6891/85/Environmental_Sustainability_Matrix-4-25-320.jpg)
![BACK TO MATRIX To suggest amends/updates to content, email: Toby.Pickard@igd.com
Please give us feedback
Description of water used in storage
Storage can be defined as the placing of goods in a suitable facility,
with the intention of being retrieved at a later date. Storage will take
place for a number of reasons: consolidation, change of mode of
transport, product preservation, strategic and display prior to sale.
This cell looks at the use of water directly associated with storage
operations. This will include water used for cleaning (equipment,
clothes and personal), potentially catering and washing of buildings
and vehicles (based at sites) and toilets.
What are the common issues with water within the
supply chain?
The two main issues surrounding water are availability and quality.
Only 0.5% of global water is available as freshwater for human use,
with 97% salt water, and 2.5% locked into glaciers & ice (WCBSD
2009).
With a rapidly growing global population the availability of fresh water
is an increasing problem for many parts of the world. Nearly half of
Europe’s population live in areas defined as ‘water-stressed’ (EEA,
2010).
For more information on the common issues, click here.
What are the key issues with water and storage?
Storage sites are unlikely to be significant users of water in relation
to other points in the supply chain. However, there may be a
significantly higher impact in areas of, or at times of year of, water
shortage. Storage sites may also be subject to flooding, which can
have a significant impact on operations. Water leaks can lead to
significant increases in consumption, which are not obvious without
metering sites.
Can water be measured?
Water use can be measured at store facilities through water
metering. This, if applied over a significantly short time period, can
identify leaks as they occur. Awareness should also be raised of the
local impact of water consumption.
Facilities should also consider the impact their effluent (waste water)
may have on systems and networks. Effluent treatment is likely to be
a significant cost.
What can be done to reduce the impact and what are
the opportunities?
There are a number of strategies to reduce the impact of water at
storage facilities, which are listed below:
• Provide plugs for sinks, fit percussion taps, dual and waterless
toilet facilities
• Recycle water used for vehicle washing
• Capture rainwater and store for future use, known as rain water
harvesting
• Use ponds to collect storm water
• Train staff to address water usage
Identifying the risks, challenges and potential pitfalls
The FISS Champions Group on Water report [opens PDF], published
in May 2007 identifies the following challenges for industry:
• Lack of data to enable conclusive economic decisions
• Lack of resources, time and budget
• Uncertainty about financial benefits
• Product quality issues
• Safety and hygiene issues
• Lack of awareness of the technical feasibility of change
• Managing effluent as well as water into facilities
• Be aware of flood risk
For further information on flooding click here.
Where to go for more information
• IGD: Guide to Understanding, Assessing and Managing Water in
Grocery Supply Chains
• WRAP: Water guides
• WRAP: Rippleffect
• Environmental permitting for discharges to surface water and
groundwater
• EA: Food and drink manufacturing industry environmental
management toolkit [opens PDF]
• EA: Water abstraction
• Regional licensing – England and Wales
• EU Water Framework Directive
• Aqueduct - Measuring and mapping water risk
• CEO Water Mandate
• CDP Water Disclosure
• Water Report Library section within igd.com
Relationships of water in storage to other points in
the supply chain
The impact of water use in the storage section of the supply
chain will be relatively low compared to other areas of the chain.
However, this doesn’t mean that attempts to reduce water usage
should not be implemented, as significant savings can be made
from relatively easy to implement initiatives, such as rainwater
harvesting, staff training and by using more water efficient
machinery.
Water and storage
back to matrix
page 1 of 1](https://image.slidesharecdn.com/21e034b0-2dcd-4b88-9663-4ebb36354e65-150715143437-lva1-app6891/85/Environmental_Sustainability_Matrix-4-26-320.jpg)
![BACK TO MATRIX To suggest amends/updates to content, email: Toby.Pickard@igd.com
Please give us feedback
Description of water use in transport
Transport takes place between all points of the supply chain. For
the purposes of this section we refer to the movement of
resources, not people. Transport covers different modes (road,
water, air and rail) all of which are relevant to the grocery sector.
Transport may also include the movement of liquids by pipeline
and solids by conveyor in specific sectors.
This cell looks at the use of water directly associated with
transport operations. This is mainly water used for cleaning
vehicles (based at sites).
What are the common issues with water within the
supply chain?
The two main issues surrounding water are availability and quality.
Only 0.5% of global water is available as freshwater for human use,
with 97% salt water, and 2.5% locked into glaciers & ice (WCBSD
2009).
With a rapidly growing global population the availability of fresh water
is an increasing problem for many parts of the world. Nearly half of
Europe’s population live in areas defined as ‘water-stressed’ (EEA,
2010).
For more information on the common issues, click here
What are the key issues with water and transport?
Transportation within the supply chain is not a significant user of
water compared to other parts of the supply chain. The majority of
water used in this stage will be for cleaning the different modes of
transport, such as lorries and trains.
Can water be measured?
Water used for cleaning vehicles can be measured through water
metering. Awareness should be raised with staff of the local
impact of water consumption at sites located in water-stressed
regions.
What can be done to reduce the impact and what
are the opportunities?
There are a few processes that can be implemented to reduce the
impact of water use:
• Use recycled water in vehicle washing
• Capture rainwater and store for future use, known as rain water
harvesting
• Train staff to be mindful of water usage
Capturing and treating the waste water associated with this
stage of the chain should be considered, as effluent is likely to
be a significant cost to a site.
Identifying the risks, challenges and potential
pitfalls
The FISS Champions Group on Water report [opens PDF], published
in May 2007 identifies the following challenges for industry:
• Lack of data to enable conclusive economic decisions
• Lack of resources, time and budget
• Uncertainty about financial benefits
• Product quality issues
• Safety and hygiene issues
• Lack of awareness of the technical feasibility of change
• Managing effluent as well as water into facilities
• Be aware of flood risk
For further information on flooding click here.
Where to go for more information
• IGD: Guide to Understanding, Assessing and Managing Water in
Grocery Supply Chains
• WRAP: Water guides
• WRAP: Rippleffect
• Environmental permitting for discharges to surface water and
groundwater
• EA: Food and drink manufacturing industry environmental
management toolkit [opens PDF]
• EA: Water abstraction
• Regional licensing – England and Wales
• EU Water Framework Directive
• Aqueduct - Measuring and mapping water risk
• CEO Water Mandate
• CDP Water Disclosure
• Water Report Library section within igd.com
Relationships of water in transport to other points
in the supply chain
The impact of water use for transportation within the supply chain
will be relatively low compared to other areas of the chain.
Water and transport
back to matrix
page 1 of 1](https://image.slidesharecdn.com/21e034b0-2dcd-4b88-9663-4ebb36354e65-150715143437-lva1-app6891/85/Environmental_Sustainability_Matrix-4-27-320.jpg)
![BACK TO MATRIX To suggest amends/updates to content, email: Toby.Pickard@igd.com
Please give us feedback
Description of water used in wholesale and retail
This section looks at the use of water directly associated with
wholesale and retail operations. This will include water used for
cleaning (equipment, clothes and personal), catering/cooking
and washing of buildings and vehicles (based at sites) and
toilets.
What are the common issues with water within the
supply chain?
The two main issues surrounding water are availability and
quality. Only 0.5% of global water is available as freshwater for
human use, with 97% salt water, and 2.5% locked into glaciers &
ice (WCBSD 2009).
With a rapidly growing global population the availability of fresh
water is an increasing problem for many parts of the world.
Nearly half of Europe’s population live in areas defined as ‘water-
stressed’ (EEA, 2010).
For more information on the common issues, click here.
What are the key issues with water and wholesale
and retail?
Wholesale and retail are not significant users of water relative to
the whole supply chain, for more information click here.
Nonetheless, measures to reduce water use should be explored.
Perhaps the greatest direct water related threat to wholesale and
retail sites is due to risk of flooding, which can have a significant
impact on operations. For further information on flooding click
here.
Can water be measured?
The water used in wholesale and retail sites can be measured
through water metering. Awareness should also be raised of the
local impact of water consumption if the wholesale or retail site
is located in a water-stressed region. Facilities should also
consider the impact that effluent (waste water) will have on local
systems and networks.
What can be done to reduce the impact and what
are the opportunities?
There are a number of strategies to reduce the impact of water
in wholesale and retail:
• Sub-metering, monitoring and targeting, water mapping
• Identification and repair of leaks
• Provide plugs for sinks, fit percussion taps, dual and
waterless toilet facilities, ‘hippos’ in existing facilities
• Cleaning – Cleaning in Place (CIP) – water recirculation
• Recycle water in car and vehicle washing
• Capture rainwater and store for future use, known as rain
water harvesting
• Reduce run-off, to reduce the impact of heavy rain (and
snow) on local communities
• Use ponds to collect storm water
• Staff training to be mindful of water usage
A useful exercise is to conduct a water balance of a wholesale or
retail site to help identify all areas of consumption and assess
losses through leakage and evaporation which can be harder to
directly measure (see figure 3).
Identifying the risks, challenges and potential
pitfalls
The FISS Champions Group on Water report [opens PDF],
published in May 2007 identifies the following challenges for
industry:
• Lack of data to enable conclusive economic decisions
• Lack of resources, time and budget
• Uncertainty about financial benefits
• Product quality issues
• Safety and hygiene issues
• Lack of awareness of the technical feasibility of change
• Customers’ perceptions and potential risks associated with
change
• Fear of potential negative public relations associated with the
above
• Managing effluent as well as water into facilities
• Be aware of flood risk
Water and wholesale and retail
Figure 3: Diagram of a water mass balance
continues
page 1 of 2](https://image.slidesharecdn.com/21e034b0-2dcd-4b88-9663-4ebb36354e65-150715143437-lva1-app6891/85/Environmental_Sustainability_Matrix-4-28-320.jpg)
![BACK TO MATRIX To suggest amends/updates to content, email: Toby.Pickard@igd.com
Please give us feedback
A report produced by Ceres, UBS and Bloomberg, called MURKY
WATERS? Corporate Reporting on Water Risk: A Benchmarking
Study of 100 Companies, 2010 [opens PDF], concludes that
most companies operating in water-intensive industries are
failing to provide investors with adequate information on the
water-related risks they face and in many cases have little idea
how their supply chains could be affected by water shortages.
Where to go for more information
• IGD: Guide to Understanding, Assessing and Managing Water
in Grocery Supply Chains
• WRAP: Water guides
• WRAP: Rippleffect
• Environmental permitting for discharges to surface water and
groundwater
• EA: Food and drink manufacturing industry environmental
management toolkit [opens PDF]
• EA: Water abstraction
• Regional licensing – England and Wales
• EU Water Framework Directive
• Aqueduct - Measuring and mapping water risk
• CEO Water Mandate
• CDP Water Disclosure
• Water Report Library section within igd.com
Relationships of water in wholesale and retail to
other points in the supply chain
The impact of water use in the wholesale and retail section of
the supply chain will be relatively low compared to other areas of
the chain. However, this doesn’t mean that attempts to reduce
water usage should not be implemented, as significant savings
can be made from relatively easy to implement initiatives, such
as rain water harvesting, staff training and by using more water
efficient machinery.
Water and wholesale and retail
back to matrix
page 2 of 2](https://image.slidesharecdn.com/21e034b0-2dcd-4b88-9663-4ebb36354e65-150715143437-lva1-app6891/85/Environmental_Sustainability_Matrix-4-29-320.jpg)

![BACK TO MATRIX To suggest amends/updates to content, email: Toby.Pickard@igd.com
Please give us feedback
Simple messages where consumers can make a direct impact
work best. For example 99% of the embedded water in a typical
laundry product is derived in the consumer washing phase
(Source: LCA of Ariel ‘actif a froid’ 2006), so filling machines and
using a short cycle is good advice.
In the case of other products, such as soft drinks, 97% of the
embedded water is from raw material (predominantly sugar)
production, so reducing waste and absolute consumption will
have an impact here. However bear in mind there may be trade
offs between reduced water stress that results from reduced
consumption of intensely irrigated products, and the loss of
income that would result within communities that have become
dependent on the crop.
Where to go for more information
• IGD: Guide to Understanding, Assessing and Managing Water
in Grocery Supply Chains
• Water Footprint Network
• WRAP: Down the drain [opens PDF]
• Aqueduct - Measuring and mapping water risk
• Worldwide Fund for Nature (WWF): Product water footprint
assessments: Practical application in corporate water
stewardship [opens PDF]
• WWF: Water footprinting: Identifying & addressing water risks
in the value chain [opens PDF]
• Waterwise
• Net Regs: Water discharge regulations
• Water Report Library section within igd.com
Relationships of water and end user and end of life
to other points in the supply chain
Consumers will use a significant amount of water compared to
other points of the supply chain. However, this is a complex area,
as there are challenges to water measurement, cost, time and
interpretation. These challenges could make it difficult to explain
to consumers how to reduce impact.
Water footprint labels have been discussed by academics and
Non Government Organisations as one way of informing
consumers about embedded water within product, and one
European food manufacturer has put a water label on their
product. However, a water label could be misleading if it only
indicates the volume of (embedded) water used in a product
lifecycle and not a measure of water scarcity.
Case studies
• Unilever: Canada: Educating consumers about water
conservation
Water and end user and end of life
back to matrix
page 2 of 2](https://image.slidesharecdn.com/21e034b0-2dcd-4b88-9663-4ebb36354e65-150715143437-lva1-app6891/85/Environmental_Sustainability_Matrix-4-31-320.jpg)

![BACK TO MATRIX To suggest amends/updates to content, email: Toby.Pickard@igd.com
Please give us feedback
End user perception of the issue
According to the Government Review of Waste Policy in England
2011 [opens PDF]: ‘Survey after survey shows that consumers
believe packaging is a big environmental problem.’ Given that
much food and grocery packaging is used and disposed of in
homes it is therefore unsurprising that industry finds itself under
pressure to reduce the amount of packaging used.
However, more often than not this consumer view is a
misconception. Packaging can make a positive impact on the
environment by protecting far more resources than it uses and
preventing far more waste than it generates. According to the
European Commission, packaging accounts for only 5% of waste
(equivalent to 17% of municipal waste) and just 2% of
greenhouse gas emissions in Europe.
Packaging
back to matrix
page 2 of 2](https://image.slidesharecdn.com/21e034b0-2dcd-4b88-9663-4ebb36354e65-150715143437-lva1-app6891/85/Environmental_Sustainability_Matrix-4-33-320.jpg)

![BACK TO MATRIX To suggest amends/updates to content, email: Toby.Pickard@igd.com
Please give us feedback
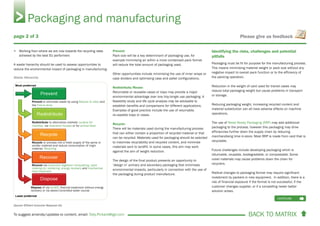
A waste hierarchy can be used to assess opportunities to reduce
the environmental impact of packaging. A waste hierarchy is
about waste management. It puts preventing waste at the top
and the rest of the options provide guidance on how to handle
waste.
Waste Hierarchy
(Source: Efficient Consumer Response UK)
Prevent:
Options include reducing the weight of transit cases, ordering
ingredients in larger volume formats, investing in bulk handling,
removing inefficient packaging from the process, specifying
packaging targets to suppliers.
Redistribute/Reuse:
Returnable or reusable packaging may provide a major
environmental advantage over one trip/single use packaging. A
feasibility study and life cycle analysis would establish benefits
and comparisons for different applications. Examples of good
practice include the use of returnable, re-useable trays or cases.
Recycle:
Materials used for packaging should be selected for fitness for
purpose, however maximising recyclability and recycled content
often helps minimise materials sent to landfill. In some cases,
this may lead to weight gain rather than reduction so expert
advice may be needed.
Identifying the risks, challenges and potential
pitfalls
• Balance is required when considering alternative materials;
understanding of the supply chain is required to make an
informed decision. For example, physical strength of transit
packaging may be reduced if it contains significant recycled
content
• Re-useable packaging is only feasible and environmentally
beneficial where the infrastructure is in place to transport it
back to source
• There is a lack of viable alternative packaging materials
• Infrastructure to manage/handle new or emerging materials
or systems, investment may be required
Where to go for more information
• Saving money by reducing waste - Waste minimisation
manual: a practical guide for farmers and growers [opens
PDF]
• Agricultural Waste Plastics
• Defra: Farm waste and recycling: Packaging waste
• Learning about agricultural waste
• Environment Agency: Agricultural waste guidance
• Defra guidance to applying the waste management hierarchy
• Defra Packaging Strategy
• ECR UK - Product & Packaging Waste
• Carbon Trust Carbon Footprint Calculator
Relationship of packaging and raw materials to
other points in the supply chain
The most efficient packaging for raw materials can impact
manufacturing efficiencies. Bulk materials may use less material
than small deliveries but investment in bulk handling equipment
may be necessary.
Packaging and raw materials
back to matrix
page 2 of 2
To suggest amends/updates to content, email: Toby.Pick
(Source: Efficient Consumer Response UK)
Prevent or eliminate waste by using Reduce to clear and
the Five-to-drive
Redistribute to alternative markets: surplus for
charities, via clearance houses or for animal feed
Recycle or process into a fresh supply of the same or
similar material and reduce consumption of virgin
material. Recycling
Recover via anaerobic digestion composting, used
cooking oil, rendering, energy recovery and mechanical
heat treatment
Dispose of via landfill, thermal treatment without energy
recovery or via sewer/controlled water course](https://image.slidesharecdn.com/21e034b0-2dcd-4b88-9663-4ebb36354e65-150715143437-lva1-app6891/85/Environmental_Sustainability_Matrix-4-35-320.jpg)


![BACK TO MATRIX To suggest amends/updates to content, email: Toby.Pickard@igd.com
Please give us feedback
Wholesalers/retailers and manufacturers can also maximise the
re-use of secondary/tertiary packaging (like the use of
re-useable trays for fresh products) and, where re-useable
packaging is not possible, recycle as much of the secondary and
tertiary packaging that is left on site as possible.
A waste hierarchy can be used to assess opportunities to reduce
the environmental impact of packaging.
Waste Hierarchy
(Source: Efficient Consumer Response UK)
Identifying the risks, challenges and potential
pitfalls
There are potential trade offs between the weight and recycled
content of the packaging material and product damage, shelf life
and product quality. For example, insufficient pallet wrapping
may lead to an increase in likelihood of load movement during
transportation and lightweighted packaging materials may
require more careful handling.
There are very few viable alternative secondary packaging
options. Card is widely used, is recyclable and will contain a
proportion of recycled material.
There may be specific store requirements related to case size and
delivery methods that result in extra packaging. As food and grocery
products typically travel from storage to depot to store by road.
Where to go for more information
• ECR UK - Product & Packaging Waste
• Defra Waste management hierarchy
• Defra Packaging Strategy
• WRAP UK Packaging Benchmark
• WRAP Packaging Research Listings [opens PDF]
• Envirowise Good Practice Guides and Case Studies
• Recoup Recyclability by Design
• Carbon Trust Carbon Footprint Calculator
Relationship of packaging from transport to other
points in the supply chain
The packaging used in the transportation of products must be fit
for purpose; it must protect the product during storage and be
appropriate for wholesalers/retailers to handle in store.
The key environmental sustainability issue associated with
transportation is likely to be its contribution of greenhouse gases
and particulates from moving the packaged goods, rather than
the goods themselves.
Packaging and transport
back to matrix
page 2 of 2
(Source: Efficient Consumer Response UK)
Identifying the risks, challenges and potential
pitfalls
Prevent or eliminate waste by using Reduce to clear and
the Five-to-drive
Redistribute to alternative markets: surplus for
charities, via clearance houses or for animal feed
Recycle or process into a fresh supply of the same or
similar material and reduce consumption of virgin
material. Recycling
Recover via anaerobic digestion composting, used
cooking oil, rendering, energy recovery and mechanical
heat treatment
Dispose of via landfill, thermal treatment without energy
recovery or via sewer/controlled water course](https://image.slidesharecdn.com/21e034b0-2dcd-4b88-9663-4ebb36354e65-150715143437-lva1-app6891/85/Environmental_Sustainability_Matrix-4-42-320.jpg)


![BACK TO MATRIX To suggest amends/updates to content, email: Toby.Pickard@igd.com
Please give us feedback
• Re-useable packaging is only feasible and environmentally
beneficial where the infrastructure is in place to transport
the re-useable packaging back to source, and that transport
doesn’t out-weigh the benefit of using single use packaging
• The space and cost of providing recycling infrastructure is a
challenge and requires industry investment. Some councils
offer recycling of certain types of plastics but there is a lack of
consistency across the UK. All types of plastic material can be
recycled but the facilities for collection and recycling for some
materials (e.g. plastic film) are insufficient at present therefore
much of this material continues to go to landfill
• There are potential trade offs between recyclability and shelf
life. For example, skinpacks are often used to increase shelf
life of red meats, but they are often less recyclable than the
trays that they replace. Similarly, thicker packaging to allow
use of a modified atmosphere will compromise weight
reduction
• Some novel materials may cause problems down the line for
recyclers, especially where some biomaterials are used,
either on their own or in combination with conventional
materials
Where to go for more information
• ECR UK - Product & Packaging Waste
• Defra waste management hierarchy
• Defra Packaging Strategy
• WRAP UK Packaging Benchmark
• WRAP Packaging Research Listings [opens PDF]
• Envirowise Good Practice Guides and Case Studies
• Recoup Recyclability by Design
• Carbon Trust Carbon Footprint Calculator
Relationship of packaging in wholesale and retail
to other points in the supply chain
The type of consumer product and how it is packaged in a
wholesaler or retail store is a key influencer of secondary and
tertiary packaging throughout the chain.
How a product is merchandised in store will also have an impact
on the packaging required, especially if it is merchandised in
pallet displays, in pre-packed shipper units and in Retail Ready
Packaging.
Case studies
• Asda - The Packaging Challenge
• Marks & Spencer and Closed Loop Recycling - Office
Recycling
Packaging and wholesale and retail
back to matrix
page 3 of 3](https://image.slidesharecdn.com/21e034b0-2dcd-4b88-9663-4ebb36354e65-150715143437-lva1-app6891/85/Environmental_Sustainability_Matrix-4-45-320.jpg)
![BACK TO MATRIX To suggest amends/updates to content, email: Toby.Pickard@igd.com
Please give us feedback
Description of packaging used in end user and end
of life
This cell focuses on packaging that is handled by shoppers and
in homes (primary packaging). This packaging performs many
functions: protecting the product, extending its life; and providing
consumer information.
After the product has been consumed the packaging enters the
‘end of life’ stage. The main focus of this stage of the chain is
about enhancing material and energy recovery.
What are the common issues with packaging
within the supply chain?
The EU Directive on packaging and packaging waste, which is
implemented in the UK through two laws: the Responsibility
Regulations (Packaging Waste) and the Packaging (Essential
Requirements) Regulations states that companies are by law
required to use only the minimum amount of packaging
necessary to comply with the necessary level of safety, hygiene
and acceptance for the packed product and for the consumer.
According to the Government Review of Waste Policy in England
2011 [opens PDF]: ‘Survey after survey shows that consumers
believe packaging is a big environmental problem.’ Due to this
industry is often put under pressure to reduce the amount of
packaging used. IGD’s research also finds that packaging is a
major concern for consumers. To find out more click here.
For more information about common issues, click here.
What are the issues with packaging and end user
and end of life?
The issue is minimising the environmental impact of packaging,
whilst keeping it fit-for purpose in terms of product protection
and as a communication medium.
Correct selection of packaging will maintain, or even enhance,
the quality and shelf life of many products. Poor selection can
easily compromise quality and shelf life, potentially leading to
product waste, which increases the environmental impact of the
product.
With packaging having such a tangible and visible aspect for the
consumer, there is often pressure on industry to reduce it. It is a
challenge to do this without compromising product protection or
product shelf life.
Customers are increasingly aware of and concerned about
recyclability of packaging. Packaging is often sited as the number
one concern of consumers when it comes to environmental
issues relating to the food and grocery industry. They are less
aware of the role packaging plays in protecting products and
preventing waste. Over recent years the amount of packaging
used by the industry has often been portrayed as excessive by
the media. The role it plays in protecting the product and
therefore reducing overall waste and environmental impact is
often overlooked.
Can packaging be measured?
Packaging can be measured by:
• Weight
• Recycled content
• Recyclability
• Carbon dioxide equivalent (CO2
e)
The simplest measure is the weight of the materials used, but for
this stage of the chain, it is important to link this to how easy it is
to recycle the packaging, and how readily available the recycling
facilities and collections are.
Statistics on recycling rates for some materials and formats can
be used, along with sales quantities, to calculate the weight of
packaging that is potentially recyclable.
The amount of secondary and/or tertiary packaging recycled or
disposed of at wholesale/retail sites can be measured as can
the amount of packaging that consumers choose to recycle at
retail sites.
Regular reports are made by the various UK governments on
household recycling rates, as well as surveys by bodies such as
WRAP.
Through the development of voluntary agreements such as
Courtauld Commitment, signatories have started to measure
more closely the use of raw material, weights, recycled content
and what is practically recyclable and recycled. More recently,
with the advent of Courtauld Commitment Phase 2, the element
of carbon dioxide equivalent (CO2
e) has been added as a specific
target for reduction.
Packaging and end user and end of life
continues
page 1 of 3](https://image.slidesharecdn.com/21e034b0-2dcd-4b88-9663-4ebb36354e65-150715143437-lva1-app6891/85/Environmental_Sustainability_Matrix-4-46-320.jpg)

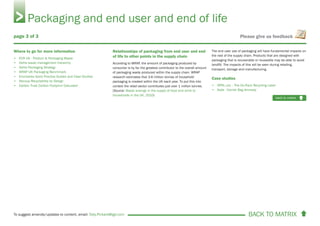
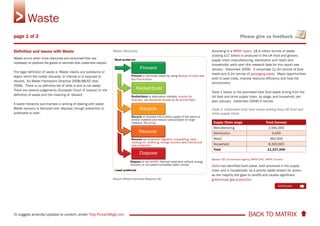
![BACK TO MATRIX To suggest amends/updates to content, email: Toby.Pickard@igd.com
Please give us feedback
Food waste disposed of in landfill produces methane as it
decomposes which is released into the environment. Methane
has a negative impact on the environment as it has 25 times
more Global Warming Potential than carbon dioxide.
With the cost of landfill increasing and natural resources
becoming more expensive, waste is increasingly seen as a major
cost.
There is a negative impact on the environment of producing,
transporting and disposing of food that is wasted. For example,
20 million tonnes of carbon dioxide equivalent ( CO2
e) emissions
are created and 6.2 billion cubic litres of water are used to
produce food wasted by UK households that could have been
eaten every year; this equals 3% of the UK’s domestic
greenhouse gas emissions and 6% of its global water footprint.
(Source: Defra, Government Review of Waste Policy in England
2011 [opens PDF]).
Waste
back to matrix
page 2 of 2](https://image.slidesharecdn.com/21e034b0-2dcd-4b88-9663-4ebb36354e65-150715143437-lva1-app6891/85/Environmental_Sustainability_Matrix-4-50-320.jpg)
![BACK TO MATRIX To suggest amends/updates to content, email: Toby.Pickard@igd.com
Please give us feedback
Description of waste generated from raw materials
Waste that occurs from agricultural raw materials is mainly crop
off cuts, such as straw and husks, crops that cannot be sold and
animal waste. Waste from raw materials used to produce non-
food grocery items (e.g. toilet tissue) varies.
What are the common issues with waste within the
supply chain?
• Defra has identified food waste, both produced in the supply
chain and in households, as a priority waste stream for
action, as considerable quantities still go to landfill and
causes significant greenhouse gas production
• There is a negative impact on the environment of producing,
transporting and disposing of food that is wasted. For
example, 20 million tonnes of carbon dioxide equivalent
(CO2
e) emissions are created and 6.2 billion cubic litres of
water are used to produce food wasted by UK households
that could have been eaten every year; this equals 3% of the
UK’s domestic greenhouse gas emissions and 6% of its
global water footprint (Source: Defra, Government Review of
Waste Policy in England 2011 [opens PDF])
For more information on the common issues click here.
What are the key issues with waste in raw
materials?
• Environmental Permitting Regulations can be quite onerous
and time consuming for those only undertaking small waste
management operations for their own waste
• A lack of waste treatment facilities other than landfill can
make it difficult to manage waste
Can waste be measured?
Waste can be measured by the following means:
• Weight or volume of waste produced
• Cost of waste treatment or disposal
• Carbon dioxide equivalent (CO2
e)
• Savings made on reduced raw materials costs
What can be done to reduce the impact and what
are the opportunities?
A waste hierarchy can be used to assess opportunities to reduce
the environmental impact of waste at the raw material stage.
Waste Hierarchy
(Source: Efficient Consumer Response UK)
Waste and raw materials
continues
page 1 of 2
Prevent or eliminate waste by using Reduce to clear and
the Five-to-drive
Redistribute to alternative markets: surplus for
charities, via clearance houses or for animal feed
Recycle or process into a fresh supply of the same or
similar material and reduce consumption of virgin
material. Recycling
Recover via anaerobic digestion composting, used
cooking oil, rendering, energy recovery and mechanical
heat treatment
Dispose of via landfill, thermal treatment without energy
recovery or via sewer/controlled water course](https://image.slidesharecdn.com/21e034b0-2dcd-4b88-9663-4ebb36354e65-150715143437-lva1-app6891/85/Environmental_Sustainability_Matrix-4-51-320.jpg)
![BACK TO MATRIX To suggest amends/updates to content, email: Toby.Pickard@igd.com
Please give us feedback
Description of waste generated from
manufacturing
Manufacturing includes the processing and packaging of raw
materials and ingredients to produce either ingredients for
further processing, or finished products for distribution and sale.
Waste of varying types and quantities is produced at virtually all
stages of manufacturing processes. These wastes can take a
variety of forms including waste raw materials and ingredients,
packaging, part or fully processed product and packaging,
general mixed waste, as well as hazardous wastes (e.g.
fluorescent tubes, waste oils, used spill kits, batteries, WEEE
Directive and chemicals). Some food wastes will also come
under the Animal By Products Regulation and these wastes must
be treated separately from other waste streams.
What are the common issues with waste within the
supply chain?
• Defra has identified food waste, both produced in the supply
chain and in households, as a priority waste stream for
action, as considerable quantities still go to landfill and
causes significant greenhouse gas production
• There is a negative impact on the environment of producing,
transporting and disposing of food that is wasted. For
example, 20 million tonnes of carbon dioxide equivalent
(CO2
e) emissions are created and 6.2 billion cubic litres of
water are used to produce food wasted by UK households
that could have been eaten every year; this equals 3% of the
UK’s domestic greenhouse gas emissions and 6% of its
global water footprint (Source: Defra, Government Review of
Waste Policy in England 2011 [opens PDF])
For more information on the common issues click here.
What are the key issues with waste in
manufacturing?
• According to Defra, a significant opportunity exists to prevent
this waste, estimated to cost businesses £5billion annually.
(Source: Government Review of Waste Policy in England
2011 [opens PDF])
• Current levels of provision and high costs of food waste
collection services continue to be a barrier to SMEs diverting
their food waste from landfill. (Source: Government Review of
Waste Policy in England 2011 [opens PDF])
• Difficulties in making use of certain wastes, such as a lack of
recycling infrastructure, makes disposal to landfill seem a
simpler option
• All waste is originally something that was initially purchased
by the organisation and for a variety of reasons has been
disgarded. Some of this waste will be due to an inefficient
use of resources through poor planning; inefficient
processing etc.
Can waste be measured?
Waste can be measured by the following means:
• Weight or volume of waste produced
• Cost of waste treatment or disposal
• Carbon dioxide equivalent (CO2
e)
• Savings made on reduced raw materials costs
All waste can be measured by weight. If it is not possible to
measure directly as it is produced, the total weight removed from
a site should be provided by the waste service provider.
Ideally waste should be measured at source and by material
type. This enables a better understanding of the true cost of the
waste and the efficiency of the manufacturing process.
When assessing the true cost of waste it is important to account
for a number of hidden costs. The disposal cost is usually just
the tip of the iceberg and for food manufacturers may be only
10-20% of the total cost.
Illustration of the true cost of disposal
Waste and manufacturing
continues
page 1 of 3](https://image.slidesharecdn.com/21e034b0-2dcd-4b88-9663-4ebb36354e65-150715143437-lva1-app6891/85/Environmental_Sustainability_Matrix-4-53-320.jpg)

![BACK TO MATRIX To suggest amends/updates to content, email: Toby.Pickard@igd.com
Please give us feedback
Initial attempts to divert waste from landfill to reduce
environmental impacts can lead to increased haulage of waste,
so offsetting some of the environmental advantages of diversion
from landfill.
Revenues received from recycling materials can divert attention
away from the ultimate aim of waste elimination.
Where to go for more information
• ECR UK - Supply Chain Waste Prevention guide
• Defra – Waste & Recycling
• WRAP
• Netregs food waste legal guidance web tool
• Defra Waste Review
• Environmental Permitting Regulations
• Landfill Allowance Trading Scheme
• EU Landfill Directive
Relationships of waste from manufacturing to
other points in the supply chain
According to WRAP, although much has been done to drive down
waste in this area, manufacturing is considered the area of
greatest opportunity for resource efficiency outside the home
(even with a high level of unavoidable waste). For example, in
some cases ‘waste allowances’ (aka shrinkage rates) remain
unchallenged by companies as they are embedded into existing
budgets. From observation, such waste allowances can
contribute significantly to the overall amount of waste. Recent
reviews in some food and drink manufacturing plants indicate
that around 16% of raw materials were wasted on a mass
balance basis. (Source: WRAP, Waste Reviews undertaken by
Oakdene Hollins [opens PDF])
Case studies
• Kraft Foods – Waste Prevention
• Alara Wholefoods - 80% Recycling Rate
• Kraft Foods - Zero waste to landfill
• Nestlé and FareShare 1st - Waste Reduction
• Nestlé fuels factories with coffee ground
• Brakes - Getting in Control of Waste; by Weight
• Müller Dairy - Managing food surpluses responsibly
• Robert Wiseman Dairies: Zero Waste to Landfill
• Unilever - Reducing waste through innovative design
Waste and manufacturing
back to matrix
page 3 of 3](https://image.slidesharecdn.com/21e034b0-2dcd-4b88-9663-4ebb36354e65-150715143437-lva1-app6891/85/Environmental_Sustainability_Matrix-4-55-320.jpg)
![BACK TO MATRIX To suggest amends/updates to content, email: Toby.Pickard@igd.com
Please give us feedback
Description of waste generated from storage
This cell focuses on waste within the storage element of the
supply chain. The storage of product will occur throughout the
supply chain.
What are the common issues with waste within the
supply chain?
• Defra has identified food waste, both produced in the supply
chain and in households, as a priority waste stream for
action, as considerable quantities still go to landfill and
causes significant greenhouse gas production
• There is a negative impact on the environment of producing,
transporting and disposing of food that is wasted. For
example, 20 million tonnes of carbon dioxide equivalent
(CO2
e) emissions are created and 6.2 billion cubic litres of
water are used to produce food wasted by UK households
that could have been eaten every year; this equals 3% of the
UK’s domestic greenhouse gas emissions and 6% of its
global water footprint (Source: Defra, Government Review of
Waste Policy in England 2011 [opens PDF])
For more information on the common issues click here.
What are the key issues with waste and storage?
According to WRAP, the estimated total transportation food and
non-packaging waste, which includes storage waste, arising from
the UK food and drink supply chain, and household, per year
(January - December 2009) is 13,000 tonnes.
Waste from storage will predominately arise from poor handling
and storing of product.
It is important to focus both on waste management within your
business and prevention of waste being produced in the first
place.
Can waste be measured?
Waste can be measured by the following means:
• Weight or volume of waste produced
• Cost of waste treatment or disposal
• Carbon dioxide equivalent (CO2
e)
• Savings made on reduced raw materials costs
The simplest method for measuring waste is by weight, normally
in tonnes. Waste contractors will be able to provide this
information and will often provide details of energy produced
from sending waste to alternative disposal routes.
Many companies have systems in place to measure the quantity
in units or value of stock written off due to problems such as
damaged product and/or out of date. This is useful when
targeting waste elimination within the business.
What can be done to reduce the impact and what
are the opportunities?
It is important to manage waste up the waste hierarchy moving
waste away from landfill into energy recovery, recycling,
re-distribution (reduced to clear or donation to charity/animal
feed) with the most important work being in waste prevention.
See the waste hierarchy for further information.
Waste Hierarchy
(Source: Efficient Consumer Response UK)
Waste and storage
continues
page 1 of 2
Prevent or eliminate waste by using Reduce to clear and
the Five-to-drive
Redistribute to alternative markets: surplus for
charities, via clearance houses or for animal feed
Recycle or process into a fresh supply of the same or
similar material and reduce consumption of virgin
material. Recycling
Recover via anaerobic digestion composting, used
cooking oil, rendering, energy recovery and mechanical
heat treatment
Dispose of via landfill, thermal treatment without energy
recovery or via sewer/controlled water course](https://image.slidesharecdn.com/21e034b0-2dcd-4b88-9663-4ebb36354e65-150715143437-lva1-app6891/85/Environmental_Sustainability_Matrix-4-56-320.jpg)

![BACK TO MATRIX To suggest amends/updates to content, email: Toby.Pickard@igd.com
Please give us feedback
Description of waste generated from transport
The focus of this cell is the environmental impact of waste in the
transportation of goods from storage to the wholesaler and/or
retailer.
What are the common issues with waste within the
supply chain?
• Defra has identified food waste, both produced in the supply
chain and in households, as a priority waste stream for
action, as considerable quantities still go to landfill and
causes significant greenhouse gas production
• There is a negative impact on the environment of producing,
transporting and disposing of food that is wasted. For
example, 20 million tonnes of carbon dioxide equivalent
(CO2
e) emissions are created and 6.2 billion cubic litres of
water are used to produce food wasted by UK households
that could have been eaten every year; this equals 3% of the
UK’s domestic greenhouse gas emissions and 6% of its
global water footprint (Source: Defra, Government Review of
Waste Policy in England 2011 [opens PDF])
For more information on the common issues click here.
What are the key issues with waste in
transportation?
According to WRAP, the estimated total transportation food and
non-packaging waste, arising from the UK food and drink supply
chain, and household, per year (January - December 2009) is
13,000 tonnes.
Waste from transport will predominately arise from poor handling
and palletising/stacking of product.
Waste can often occur as a result of not ensuring temperature
controlled transport is set correctly or functioning.
Product can be damaged during transportation if it hasn’t been
properly strapped down to the vehicle.
Can waste be measured?
Waste can be measured by the following means:
• Weight or volume of waste produced
• Cost of waste treatment or disposal
• Carbon dioxide equivalent (CO2
e)
• Savings made on reduced raw materials costs
It is possible to measure the quantity of waste produced and its
impact on the environment. The simplest method for waste going
to disposal is to measure it by weight, normally in tonnes. Waste
contractors should be able to provide this information and will
often provide details of energy produced from sending waste to
alternative disposal routes.
Many companies also classify the quantity in units or value of
stock written off, due to problems such as damaged and out of
date product. This is useful when targeting waste elimination
within the business.
What can be done to reduce the impact and what
are the opportunities?
It is important to manage waste up the waste hierarchy moving
waste away from landfill into; energy recovery, recycling,
re-distribution (reduced to clear or donation to charity/animal
feed) with the most important work being in waste prevention.
The key to managing waste is to look at all waste streams and
apply the waste hierarchy.
Waste Hierarchy
(Source: Efficient Consumer Response UK)
Waste and transport
continues
page 1 of 2
Prevent or eliminate waste by using Reduce to clear and
the Five-to-drive
Redistribute to alternative markets: surplus for
charities, via clearance houses or for animal feed
Recycle or process into a fresh supply of the same or
similar material and reduce consumption of virgin
material. Recycling
Recover via anaerobic digestion composting, used
cooking oil, rendering, energy recovery and mechanical
heat treatment
Dispose of via landfill, thermal treatment without energy
recovery or via sewer/controlled water course](https://image.slidesharecdn.com/21e034b0-2dcd-4b88-9663-4ebb36354e65-150715143437-lva1-app6891/85/Environmental_Sustainability_Matrix-4-58-320.jpg)

![BACK TO MATRIX To suggest amends/updates to content, email: Toby.Pickard@igd.com
Please give us feedback
Description of waste generated from wholesale
and retail
This cell focuses on waste within the wholesale and retail area of
the supply chain. This waste predominately comes from out of
date products and damaged goods.
What are the common issues with waste within the
supply chain?
• Defra has identified food waste, both produced in the supply
chain and in households, as a priority waste stream for
action, as considerable quantities still go to landfill and
causes significant greenhouse gas production
• There is a negative impact on the environment of producing,
transporting and disposing of food that is wasted. For
example, 20 million tonnes of carbon dioxide equivalent
(CO2
e) emissions are created and 6.2 billion cubic litres of
water are used to produce food wasted by UK households
that could have been eaten every year; this equals 3% of the
UK’s domestic greenhouse gas emissions and 6% of its
global water footprint (Source: Defra, Government Review of
Waste Policy in England 2011 [opens PDF])
For more information on the common issues click here.
What are the key issues with waste and wholesale
and retail?
• Food and non-packaging waste from retail accounts for
approximately 418,000 tonnes per annum (Source WRAP)
• The majority of the waste in this section of the chain will come
from product that has passed its sell by date, damaged product
within store and poor stock management at back of store
• It is important to focus both on waste management within
business and prevention of waste in the first place
Can waste be measured?
Waste can be measured by the following means:
• Weight or volume of waste produced
• Cost of waste treatment or disposal
• Carbon dioxide equivalent (CO2
e)
• Savings made on reduced raw materials costs
The simplest method for waste going to disposal is to measure it
by weight, normally in tonnes. Waste contractors will be able to
provide this information and will often provide details of energy
produced from sending waste to alternative disposal routes.
Many companies classify the quantity in units or value of stock
written off due to problems such as damages, out of code and
reduced to clear. This is useful when targeting waste elimination
within the business.
What can be done to reduce the impact and what
are the opportunities?
It is important to manage waste up the waste hierarchy moving
waste away from landfill into; energy recovery, recycling,
re-distribution (reduced to clear or donation to charity/animal
feed) with the most important work being in waste prevention.
A waste hierarchy should be used to assess opportunities to
reduce the environmental impact of waste.
Waste Hierarchy
(Source: Efficient Consumer Response UK)
Waste and wholesale and retail
continues
page 1 of 2
Prevent or eliminate waste by using Reduce to clear and
the Five-to-drive
Redistribute to alternative markets: surplus for
charities, via clearance houses or for animal feed
Recycle or process into a fresh supply of the same or
similar material and reduce consumption of virgin
material. Recycling
Recover via anaerobic digestion composting, used
cooking oil, rendering, energy recovery and mechanical
heat treatment
Dispose of via landfill, thermal treatment without energy
recovery or via sewer/controlled water course](https://image.slidesharecdn.com/21e034b0-2dcd-4b88-9663-4ebb36354e65-150715143437-lva1-app6891/85/Environmental_Sustainability_Matrix-4-60-320.jpg)
![BACK TO MATRIX To suggest amends/updates to content, email: Toby.Pickard@igd.com
Please give us feedback
Description of waste generated from end user and
end of life
End user waste is the waste that the consumer produces. This
can be any material that is not used in the home. It includes
food and non-packaging materials.
What are the common issues with waste within the
supply chain?
• Defra has identified food waste, both produced in the supply
chain and in households, as a priority waste stream for
action, as considerable quantities still go to landfill and
causes significant greenhouse gas production
• There is a negative impact on the environment of producing,
transporting and disposing of food that is wasted. For
example, 20 million tonnes of carbon dioxide equivalent
(CO2
e) emissions are created and 6.2 billion cubic litres of
water are used to produce food wasted by UK households
that could have been eaten every year; this equals 3% of the
UK’s domestic greenhouse gas emissions and 6% of its
global water footprint (Source: Defra, Government Review of
Waste Policy in England 2011 [opens PDF])
For more information on the common issues click here.
What are the key issues with waste and end user
and end of life?
End users produce around 8.3 million tonnes of household food
waste each year, according to WRAP.
End user food and non-packaging waste is a complex mix of
materials that may or may not be segregated into different types.
Therefore, it is extremely difficult to achieve best practice in
collection and disposal.
Most of the food waste is avoidable and could have been eaten if
meals had been better planned, portion size better managed,
food stored correctly and leftovers reused. Less than a fifth of
food waste is truly unavoidable (e.g. bones, cores and peelings)
according to WRAP.
Food production uses a lot of natural resources, and the
proportion of product that is not consumed by end users will
result in an unnecessary use of finite natural resource, such as
embedded water and other raw materials along with the
unnecessary production of greenhouse gases.
Can waste be measured?
Waste can be measured by the following means:
• Weight or volume of waste produced
• Cost of waste treatment or disposal
• Carbon dioxide equivalent (CO2
e)
• Savings made on reduced raw materials costs
The physical amount of solid waste generated per annum can be
measured. Biodegradable municipal waste (food waste) that is
collected from the kerbside will be weighed when it enters
landfill sites. The tonnage of municipal waste disposed of into
landfill has actually decreased from 13.8 million tonnes in
2008/09 to 12.5 million tonnes in 2009/10. The proportion of
municipal waste sent to landfill has decreased year on year since
2000/01, with 46.9 per cent going to landfill in 2009/10.
(Source: Environment Agency)
Liquid waste may be more difficult to measure, due to liquids
being poured away at home. However, a WRAP report presents
the findings of a study in which householders recorded the
quantities of food and drink that they were disposing of down the
drain.
What can be done to reduce the impact and what
are the opportunities?
The key to managing waste is to look at all waste streams and
apply the waste hierarchy in priority order.
Waste Hierarchy
(Source: Efficient Consumer Response UK)
Waste and end user and end of life
continues
page 1 of 2
BACK TO MATRIX
(Source: Efficient Consumer Response UK)
continues
Prevent or eliminate waste by using Reduce to clear and
the Five-to-drive
Redistribute to alternative markets: surplus for
charities, via clearance houses or for animal feed
Recycle or process into a fresh supply of the same or
similar material and reduce consumption of virgin
material. Recycling
Recover via anaerobic digestion composting, used
cooking oil, rendering, energy recovery and mechanical
heat treatment
Dispose of via landfill, thermal treatment without energy
recovery or via sewer/controlled water course](https://image.slidesharecdn.com/21e034b0-2dcd-4b88-9663-4ebb36354e65-150715143437-lva1-app6891/85/Environmental_Sustainability_Matrix-4-62-320.jpg)


The document describes an environmental sustainability matrix created by IGD's Industry Sustainability Group to help food and grocery companies better understand sustainability issues across their supply chains. The matrix breaks down four key environmental topics - greenhouse gases, water, packaging, and waste - across each stage of the supply chain from raw materials to end of life. It provides definitions, issues, solutions, and links to further resources for each intersection. The goal is to improve understanding of sustainability challenges and opportunities among non-sustainability practitioners in the industry. Users can navigate the interactive PDF matrix to learn about specific topics and stages of the supply chain.


