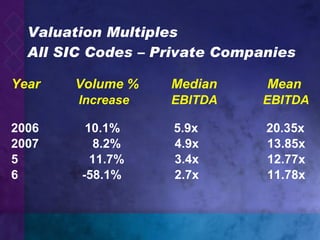
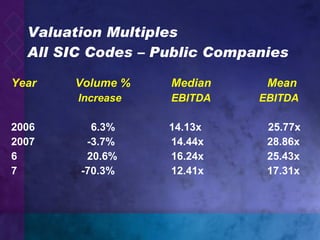
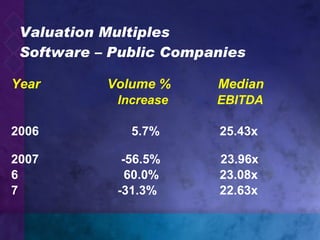
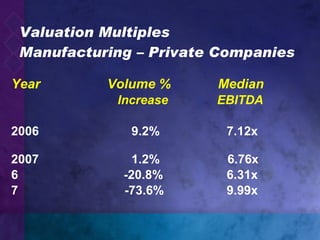
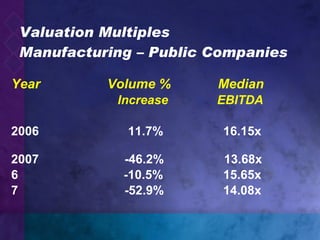
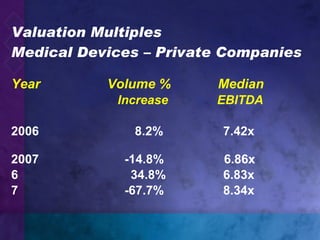
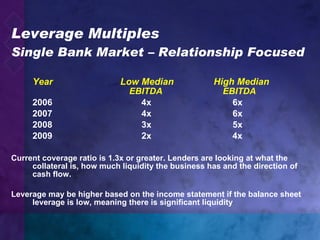
Enterprise Valuation Trends in Valuation Multiples Brad M. Cashion, CFA Managing Director The Mentor Group, Inc. Direct – 949-297-4094 Franz Fleischli, JD Managing Director The Mentor Group, Inc. Direct – 707-473-4747 February 4, 2010
Agenda Valuation Multiples – All SIC Codes Valuation Multiples - Software Valuation Multiples – Medical Device Valuation Multiples – Basic Manufacturing Lending / Debt Multiples
Valuation Multiples All SIC Codes – Private Companies Year Volume % Median Mean   Increase EBITDA   EBITDA 2006   10.1%   5.9x   20.35x 2007   8.2%  4.9x 13.85x   11.7%  3.4x 12.77x   -58.1%  2.7x 11.78x
Valuation Multiples All SIC Codes – Public Companies Year Volume % Median Mean   Increase EBITDA   EBITDA 2006   6.3%   14.13x   25.77x 2007   -3.7% 14.44x 28.86x   20.6% 16.24x 25.43x   -70.3% 12.41x 17.31x
Valuation Multiples Software – Private Companies Year Volume %   Median     Increase   EBITDA 2006     7.8%   16.53x   2007     -26.5%   8.89x   -11.1%   8.19x     -75.1%   6.81x
Valuation Multiples Software – Public Companies Year Volume %   Median     Increase   EBITDA 2006     5.7%   25.43x   2007     -56.5%   23.96x   60.0%   23.08x     -31.3%   22.63x
Valuation Multiples Manufacturing – Private Companies Year Volume %   Median     Increase   EBITDA 2006     9.2%   7.12x   2007     1.2%   6.76x   -20.8%   6.31x     -73.6%   9.99x
Valuation Multiples Manufacturing – Public Companies Year Volume %   Median     Increase   EBITDA 2006     11.7%   16.15x   2007     -46.2%   13.68x   -10.5%   15.65x     -52.9%   14.08x
Valuation Multiples Medical Devices – Private Companies Year Volume %   Median     Increase   EBITDA 2006     8.2%   7.42x   2007     -14.8%   6.86x   34.8%   6.83x     -67.7%   8.34x
Leverage Multiples Single Bank Market – Relationship Focused Year   Low Median   High Median   EBITDA     EBITDA 2006   4x   6x   2007   4x   6x 2008    3x   5x 2009     2x   4x Current coverage ratio is 1.3x or greater. Lenders are looking at what the collateral is, how much liquidity the business has and the direction of cash flow. Leverage may be higher based on the income statement if the balance sheet leverage is low, meaning there is significant liquidity

Enterprise Valuation -Trends in Valuation Multiples

  • 1.
    Enterprise Valuation Trendsin Valuation Multiples Brad M. Cashion, CFA Managing Director The Mentor Group, Inc. Direct – 949-297-4094 Franz Fleischli, JD Managing Director The Mentor Group, Inc. Direct – 707-473-4747 February 4, 2010
  • 2.
    Agenda Valuation Multiples– All SIC Codes Valuation Multiples - Software Valuation Multiples – Medical Device Valuation Multiples – Basic Manufacturing Lending / Debt Multiples
  • 3.
    Valuation Multiples AllSIC Codes – Private Companies Year Volume % Median Mean Increase EBITDA EBITDA 2006 10.1% 5.9x 20.35x 2007 8.2% 4.9x 13.85x 11.7% 3.4x 12.77x -58.1% 2.7x 11.78x
  • 4.
    Valuation Multiples AllSIC Codes – Public Companies Year Volume % Median Mean Increase EBITDA EBITDA 2006 6.3% 14.13x 25.77x 2007 -3.7% 14.44x 28.86x 20.6% 16.24x 25.43x -70.3% 12.41x 17.31x
  • 5.
    Valuation Multiples Software– Private Companies Year Volume % Median Increase EBITDA 2006 7.8% 16.53x 2007 -26.5% 8.89x -11.1% 8.19x -75.1% 6.81x
  • 6.
    Valuation Multiples Software– Public Companies Year Volume % Median Increase EBITDA 2006 5.7% 25.43x 2007 -56.5% 23.96x 60.0% 23.08x -31.3% 22.63x
  • 7.
    Valuation Multiples Manufacturing– Private Companies Year Volume % Median Increase EBITDA 2006 9.2% 7.12x 2007 1.2% 6.76x -20.8% 6.31x -73.6% 9.99x
  • 8.
    Valuation Multiples Manufacturing– Public Companies Year Volume % Median Increase EBITDA 2006 11.7% 16.15x 2007 -46.2% 13.68x -10.5% 15.65x -52.9% 14.08x
  • 9.
    Valuation Multiples MedicalDevices – Private Companies Year Volume % Median Increase EBITDA 2006 8.2% 7.42x 2007 -14.8% 6.86x 34.8% 6.83x -67.7% 8.34x
  • 10.
    Leverage Multiples SingleBank Market – Relationship Focused Year Low Median High Median EBITDA EBITDA 2006 4x 6x 2007 4x 6x 2008 3x 5x 2009 2x 4x Current coverage ratio is 1.3x or greater. Lenders are looking at what the collateral is, how much liquidity the business has and the direction of cash flow. Leverage may be higher based on the income statement if the balance sheet leverage is low, meaning there is significant liquidity