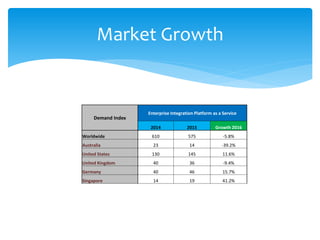
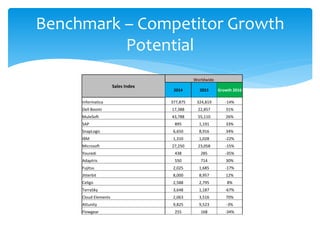
Enterprise Integration Platform as a Service
– Worldwide 2016
PM Ngoma
pm@ngoma.biz
February 2016
 Worldwide market growth rate will decline -5.8%
 Informatica is the clear market leader
 MuleSoft challenging with 26% growth potential
 Dell Boomi making strides with 31%
 SnapLogic the dark horse?
 What's happening with Microsoft?
The Year Ahead
 Market segmentation is still mandatory
 Hybrid integration platforms will gain importance
 Platform choice will continue to be lead by project
requirements and business need
 The role and contribution of the channel partner
should increase
 Complimentary functionality creates a convincing
enterprise story
Insights
Market Growth
Demand Index
Enterprise Integration Platform as a Service
2014 2015 Growth 2016
Worldwide 610 575 -5.8%
Australia 23 14 -39.2%
United States 130 145 11.6%
United Kingdom 40 36 -9.4%
Germany 40 46 15.7%
Singapore 14 19 41.2%
Benchmark – Informatica Digital
Acquisition (USA)
Benchmark (USA)
Referral Analysis UVs Per Month Ref Ratio
Domains I P Addresses Organic Paid Organic Paid
Informatica 1,500 1,400 44,000 2,900 0.066 1.000
0
10,000
20,000
30,000
40,000
50,000
2011 2012 2013 2014 2015 2016 Est 2017
Benchmark – Informatica UVs per
month (USA)
Benchmark – Competitor Growth
Potential
Sales Index
Worldwide
2014 2015 Growth 2016
Informatica 377,875 324,819 -14%
Dell Boomi 17,388 22,857 31%
MuleSoft 43,788 55,110 26%
SAP 895 1,191 33%
SnapLogic 6,650 8,916 34%
IBM 1,310 1,028 -22%
Microsoft 27,250 23,058 -15%
Youredi 438 285 -35%
Adaptris 550 714 30%
Fujitsu 2,025 1,685 -17%
Jitterbit 8,000 8,957 12%
Celigo 2,588 2,795 8%
TerraSky 3,648 1,187 -67%
Cloud Elements 2,063 3,516 70%
Attunity 9,825 9,523 -3%
Flowgear 255 168 -34%

Enterprise Integration Platform as a Service- Worldwide 2016

  • 1.
    Enterprise Integration Platformas a Service – Worldwide 2016 PM Ngoma pm@ngoma.biz February 2016
  • 2.
     Worldwide marketgrowth rate will decline -5.8%  Informatica is the clear market leader  MuleSoft challenging with 26% growth potential  Dell Boomi making strides with 31%  SnapLogic the dark horse?  What's happening with Microsoft? The Year Ahead
  • 3.
     Market segmentationis still mandatory  Hybrid integration platforms will gain importance  Platform choice will continue to be lead by project requirements and business need  The role and contribution of the channel partner should increase  Complimentary functionality creates a convincing enterprise story Insights
  • 4.
    Market Growth Demand Index EnterpriseIntegration Platform as a Service 2014 2015 Growth 2016 Worldwide 610 575 -5.8% Australia 23 14 -39.2% United States 130 145 11.6% United Kingdom 40 36 -9.4% Germany 40 46 15.7% Singapore 14 19 41.2%
  • 5.
    Benchmark – InformaticaDigital Acquisition (USA) Benchmark (USA) Referral Analysis UVs Per Month Ref Ratio Domains I P Addresses Organic Paid Organic Paid Informatica 1,500 1,400 44,000 2,900 0.066 1.000
  • 6.
    0 10,000 20,000 30,000 40,000 50,000 2011 2012 20132014 2015 2016 Est 2017 Benchmark – Informatica UVs per month (USA)
  • 7.
    Benchmark – CompetitorGrowth Potential Sales Index Worldwide 2014 2015 Growth 2016 Informatica 377,875 324,819 -14% Dell Boomi 17,388 22,857 31% MuleSoft 43,788 55,110 26% SAP 895 1,191 33% SnapLogic 6,650 8,916 34% IBM 1,310 1,028 -22% Microsoft 27,250 23,058 -15% Youredi 438 285 -35% Adaptris 550 714 30% Fujitsu 2,025 1,685 -17% Jitterbit 8,000 8,957 12% Celigo 2,588 2,795 8% TerraSky 3,648 1,187 -67% Cloud Elements 2,063 3,516 70% Attunity 9,825 9,523 -3% Flowgear 255 168 -34%