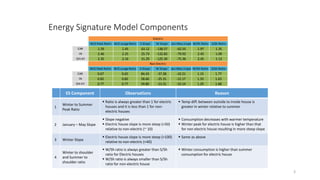
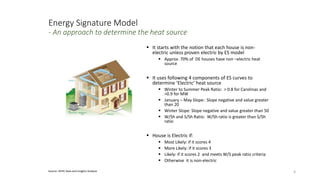
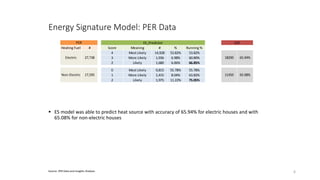
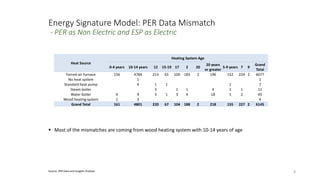
Energy Signature Model
Energy Signature
- Classic Energy Consumption Chart by Month
2Source: HEHC Data and Insights Analysis
 The classic energy signature curve for Electric house is shaped liked “W”
 Temperature difference between inside of the house and outside is more in the winter than summer resulting into
winter peak higher than summer peak
 The classic signature curve for non-electric house is shaped like “Ω”
 Non electric houses use electricity for cooling so consumption peaks in summer
 Winter consumption is relatively flatter compared to electric house; slight uptick in comparison to shoulder months
can be attributed to holiday seasons and higher electric use due to more darker days
 Same Energy Signature curves are observed by all the OpCos
3,018
1,146
1,897 1,888
1,214 1,255
2,023
39.89
79.24 78.31
59.62
51.06
JAN FEB MAR APR MAY JUN JUL AUG SEP OCT NOV DEC
Region:CAR; Heat: electric ; Summer: AC
AvgKWH AvgTemp
1,307
954
1,934 1,965
1,085
834
1,045
39.89
79.24 78.31
59.62
51.06
JAN FEB MAR APR MAY JUN JUL AUG SEP OCT NOV DEC
Region:CAR; Heat: non_electric ; Summer: AC
AvgKWH AvgTemp
Energy Signature Model Components
3
ES Component Observations Reason
1
Winter to Summer
Peak Ratio
 Ratio is always greater than 1 for electric
houses and it is less than 1 for non-
electric houses
 Temp diff. between outside to inside house is
greater in winter relative to summer
2 January – May Slope
 Slope negative
 Electric house slope is more steep (>50)
relative to non-electric (~ 10)
 Consumption decreases with warmer temperature
 Winter peak for electric house is higher than that
for non electric house resulting in more steep slope
3 Winter Slope
 Electric house slope is more steep (>100)
relative to non-electric (<40)
 Same as above
4
Winter to shoulder
and Summer to
shoulder ratio
 W/Sh ratio is always greater than S/Sh
ratio for Electric houses
 W/Sh ratio is always smaller than S/Sh
ratio for non-electric house
 Winter consumption is higher than summer
consumption for electric house
W/S Peak Ratio W/S usage Ratio S Slope W Slope Jan-May slope W/Sh Ratio S/Sh Ratio
CAR 1.59 1.45 63.12 -138.57 -62.55 1.97 1.35
IN 2.46 2.25 25.73 -132.83 -79.92 2.45 1.09
OH-KY 2.35 2.16 31.29 -125.39 -75.36 2.45 1.13
Electric
W/S Peak Ratio W/S usage Ratio S Slope W Slope Jan-May slope W/Sh Ratio S/Sh Ratio
CAR 0.67 0.65 84.43 -37.28 -10.21 1.15 1.77
IN 0.82 0.82 58.66 -25.31 -12.17 1.33 1.63
OH-KY 0.77 0.77 59.80 -23.31 -10.14 1.29 1.68
Non Electric
Energy Signature Model
- An approach to determine the heat source
4Source: HEHC Data and Insights Analysis
 It starts with the notion that each house is non-
electric unless proven electric by ES model
 Approx. 70% of DE houses have non –electric heat
source
 It uses following 4 components of ES curves to
determine ‘Electric’ heat source
 Winter to Summer Peak Ratio: > 0.8 for Carolinas and
>0.9 for MW
 January – May Slope: Slope negative and value greater
than 20
 Winter Slope: Slope negative and value greater than 50
 W/Sh and S/Sh Ratio: W/Sh ratio is greater than S/Sh
ratio
 House is Electric if:
 Most Likely: if it scores 4
 More Likely: if it scores 3
 Likely: if it scores 2 and meets W/S peak ratio criteria
 Otherwise it is non-electric
Energy Signature Model: HEHC Data
5
 ES model was able to predict heat source with accuracy of 94.35% for electric houses and with
81.57% for non-electric houses
 HEHC data is assumed to be most accurate as home audit is conducted by DE authorized person
Heating Fuel # Score Meaning # % Running %
4 Most Likely 1,408 85.49% 85.49%
3 More Likely 91 5.53% 91.01%
2 Likely 58 3.52% 94.54%
0 Most Likely 1,836 70.81% 70.81%
1 More Likely 240 9.26% 80.06%
2 Likely 235 9.06% 89.12%
ESP
1554 94.35%
2115 81.57%
ES_PredictorHEHC
Electric 1,647
Non-Electric 2,593
Energy Signature Model: PER Data
6Source: PER Data and Insights Analysis
 ES model was able to predict heat source with accuracy of 65.94% for electric houses and with
65.08% for non-electric houses
Heating Fuel # Score Meaning # % Running %
4 Most Likely 14,928 53.82% 53.82%
3 More Likely 1,936 6.98% 60.80%
2 Likely 1,680 6.06% 66.85%
0 Most Likely 9,815 55.78% 55.78%
1 More Likely 1,415 8.04% 63.82%
2 Likely 1,975 11.22% 75.05%
ESP
18290 65.94%
11450 65.08%
ES_PredictorPER
Electric 27,738
Non-Electric 17,595
Energy Signature Model: PER Data Mismatch
- PER as Electric and ESP as Non Electric
7
 Most of the mismatches are coming from standard heat pump with 10-14 years of age
Heat Source
Heating System Age
0-4 years 10-14 years 12 15-19 17 2 20
20 years or
greater
5-9 years 7 9 Grand Total
Electric baseboard or ceiling
cable
2 4 10 2 1 3 9 3 8 42
Forced air furnace 15 33 34 9 9 17 11 36 34 1 199
Ground source heat pump 5 2 1 1 1 1 11
Heat pump with gas backup 19 5 3 16 1 9 6 59
Heat pump with oil backup 3 3 1 2 2 11
Heat pump with propane backup 6 1 6 4 1 4 2 24
Radiant panels 1 18 8 1 9 4 5 1 47
Standard heat pump 29 8850 33 9 21 31 1 16 19 44 2 9055
Grand Total 80 8913 94 21 33 83 1 44 73 102 4 9448
Energy Signature Model: PER Data Mismatch
- PER as Non Electric and ESP as Electric
8
 Most of the mismatches are coming from wood heating system with 10-14 years of age
Heat Source
Heating System Age
0-4 years 10-14 years 12 15-19 17 2 20
20 years
or greater
5-9 years 7 9
Grand
Total
Forced air furnace 156 4784 213 65 100 183 2 196 152 224 2 6077
No heat system 1 1
Standard heat pump 4 1 1 1 7
Steam boiler 3 1 1 4 1 1 11
Water boiler 4 9 3 1 3 4 18 1 2 45
Wood heating system 1 3 4
Grand Total 161 4801 220 67 104 188 2 218 155 227 2 6145
Source: PER Data and Insights Analysis

Energy signature model

  • 1.
  • 2.
    Energy Signature - ClassicEnergy Consumption Chart by Month 2Source: HEHC Data and Insights Analysis  The classic energy signature curve for Electric house is shaped liked “W”  Temperature difference between inside of the house and outside is more in the winter than summer resulting into winter peak higher than summer peak  The classic signature curve for non-electric house is shaped like “Ω”  Non electric houses use electricity for cooling so consumption peaks in summer  Winter consumption is relatively flatter compared to electric house; slight uptick in comparison to shoulder months can be attributed to holiday seasons and higher electric use due to more darker days  Same Energy Signature curves are observed by all the OpCos 3,018 1,146 1,897 1,888 1,214 1,255 2,023 39.89 79.24 78.31 59.62 51.06 JAN FEB MAR APR MAY JUN JUL AUG SEP OCT NOV DEC Region:CAR; Heat: electric ; Summer: AC AvgKWH AvgTemp 1,307 954 1,934 1,965 1,085 834 1,045 39.89 79.24 78.31 59.62 51.06 JAN FEB MAR APR MAY JUN JUL AUG SEP OCT NOV DEC Region:CAR; Heat: non_electric ; Summer: AC AvgKWH AvgTemp
  • 3.
    Energy Signature ModelComponents 3 ES Component Observations Reason 1 Winter to Summer Peak Ratio  Ratio is always greater than 1 for electric houses and it is less than 1 for non- electric houses  Temp diff. between outside to inside house is greater in winter relative to summer 2 January – May Slope  Slope negative  Electric house slope is more steep (>50) relative to non-electric (~ 10)  Consumption decreases with warmer temperature  Winter peak for electric house is higher than that for non electric house resulting in more steep slope 3 Winter Slope  Electric house slope is more steep (>100) relative to non-electric (<40)  Same as above 4 Winter to shoulder and Summer to shoulder ratio  W/Sh ratio is always greater than S/Sh ratio for Electric houses  W/Sh ratio is always smaller than S/Sh ratio for non-electric house  Winter consumption is higher than summer consumption for electric house W/S Peak Ratio W/S usage Ratio S Slope W Slope Jan-May slope W/Sh Ratio S/Sh Ratio CAR 1.59 1.45 63.12 -138.57 -62.55 1.97 1.35 IN 2.46 2.25 25.73 -132.83 -79.92 2.45 1.09 OH-KY 2.35 2.16 31.29 -125.39 -75.36 2.45 1.13 Electric W/S Peak Ratio W/S usage Ratio S Slope W Slope Jan-May slope W/Sh Ratio S/Sh Ratio CAR 0.67 0.65 84.43 -37.28 -10.21 1.15 1.77 IN 0.82 0.82 58.66 -25.31 -12.17 1.33 1.63 OH-KY 0.77 0.77 59.80 -23.31 -10.14 1.29 1.68 Non Electric
  • 4.
    Energy Signature Model -An approach to determine the heat source 4Source: HEHC Data and Insights Analysis  It starts with the notion that each house is non- electric unless proven electric by ES model  Approx. 70% of DE houses have non –electric heat source  It uses following 4 components of ES curves to determine ‘Electric’ heat source  Winter to Summer Peak Ratio: > 0.8 for Carolinas and >0.9 for MW  January – May Slope: Slope negative and value greater than 20  Winter Slope: Slope negative and value greater than 50  W/Sh and S/Sh Ratio: W/Sh ratio is greater than S/Sh ratio  House is Electric if:  Most Likely: if it scores 4  More Likely: if it scores 3  Likely: if it scores 2 and meets W/S peak ratio criteria  Otherwise it is non-electric
  • 5.
    Energy Signature Model:HEHC Data 5  ES model was able to predict heat source with accuracy of 94.35% for electric houses and with 81.57% for non-electric houses  HEHC data is assumed to be most accurate as home audit is conducted by DE authorized person Heating Fuel # Score Meaning # % Running % 4 Most Likely 1,408 85.49% 85.49% 3 More Likely 91 5.53% 91.01% 2 Likely 58 3.52% 94.54% 0 Most Likely 1,836 70.81% 70.81% 1 More Likely 240 9.26% 80.06% 2 Likely 235 9.06% 89.12% ESP 1554 94.35% 2115 81.57% ES_PredictorHEHC Electric 1,647 Non-Electric 2,593
  • 6.
    Energy Signature Model:PER Data 6Source: PER Data and Insights Analysis  ES model was able to predict heat source with accuracy of 65.94% for electric houses and with 65.08% for non-electric houses Heating Fuel # Score Meaning # % Running % 4 Most Likely 14,928 53.82% 53.82% 3 More Likely 1,936 6.98% 60.80% 2 Likely 1,680 6.06% 66.85% 0 Most Likely 9,815 55.78% 55.78% 1 More Likely 1,415 8.04% 63.82% 2 Likely 1,975 11.22% 75.05% ESP 18290 65.94% 11450 65.08% ES_PredictorPER Electric 27,738 Non-Electric 17,595
  • 7.
    Energy Signature Model:PER Data Mismatch - PER as Electric and ESP as Non Electric 7  Most of the mismatches are coming from standard heat pump with 10-14 years of age Heat Source Heating System Age 0-4 years 10-14 years 12 15-19 17 2 20 20 years or greater 5-9 years 7 9 Grand Total Electric baseboard or ceiling cable 2 4 10 2 1 3 9 3 8 42 Forced air furnace 15 33 34 9 9 17 11 36 34 1 199 Ground source heat pump 5 2 1 1 1 1 11 Heat pump with gas backup 19 5 3 16 1 9 6 59 Heat pump with oil backup 3 3 1 2 2 11 Heat pump with propane backup 6 1 6 4 1 4 2 24 Radiant panels 1 18 8 1 9 4 5 1 47 Standard heat pump 29 8850 33 9 21 31 1 16 19 44 2 9055 Grand Total 80 8913 94 21 33 83 1 44 73 102 4 9448
  • 8.
    Energy Signature Model:PER Data Mismatch - PER as Non Electric and ESP as Electric 8  Most of the mismatches are coming from wood heating system with 10-14 years of age Heat Source Heating System Age 0-4 years 10-14 years 12 15-19 17 2 20 20 years or greater 5-9 years 7 9 Grand Total Forced air furnace 156 4784 213 65 100 183 2 196 152 224 2 6077 No heat system 1 1 Standard heat pump 4 1 1 1 7 Steam boiler 3 1 1 4 1 1 11 Water boiler 4 9 3 1 3 4 18 1 2 45 Wood heating system 1 3 4 Grand Total 161 4801 220 67 104 188 2 218 155 227 2 6145 Source: PER Data and Insights Analysis