Download to read offline
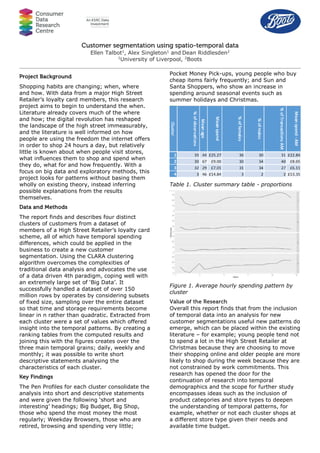

This document summarizes a research project that used loyalty card data from a major UK retailer to cluster customers into groups based on their spending patterns over time. The researchers identified four distinct customer clusters: 1) "Big Budget" customers who spend the most money most regularly, 2) "Weekday Browsers" who are retired and spend little, 3) "Pocket Money Pick-ups" who are young people buying inexpensive items frequently, and 4) "Sun and Santa Shoppers" who increase spending around holidays. The clustering method was able to effectively handle a dataset of over 150 million rows. Analyzing customers' temporal spending patterns revealed insights that could be used to improve customer segmentation.


