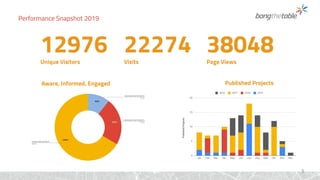
Site Review and Benchmarking Report
Bang the Table, Live Demo
August 2019
1
SAMPLE
Table of Contents
Site Details 3
Snapshot 7
Site Trends and Observations 9
Project Trends and Observations 20
Participation Trends and Observations 28
Key Recommendations 34
2
SAMPLE
Organisation: Bang the Table
Site URL: livedemo.engagementhq.com
eHQ Annual License: eHQ (unlimited projects)
Included Admins 3 Site Admins, 10 Project Admins
Add-ons N/A
eIQ Support Package: eIQ Partner Package
Site Theme: Bondi
Premium SSL: Yes
Site Contracted Until: 4 August, 2020
Site Launch Date: 17 October 2016
Report Period January 1 - May 6, 2019
Site Information
3
SAMPLE
Active Site Admins
Name: UN: Email: Last Login:
Nathan Connors Nathan nathan@bangthetable.com 18 Apr, 2019
Bob Uruncle Bob99 nathan@bangthetable.com 12 Dec, 2016
Harry McKierny HarryMC nathan@bangthetable.com 17 Jan, 2019
4
Performance Snapshot 2019
Aware, Informed, Engaged
38048Page Views
Published Projects
12976Unique Visitors
22274Visits
5
Site Trends and Observations
6
Homepage Observations
● The Bondi theme continues to be used as the homepage layout for
Live Demo. There is good use of the homepage description to call
participants to action and the quick links in the first card list provide
for a accessible way for participants to get involved.
● Homepage widgets are currently not being used on this page,
instead there are links at the bottom of the page to various Hub
Collections.
● Good use of imagery and relevant project images used on the
homepage.
Recommendations:
1. Consider utilising homepage widgets to bring forth news and
updates, frequently asked questions and key documents.
2. Utilise the Bondi theme’s auto assign feature for project listings.
These are based on project tags and allow you to setup a card list
with confidence newly launched projects will appear on your
homepage.
3. Embed EHQ’s new Project Finder into your corporate site to help
make EHQ projects more discoverable via categories, themes or
project status.
7
Project Page Observations
● Most project pages are typical of the page to the right, with little
branding devices to help stakeholders relate to the project or the
organisation/service running the consultation.
● There are no page banners or consistent page layouts to help
stakeholders navigate information and each project page appears to
be set up differently.
Recommendations:
1. Consider enabling project page banners to help bring project pages
to life. Add extra branding devices to individual project pages
allowing stakeholders to better relate to the projects being
consulted on.
2. Develop a project page template for use throughout the site. This
should organise widgets in a consistent way and provide
instructions for other site admins building new projects, on how to
correctly write a call to action, insert content and structure the page.
8
Sign-Up Form Observations
● The site registration form is cohesive and has useful questions to
help with audience segmentation.
● As seen in later sections of the report, the registration process for
the site has a very high completion rate, meaning most new
participants complete their registration.
Recommendations:
1. Ensure a periodic interrogation of the demographics report is
undertaken in order to keep track of your community segments and
identify opportunities for further participation.
2. Establish groups/segments in the database (PRM) to segment your
audiences based on the sign-up form questions.
3. Run regular campaigns focussed on building the database.
9
Published Projects YoY
● In 2019, more projects have been published than in the first half of
previous years. This activity indicates progress towards publishing
the most amount of projects in any given year.
● April and August has consistently been a month where new projects
are published.
● In 2018, 6 new projects were published representing the busiest
full-year activity.
Recommendations:
1. Continue to publish a broad-range of projects across the site.
Incorporate ways to extend the utilisation of Your Say to collect
community insights and feedback. See list of project ideas at the
end of this report.
2. Consider rolling engagement strategies such as discussion boards,
ideation activities and quizzes as a way to keep your activity current
and relevant to drive repeat visitation.
3. Develop a project schedule for the remaining part of 2019.
Figure 1. Comparison of projects published per month in 2019 compared with previous years.
10
Site Visitors
● In 2019 there has been 12976 unique site visitors to the Live Demo
site.
● For the first half of 2019 the daily unique visitors has consistently
been above the average site visitors from 2018 of 6.8 unique
visitors per day. This indicates there is an increased awareness and
interest in projects on the site.
● The return rate of unique visitors is 1.14 indicating that most
visitors have not returned to the site during the period.
● Unique visitors were likely to look at 2.3 pages per visit. This may
indicate that traffic to the site is focussed on specific consultations
and that very few visitors are discovering or browsing the site for
other consultations to take part in, and that majority of your
projects were protected.
Figure 2. Daily site visitors compared with average daily site visitors in 2018.
Total Page Views Total Unique Visitors Total Visits
38048 12976 22274
11
Site Visitors Peer Analysis
● A peer analysis has been done on a sample of similar organisations
using EngagementHQ.
● In 2019, the level of unique visitors on Live Demo regularly
exceeded the average unique visitors for a similar organisations. On
eight occasions the level of unique visitors exceeded the average
visitors to a federal department using EHQ.
● When compared to a regional council using EngagementHQ, Live
Demo achieved the average daily visitors benchmark on only one
occasion.
● Overall, this analysis indicates that when compared to similar
organisations engaging online using EngagementHQ, Live Demo is
regularly performing above the average of its peers.
Recommendations:
1. Continue to build a strong community database and drive
awareness of Live Demo through partner channels.
2. Ensure regular publishing on new projects and activities and
communicate new opportunities to stakeholders.
Figure 3. Daily site visitors compared with average daily site visitors of other similar sized eHQ
users.
12
Database Active Users
● The Live Demo database is a great example of an active and current
database.
● As can be seen in Figure 4., almost 93% of the database is active.
This indicates that registered participants are successfully
completing the registration process and authenticating their
accounts. This graph also suggests that uploaded participants have
successfully completed registration which, is important given there
are several protected staff focussed consultations on the site.
● There are only 22 pending activations as at May 6, 2019.
● There are currently 4776 users in the database.
Figure 4. Percentage of database with activated accounts vs accounts pending activation.
13
Database Imported Users
● Figure 5. shows the makeup of the Live Demo database. 299 active
users have been imported into EngagementHQ while 137 active
users have self-selected to register for the site.
● Only 4 users who were imported have failed to complete their
registration, while 18 self-select registrants are still to complete
their registration process.
● This information indicates that the Live Demo database is
overwhelmingly active and that registration for self-select
participants hasn’t appeared to be a barrier to participation.
Recommendations:
1. Continue to promote registration and make all engagement on the
site “registered participants only”.
2. Create a group of “Pending Activation” participants to keep track of
users who are not completing the registration process.
Figure 5. Comparison of imported active users vs self-registered active users.
14
Database Growth YoY
● When compared to 2018, the rate of database growth for the Live
Demo site is on track to achieve similar growth in 2019.
● There has only been 8 new registered users to May 6, 2019
compared to 49 new registered users for the whole year 2018.
● The graph indicates there was also two large imports of participants
in 2018 around this time last year.
Figure 6. Database growth in 2019 compared with 2018.
Total Database Size Registered users this
period
Registered users last
period
4776 8 49
15
Total Database Size Peer Analysis
● When compared to peer health organisations, Your Voice SESLHD
has the third largest database of the group.
● This graph shows the relationship between database size and
average daily visitors. It appears that for the health organisations
analysed, there is a direct correlation between level of unique
visitors and database size.
Figure 7. Database size compared to peer organisations.
16
Project Trends and Observations
17
Engagement Rate of Top projects
● When looking at the rates of engagement (leaving feedback as a
percentage of aware) the best performing projects in 2019 were the
Budget Consultation and Teachers Forum. While these projects
received the highest rate of engagement, the number of
contributions was quite low (see over page).
● Of the top projects by engagement rate, 5 projects exceeded the
peer group average engagement rate of 27%.
● Both the peer group and Live Demo exceeded the average
engagement rate for all projects launched on EngagementHQ.
● These levels of engagement suggest that stakeholders and
participants who visit projects on Live Demo likely to leave a
contribution.
● Of the top projects by engagement rate, two were protected
projects. These were the Parking Strategy and the Pricing
Submission Plan.
Figure 8. Top projects by engagement rate showing EHQ average engagement rate and
average engagement for peer group.
18
Top Projects 2019
● The Tram Stop Upgrade has received the most engaged contributions
in 2019. This project features a series of surveys related to localised
tram stop locations in order to capture commuter travel information
as well as post-travel surveys. There is also two places maps which
has been used to show proposed upgrades and seek comment. This
project demonstrates a good utilisation of EngagementHQ for
capturing information in relation to the running of a health related
course/program.
● The second best performing project in terms of engagement is the
Teachers Forum. This project appears to facilitate surveying and
discussion between teachers and students. It has consistently been a
top performing project since it was first launched.
● The third best performing project in 2019 has been the Masterplan
project. This project features a expression of interest surveys for
community to register to take part in a consumer engagement
workshop. It is a good example of using EngagementHQ surveys as an
EOI form.
● Of the other top projects in 2019 by engaged contributions, very few
responses have been captured.
● There appears to be very few projects directly targeting broad-based
engagement with community and stakeholders.
Figure 9.0 Top projects by number of engaged participants.
19
Top Projects All Time
● There are some clear performance categories
for all time top projects. The Tram Stop upgrade
was a clear outlier with more than 500 unique
pieces of feedback. The next 4 top projects all
received between 50 and 100 responses.
● The majority of top projects have received
between 10 and 50 responses with only one
project receiving less than 10 overall responses.
● This top projects graph indicates that a more
than 500 responses is a good benchmark for a
top performing project, while contributions in
the range of 10-100 responses could be
considered good overall engagement.
Figure 10. All time top projects by number of engaged contributions.
20
Top Projects By Informed and Aware Contributions
Figure 11. Top projects by number of informed participants. Figure 12 Top projects by number of aware participants.
21
Aware, Informed, Engage for Top Projects
● This graph shows the Aware, Informed and Engaged metrics for top
projects in 2019.
● Overall there is very little engagement across projects for 2019 with
the exception of the Tram Stop Upgrades, Teachers Forum and
Masterplan.
● The graph does indicate that three published projects are still
registering Aware and Informed contributions even though there are
no current opportunities for engagement enabled. These are the
Budgeting Consultation and Parking Strategy projects. Visitors to
the site are still viewing these projects and clicking to find out more
information but there are currently no opportunities for
engagement of those projects.
Recommendations:
1. Old projects should be archived if they are complete. Consider
opening up projects with a high awareness to new conversations.
Question and Answer tool is often a useful way to do this.
2. Develop a digital engagement strategy for Live Demo to provide a
better defined schedule of engagement and more diversity of
engagement topics/projects. Figure 13. Top projects in 2019 showing Aware, Informed and Engaged.
22
Which Tools Captured Engagement
● Surveys have been predominantly used to capture engaged
contributions in 2019, accounting for 196 engaged contributions
across the site. This includes 124 survey responses for the Tram
Stop Upgrades project alone.
● Three contributions have been made via the stories tool which
appear to be test stories on projects in draft status, including
Community Landscape Strategy and Development Application
Program.
Recommendations:
1. Use a mix of tools and map them to each projects methodology or
approach. Ensure a project plan is created for each project and
2. Develop a digital engagement strategy for Live Demo to provide a
better defined schedule of engagement and more diversity of
engagement topics/projects.
Figure 14. Mix of engagement tools used to capture engaged contributions in 2019.
23
All-time Tool Performance
● Since site launch in 2016, the Survey tool has consistently been the
tool of choice for Live Demo. This tool has been used on 71
occasions to capture 1220 submissions from stakeholders. This is a
controlled environment tool which means participants are not
aware of the outcomes of engagement and contributions from
other participants unless they are reported back by the
organisation.
● Other tools which have been used with moderate success include
the Forum and Quick Poll tools accounting for a combined 168
engaged contributions.
● Least utilised tools have been Places, Ideas, Stories and the Q&A
tool.
Recommendations:
1. Plan projects in phases and use different tools at different stages of
the consultation.
2. Better utilise the Q&A tool in a controlled environment to build a
growing FAQ hub.
3. Ensure all forum topics are facilitated and that an admin is assigned
to monitor and manage the flow of conversations.
Figure 15. Instances of engagement tools used since site launch compared to contributions.
24
Participation Trends and Observations
25
Suburb of Registered Participants
● Registered participants indicated their location to be from a broad range of suburbs throughout NSW.
● The two most represented suburbs in the database (PRM) were Rockdale, Surrey Hills, Newtown and Sydney CBD.
Figure 16 (a). Location of registered users throughout Australia.
26
Figure 16. Top 10 Suburbs represented in your database.
Relationship Analysis
● The majority of participants in the database
reported working at Live Demo accounting for
32.3% of those who indicated their relationship
to the organisation.
● The next most represented relationship was
by past or current patients accounting for 16%
of those who reported a relationship with Live
Demo followed by Partner organisations 9.4%,
Volunteers 6.3% and Others accounting for 7%.
Recommendations:
1. Given the representation of staff who use the
Live Demo site, it may be beneficial to look at
Single Sign On (SSO) to make it easier for
employees at Live Demo to sign in and take
part in internal consultations.
Figure 17. Registered users relationship to SESLHD.
27
Gender of Registered Participants
● When compared with the gender breakdown of all EngagementHQ sites the gender profile of Live Demo
is almost identical.
● The gender breakdown of registered participants shows a slight skew towards female representation
accounting for 52.9% of registered participants across the site.
Figure 18. Gender mix of registered users to Live Demo. Figure 19. Gender mix of participation to all eHQ sites globally.
28
Age Breakdown of Registered Participants
● The age profile of the Live Demo site is similar to the age profile of all participants who visit and
EngagementHQ site globally.
● There appears to be less involvement from 25-34 year-olds than the all EngagementHQ profile
however slightly more representation from the 55-64 year old category.
Figure 20. Age breakdown of registered users to Live Demo. Figure 21. Age breakdown of participation to all eHQ sites globally.
29
Traffic Analysis Comparison
● When compared to the site traffic sources for 2018 there the 2019 traffic profile is almost identical.
● The only exception is a slight increase in social media traffic to the site as a percentage of Aware visits, indicating an increase
in site awareness via social media channels such as Facebook, Twitter, Instagram and Linkedin.
● Email traffic to the site using EngagementHQ’s newsletter tool accounts for only 1.1% of all Aware traffic to the site.
Figure 22. Makeup of traffic to Live Demo in 2019. Figure 23. Makeup of traffic to Live Demo 2018.
30
Key Recommendations
The following recommendations are made in relation to Live Demo.
1. Organise site administrators and clean up administrator list of redundant administrators who haven’t logged in recently. Clearly identify roles and
responsibilities for managing the Live Demo site. Ensure all admins are effectively trained on how to use EHQ and understand best-practice digital
engagement approaches.
2. Develop an engagement program/schedule for the remainder of 2019 which aims to broaden the range of topics and projects which stakeholders can
provide input on.
3. Utilise Bondi Homepage features to utilize a richer homepage experience. Include widgets and setup the auto-populating project cards..
4. Incorporate EHQ’s new Project Finder into your corporate site to showcase live consultations. This feature allows for filtering by project tags, date and
project status, allowing stakeholders to search for projects relevant to them.
5. Develop a comms plan in order to continue to raise awareness and drive traffic to the site. This plan should outline ways in which the site will be positioned
and advertised to consumers/stakeholders as well as the channels by which it will be promoted. These channels should include public display, online
advertising and social media as well as other traditional stakeholder communication channels.
6. Utilise project planning guidelines and templates in order to achieve better digital engagement outcomes. This will allow for better staged planning for
online consultations and assist with identifying engagement objectives, digital tool selection, communications, risk management and reporting
considerations.
7. Ensure forums are properly facilitated. It is recommended that when a forum is launched that a facilitator be assigned to monitor the discussion and drive
the conversation.
31

eIQ Benchmarking Sample Report

  • 1.
    Site Review andBenchmarking Report Bang the Table, Live Demo August 2019 1
  • 2.
    SAMPLE Table of Contents SiteDetails 3 Snapshot 7 Site Trends and Observations 9 Project Trends and Observations 20 Participation Trends and Observations 28 Key Recommendations 34 2
  • 3.
    SAMPLE Organisation: Bang theTable Site URL: livedemo.engagementhq.com eHQ Annual License: eHQ (unlimited projects) Included Admins 3 Site Admins, 10 Project Admins Add-ons N/A eIQ Support Package: eIQ Partner Package Site Theme: Bondi Premium SSL: Yes Site Contracted Until: 4 August, 2020 Site Launch Date: 17 October 2016 Report Period January 1 - May 6, 2019 Site Information 3
  • 4.
    SAMPLE Active Site Admins Name:UN: Email: Last Login: Nathan Connors Nathan nathan@bangthetable.com 18 Apr, 2019 Bob Uruncle Bob99 nathan@bangthetable.com 12 Dec, 2016 Harry McKierny HarryMC nathan@bangthetable.com 17 Jan, 2019 4
  • 5.
    Performance Snapshot 2019 Aware,Informed, Engaged 38048Page Views Published Projects 12976Unique Visitors 22274Visits 5
  • 6.
    Site Trends andObservations 6
  • 7.
    Homepage Observations ● TheBondi theme continues to be used as the homepage layout for Live Demo. There is good use of the homepage description to call participants to action and the quick links in the first card list provide for a accessible way for participants to get involved. ● Homepage widgets are currently not being used on this page, instead there are links at the bottom of the page to various Hub Collections. ● Good use of imagery and relevant project images used on the homepage. Recommendations: 1. Consider utilising homepage widgets to bring forth news and updates, frequently asked questions and key documents. 2. Utilise the Bondi theme’s auto assign feature for project listings. These are based on project tags and allow you to setup a card list with confidence newly launched projects will appear on your homepage. 3. Embed EHQ’s new Project Finder into your corporate site to help make EHQ projects more discoverable via categories, themes or project status. 7
  • 8.
    Project Page Observations ●Most project pages are typical of the page to the right, with little branding devices to help stakeholders relate to the project or the organisation/service running the consultation. ● There are no page banners or consistent page layouts to help stakeholders navigate information and each project page appears to be set up differently. Recommendations: 1. Consider enabling project page banners to help bring project pages to life. Add extra branding devices to individual project pages allowing stakeholders to better relate to the projects being consulted on. 2. Develop a project page template for use throughout the site. This should organise widgets in a consistent way and provide instructions for other site admins building new projects, on how to correctly write a call to action, insert content and structure the page. 8
  • 9.
    Sign-Up Form Observations ●The site registration form is cohesive and has useful questions to help with audience segmentation. ● As seen in later sections of the report, the registration process for the site has a very high completion rate, meaning most new participants complete their registration. Recommendations: 1. Ensure a periodic interrogation of the demographics report is undertaken in order to keep track of your community segments and identify opportunities for further participation. 2. Establish groups/segments in the database (PRM) to segment your audiences based on the sign-up form questions. 3. Run regular campaigns focussed on building the database. 9
  • 10.
    Published Projects YoY ●In 2019, more projects have been published than in the first half of previous years. This activity indicates progress towards publishing the most amount of projects in any given year. ● April and August has consistently been a month where new projects are published. ● In 2018, 6 new projects were published representing the busiest full-year activity. Recommendations: 1. Continue to publish a broad-range of projects across the site. Incorporate ways to extend the utilisation of Your Say to collect community insights and feedback. See list of project ideas at the end of this report. 2. Consider rolling engagement strategies such as discussion boards, ideation activities and quizzes as a way to keep your activity current and relevant to drive repeat visitation. 3. Develop a project schedule for the remaining part of 2019. Figure 1. Comparison of projects published per month in 2019 compared with previous years. 10
  • 11.
    Site Visitors ● In2019 there has been 12976 unique site visitors to the Live Demo site. ● For the first half of 2019 the daily unique visitors has consistently been above the average site visitors from 2018 of 6.8 unique visitors per day. This indicates there is an increased awareness and interest in projects on the site. ● The return rate of unique visitors is 1.14 indicating that most visitors have not returned to the site during the period. ● Unique visitors were likely to look at 2.3 pages per visit. This may indicate that traffic to the site is focussed on specific consultations and that very few visitors are discovering or browsing the site for other consultations to take part in, and that majority of your projects were protected. Figure 2. Daily site visitors compared with average daily site visitors in 2018. Total Page Views Total Unique Visitors Total Visits 38048 12976 22274 11
  • 12.
    Site Visitors PeerAnalysis ● A peer analysis has been done on a sample of similar organisations using EngagementHQ. ● In 2019, the level of unique visitors on Live Demo regularly exceeded the average unique visitors for a similar organisations. On eight occasions the level of unique visitors exceeded the average visitors to a federal department using EHQ. ● When compared to a regional council using EngagementHQ, Live Demo achieved the average daily visitors benchmark on only one occasion. ● Overall, this analysis indicates that when compared to similar organisations engaging online using EngagementHQ, Live Demo is regularly performing above the average of its peers. Recommendations: 1. Continue to build a strong community database and drive awareness of Live Demo through partner channels. 2. Ensure regular publishing on new projects and activities and communicate new opportunities to stakeholders. Figure 3. Daily site visitors compared with average daily site visitors of other similar sized eHQ users. 12
  • 13.
    Database Active Users ●The Live Demo database is a great example of an active and current database. ● As can be seen in Figure 4., almost 93% of the database is active. This indicates that registered participants are successfully completing the registration process and authenticating their accounts. This graph also suggests that uploaded participants have successfully completed registration which, is important given there are several protected staff focussed consultations on the site. ● There are only 22 pending activations as at May 6, 2019. ● There are currently 4776 users in the database. Figure 4. Percentage of database with activated accounts vs accounts pending activation. 13
  • 14.
    Database Imported Users ●Figure 5. shows the makeup of the Live Demo database. 299 active users have been imported into EngagementHQ while 137 active users have self-selected to register for the site. ● Only 4 users who were imported have failed to complete their registration, while 18 self-select registrants are still to complete their registration process. ● This information indicates that the Live Demo database is overwhelmingly active and that registration for self-select participants hasn’t appeared to be a barrier to participation. Recommendations: 1. Continue to promote registration and make all engagement on the site “registered participants only”. 2. Create a group of “Pending Activation” participants to keep track of users who are not completing the registration process. Figure 5. Comparison of imported active users vs self-registered active users. 14
  • 15.
    Database Growth YoY ●When compared to 2018, the rate of database growth for the Live Demo site is on track to achieve similar growth in 2019. ● There has only been 8 new registered users to May 6, 2019 compared to 49 new registered users for the whole year 2018. ● The graph indicates there was also two large imports of participants in 2018 around this time last year. Figure 6. Database growth in 2019 compared with 2018. Total Database Size Registered users this period Registered users last period 4776 8 49 15
  • 16.
    Total Database SizePeer Analysis ● When compared to peer health organisations, Your Voice SESLHD has the third largest database of the group. ● This graph shows the relationship between database size and average daily visitors. It appears that for the health organisations analysed, there is a direct correlation between level of unique visitors and database size. Figure 7. Database size compared to peer organisations. 16
  • 17.
    Project Trends andObservations 17
  • 18.
    Engagement Rate ofTop projects ● When looking at the rates of engagement (leaving feedback as a percentage of aware) the best performing projects in 2019 were the Budget Consultation and Teachers Forum. While these projects received the highest rate of engagement, the number of contributions was quite low (see over page). ● Of the top projects by engagement rate, 5 projects exceeded the peer group average engagement rate of 27%. ● Both the peer group and Live Demo exceeded the average engagement rate for all projects launched on EngagementHQ. ● These levels of engagement suggest that stakeholders and participants who visit projects on Live Demo likely to leave a contribution. ● Of the top projects by engagement rate, two were protected projects. These were the Parking Strategy and the Pricing Submission Plan. Figure 8. Top projects by engagement rate showing EHQ average engagement rate and average engagement for peer group. 18
  • 19.
    Top Projects 2019 ●The Tram Stop Upgrade has received the most engaged contributions in 2019. This project features a series of surveys related to localised tram stop locations in order to capture commuter travel information as well as post-travel surveys. There is also two places maps which has been used to show proposed upgrades and seek comment. This project demonstrates a good utilisation of EngagementHQ for capturing information in relation to the running of a health related course/program. ● The second best performing project in terms of engagement is the Teachers Forum. This project appears to facilitate surveying and discussion between teachers and students. It has consistently been a top performing project since it was first launched. ● The third best performing project in 2019 has been the Masterplan project. This project features a expression of interest surveys for community to register to take part in a consumer engagement workshop. It is a good example of using EngagementHQ surveys as an EOI form. ● Of the other top projects in 2019 by engaged contributions, very few responses have been captured. ● There appears to be very few projects directly targeting broad-based engagement with community and stakeholders. Figure 9.0 Top projects by number of engaged participants. 19
  • 20.
    Top Projects AllTime ● There are some clear performance categories for all time top projects. The Tram Stop upgrade was a clear outlier with more than 500 unique pieces of feedback. The next 4 top projects all received between 50 and 100 responses. ● The majority of top projects have received between 10 and 50 responses with only one project receiving less than 10 overall responses. ● This top projects graph indicates that a more than 500 responses is a good benchmark for a top performing project, while contributions in the range of 10-100 responses could be considered good overall engagement. Figure 10. All time top projects by number of engaged contributions. 20
  • 21.
    Top Projects ByInformed and Aware Contributions Figure 11. Top projects by number of informed participants. Figure 12 Top projects by number of aware participants. 21
  • 22.
    Aware, Informed, Engagefor Top Projects ● This graph shows the Aware, Informed and Engaged metrics for top projects in 2019. ● Overall there is very little engagement across projects for 2019 with the exception of the Tram Stop Upgrades, Teachers Forum and Masterplan. ● The graph does indicate that three published projects are still registering Aware and Informed contributions even though there are no current opportunities for engagement enabled. These are the Budgeting Consultation and Parking Strategy projects. Visitors to the site are still viewing these projects and clicking to find out more information but there are currently no opportunities for engagement of those projects. Recommendations: 1. Old projects should be archived if they are complete. Consider opening up projects with a high awareness to new conversations. Question and Answer tool is often a useful way to do this. 2. Develop a digital engagement strategy for Live Demo to provide a better defined schedule of engagement and more diversity of engagement topics/projects. Figure 13. Top projects in 2019 showing Aware, Informed and Engaged. 22
  • 23.
    Which Tools CapturedEngagement ● Surveys have been predominantly used to capture engaged contributions in 2019, accounting for 196 engaged contributions across the site. This includes 124 survey responses for the Tram Stop Upgrades project alone. ● Three contributions have been made via the stories tool which appear to be test stories on projects in draft status, including Community Landscape Strategy and Development Application Program. Recommendations: 1. Use a mix of tools and map them to each projects methodology or approach. Ensure a project plan is created for each project and 2. Develop a digital engagement strategy for Live Demo to provide a better defined schedule of engagement and more diversity of engagement topics/projects. Figure 14. Mix of engagement tools used to capture engaged contributions in 2019. 23
  • 24.
    All-time Tool Performance ●Since site launch in 2016, the Survey tool has consistently been the tool of choice for Live Demo. This tool has been used on 71 occasions to capture 1220 submissions from stakeholders. This is a controlled environment tool which means participants are not aware of the outcomes of engagement and contributions from other participants unless they are reported back by the organisation. ● Other tools which have been used with moderate success include the Forum and Quick Poll tools accounting for a combined 168 engaged contributions. ● Least utilised tools have been Places, Ideas, Stories and the Q&A tool. Recommendations: 1. Plan projects in phases and use different tools at different stages of the consultation. 2. Better utilise the Q&A tool in a controlled environment to build a growing FAQ hub. 3. Ensure all forum topics are facilitated and that an admin is assigned to monitor and manage the flow of conversations. Figure 15. Instances of engagement tools used since site launch compared to contributions. 24
  • 25.
    Participation Trends andObservations 25
  • 26.
    Suburb of RegisteredParticipants ● Registered participants indicated their location to be from a broad range of suburbs throughout NSW. ● The two most represented suburbs in the database (PRM) were Rockdale, Surrey Hills, Newtown and Sydney CBD. Figure 16 (a). Location of registered users throughout Australia. 26 Figure 16. Top 10 Suburbs represented in your database.
  • 27.
    Relationship Analysis ● Themajority of participants in the database reported working at Live Demo accounting for 32.3% of those who indicated their relationship to the organisation. ● The next most represented relationship was by past or current patients accounting for 16% of those who reported a relationship with Live Demo followed by Partner organisations 9.4%, Volunteers 6.3% and Others accounting for 7%. Recommendations: 1. Given the representation of staff who use the Live Demo site, it may be beneficial to look at Single Sign On (SSO) to make it easier for employees at Live Demo to sign in and take part in internal consultations. Figure 17. Registered users relationship to SESLHD. 27
  • 28.
    Gender of RegisteredParticipants ● When compared with the gender breakdown of all EngagementHQ sites the gender profile of Live Demo is almost identical. ● The gender breakdown of registered participants shows a slight skew towards female representation accounting for 52.9% of registered participants across the site. Figure 18. Gender mix of registered users to Live Demo. Figure 19. Gender mix of participation to all eHQ sites globally. 28
  • 29.
    Age Breakdown ofRegistered Participants ● The age profile of the Live Demo site is similar to the age profile of all participants who visit and EngagementHQ site globally. ● There appears to be less involvement from 25-34 year-olds than the all EngagementHQ profile however slightly more representation from the 55-64 year old category. Figure 20. Age breakdown of registered users to Live Demo. Figure 21. Age breakdown of participation to all eHQ sites globally. 29
  • 30.
    Traffic Analysis Comparison ●When compared to the site traffic sources for 2018 there the 2019 traffic profile is almost identical. ● The only exception is a slight increase in social media traffic to the site as a percentage of Aware visits, indicating an increase in site awareness via social media channels such as Facebook, Twitter, Instagram and Linkedin. ● Email traffic to the site using EngagementHQ’s newsletter tool accounts for only 1.1% of all Aware traffic to the site. Figure 22. Makeup of traffic to Live Demo in 2019. Figure 23. Makeup of traffic to Live Demo 2018. 30
  • 31.
    Key Recommendations The followingrecommendations are made in relation to Live Demo. 1. Organise site administrators and clean up administrator list of redundant administrators who haven’t logged in recently. Clearly identify roles and responsibilities for managing the Live Demo site. Ensure all admins are effectively trained on how to use EHQ and understand best-practice digital engagement approaches. 2. Develop an engagement program/schedule for the remainder of 2019 which aims to broaden the range of topics and projects which stakeholders can provide input on. 3. Utilise Bondi Homepage features to utilize a richer homepage experience. Include widgets and setup the auto-populating project cards.. 4. Incorporate EHQ’s new Project Finder into your corporate site to showcase live consultations. This feature allows for filtering by project tags, date and project status, allowing stakeholders to search for projects relevant to them. 5. Develop a comms plan in order to continue to raise awareness and drive traffic to the site. This plan should outline ways in which the site will be positioned and advertised to consumers/stakeholders as well as the channels by which it will be promoted. These channels should include public display, online advertising and social media as well as other traditional stakeholder communication channels. 6. Utilise project planning guidelines and templates in order to achieve better digital engagement outcomes. This will allow for better staged planning for online consultations and assist with identifying engagement objectives, digital tool selection, communications, risk management and reporting considerations. 7. Ensure forums are properly facilitated. It is recommended that when a forum is launched that a facilitator be assigned to monitor the discussion and drive the conversation. 31