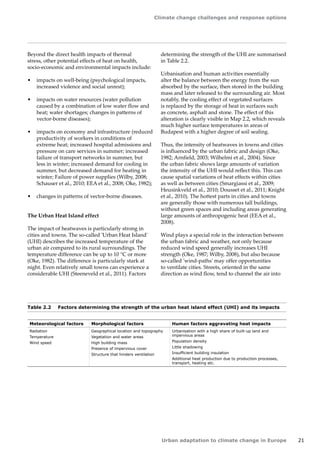
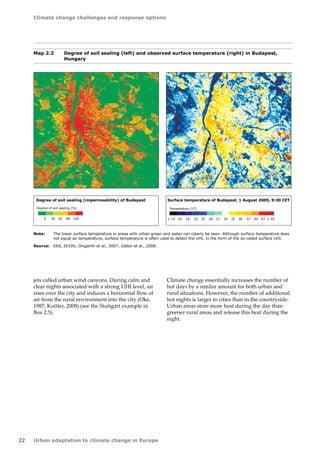
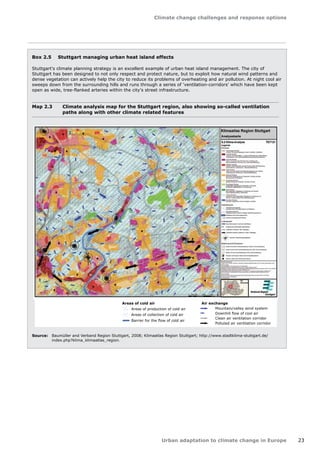
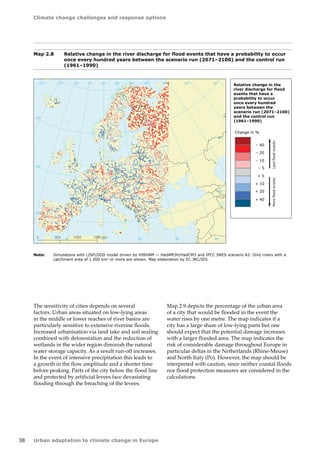
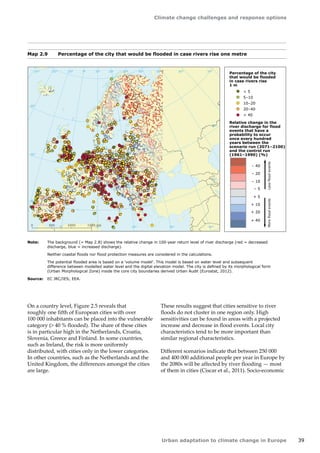
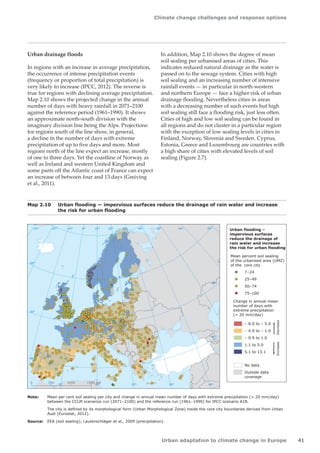
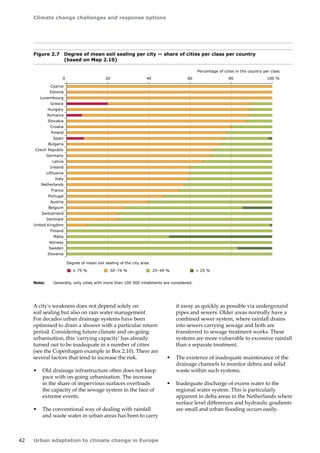
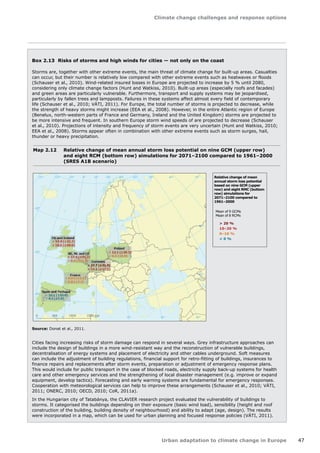
EEA Report No 2/2012 
ISSN 1725-9177 
Urban adaptation to climate change in Europe 
Challenges and opportunities for cities 
together with supportive national and European policies
EEA Report 
No 2/2012 
Urban adaptation to climate change in Europe 
Challenges and opportunities for cities 
together with supportive national and European policies
Cover design: EEA 
Layout: EEA/Henriette Nilsson 
Cover photo © sxc/Xpgomes 
Left photo © Ricciardi 
Right photo © sxc/abcd200 
European Environment Agency 
Kongens Nytorv 6 
1050 Copenhagen K 
Denmark 
Tel.: +45 33 36 71 00 
Fax: +45 33 36 71 99 
Web: eea.europa.eu 
Enquiries: eea.europa.eu/enquiries 
Legal notice 
The contents of this publication do not necessarily reflect the official opinions of the European Commission or other institutions of the European Union. Neither the European Environment Agency nor any person or company acting on behalf of the Agency is responsible for the use that may be made of the information contained in this report. 
All rights reserved 
No part of this publication may be reproduced in any form or by any means electronic or mechanical, including photocopying, recording or by any information storage retrieval system, without a prior permission in writing. For permission, translation or reproduction rights please contact EEA (address information below). 
Information about the European Union is available on the Internet. It can be accessed through the Europa server (www.europa.eu). 
Luxembourg: Office for Official Publications of the European Union, 2012 
ISBN 978-92-9213-308-5 
ISSN 1725-9177 
doi:10.2800/41895 
© EEA, Copenhagen, 2012 
Environmental production 
This publication is printed according to high environmental standards. 
Printed by Rosendahls-Schultz Grafisk 
— Environmental Management Certificate: DS/EN ISO 14001: 2004 
— Quality Certificate: DS/EN ISO 9001: 2008 
— EMAS Registration. Licence no. DK — 000235 
— Ecolabelling with the Nordic Swan, licence no. 541 176 
— FSC Certificate — licence code FSC C0688122 
Paper 
RePrint — FSC Certified 90 gsm. 
CyclusOffset 250 gsm. 
Both paper qualities are recycled paper and have obtained the ecolabel Nordic Swan. 
Printed in Denmark 
REG.NO.DK-000244 
ESPON disclaimer: 
Texts and maps stemming from research projects under the ESPON programme presented in this report do not necessarily reflect the opinion of the ESPON Monitoring Committee.
3 
Contents 
Urban adaptation to climate change in Europe 
Contents 
Acknowledgements ....................................................................................................5 
Key messages............................................................................................................. 6 
1 What is this report about and who should read it? ...............................................10 
2 Climate change challenges and response options ................................................13 
2.1 Heat ..............................................................................................................18 
2.1.1 Why are heatwaves an important urban challenge? �18 
2.1.2 What are the potential impacts of heat on Europe's cities? �24 
2.1.3 How can cities adapt to heat stress?..........................................................31 
2.2 Flooding .........................................................................................................35 
2.2.1 What are the challenges for cities regarding flooding? �35 
2.2.2 What are the potential flooding impacts on Europe's cities? ..........................37 
2.2.3 How can cities adapt to flooding?...............................................................48 
2.3 Water scarcity and droughts...............................................................................53 
2.3.1 Why are water scarcity and drought challenges for cities? �53 
2.3.2 What are the potential impacts of water scarcity and droughts 
on Europe's cities?...................................................................................55 
2.3.3 How can cities adapt to water scarcity and droughts? �59 
3 Planning urban adaptation .................................................................................. 62 
3.1 Capacity to adapt in Europe's cities.....................................................................62 
3.1.1 Awareness: knowledge and equity.............................................................63 
3.1.2 Ability: access to technology and infrastructure �66 
3.1.3 Action: economy, resources and institutions �69 
3.1.4 Summarising the adaptive capacity of cities �72 
3.2 Planning steps to urban adaptation.....................................................................74 
3.2.1 Get started: initiate adaptation, ensure commitment and management...........74 
3.2.2 Assess potential climate change risks and vulnerabilities �75 
3.2.3 Identify a wide range of adaptation options �75 
3.2.4 Assess and prioritise adaptation options.....................................................77 
3.2.5 Implement adaptation actions...................................................................77 
3.2.6 Monitor and evaluate adaptation action......................................................78 
3.3 Success factors ...............................................................................................79 
3.3.1 Raising awareness of climate change and the need to adapt..........................79 
3.3.2 Cutting across different sectors and levels �80 
3.3.3 Utilising the co-benefits of adaptive actions �84 
3.3.4 Dealing with uncertainty and long time frames �86 
3.3.5 Working with nature — not against............................................................91 
3.3.6 Securing resources for adaptation .............................................................93
Contents 
4 Urban adaptation to climate change in Europe 
4 Multi-level governance — enabling urban adaptation �95 
4.1 Governing adaptation at different spatial levels ....................................................95 
4.1.1 The local level ........................................................................................96 
4.1.2 The regional level ...................................................................................98 
4.1.3 The national level....................................................................................98 
4.1.4 The European level................................................................................101 
4.2 Bridging the levels — multi-level governance......................................................106 
4.2.1 The needs and benefits of multi-level governance �106 
4.2.2 Challenges ...........................................................................................108 
4.2.3 Success factors ....................................................................................111 
4.3 Pillars for multi-level governance .....................................................................112 
4.3.1 Policy coherence through multi-level climate proofing �112 
4.3.2 Territorial governance ...........................................................................115 
4.3.3 Developing institutional capacities across levels �117 
4.3.4 Securing access to funding for adaptation measures �119 
4.3.5 Multi-level knowledge base.....................................................................122 
Glossary.................................................................................................................. 125 
References.............................................................................................................. 128 
Annex I Key information....................................................................................... 141 
a) Selection of key literature and studies.......................................................141 
b) Selection of tools and guidance for adaptation �142 
Annex II City data.................................................................................................. 143
5 
Acknowledgements 
Urban adaptation to climate change in Europe 
Acknowledgements 
This report was written and compiled by: 
• European Environment Agency (EEA): 
Birgit Georgi with the support of Stéphane 
Isoard, Blaz Kurnik, Valentin Leonard Foltescu 
under the guidance of Ronan Uhel and 
André Jol; 
• European Topic Centre Climate Change 
Adaptation (ETC/CCA): Rob Swart, Natasha 
Marinova, Bert van Hove, Cor Jacobs, Judith 
Klostermann, Aleksandra Kazmierczak, Lasse 
Peltonen, Leena Kopperoinen, Kari Oinonen, 
Miroslav Havránek, Maria João Cruz; 
• European Topic Centre Spatial Information 
and Analysis (ETC/SIA): Mirko Gregor, Jaume 
Fons‑Esteve; 
• Umeå University: Carina Keskitalo; 
• Aalto University: Sirkku Juhola; 
• Umweltforschungszentrum Leipzig (UFZ): 
Kerstin Krellenberg; and 
• The Netherlands Environmental Assessment 
Agency (PBL): Leendert van Bree. 
Further contributions were received from: 
Stefan Greiving, Christian Lindner and Johannes 
Lückenkötter (IRPUD, TU Dortmund); Lykke 
Leonardsen (city of Copenhagen); Ingrid Molander 
(Botkyrka municipality); Tanja Wolf (WHO Europe); 
Holger Robrecht and Daniel Morchain (ICLEI 
Europe); Cédric Peinturier (Ministère de l'Écologie, 
du Développement Durable, des Transports et du 
Logement, France); Kathy Belpaeme (ICZM — 
Belgium); and Stefaan Gysens. 
The report team also wishes to thank the many 
further experts providing support throughout the 
development of this report, in particular: Corinne 
Hermant-de Callataÿ, Matthieu Fichter and Zoé 
Buyle-Bodin (European Commission); Alex Harvey 
(AEA); Johan Bogaert (Flemish government, 
Belgium); Peter Bosch (TNO); Zoltán Kohán and 
Péti Márton (VATI); Sandy Taylor (Birmingham 
City Council); Michael Klinkenberg (EUROCITIES); 
Inke Schauser (UBA, Germany); Stefan 
Schneiderbauer (EURAC); Stephanie Broadley 
and Michael Chang (TCPA); Anne Holsten, Tabea 
Lissner and Jürgen P. Kropp (PIK); Vincent Viguié 
(CIRED); Pierre Laconte (Foundation for the Urban 
Environment); Rita Jacinto, Pedro Garrett and Ana 
Gomes (FFCUL); Tiago Capela Lourenço (Lisbon 
University); Christofer Åström and Joacim Rocklöv 
(Umeå University); Anna Paldy (National Institute 
of Environmental Health (NIEH, Hungary); 
Bertrand Reysset (Ministère de l'Écologie, du 
Développement Durable, des Transports et du 
Logement, France); Buket Akay (Ministry of 
Environment and Urban, Turkey); Celine Magnier 
(Ministère de l'Écologie, du Développement 
Durable, des Transports et du Logement, France); 
Else Lobersli (Direktoratet for naturforvaltning, 
Norway); Francesca Giordano (ISPRA, Italy); Pavel 
Stastny (SHMI, Slovakia); Simona Losmanova 
(CENIA, Czech Republic); Vita Slanke (LVGMC, 
Latvia); Martin Füssel, Andrus Meiner, Bo Jacobsen 
and Peter Kristensen (EEA).
6 
Key messages 
Urban adaptation to climate change in Europe 
Key messages 
Climate change — the risk to cities and 
Europe 
Climate change is happening, projected to continue 
and poses serious challenges for cities. Extreme 
weather events resulting in hazards such as 
heatwaves, floods and droughts are expected to 
happen more frequently in many parts of Europe. 
The impacts are stark: flooding can damage or 
wash away homes, businesses and infrastructure. 
Jobs and vital services will be lost. Heatwaves can 
compromise public health, reduce productivity 
and constrain the functionality of infrastructure. 
Water scarcity will place cities in competition for 
water with a wide variety of other sectors, including 
agriculture, energy generation and tourism. 
Cities drive Europe's economy and generate 
substantial wealth. If important economic hubs such 
as London, Paris or Rotterdam experience climate 
related problems Europe's economy and quality of 
life will be under threat. 
Urbanisation, population ageing and 
other socio-economic trends interact 
with climate change 
Climate change is strongly intertwined with other 
socio-economic changes. Demographic trends such 
as on-going urbanisation and competing demand for 
water from the public and sectors such as industry 
and agriculture leads to regional water scarcity. An 
ageing population increases the share of people 
vulnerable to heatwaves. Urbanisation also reduces 
the area available for natural flood management 
or increases the number of homes and businesses 
actually in flood-prone areas. These socio-economic 
changes increase the vulnerability of people, 
property and ecosystems under current climate 
conditions as long as no adaptation measures are 
taken. Climate change is projected to exacerbate 
these problems. 
Cities face specific climate change 
challenges … 
Three quarters of the population of Europe live in 
urban areas and this is where climate change will be 
most apparent in everyday life. 
While urban areas will generally experience the 
same exposures to climate change as surrounding 
regions, the urban setting can alter this as well 
as any potential local impacts. The replacement 
of natural vegetation with artificial surfaces and 
buildings creates unique microclimates altering 
temperature, moisture, wind direction and 
rainfall patterns. Differences in urban design and 
management make cities vulnerable in different 
ways, even those situated in the same geographic 
region. Excessive amounts of rain water cannot 
drain into the ground where a high share of the 
city's area is imperviously sealed and thus generate 
or worsen floods. A high amount of artificial 
surfaces stores heat and cause raised temperatures 
in cities compared to the surrounding region. 
Photo: © ESA
Key messages 
Urban adaptation to climate change in Europe 7 
… and depend highly on other regions in 
Europe and beyond 
Cities depend heavily on other cities and regions 
to provide them with indispensable services such 
as food, water and energy and the infrastructure to 
deliver them. Ecosystem services from surrounding 
regions provide fresh air, store or drain flood water 
as well as drinking water. 
Climate change challenges: from risk 
management to opportunity seizing 
The challenges of climate change force drastic 
changes in city and regional management so 
innovative solutions are required alongside 
traditional measures. Establishing strong spatial 
planning which stops placing homes, businesses and 
infrastructure into current but also future risk-prone 
areas or providing more room for rivers can be an 
effective and sustainable way to deal with risks 
complementary to building higher dikes. Keeping 
public space and buildings cool by using green roofs 
or walls and providing more shade, rather than air 
conditioning, saves energy and can make cities even 
more attractive. 
Adaptation to climate change offers the opportunity 
for developing new jobs and promoting innovation 
and, at the same time, for implementing the 
profound changes needed in managing Europe's 
cities and regions. This will lead the way towards a 
more sustainable and resilient future for people, the 
economy and nature. 
Acting now ensures adaptation in time 
and at lower cost 
Cities cannot profess being unaware about climate 
change. Now is the time to act. Delaying adaptation 
action will most probably increase costs at a later 
stage or measures will come too late. Infrastructure, 
such as buildings, roads, railways, energy grids and 
sewage systems, lasts for decades and is expensive 
to replace. Building infrastructure ready for future 
climate conditions and not in risk prone areas 
(such as floodplains) will result in lower costs and 
increased effectiveness. 
Long-term planning is crucial but has often been 
lacking. Some positive examples can, however, be 
found in other areas such as insurance and pension 
planning. The Norwegian Government Pension 
Fund is one such example as it intends to ensure 
pensions in the future via a long-term strategy, 
despite the trend of an ageing population. Thereby 
it increasingly considers the climate change‑related 
risks of its investments. A similar long-term 
approach is needed for infrastructure investments. 
Maintaining the functioning of urban 
infrastructure requires massive 
investments 
Existing and future buildings and infrastructure 
need huge investments, alongside those for 
climate‑proofing, over the coming decades in order 
to keep them functioning and delivering their 
services. It means incorporating climate change 
adaptation concerns into building standards and 
retrofitting activities, such as ensuring that sewage 
systems can cope with heavier precipitation, 
reviewing building designs to better insulate against 
heat and adapting the energy and transport systems 
to cope with higher temperatures, low water 
availability or flooding. 
Large financial resources are needed irrespective 
of financial constraints. The Multi-annual Financial 
Framework (MFF), in particular the cohesion funds, 
is a key European Union instrument which supports 
local and regional adaptation. The MMF proposal 
for the period 2014–2020 foresees using a much 
higher share of the budget for climate change (20 %) 
than in the current period. However, the proposed 
20 % will support both climate change mitigation 
and adaptation. Current political discussions 
seem very much focused on mitigation rather than 
adaptation. 
Investment goes beyond 'grey' 
infrastructure 
Adaptation also relates strongly to using and 
expanding green infrastructure such as parks, 
forests, wetlands, green walls and roofs, wherever 
feasible and sustainable. Such infrastructure serves 
to provide a cooling effect on cities as well as 
playing a role in managing floods. Measures which 
combine grey and green infrastructures (1) have the 
potential to deliver robust and flexible solutions 
over a long period. In addition they can deliver 
(1) Grey infrastructure: construction measures using engineering services. 
Green infrastructure: vegetated areas and elements such parks, gardens, wetlands, natural areas, green roofs and walls, trees etc. 
contributing to the increase of ecosystems resilience and delivery of ecosystem services.
Key messages 
8 Urban adaptation to climate change in Europe 
benefits such as higher energy efficiency due to 
lower cooling needs, or attractive areas for nature, 
wildlife and recreation. 
'Soft' measures (2) are another option and can 
often be implemented at less cost. Such measures 
include behavioural changes, emergency systems 
and the adequate provision of information to 
vulnerable groups. They can reduce health impacts 
in the event of heatwaves or flooding. While such 
systems are generally well-established in disaster 
risk management programmes they often do not 
include additional risks related to climate change. 
Investments in capacity building and planning 
processes are required to fully develop the potential 
of these soft measures. This would involve: 
• sharing information and building knowledge 
for citizens, administrations, politicians and 
business; 
• enabling and promoting innovation; 
• enabling a broad participation in planning 
and implementation thereby taking up 
local knowledge and educating people and 
decision‑makers; 
• changing long-term planning and 
implementation approaches across sectors and 
governmental levels; 
• providing the appropriate institutional 
structures and capacities for mainstreaming and 
cooperation across sectors and levels. 
Urban adaptation relies on action beyond 
cities' borders 
Events outside of cities can have major effects 
on urban areas. Certain cities, for example, face 
flooding due to inappropriate land use and flood 
management in upstream regions. In water scarce 
regions cities compete for water with agriculture 
and other users. Urban adaptation to climate change 
therefore requires regional, national and European 
approaches. 
Support from a national and European 
framework is crucial in assisting cities to 
adapt 
Cities and regional administrations need to 
establish grey and green infrastructures and soft 
local measures themselves. National and European 
policy frameworks can enable or speed up local 
adaptation thus making it more efficient. Supportive 
frameworks could comprise of: 
• sufficient and tailored funding of local action; 
• mainstreaming adaptation and local concerns 
into different policy areas to ensure coherence; 
• making the legal framework and budgets 
climate-proof; 
• setting an institutional framework to facilitate 
cooperation between stakeholders across sectors 
and levels; 
• providing suitable knowledge and capacities for 
local action. 
Few European regulations refer to adaptation, but 
a higher potential exists. One proposal linked to the 
European Union's structural funds for the period 
2014–2020 states that project spending requires the 
existence of disaster risk assessments taking into 
account climate change adaptation as conditionality. 
It will ensure that expensive and long-lasting 
infrastructures are able to cope with future climate 
changes. In addition the proposal for the MFF 
2014–2020 requests that the budget for climate 
change is sourced from different policy sectors 
forcing policy mainstreaming and coherence. 
Europe's future depends on strong 
and resilient cities — towards a joint, 
multi‑level approach to cope with climate 
change 
Europe needs to build climate change resilience 
in its cities. Cities and regions are connected on 
multiple levels with cities being key for the economy 
(2) Soft measures: policies, plans, programmes, procedures.
Key messages 
Urban adaptation to climate change in Europe 9 
and wealth generation for Europe. This requires 
a joint and comprehensive approach combining 
dialogue and partnerships which crosses sectors and 
governmental levels. 
The development and implementation of the 
European climate change adaptation strategy 
for 2013 offers a unique opportunity to create 
this joint approach and reflects efforts cities 
have made in recent years to be part of related 
EU policy. Prominent examples, in which the 
European Commission directly works with cities 
and city networks, are the Sustainable Cities and 
Towns Campaign and the Covenant of Mayors 
initiative. The latter initiative sees more than 
3 000 municipalities committing themselves to 
reduce their greenhouse gas emissions. An extension 
of this model towards the inclusion of adaptation is 
in discussion. Moreover, the European Commission 
started a project in 2011 to support urban adaptation 
strategies. 
This report … 
… provides information to facilitate this multi-level 
European process and the effective participation 
of local governments. It complements a range of 
other studies and information sources, such as the 
European Climate Adaptation Information Platform 
CLIMATE-ADAPT, the forthcoming EEA reports on 
climate change impacts and on adaptation (due in 
autumn 2012), the handbook on Climate-Friendly 
Cities (2011), published under the Hungarian 
EU presidency, among others listed later in the 
report.
10 
What is this report about and who should read it? 
Urban adaptation to climate change in Europe 
Box 1.1 Key terms used in this report 
Urban areas, cities and towns: Due to a lack of European definitions these terms are used in the report 
depending on the particular context. The indicators in this report generally consider cities with more than 
100 000 inhabitants. Results and guidance from this report are nevertheless relevant for cities and towns below 
that population threshold. The report uses 'urban areas' as a collective term to fit with the different country 
specific definitions of cities and towns. 
Adaptation to climate change is the adjustment in natural or human systems (e.g. urban areas) in response to 
actual or expected climatic stimuli or their effects. It moderates harm or exploits beneficial opportunities of climate 
change. 
Adaptive capacity is the ability of a system, such as urban areas, to adjust to climate change to moderate 
potential damages, to take advantage of opportunities or to cope with the consequences. 
Vulnerability: Many definitions exist according to the context. For example, the United Nations International 
Strategy for Disaster Reduction (UNISDR, 2009) defines vulnerability as the characteristics and circumstances of a 
community, system or asset that make it susceptible to the damaging effects of a hazard. The Intergovernmental 
Panel on Climate Change defines vulnerability to climate change as the degree to which a system is susceptible 
to, and unable to cope with, adverse effects of climate change, including climate variability and extremes. 
Vulnerability is a function of the character, magnitude and rate of climate change and variation to which a system 
is exposed, its sensitivity, and its adaptive capacity (CoR, 2011a; IPCC, 2007). While being aware of the different 
definitions and concepts of vulnerability, we do not use a specific definition or concept stringently in this report but 
rather use the term in a more generic way. 
Mitigation of climate change is an anthropogenic intervention to reduce the anthropogenic forcing of the 
climate system. It includes strategies to reduce greenhouse gas sources and emissions and enhancing greenhouse 
gas sinks. 
More terms can be found in the glossary at the end of this report. 
1 What is this report about and who 
should read it? 
The need for an urban focus on climate 
change adaptation in Europe 
Climate change leading to higher temperatures, 
changing precipitation patterns and sea level rise, 
is a reality in Europe. Climate change mitigation 
measures will limit the magnitude and rate of 
related events in the future, but they will not prevent 
them. Pro-active adaptation to climate change is 
therefore imperative (EEA, 2010a). 
Around three quarters of Europe's population live 
in urban areas (EEA, 2006; EEA, 2010b). Urban 
areas are the places in Europe where most people 
will be vulnerable to the effects of climate change. 
At the same time cities are Europe's economic 
centres. Innovation and major economic assets are 
concentrated here (EC, 2009a). Urban areas adapted 
to climate change are key for Europe's future. The 
large and growing size of the urban population, 
cities' economic assets and the complexity of city 
systems to provide and manage energy, water, 
waste, food and other services make urban areas 
highly vulnerable to both current climate variability 
and future climate change. Urban areas need 
focused attention across Europe and a specific 
approach. 
While urban adaptation to climate change at a first 
glance may seem to be purely a local governance 
issue, the strong connections between European 
cities and their surrounding regions, or countries, 
warrant a broader perspective.
What is this report about and who should read it? 
Urban adaptation to climate change in Europe 11 
Figure 1.1 Framework of the report 
Climate change 
exposure 
– Temperature 
– Precipitation 
– Sea level 
Sensitivity of cities to 
– Heat 
– Flooding 
– Water scarcity 
Potential climate 
change impacts 
on cities 
Possible adaptation 
measures reducing 
the sensitivity 
Chapter 2 — Climate change challenges Chapter 3 — Planning urban adaptation 
Chapter 4 — Multi-level governance 
Adaptive capacity of 
cities to cope with the 
impacts and reduce 
the vulnerability 
Planning 
urban 
adaptation 
and 
success 
factors 
Multi-level governance action to facilitate 
and implement adaptation 
Focus and target audience of this report 
From a European perspective, this report informs 
about the key challenges that climate change poses 
to cities and the need for urban adaptation. It 
positions the urban challenges in the larger policy 
frameworks provided by regional, national and 
European institutions and it gives a summary 
overview of opportunities for solutions. 
As such, the report addresses stakeholders involved 
in urban development at local and city level as well 
as at regional, national and European level. It aims 
to support policy development and decision-making 
across all these levels. This report takes key policy 
questions for specific climate-related problems, 
which are common for groups of cities, as the 
starting point of the assessment. It presents: 
• the most important potential impacts of climate 
change on cities in Europe: it characterises 
cities interms of their vulnerability or adaptive 
capacity to climate change due to factors such as 
geographic position, urban design, size, wealth 
or governance system; 
• a range of adaptation responses for different 
spatial levels; 
• the challenges and opportunities for multi-level 
governance in the relevant policy frameworks. 
Because of its question-guided approach, the 
report does not provide a comprehensive scientific 
assessment of all possible potential climate 
change impacts and associated adaptation options 
across all European urban areas. It synthesises 
existing data and research results around selected 
key climate challenges for cities and focuses at 
providing the information needed by European 
and national and to some extent by regional and 
local decision-makers to decrease the vulnerability 
of cities across Europe in a multi-level policy 
framework (Figure 1.1).
What is this report about and who should read it? 
12 Urban adaptation to climate change in Europe 
Box 1.2 Examples of what stakeholders can expect from the report 
Stakeholders in all governments, communities and networks, the 
private sector and research: 
• support towards a better understanding of their own position and role 
in the overall European context in enabling urban adaptation to climate 
change, such as developing coherent policies towards adaptation, 
implementing effective adaptation or closing research and information 
gaps; 
• an overview of the differences and similarities between cities and regions 
encouraging mutual learning; 
• a cross-sectoral and multi-level perspective that encourages 
'out‑of‑the‑box' thinking, challenges creativity and reveals the many 
cross‑benefits of good adaptation. 
European and national level stakeholders: 
• information to create awareness about urban vulnerability to climate 
change and the awareness that several types of impacts as well as 
solutions depend on action at national and European level; 
• information on the opportunities to mainstream urban adaptation into 
the different European and national policy areas in order to identify 
potentially adverse impacts and opportunities, overcome barriers and thus enable effective local adaptation; 
• information on European patterns of urban vulnerability as input into the development of more targeted 
funding programmes, such as the EU's structural funds and for research. 
City and regional governments: 
• in a European context, provide information to raise awareness of future climate change challenges for urban 
areas and their related regions and potential options for adaptation action; 
• the ability to start comparing one's vulnerability and response options with other cities, exploring the reasons 
behind and ways to reduce this vulnerability; 
• an understandable methodological framework, facilitating the transition between awareness of cities' climate 
challenges and the development of targeted adaptation actions; 
• a suggestion about the potential and benefits of active participation of local governments in a multi-level 
governance approach and in the development and implementation of the 2013 EU adaptation strategy and 
national strategies; 
• the report does not provide guidance for detailed local adaptation planning due to the high number and 
diversity of local situations and the report's focus on the European perspective of the urban challenges. 
Building on earlier efforts in support of 
the 2013 EU adaptation strategy 
This report builds on a number of other reports 
such as the Committee of the Regions' study 
Adaptation to Climate Change (CoR, 2011a), the 
handbook Climate-friendly Cities (VÁTI, 2011), the 
scoping study Urban Regions — Vulnerabilities, 
Vulnerability Assessments by Indicators and 
Adaptation Options for Climate Change Impacts 
(Schauser et al., 2010), a variety of local studies 
and initiatives such as the Resilient Cities 
conferences. It provides a European overview 
of the challenges and opportunities of urban 
adaptation to climate change and links them with 
these other initiatives that provide more detailed 
information on local climate change impacts, and 
good practice guidance. As such it facilitates the 
debate on European and national support for 
urban adaptation, feeds into the European Climate 
Adaptation Platform Climate‑ADAPT, and supports 
an effective participation of local governments in 
the development and implementation of the 2013 
EU adaptation strategy (EC, 2009b) by providing 
supportive information.
13 
Climate change challenges and response options 
Urban adaptation to climate change in Europe 
2 Climate change challenges and 
response options 
Weather and climate strongly influence human life 
in cities. While exposure to weather and climate is 
important in the present climate, climate change 
may exacerbate or ameliorate any potential exposure 
and subsequent impacts. 
Cities and towns, just as the rest of Europe, will 
be affected by the impacts of climate change. 
Current observations of change are well in line 
with projections of the average climate change 
(Van Engelen et al., 2008), which suggest: 
• an increase of the annual mean temperature 
across Europe between 2 and 5 °C by the end of 
this century, relative to the present-day climate; 
• a change of precipitation patterns with drier 
summer conditions in the Mediterranean area 
and wetter winter conditions in Northern 
Europe; 
• a rise of the sea level (Christensen et al., 2007; 
Van der Linden and Mitchell, 2009; Greiving 
et al., 2011). 
Apart from the changes in average climate, the 
number, intensity and duration of heatwaves, 
extreme precipitation events and drought is 
expected to increase (Barriopedro et al., 2011; Giorgi 
et al., 2011; Hoerling et al., 2012). 
Climate change and its impacts will not appear 
uniformly in Europe. Different regions will 
experience varying intensities of change. Map 2.1 
identifies five European regions facing similar 
climate change issues. It is based on a cluster 
analysis of eight climate change variables which 
were calculated on the basis of a comparison of 
1961–1990 and 2071–2100 climate projections 
from the IPCC SRES scenario A1B (3) scenario 
(Greiving et al., 2011). The map illustrates that 
(3) SRES refers to the scenarios described in the IPCC Special Report on Emissions Scenarios (IPCC, 2000). The SRES scenarios are 
grouped into four scenario families (A1, A2, B1 and B2) that explore alternative development pathways (see further explanation in 
the glossary). 
different regions can have similar climate change 
characteristics, and that in one EU Member 
State, its regions can have very different climate 
characteristics. Those working on climate change 
adaptation in some regions may find regions with 
similar climate challenges in other countries rather 
than within their own. 
While urban areas will generally experience the 
same exposures to climate as their surrounding 
region, the urban setting — its form and 
socio‑economic activity — can alter exposures as 
well as impacts at the local scale. Built-up areas in 
the cities create unique microclimates due to the 
replacement of natural vegetation with artificial 
surfaces. This affects air temperature, wind 
direction and precipitation patterns, amongst others. 
Climate change will affect all of these components, 
exacerbating some of them and lessening others. 
Beyond direct climate change impacts, such as 
health problems due to heat or damages to buildings 
and infrastructure due to flooding, the indirect 
impacts on cities can be much broader. In a world 
where every city and every region is connected 
in a multitude of ways to other cities and regions, 
the failure of one strand of this complex web 
will create a knock-on effect. Floods can destroy 
homes, business sites and infrastructure as well as 
contributing indirectly to loss of jobs and income 
sources, for example. People and businesses will be 
cut off from vital services such as energy, transport 
and clean water. Heatwaves can compromise public 
health, reduce the ability to work and result in 
lower productivity thus shortening or delaying 
the delivery of products and services to clients in 
the city and elsewhere. They can reduce the use 
of public spaces and thus constrain social life. 
High temperatures can put infrastructure at risk 
— deformed roads and rail tracks can hamper the 
supply of goods and commuters or, in particular in
Climate change challenges and response options 
14 Urban adaptation to climate change in Europe 
Cluster/stimuli Northern-central 
Europe 
Northern– 
western 
Europe 
Northern 
Europe 
Southern– 
central 
Europe 
Mediterranean 
Europe 
Change in annual mean temperature + + ++ ++ ++ 
Decrease in number of frost days –– – –– –– – 
Change in annual mean number of summer 
days 
+ + 0 ++ ++ 
Relative change in annual mean precipitation 
in winter months 
+ + ++ 0 – 
Relative change in annual mean precipitation 
in summer months 
– – 0 –– –– 
Change in annual mean number of days with 
heavy rainfall 
0 + + 0 – 
Relative change in annual mean evaporation + 0 + 0 – 
Change in annual mean number of days with 
snow cover CDSC 
– 0 –– 0 0 
Map 2.1 European regions clustered according to projected climate changes 
Note: Key: ++ Strong increase; + Increase; 
0 Insignificant stimulus for the characterisation of the cluster; 
– Decrease; –– Strong decrease. 
The map is based on a cluster analysis and represents aggregated data. Therefore in some areas a specific climate factor 
might point in a different or even opposite direction than indicated in the cluster. 
Source: Greiving et al., 2011; © ESPON, 2013. 
EUROPEAN UNION Origin of data: own calculation based on Lautenschlager et al. 2009 
Part-financed by the european Regional Development fund 
INVESTING IN YOUR FUTURE 
European climate change regions 
This map does not 
necessarily reflect the 
opinion of the ESPON 
Monitoring Committee 
Canarias 
Guadeloupe Martinique Réunion 
Guyane 
Madeira 
Acores
Climate change challenges and response options 
Urban adaptation to climate change in Europe 15 
Box 2.1 Reducing cities' dependency on 
external services 
Cities are highly dependent on vulnerable external 
services but can strategically plan to ensure service 
provision under future climate conditions. 
Firstly, they can take action to reduce supply system 
vulnerability e.g. by locating power and communication 
lines underground or creating multiple supply lines. 
This approach involves measures going beyond city 
boundaries requiring cooperation, coordination, 
lobbying and policy agreements on a regional, national 
and sometimes European level (see Section 3.2) 
(OECD, 2010). 
Secondly, cities can take measures to become more 
independent of external services and can prepare for 
something as extreme as a system failure (CAP, 2007). 
This requires action at all levels. It can include measures 
to reduce energy demand or to generate energy locally, e.g. building of passive houses (ultra-low energy houses), 
solar panels on roofs and promotion of district cooling and heating systems. Municipalities can relocate vulnerable 
urban transport infrastructure and make it climate-proof, improve water use efficiency, reduce losses from the 
water supply systems and build local water storage facilities and other back-up systems (CAP, 2007). Green 
infrastructure approaches can consider the capture and use of rainwater as well as recharging groundwater 
through rain and grey water infiltration. Interconnection between regional water and energy supply systems can 
serve as a back-up, reducing the likelihood of a failure. Measures towards greater independence may well be 
considered on a metropolitan or regional scale instead of at a uniquely city level (VÁTI, 2011; CoR, 2011a; CAP, 
2007; Greater London Authority, 2010). 
combination with droughts, power stations might 
not get sufficient cooling water and thus fail to 
deliver energy. Potential drops in the production 
of food, goods and services outside the cities will 
constrain services in the cities. Water scarcity places 
cities into a water competition with other sectors 
such as agriculture and tourism and poses higher 
economic pressures on the city or individuals to 
access sufficient water thereby challenging social 
equity. These indirect impacts challenge in a much 
broader way the economy and quality of life in 
cities and in Europe as a whole (response options in 
Box 2.1). 
While these indirect impacts are extremely 
important their analysis is complex and requires 
different data as well as analysis above and beyond 
that usually used for climate change vulnerability 
assessments. This goes beyond the scope of this 
report which concentrates, as an initial step, on more 
direct climate change impacts and vulnerabilities in 
cities. Sections 2.1–2.3 focus on a selection of climate 
challenges which are of particular relevance for 
urban areas: 
• heat; 
• flooding; 
• water scarcity and droughts. 
Although a large number of subjects with an urban 
component, such as storms, forest fires, landslides 
and erosion, can be defined, this selection is 
intended to illustrate why and how the specific 
urban context comes into play when considering 
climate change issues in cities and towns. The 
assessment of these direct impacts can then serve 
as the input to future broader assessments of the 
secondary and tertiary effects on the economy, social 
equity and quality of life in cities and in Europe as a 
whole. 
In this report, the assessment builds on European 
climate change projections and relates them to 
several key indicators of cities' sensitivity related 
to urban design and socio-economic structure. 
The assessment follows, in general, the scheme in 
Figure 2.1. However, quantitative, Europe-wide 
data for cities are scarce and do not allow for a 
fully-fledged assessment. The report considers up 
to 576 cities with more than 100 000 inhabitants 
and in a few cases below that population number. 
For these larger cities, data were available in the 
urban audit database (Eurostat, 2012) although this 
is not complete for every indicator. The analysis 
of potential climate change impacts is therefore 
rather descriptive as it uses additional qualitative 
information and illustrative examples. 
Photo: © Ian Britton
Climate change challenges and response options 
16 Urban adaptation to climate change in Europe 
Climate change 
exposure 
– Temperature 
– Precipitation 
– Sea level 
Sensitivity of cities to 
– Heat 
– Flooding 
– Water scarcity 
Potential climate 
change impacts 
on cities 
Possible adaptation 
measures reducing 
the sensitivity 
Chapter 2 — Climate change challenges Chapter 3 — Planning urban adaptation 
Chapter 4 — Multi-level governance 
Adaptive capacity of 
cities to cope with the 
impacts and reduce 
the vulnerability 
Planning 
urban 
adaptation 
and 
success 
factors 
Multi-level governance action to facilitate 
and implement adaptation 
Figure 2.1 Placing Chapter 2 within the framework of the report 
Box 2.2 Classification of adaptation options as applied in the report 
Adaptation options can be categorised in different ways. This report builds on the classifications used in the EU's 
White Paper on adapting to climate change (EC, 2009b): 
• 'Grey' infrastructure approaches correspond to 'physical interventions or construction measures and using 
engineering services to make buildings and infrastructure essential for the social and economic well-being of 
society more capable of withstanding extreme events.' 
• 'Green' infrastructure approaches contribute to the increase of ecosystems resilience and can halt 
biodiversity loss, degradation of ecosystem and restore water cycles. At the same time, green infrastructure 
uses the functions and services provided by the ecosystems to achieve a more cost effective and sometimes 
more feasible adaptation solution than grey infrastructure. 
• 'Soft' approaches correspond to 'design and application of policies and procedures and employing, inter 
alia, land-use controls, information dissemination and economic incentives to reduce vulnerability, encourage 
adaptive behaviour or avoid maladaptations. They require careful management of the underlying human 
systems'. Some of these measures can facilitate the implementation of grey or green measures (e.g. funding, 
integration of climate change into regulations). Many types of soft measures are particularly relevant when 
uncertainties about the expected changes are large, since they enhance the adaptive capacity (UNECE, 2009). 
Measures in general can be of a preventive character and improve resilience yet they can also offer preparative 
support when dealing with the anticipated effects of climate change and extreme events. They can also provide 
responses to direct effects or aim to assist in the recovery of economic, societal and natural systems following an 
extreme event (UNECE, 2009).
Climate change challenges and response options 
Urban adaptation to climate change in Europe 17 
Further reading 
• EEA, JRC and WHO, 2008, Impacts of Europe's changing climate: 2008 indicator-based assessment, 
EEA Report No 4/2008, European Environment Agency (http://www.eea.europa.eu/publications/eea_ 
report_2008_4). 
• IPCC, 2007, Climate change 2007: Synthesis report. Contribution of Working Groups I, II and III to the 
Fourth Assessment Report of the Intergovernmental Panel on Climate Change, Cambridge University Press, 
Cambridge, United Kingdom (http://www.ipcc.ch/pdf/assessment-report/ar4/syr/ar4_syr.pdf). 
Finally, Chapter 2 lists a range of possible adaptation 
measures per climate challenge. The options 
presented do not pretend to be comprehensive 
since the most appropriate solutions are tailor-made 
to account for local urban characteristics, which 
are very different for different regions in Europe. 
Chapter 3 provides, in addition, an overview 
of generic ways to increase resilience to climate 
change. 
There are a number of ways to adapt to climate 
variability and change and various methods 
to then classify them. This report follows the 
EU's White Paper 'Adapting to climate change' 
classification, distinguishing between 'grey' and 
'green' infrastructure and 'soft' approaches (see 
Box 2.2). Other classifications relate to the options 
for response in terms of their timing in view of 
prevention, preparation and response choices 
(EC, 2009b; UNECE, 2009).
Climate change challenges and response options 
18 Urban adaptation to climate change in Europe 
Key messages 
• In Europe, of those natural disasters occurring in recent decades, heatwaves have caused the most human 
fatalities. During the summer of 2003 the heatwave in Central and Western Europe was estimated to have 
caused up to 70 000 excess deaths over a four-month period. 
• It is highly likely that the length, frequency and/or intensity of heatwaves will increase. 
• Present day design of many cities with few green urban areas but many artificial surfaces aggravates the 
impact of heatwaves within cities, in particular by increasing night-time temperatures. 
• Based on the indicators used in this chapter, there are larger numbers of sensitive cities across Europe, with 
the exception of northern Europe and parts of eastern Europe. A large build-up of heat in Southern and 
Eastern Europe and its northward shift in the future will have a huge impact on many cities in Europe. 
• Local city characteristics tend to be highly important in terms of sensitivity to heat. The results suggest that 
cities designed in such a way that makes them susceptible to heat are not unique to one particular region. 
There are sensitive cities in high heat regions which need specific consideration but there are also northern 
European cities which need consideration. 
• City governments have a range of options at their disposal to be better prepared for future heat conditions, 
including 'grey', 'green' and variety of 'soft' solutions. 
Box 2.3 Recent major heatwaves in Europe 
The summer 2003 European heatwave caused up to 
70 000 excess deaths over four months in Central and 
Western Europe (Brücker, 2005; Robine et al., 2008; 
Sardon, 2007). It struck the elderly disproportionately 
hard: the daily mortality rate of the population over 
65 years old rose by 36 % in Barcelona, 44 % in London 
and 105 % in Paris. Moreover the impact of heat on the 
daily mortality rate clearly increased with age (D'Ippoliti 
et al., 2010). Note that on specific days and for specific 
age and gender groups the daily mortality rates may rise 
far beyond these numbers, with excess mortality rates 
up to a factor of three and more (see, e.g. Hémon and 
Jougla, 2004). 
The intense heatwave in Eastern Europe in the 
year 2010 led to an estimated death toll of 55 000 
(Barriopedro et al., 2011). 
The EuroHeat project analysed the cities of Athens, Barcelona, Budapest, London, Milan, Munich, Paris, Rome 
and Valencia. The study estimated that during the consecutive summer months of June to August for the period 
1990–2004 mortality rates increased when heatwaves occurred. The increase ranged from 7.6 % to 33.6 % 
depending on the city in question (D'Ippoliti et al., 2010). 
(4) There is no generally accepted definition of 'heatwave' with the definition differing per country (WHO, 2004) and even per sector. In 
general, a heatwave is a prolonged period of unusually hot weather. 'Unusually hot' obviously depends on the background climate. 
2.1 Heat 
2.1.1 Why are heatwaves an important urban 
challenge? 
In Europe, of those natural disasters occurring 
in recent decades, heatwaves (4) have caused the 
most human fatalities (EEA, 2010c). The European 
heatwave during the summer of 2003 was estimated 
to have caused up to 70 000 excess deaths during a 
four month period in Central and Western Europe 
(Brücker, 2005; Robine et al., 2008; Sardon, 2007) 
(see also Box 2.3). This heatwave demonstrated that 
this issue was not unique to southern Europe. Cities 
Photo: © iStockphoto
Climate change challenges and response options 
Urban adaptation to climate change in Europe 19 
Box 2.4 Heatwaves a problem for the south… 
While preparing their local adaptation strategy the town 
of Cascais in Portugal studied the potential adverse 
health impacts of climate change in the municipality. 
The results show that an increase of 1 °C above the 
threshold of 30 °C led to a 4.7 % increase of the risk of 
mortality. Since all future climate scenarios for Cascais 
indicate significant increases in days with temperatures 
above this threshold, the risk of dying from heat stress 
will rise. 
Cascais is now implementing a number of adaptation 
measures. One project, called the 'Local Green 
Structure', restructures and links several ecological 
corridors, such as gardens, valleys and streams, both 
in natural and urban areas. This structure shall, at the 
same time, protect and restore local biodiversity and 
reduce vulnerability to floods. 
A special contingency plan uses socio-demographic 
variables to map sensitive groups in the municipality, 
e.g. elderly people, people with chronic diseases, 
children. In the event of an alert for a heatwave, local 
hospitals, health centres and civil protection services will 
be called out to support those identified as vulnerable. 
Source: Casimiro et al., 2010; http://www.siam.fc.ul.pt/PECAC. 
… as well as the north 
One would be surprised to learn that heatwaves are considered to be one of the biggest threats to public health 
connected to climate change in Sweden. 
Researchers at the University of Umeå in Sweden have found that death rates rose significantly when the average 
temperature stayed over 22–23 °C for more than two consecutive days. 
During July 2010, the mean temperature stayed above 22 °C for nearly two weeks in most parts of Sweden 
including in Botkyrka in the Stockholm region. Botkyrka was the only Swedish municipality that was prepared 
for heatwaves. Researchers, in conjunction with the municipality, had been collaborating on mapping risks and 
the vulnerable. With the help of Geographic Information Systems (GIS) and using national registers and local 
information, levels of risk and preparedness emerged during the project period of 2008–2010. One fourth of the 
population was deemed to be vulnerable. 
In March 2010, a workshop on heatwaves and health was arranged for all middle management working in the 
social care department of Botkyrka and those involved with responding to emergencies and representatives from 
central office. The social care department then distributed advice and instructions on dealing with heatwaves for 
all relevant municipal services. As a result people that were assisted by the municipal care sector were better 
prepared in Botkyrka during the 2010 heatwave. 
Advice is now published on the municipality's homepage and was personally communicated to people in care 
homes (see Box 2.8). Nevertheless, awareness still needs to be raised for the general public. Furthermore, a map 
marking public 'cool spaces' is in production. 
The project concluded that municipalities have to be more aware and take precautions within the administration 
as a whole. City planning, risk management, the care sector and city leaders will have to take the threat of 
heatwaves into consideration on a more active basis in the future. 
Source: Ingrid Molander, Botkyrka municipality, Christofer Åström and Joacim Rocklöv, Umeå University, personal communication, 
2011; http://www.botkyrka.se/Nyheter/Sidor/Värmebölja-.aspx. 
Photo: © Stelosa 
worse affected were those where heatwave episodes 
had traditionally been rare or where temperatures 
strongly exceeded the usual seasonal conditions 
(D'Ippoliti et al., 2010) such as in Belgium, Germany, 
the Netherlands, Switzerland and, the United 
Kingdom. The example of Botkyrka, Sweden shows 
the combination of a low heatwave threshold for 
northern European countries and how the sensitivity 
can be reduced by raising awareness, changing 
behaviour and appropriate building design 
(Box 2.4).
Climate change challenges and response options 
20 Urban adaptation to climate change in Europe 
(5) Whether or not citizens feel comfortable with the urban micro climate they encounter depends on a complex interaction between 
physical, physiological, behavioural and psychological factors. Apart from the physical and biological factors perception plays an 
important role. 
Athens 32.7 Ljubljana 21.5 Rome 30.3 
Barcelona 22.4 London 23.9 Stockholm 21.7 
Budapest 22.8 Milan 31.8 Turin 27.0 
Dublin 23.9 Paris 24.1 Valencia 28.2 
Helsinki 23.6 Prague 22.0 Zurich 21.8 
Note: An increase in mortality rates was reported when temperatures passed this threshold. 
City-specific estimates of the relevant parameters were obtained from the period 1990–2004. 
Source: Baccini et al., 2008. 
Table 2.1 City specific temperature threshold (°C) — index describing the relative discomfort due 
to combined heat and high humidity 
Heatwaves and human health 
An increase in the mortality rate is the most 
dramatic impact of heatwaves. Exposure to hot 
weather can also have other negative impacts on 
human health and well-being. 
Humans depend on the body's capability to 
maintain internal temperature at around 37 °C. The 
principle mechanisms to prevent thermal stress 
are sweat production, increased cardiac output 
and redirection of blood flow to the skin (Hajat 
et al., 2010). Diminished or delayed physiological 
responses cause people to be extra sensitive to heat 
exposure. In particular the elderly, young children 
and those using certain medication are sensitive to 
heat (Kovats and Shakoor Hajat, 2008) as well as 
pregnant women. 
In addition, socio-economic and behavioural factors 
enhance sensitivity to heat at the community 
level. Such factors include gender, social isolation, 
homelessness, lack of mobility, alcohol use, being 
dressed inappropriately, intensive outdoor labour 
and low income or poverty (Kovats and Hajat, 2008; 
Hajat et al., 2010; Wilhelmi and Hayden, 2010). In 
many cases, in particular in cities, a number of these 
factors act together. For example in low income 
groups people are more likely to be obese and have 
inadequate housing (Kovats and Hajat, 2008; Reid 
et al., 2009). Elderly people are more likely to be 
socially isolated, to be less mobile and to suffer 
from chronic disease while also having reduced 
physiological responses (Luber and McGeehin, 2008; 
Martens, 1998; Hajat and Kosatky, 2009). 
People can, nevertheless, acclimatise to heat to a 
certain extent. Initial physiological acclimatisation is 
fairly fast and may occur after several days through 
increased sweating (Martens, 1998; Haines et al., 
2006). However, even with more comprehensive 
and long term acclimatisation and change of habits, 
temperature and humidity above certain local and 
individual thresholds can place stress on people 
with health implications. 
Since geographic location and average temperature 
are closely linked, mortality related to heat seems to 
be linked with geographic position (Keatinge et al., 
2000; Baccini et al., 2008; Martiello and Giacchi, 
2010). The comfort temperature (5) or heat thresholds 
at which the mortality rate is minimal, is associated 
with the average temperature that communities 
experience (Martens, 1998) and is indeed higher in 
areas closer to the equator (Baccini et al., 2008; Hajat 
and Kosatky, 2009). This is also generally shown 
in Table 2.1, where the comfort temperatures of a 
number of European cities are compared. However, 
there is no clear relation between geographic 
location and the rate of increase of mortality once 
the comfort temperature is exceeded. Reasons could 
include the proportion of elderly residents, the 
gross domestic product, population density and 
behaviour. 
High temperatures during the night play a decisive 
role for the serious health effects during heatwaves. 
Hot days without the relief of cool nights and 
subsequent exhaustion increase the effects (Grize 
et al., 2005; Kovats and Hajat, 2008; Dousset et al., 
2011).
Climate change challenges and response options 
Urban adaptation to climate change in Europe 21 
Meteorological factors Morphological factors Human factors aggravating heat impacts 
Radiation 
Temperature 
Wind speed 
Geographical location and topography 
Vegetation and water areas 
High building mass 
Presence of impervious cover 
Structure that hinders ventilation 
Urbanisation with a high share of built-up land and 
impervious areas 
Population density 
Little shadowing 
Insufficient building insulation 
Additional heat production due to production processes, 
transport, heating etc. 
Table 2.2 Factors determining the strength of the urban heat island effect (UHI) and its impacts 
Beyond the direct health impacts of thermal 
stress, other potential effects of heat on health, 
socio‑economic and environmental impacts include: 
• impacts on well-being (psychological impacts, 
increased violence and social unrest); 
• impacts on water resources (water pollution 
caused by a combination of low water flow and 
heat; water shortages; changes in patterns of 
vector-borne diseases); 
• impacts on economy and infrastructure (reduced 
productivity of workers in conditions of 
extreme heat; increased hospital admissions and 
pressure on care services in summer; increased 
failure of transport networks in summer, but 
less in winter; increased demand for cooling in 
summer, but decreased demand for heating in 
winter; Failure of power supplies (Wilby, 2008; 
Schauser et al., 2010; EEA et al., 2008; Oke, 1982); 
• changes in patterns of vector-borne diseases. 
The Urban Heat Island effect 
The impact of heatwaves is particularly strong in 
cities and towns. The so-called 'Urban Heat Island' 
(UHI) describes the increased temperature of the 
urban air compared to its rural surroundings. The 
temperature difference can be up to 10 °C or more 
(Oke, 1982). The difference is particularly stark at 
night. Even relatively small towns can experience a 
considerable UHI (Steeneveld et al., 2011). Factors 
determining the strength of the UHI are summarised 
in Table 2.2. 
Urbanisation and human activities essentially 
alter the balance between the energy from the sun 
absorbed by the surface, then stored in the building 
mass and later released to the surrounding air. Most 
notably, the cooling effect of vegetated surfaces 
is replaced by the storage of heat in surfaces such 
as concrete, asphalt and stone. The effect of this 
alteration is clearly visible in Map 2.2, which reveals 
much higher surface temperatures in areas of 
Budapest with a higher degree of soil sealing. 
Thus, the intensity of heatwaves in towns and cities 
is influenced by the urban fabric and design (Oke, 
1982; Arnfield, 2003; Wilhelmi et al., 2004). Since 
the urban fabric shows large amounts of variation 
the intensity of the UHI would reflect this. This can 
cause spatial variations of heat effects within cities 
as well as between cities (Smargiassi et al., 2009; 
Heusinkveld et al., 2010; Dousset et al., 2011; Knight 
et al., 2010). The hottest parts in cities and towns 
are generally those with numerous tall buildings, 
without green spaces and including areas generating 
large amounts of anthropogenic heat (EEA et al., 
2008). 
Wind plays a special role in the interaction between 
the urban fabric and weather, not only because 
reduced wind speed generally increases UHI 
strength (Oke, 1987; Wilby, 2008), but also because 
so-called 'wind-paths' may offer opportunities 
to ventilate cities. Streets, oriented in the same 
direction as wind flow, tend to channel the air into
Climate change challenges and response options 
22 Urban adaptation to climate change in Europe 
jets called urban wind canyons. During calm and 
clear nights associated with a strong UHI level, air 
rises over the city and induces a horizontal flow of 
air from the rural environment into the city (Oke, 
1987; Kuttler, 2008) (see the Stuttgart example in 
Box 2.5). 
Map 2.2 Degree of soil sealing (left) and observed surface temperature (right) in Budapest, 
Hungary 
0 30 50 80 100 
Degree of soil sealing (%) 
Degree of soil sealing (impermeability) of Budapest 
 15 16 19 22 25 28 31 34 35 36 37 40 43  45 
Temperature (°C) 
Surface temperature of Budapest, 1 August 2005, 9:30 CET 
0 5 10 Km 
Note: The lower surface temperature in areas with urban green and water can clearly be seen. Although surface temperature does 
not equal air temperature, surface temperature is often used to detect the UHI, in the form of the so-called surface UHI. 
Source: EEA, 2010b; Ongjerth et al., 2007; Gábor et al., 2008. 
Climate change essentially increases the number of 
hot days by a similar amount for both urban and 
rural situations. However, the number of additional 
hot nights is larger in cities than in the countryside. 
Urban areas store more heat during the day than 
greener rural areas and release this heat during the 
night.
Climate change challenges and response options 
Urban adaptation to climate change in Europe 23 
Box 2.5 Stuttgart managing urban heat island effects 
Stuttgart's climate planning strategy is an excellent example of urban heat island management. The city of 
Stuttgart has been designed to not only respect and protect nature, but to exploit how natural wind patterns and 
dense vegetation can actively help the city to reduce its problems of overheating and air pollution. At night cool air 
sweeps down from the surrounding hills and runs through a series of 'ventilation-corridors' which have been kept 
open as wide, tree-flanked arteries within the city's street infrastructure. 
Map 2.3 Climate analysis map for the Stuttgart region, also showing so-called ventilation 
paths along with other climate related features 
Areas of cold air 
Areas of production of cold air 
Areas of collection of cold air 
Barrier for the flow of cold air 
Air exchange 
Mountain/valley wind system 
Downhill flow of cool air 
Clean air ventilation corridor 
Polluted air ventilation corridor 
Source: Baumüller and Verband Region Stuttgart, 2008; Klimaatlas Region Stuttgart; http://www.stadtklima-stuttgart.de/ 
index.php?klima_klimaatlas_region.
Climate change challenges and response options 
24 Urban adaptation to climate change in Europe 
2.1.2 What are the potential impacts of heat on 
Europe's cities? 
Future exposure to heat in European cities 
Europe has seen an increase in temperature of 0.3 °C 
per decade since the 1970s and has experienced 
an increase in the number of heat incidents in the 
past two decades (Klein Tank and Können, 2003). 
At least two summers in the last decade (2003 and 
2010) have in all likelihood been the warmest of the 
last 500 years in Europe (Barriopedro et al., 2011). 
Climate change scenarios indicate that there will 
be an increasing probability of mega heatwaves 
(prolonged heatwaves over large areas such as those 
observed in 2003 and 2010) over highly populated 
areas of Europe (Barriopedro et al., 2011). It is very 
likely that the length, frequency and/or intensity of 
warm spells, or heatwaves, will increase (Fischer 
and Schär, 2010; IPCC, 2012). 
Southern Europe in particular is affected by hot 
summer days and tropical nights. Projections in 
Map 2.4 indicate an increase in the number of 
combined tropical nights and hot days in the future 
and also a clear northward expansion of the affected 
regions (Fischer and Schär, 2010). Temperature 
extremes as well as the duration of heatwaves 
Increase in the number of combined tropical nights (minimum temperature exceeding 20 °C) and hot days (maximum 
temperature exceeding 35 °C) under present and future climate conditions 
2 6 10 14 18 22 26 30 34 38 42 46 50 
ENS MEAN 1961–1990 ENS MEAN 2021–2050 ENS MEAN 2071–2100 
°C 
Map 2.4 Increase in the number of combined tropical nights (minimum temperature exceeding 
20 °C) and hot days (maximum temperature exceeding 35 °C) under present and future 
climate conditions 
Source: Fischer and Schär, 2010. 
are expected to increase further (Sterl et al., 2008; 
Barriopedro et al., 2011). The exceptional summer 
of 2003 may be viewed as normal in the mid-21st 
century (Fischer and Schär, 2010; Schär et al., 2004). 
Cities' sensitivity to heat 
The scenario above notes the increase in regional 
heatwave days. However, it does not take into 
account the impact on the urban fabric and the 
resulting exacerbated heatwave effect in cities. The 
scenario underestimates in particular the number of 
tropical nights in cities, which are decisive for health 
impacts. 
Map 2.5 provides a first assessment of the possible 
future heat impacts on European cities. Here the 
scenario map for the period 2071–2100 is overlaid 
with population density and the percentage share 
of green and blue areas in major European cities. 
Both provide a proxy to the urban heat island effect. 
Population density is associated with variables 
such as building density, green/blue area share and 
anthropogenic heat production (Steeneveld et al., 
2011). The influence of green and blue urban areas 
has been explained in Section 2.1.1.
Climate change challenges and response options 
Urban adaptation to climate change in Europe 25 
The map indicates a large number of cities with 
large UHI potential in the north-west due to 
low shares of green and blue urban areas and 
in particular south-eastern of Europe where, in 
addition, population densities are higher. In the 
western part of the Mediterranean area, the UHI 
potential seems to be quite variable, with a mix of 
cities with both strong and weak UHI potential. 
Comparing expected heat exposure changes with 
the UHI potential reveals that a large share of cities 
in eastern and southern Europe will experience 
relatively strong increases in heat load in the future. 
If the heatwave intensity expands more to the 
north‑west than expected from the results shown 
40° 50° 60° 
30° 
30° 
20° 
20° 
10° 
10° 
0° 
-30° -20° -10° 0° 
60° 
60° 
50° 
50° 
40° 
40° 
0 500 1000 1500 km 
Heat waves — both a low 
share of green and blue 
urban areas and high 
population densities 
contribute potentially to 
the urban heat island 
in cities 
 20 
20–29 
30–39 
 40 
Green/blue areas per city 
(UMZ), 2006 (%) 
Population density per city 
(UMZ), 2004 (inh./km2) 
 3 000 
3 000–4 000 
4 000–5 000 
5 000–10 000 
 10 000 
Number of combined tropical 
nights ( 20 °C) and hot days 
( 35 °C), 2070–2100 
2 10 18 26 34 38 42 50 
Map 2.5 Heatwaves — both a low share of green and blue urban areas and high population 
densities can contribute to the urban heat island effect in cities 
Note: The background map presents the projection for the period 2071-2100. Values for the earlier periods are presented in 
Map 2.4. 
City data for Bulgaria and Ireland are from 2001; the concept of city is defined uniquely by the urban land-use areas within 
its administrative boundary. 
Source: Eurostat, Urban Audit database, 2004; EEA Urban Atlas, 2006. 
here (see other indicators used by Fischer and Schär, 
2010), cities in the Benelux countries and the United 
Kingdom would also be more affected. 
These results suggest that those cities physically 
sensitive to heat impacts do not cluster in one 
region only. There are indeed highly sensitive cities 
in regions with an expected high heat load which 
need specific consideration but northern cities are 
also sensitive and deserve consideration. At the 
same time some cities in southern Europe seem 
to be less physically sensitive than others. Local 
city characteristics tend to be more important than 
similar regional characteristics. The share of cities in 
a country which has relatively little green and blue
Climate change challenges and response options 
26 Urban adaptation to climate change in Europe 
areas is particularly high in Hungary and Greece as 
well as Cyprus, Estonia, Ireland, Luxemburg and 
Slovakia (Figure 2.2). 
Population density and the share of green/blue 
urban areas provide a reasonable initial estimate 
for UHI at the city level and can also serve as a 
European overview on potential hotspots. For more 
complex city planning it is clearly too simplistic. 
Additional factors and variations with the city 
need to be taken into account. Regarding the cities' 
0 20 40 60 80 100 
Hungary 
Greece 
Cyprus 
Estonia 
Ireland 
Luxembourg 
Slovakia 
France 
United Kingdom 
Germany 
Italy 
Czech Republic 
Spain 
Bulgaria 
Romania 
Netherlands 
Denmark 
Austria 
Belgium 
Malta 
Slovenia 
Poland 
Lithuania 
Portugal 
Finland 
Latvia 
Sweden 
Percentage of cities in the country per class 
Share of green and blue areas of the city area 
 20 % 20–29 % 30–39 %  = 40 % 
% 
Figure 2.2 Percentage of green and blue urban areas — share of cities per class per country 
(based on Map 2.5) 
Note: Generally, only cities with more than 100 000 inhabitants are considered. 
sensitivity to heat not only is the share of green and 
blue areas important, but also their distribution, 
green facades and roofs as well as shadowing and 
ventilation. Climate analysis of the city of Arnhem in 
the Netherlands shows such an example (Map 2.6). 
The map clearly shows the variability of the risk 
related to heat in the city with red areas indicating 
the warmest city parts. The potential for ventilation 
(marked in black) is related to natural air flow along 
rivers and on downwards trajectories.
Climate change challenges and response options 
Urban adaptation to climate change in Europe 27 
Map 2.6 Urban climate analysis map for the city of Arnhem, the Netherlands 
Source: www.future-cities.eu. 
Social sensitivity 
The majority of people in Europe live in urban areas 
and high population densities are already present 
in European cities. The number of urban dwellers 
will further increase in the near future (UN, 2010). 
As explained previously, some population groups 
are more sensitive to heat than others. Of special 
importance in terms of sensitivity to heat are senior 
citizens aged 65 years and over. This population 
group currently constitutes about 17.1 % of the total 
population of Europe, but this share is expected to 
rise to 30 % by the year 2060. The share of people 
aged 80 years or older (4.4 % in 2008) will nearly 
triple by 2060 (Schauser et al., 2010; Eurostat, 
2008). This demographic trend will naturally bring 
increased heat-related mortality rates even without 
climate change if no adaptation measures are taken. 
However, demographic development in cities does 
not necessarily follow regional trends. There are at 
present no European wide demographic projections 
available at the city level. 
Bearing in mind the many uncertainties sketched 
above, Map 2.7 and Figure 2.3 provide a first 
impression of European wide differences regarding 
the social sensitivity of cities to heat. The map 
shows the total population in 2004 and the share 
of elderly people as a proportion of population 
within the major European cities in Europe. The 
proportion of elderly people in cities is higher in 
countries in the area of Europe stretching from 
Italy to Germany and in northern Spain. In Belgium 
and Germany this proportion usually follows the 
country average. Cities in northern Italy, meanwhile, 
tend to have values above the country average. For 
other countries such as Bulgaria, France, Romania, 
southern Spain and the United Kingdom the share 
of elderly people in most cities is lower than in rural 
areas. 
The composition regarding age is not the only 
factor that determines social sensitivity. Those on 
low incomes, the disabled and sick, young children 
and ethnic minorities are classified as vulnerable 
Urban climatic analysis 
map of Arnhem city 
Fresh air area 
Cool air area 
Mixed climate 
Overheating 
Overheating 2 
Overheating 3 
UMC classification 
Ventilation 
High potential 
Low potential 
Background winds 
Thermal induced 
circulations 
Turbulances 
abcd Subclassifications 
Administrative 
border 
Mainroads 
Railways 
d 
d 
d 
b 
c 
b 
b 
b 
a 
b 
a
Climate change challenges and response options 
28 Urban adaptation to climate change in Europe 
Map 2.7 Vulnerable people — the elderly are considered to be a group more sensitive to various 
climatic stress factors than people of a working age 
Note: Total population in cities; proportion of population aged ≥ 65. 
Data for Bulgaria, Cyprus, Czech Republic, Finland, France, Ireland and Latvia are from 2001. 
Source: Eurostat, Urban Audit database, 2004. 
50° 60° 70° 
40° 
40° 
30° 
30° 
20° 
20° 
10° 
10° 
0° 
-30° -20° -10° 0° 
60° 
50° 
50° 
40° 
40° 
0 500 1000 1500 km 
Vulnerable people — 
the elderly are considered 
to be a group more 
sensitive to various 
climatic stress factors 
than people of a 
working age 
Proportion of aged population 
 65 in cities/countries, 2004 
Total population in cities, 
2004 
 100 000 
100 000–250 000 
250 000–500 000 
500 000–1 000 000 
 1 000 000 
No data 
 14 
14–15 
15–17 
 20 
17–20 
Outside data 
coverage 
(Schauser et al., 2010). Further influences include 
such varied socio-economic characteristics as the 
quality of the health care system, availability of 
heat-health warning systems as well as cultural 
and behavioural aspects. Such factors are also 
intertwined with physical factors such as the quality 
of the buildings (thickness of walls, isolation, or 
availability of air‑conditioning), application of green 
structures in roofs and facades and accessibility of 
public green and blue spaces (Harlan et al., 2006; 
Uejio et al., 2011). 
Potential future impacts 
Climate change projections indicate a rise in the 
number of heat-related deaths. The PESETA study 
projected almost 86 000 additional deaths per year 
in 2071–2100 in the EU-27 Member States compared 
to the 1961–1990 EU-25 average — albeit under a 
much more severe climate change scenario (EEA 
et al., 2008). Koppe et al., 2004 project a rise by up 
to 20 % until the year 2050 in Germany and Dessai 
(2003) by 35 % to six fold in Lisbon, Portugal. These
Climate change challenges and response options 
Urban adaptation to climate change in Europe 29 
Figure 2.3 Percentage of population aged ≥ 65 — share of cities per class per country 
(based on Map 2.7) 
Note: Generally, only cities with more than 100 000 inhabitants are considered. 
0 20 40 60 80 100 
Germany 
Belgium 
Italy 
Slovenia 
Austria 
Estonia 
Sweden 
Spain 
Czech Republic 
Portugal 
Latvia 
United Kingdom 
Greece 
Hungary 
France 
Finland 
Netherlands 
Bulgaria 
Poland 
Cyprus 
Denmark 
Ireland 
Lithuania 
Luxembourg 
Romania 
Slovakia 
Percentage of cities in the country per class 
Share of population age  65 of total city population 
 20 % 18–20 % 16–17 % 14–15 %  14 % 
% 
deaths can be mainly expected in urban areas where 
the effects culminate. There are several intertwined 
trends — climatic and non-climatic — which make 
population in cities more vulnerable to climate 
change: global warming, increased urbanisation and 
population ageing. 
Besides the impacts on health, a number of 
socio‑economic and environmental impacts 
resulting from higher temperatures and heatwaves, 
such as problems in energy supply and maintaining 
transport services or water supply, will occur 
(Schauser et al., 2010). These can trigger additional 
socio-economic challenges in the form of lower 
productivity, failure of services, higher energy 
demand for cooling etc. There is currently not 
enough information available to assess these future 
impacts in cities across Europe. 
In addition, higher temperatures trigger certain air 
quality problems in cities. Part of the health effects 
and increased rate of mortality resulting from 
heatwaves may be caused by decreased air quality in 
the urban environment (Box 2.6).
Climate change challenges and response options 
30 Urban adaptation to climate change in Europe 
Box 2.6 Air quality problems due to higher temperatures 
Air pollution in urban areas not only places additional stress on humans, but some pollutants have synergies with 
heat (Nawrot et al., 2007). Hot weather exacerbates air pollution through increased formation of ground-level 
ozone and, because hot periods usually coincide with dry periods, more particulate matter remains in the air 
(EEA, 2010d). Evidence for a synergistic effect on the mortality rate due to high temperatures and ozone-levels is 
increasing (Bell et al., 2005; Medina-Ramón et al., 2006; Stedman et al., 1997). Hence, part of the health effects 
and increased mortality during heatwaves may therefore be caused by decreased air quality (Filleul et al., 2006). 
Previously, hot, dry summers with long-lasting periods of high air pressure over large parts of Europe led to 
elevated concentrations of ozone which exceeded the minimum threshold values for health risks. Analysis on a 
number of cities in the United Kingdom showed that between 21 to 38 % of those affected were not caused by 
heat, but by smog and particulate matter (Stedman, 2004). A study of a severe heatwave in Greece in 1987 
showed that the effects in Athens were much stronger than in other, less polluted Greek cities (Katsouyanni, 
1995)). Figure 2.4 shows a high percentage of the urban population affected by high ozone levels in 2003. This 
was a year when large parts of Europe were affected by a heatwave (EEA, 2011a; EEA, 2011b). Increasing 
temperatures and heatwaves in the future are expected to exacerbate the existing ozone problem. Forsberg et al., 
2011 projects an increase of ozone-related deaths over the next 60 years in Europe, with 10 to 14 % increase 
being marked for Belgium, France, Portugal and Spain. 
Temperature is clearly not the only predictor of ground-level ozone concentrations. The main drivers are the 
concentrations of ozone precursors: NOX and volatile organic compounds (VOCs). NOX are emitted during fuel 
combustion for example by road transport and industrial facilities. VOC are emitted from a large number of 
sources including paint, road transport, refineries, dry-cleaning and other solvent uses. Biogenic VOC are emitted 
by vegetation, with amounts released dependent on temperature. Methane (CH4), also a VOC, is released from 
coal mining, natural gas extraction and distribution, landfills, wastewater, ruminants, rice cultivation and biomass 
burning (EEA, 2011b). Further reducing the emissions of ozone precursors is therefore an option to reducing 
periods with high ozone levels and adopting adaptation measures to more frequent heatwaves and warm weather 
periods in the future. NOX and VOC emissions also need to be reduced in order to protect the population against 
the resulting direct health impacts. 
Typical measures to improve air quality are therefore also supportive when coping with higher temperatures and 
heatwaves. These include the promotion of walking, cycling and the use of public transport; restrictions for road 
traffic; use of cleaner emission technology for transport, heating and cooling systems; creation of green areas, 
such as parks, can absorb and filter dust and other pollutants; and awareness raising and educating vulnerable 
groups to avoid certain activities during events of high air pollutant concentrations (CoR, 2011a; EEA, 2010b; 
VÁTI, 2011). 
0 
25 
50 
75 
100 
1997 1998 1999 2000 2001 2002 2003 2004 2005 2006 2007 2008 2009 
% of urban population 
0 days 0–25 days 25–50 days  50 days 
Figure 2.4 Percentage of the EU and EEA-32 urban population potentially exposed to ozone 
concentrations over the target value threshold set for protection of human health, 
1997–2009 
Source: EEA, 2011c (CSI 004).
Climate change challenges and response options 
Urban adaptation to climate change in Europe 31 
2.1.3 How can cities adapt to heat stress? 
The use of grey infrastructure — cooling for 
buildings and urban areas 
Due to the expected increase in the number of hot 
days and heatwaves, it is anticipated that demand 
for air conditioning will increase. However, an 
increase in the use of air conditioners produces 
additional heat outside buildings and generates 
more greenhouse gases. Therefore, passive measures 
to provide cool spaces should be considered first — 
building designs that keep rooms cool via insulation 
(thick and well-designed walls, small windows, 
double glazing and the correct choice of materials) 
or blinds and public space providing shade and 
natural ventilation. 
It is common that insulation measures are already 
considered as ways to reduce energy consumption 
and mitigate climate change. Integrating the 
adaptation concerns would provide even greater 
benefit to these measures. In the event that active 
cooling of buildings continues to be necessary, 
the most energy efficient air conditioning systems 
should be used and promoted through the Eco 
Labelling Directive (EC, 2000a) and awareness raising 
campaigns. District cooling is also an energy‑efficient 
way to prioritise absorption cooling (which allows 
the use of excess heat from other processes) over 
compression cooling (which mainly uses electric 
energy). In Vienna, as well as in Dresden, district and 
local cooling are combined together. 
Table 2.3 Overview on grey, green and soft adaptation measures to heatwaves following the 
structure of Box 2.2 
Grey measures Green measures Soft measures 
• Building insulation to keep 
the inside cool 
• Blinds to provide shade 
• Passive cooling of buildings 
• Urban designs providing 
shade 
• Ventilation of urban space by 
intelligent urban design 
• Emission reduction of air 
pollutants 
• Boosting green infrastructure, 
such as green urban areas, 
trees, green walls and roofs 
where possible, but ensuring 
sustainable watering 
• Ensuring that fresh air from 
green areas outside the city 
can flow in 
• General awareness raising and ensuring broad participation 
• Mapping of urban heat island as well as cool places 
• Identification of vulnerable groups and their distribution as 
basis for targeted action 
• Warning systems 
• Heat action plans including appropriate institutional structures 
• Preparedness of health and social care system 
• Information on adapting behaviour during heatwaves in 
particular to the vulnerable 
• Adapting building codes to include insulation and shadowing 
to cope with heatwaves 
• Consider reducing heatwave impacts through urban renewal 
projects and urban planning 
• Transport management to reduce air pollutants 
The use of green infrastructure 
Conservation and improvement in existing green 
and blue areas in cities and the creation of new 
spaces to ameliorate the urban heat island effect 
is hugely important and can have a number of 
additional benefits such as creating areas for 
recreation, biodiversity, filtering air and draining 
and storing water. Vegetation provides cooling 
through shading and enhanced evapotranspiration. 
Parks and open water areas are essential. Green and 
blue roofs lower temperature in buildings during 
the summer through insulation and enhancing 
evapotranspiration. Vegetation areas have a 
significant effect on the local climate as they incite 
the production of fresh and cold air, particularly 
at night, and have a thermally balancing effect 
during the day due to a high percentage of trees 
(SustainableCities.dk). Box 2.7 provides an example 
from Manchester with the issue being further 
elaborated in Chapter 3. The European Commission 
encourages green solutions as well, considering 
green infrastructure as an essential tool for climate 
change mitigation and adaptation. Investing in and 
building up green infrastructure needs smart and 
integrated approaches to spatial planning to ensure 
that Europe's limited land is turned into areas 
capable of providing multiple functions for nature 
and society (EC, 2012a). 
Green infrastructure needs to be established in a 
careful way. The selection of plants needs to consider 
local water availability and potential scarcity.
Climate change challenges and response options 
32 Urban adaptation to climate change in Europe 
The introduction of invasive alien species or the 
replacement of natural areas by artificial green areas 
can have negative impacts on biodiversity. 
Soft measures 
Awareness and behaviour changes 
Awareness of the local population regarding effects 
of excessive heat on human health coupled with 
information on simple measures to prevent excessive 
heat stress enhances a city's preparedness. Such 
measures can reduce sensitivity to heat exposure at 
the individual and community level. Simple heat 
warning advices from 'avoid drinking alcohol' to 
'wear a hat' can be very effective (see Box 2.8 for a 
Swedish example). 
Box 2.7 Manchester, United Kingdom — increasing green infrastructure helps to cool down 
The modelling of surface temperatures in the 
conurbation of Greater Manchester has shown that 
they closely followed the pattern of areas covered by 
vegetation in the urban area. In town centres and areas 
of retail or industry (20 % vegetative area) the surface 
temperatures reached 31.2 °C on a hot summer day. 
By contrast, in woodlands (98 % vegetative area) the 
surface temperature was only 18.4 °C. While climate 
change will lead to an increase of temperatures in every 
part of the city, green space will significantly buffer some 
of the predicted warming. By 2080, under a high CO2 
emissions climate change scenario, surface temperatures 
would rise to 35.5 °C in the town centres (+ 4.3 °C), 
but just 21.6 °C in woodlands (+ 3.2 °C). If the amount 
of green space decreased by 10 % in town centres and 
other densely built-up areas, the surface temperature 
under the high emissions scenario could rise by as much 
as 8.2 °C by 2080 from the present 31.2 °C. On the 
other hand, an increase of green areas by 10 % would 
keep the maximum surface temperatures at nearly 
the same level as the 1961–1990 baseline conditions 
(Gill et al., 2007). 
Thus, the quantity of green spaces in the city is important for managing temperatures and other climate change 
impacts. The on-going project by Manchester City Council, 'City Centre Green Infrastructure Plan', recognises 
this factor and identifies where urban greening is the most needed. It also identifies actions needed for 
implementation. On a broader scale the Greater Manchester green infrastructure framework is currently being 
implemented addressing the areas of green space need and deficiency across the conurbation, with climate change 
adaptation as one of the guiding principles. 
Source: http://www.greeninfrastructurenw.co.uk/resources/1547.058_Final_Report_September_2008.pdf. 
Health warning systems and heat action plans 
Awareness raising is usually one of the components 
of so-called heat action or heat warning plans 
(Ebi et al., 2004; S. Hajat et al., 2010). The World 
Health Organisation Europe (WHO Europe) has 
published guidance on how to develop such 
plans (Barredo, 2009; Matthies et al., 2008)). The 
development of a Heat Health Watch Warning 
System (HHWWS) can be considered as a long 
term option to address heatwaves and other high 
temperature events. This usually comprises of 
a menu of individual options to respond to and 
prepare for extreme temperature events. Successful 
systems comprise of 
• An agreement of a leading body to coordinate 
a multipurpose, collaborative mechanism 
between bodies and institutions and to direct the 
channelling of information flows in the event of 
an emergency; 
Photo: © Bogna Kazmierczak
Climate change challenges and response options 
Urban adaptation to climate change in Europe 33 
Box 2.8 Botkyrka, Sweden: Tips on what to do in the event of a heatwave 
• Avoid unnecessary efforts. Assist with food 
shopping. Stop immediately what you are doing 
if you become dizzy or tired. Seek help if you feel 
unwell. 
• Avoid stressful and unnecessary travel plans. 
Remember that it is often cooler in the morning and 
hottest early in the afternoon. 
• Do not stay in the sun. Choose cool and shaded 
places when you are outdoors. 
• Stay, where possible, in air conditioned or cool 
rooms. Select the coolest room in the house and 
ventilate during the night. 
• Note that fans may cool down unless it is extremely 
hot in the room then they can cause dehydration. 
• Libraries, restaurants and shopping centres may be 
air conditioned. 
• Take a shower every day to stay cool. 
• Choose light clothes which 'breathe'. 
• Drink adequate amounts, preferably before you get thirsty. Water is fine, but avoid alcohol and very sweet 
drinks. Overly cold drinks can cause cramps. Request medical advice on fluid intake or if you use diuretics, ask 
your doctor about the appropriate action. 
• Avoid hot drinks or eating overly hot food as this raises the body temperature. 
• Replace salt and minerals in your body if you sweat heavily. Mineral water and sport drinks work well. 
• Keep in regular contact with relatives, friends or neighbours. If you are old or sick, ask someone to stay in 
touch with you. 
• Follow weather reports and bear in mind that health problems increase with an average daily temperature for 
more than two consecutive days over 22–23 °C. 
Source: Botkyrka kommun, 2011; http://www.botkyrka.se/Nyheter/Sidor/Värmebölja-.aspx. 
• Accurate and timely alert systems (systems 
trigger warnings, determine the threshold for 
action and communicate the risks); 
• Heat-related health information plan (what is 
communicated, to whom and when); 
• Reduction of indoor heat exposure (medium‑and 
short-term strategies; advice to the public 
on how to keep indoor temperatures low during 
heatwaves); 
• Particular care for vulnerable population groups; 
• Health and social care system preparedness 
(staff training and planning, appropriate health 
care and the physical environment); 
• Real-time surveillance and evaluation of 
measures (Matthies et al., 2008). 
After the heatwave of 2003 several countries such 
as France, Hungary, Portugal, and the United 
Kingdom established national HHWWS. In Spain a 
HHWWS was established at the regional level in the 
province of Catalonia. Such systems already exist in 
several German federal states and the Netherlands. 
A number of municipalities across Europe have 
established similar systems adopting those elements 
from those national plans relevant and feasible for 
them (e.g. Madrid, Barcelona, Paris, Lyon, Marseille, 
Rome, Milan, Verona, London and Budapest. The 
'Heat Alert' system in Budapest is coupled with 
a smog alert system and an UV alert system. It 
showed success in 2007 when mortality rates due to 
the extreme event had been lower in comparison to a 
similar period in 2003 (Paldy and Bobvos, 2010). 
Photo: © Sekkha
Climate change challenges and response options 
34 Urban adaptation to climate change in Europe 
Stakeholder involvement 
All relevant municipal stakeholders (e.g. municipal 
departments, public health services, meteorological 
services, hospitals and other medical institutions, 
schools, kindergartens, transport companies, mass 
media, local environmental protection organisations 
and companies) have their own 'protocol of 
activities' and the mandate to carry out these actions 
in the event of a heatwave. In Paris the city council's 
climate plan encourages elderly and disabled 
citizens to be listed on a special extreme heat 
register (CHALEX) (Mairie de Paris, 2011). Through 
an emergency number these vulnerable groups 
can acquire information on heat stress prevention 
measures and request a home visit when necessary. 
Volunteers and charities can play a major role in risk 
situations. An example is the Big Response project 
in the United Kingdom. The National Council for 
Voluntary Organisations in the United Kingdom, 
together with the Green Alliance and Global Action 
Plan, have completed a pilot project with four 
Further reading 
• Shaw, R., Colley, M. and Connell, R., 2007, Climate change adaptation by design: a guide for sustainable 
communities, TCPA, London (www.preventionweb.net/files/7780_20070523CCAlowres1.pdf). 
• Matthies, F., Bickler, G., Cardenosa Marin, N. and Hales, S., 2008, Heat-health action plans — Guidance, 
WHO Regional Office for Europe, Copenhagen, Denmark (http://www.euro.who.int/__data/assets/pdf_ 
file/0006/95919/E91347.pdf). 
• CoR, 2011a, Adaptation to Climate Change: Policy instruments for adaptation to climate change in 
big European cities and metropolitan areas, European Union, Committee of the Regions, Brussels 
(http://80.92.67.120/en/documentation/studies/Documents/Adaptation%20to%20Climate%20Change/ 
EN.pdf). 
• Kazmierczak, A. and Carter, J., 2010, Adaptation to climate change using green and blue infrastructure. 
A database of case studies, University of Manchester, United Kingdom (http://www.grabs-eu.org/ 
membersArea/files/Database_Final_no_hyperlinks.pdf). 
major UK charities to assess how the changing 
climate could directly affect their constituents and 
to provide input on what is needed now to protect 
services and people in the future (NCVO, 2012). 
Mainstreaming into existing programmes, plans 
and policies 
Additional soft options include the integration 
of adaptation concerns into local, national and 
European building codes, namely the demand for 
insulation and the provision of shade. The early 
integration of climate change adaptation into urban 
planning, such as a network of green areas, offers 
a more cost effective and long term solution than 
retrofitting the city with less optimal measures 
(note the Stuttgart example mentioned previously). 
In Copenhagen planning law demands that all 
new buildings with flat roofs have to be greened 
(Københavns Kommune, 2012).
Climate change challenges and response options 
Urban adaptation to climate change in Europe 35 
2.2 Flooding 
Key messages 
• In Europe the natural hazards which have caused the greatest economic losses are flooding and storms. 
2002 proved to be a record year with major flood events in six EU Member States and material damages rising 
to more than USD 21 billion Many European cities have to deal with flood risk management issues on a regular 
basis. 
• In a warmer climate projections show a further increase in: 
- the risk of river floods in many western European and central eastern European areas; 
- of urban drainage flooding in in particular western and northern Europe; 
- the risk of coastal floods in particular for cities along north-western European, northern Italian and Romanian 
coasts due to sea level rise in combination with storm surges. 
• Local city characteristics tend to be highly important along with regional characteristics in terms of impacts 
from projected increases in floods and intensive precipitation events. 
• Cities can carry out a number of actions to enhance their protection against flood damage. These are not 
limited to 'grey' flood protection and appropriate urban designs but also green solutions (space for rivers) and 
various 'soft' solutions. 
• Flood risks in a city can be strongly influenced by factors outside the city boundaries such as upstream river 
management. It requires a regional approach for solving the urban flood problems. 
2.2.1 What are the challenges for cities regarding 
flooding? 
Cities and flooding 
Between 1950 and 2006, there have been 12 flood 
events in Europe (flash floods and river floods) 
with the number of fatalities exceeding 100 in each 
case (Barredo, 2006). The severe floods in Europe 
in the first part of this century were mostly caused 
by heavy rain events. The year 2002 proved to 
be a record year with major flood events in six 
EU Member States (Austria, Czech Republic, France 
Germany, Hungary and Romania). The total number 
of deaths was 78 with material damage rising to 
more than USD 21 billion (Genovese, 2006; Barredo, 
2006 and 2009). Rivers have historically been and 
continue to be important transport routes. Therefore, 
most of Europe's large cities and conurbations are 
located along major rivers. For the same reasons of 
accessibility coastal areas have a concentration of 
major cities. 
Many European cities have to deal with flood risk 
management issues on a regular basis (Barredo, 
2006; Lugeri et al., 2010). The high economic losses 
caused by floods include damage to infrastructure, 
public and private property due to the flooding 
itself, erosion or landslides, indirect losses in or 
beyond the flooded areas such as interrupted power 
generation and deteriorated groundwater quality 
caused by pollution or salinization in coastal areas. 
Socio-economic challenges in the form of lower 
productivity, failure of services, loss of jobs and 
income sources pose additional problems. 
In addition, floods cause loss of life and disease. 
The latter is due to the exposure to contaminated 
surface water (e.g. contaminated with sewage water 
or toxic heavy metals). People can also suffer from 
post-traumatic stress disorder (PTSD). Children, the 
elderly and people in poor health are also at risk. 
Table 2.4 shows four categories of flood impacts in 
urban areas.
Climate change challenges and response options 
36 Urban adaptation to climate change in Europe 
In Europe, different types of floods appear (Box 2.9). 
Floods in urban areas can be attributed to one 
or several of these types. In addition, extreme 
precipitation events can deplete the urban drainage 
Table 2.4 List of potential flood impacts in urban areas 
Material impacts Economic impacts Health impacts Emergency assistance 
impacts 
Damage to: 
• residential, commercial and 
public buildings, space and 
assets; 
• transport infrastructure; 
• public utility objects and 
networks (electricity, 
communication, gas, water); 
• other vulnerable objects, 
e.g. petrol stations. 
• Disruption of electricity 
network; 
• disruption of communication 
network; 
• disruption of traffic: Motor 
vehicles, public transport, 
bicycles, emergency services; 
• loss of business. 
• Death; 
• health impacts due to contact 
with contaminated flood 
water; 
• health impacts due to damp 
and associated fungi; 
• citizens' experience of all 
relevant impacts in a flood 
event — post traumatic stress 
disorder due to dislocation 
and loss. 
• Fire department services; 
• policy department services; 
• sewer management services; 
water board services. 
Source: Adapted from van Riel, 2011. 
Box 2.9 Types of flooding affecting urban areas 
River floods are triggered by heavy rainfall, melting 
snow in upstream areas or tidal related influences. 
Ground conditions such as soil, vegetation cover and 
land use have a direct bearing on the amount of run‑off 
generated. River floods occur when the river run-off 
volume exceeds local flow capacities due to intensive 
rainfalls. The river's level rises slowly and the subsequent 
period of rise and fall is particularly long, lasting several 
weeks or even months, particularly in areas with flat 
slopes and in deltaic areas. Those drainage or flood 
control works upstream failing or being poorly operated 
can also sometimes lead to riverine flooding. 
Flash floods occur as a result of the rapid accumulation 
and release of run-off waters from upstream mountainous 
areas, which can be caused by extreme rainfall, cloud 
bursts, landslides, the sudden break-up of a dike or 
failure of a flood control works. Over natural watersheds 
they typically occur in the instance of more than 200 mm 
of rain during less than six hours, while in built-up areas even rainfall of 50 mm within one hour can produce a local 
flash flood. They are characterised by a sharp rise followed by a relatively rapid decline causing high flow velocities. 
Discharges quickly reach a maximum level and diminish almost as rapidly. 
Coastal floods occur during storm surges when there are temporary increases in sea levels above the normal 
tidal range (EEA et al., 2008). An increase in storm surge height can cause severe urban coastal estuary, delta 
and embayment flooding and erosion. Coastal flooding may be exacerbated by river flooding when a river is 
unable to discharge into the sea due to sea level rise. Although the increase in sea level during a storm surge 
may be temporary, urban flooding episodes can last much longer depending on the ability of the urban area to 
drain the excess flood water. Accelerated coastal erosion, loss of property and land and the loss of human life are 
all indirect effects of storm surges. Where major urban areas are located on the coast disruption to transport and 
communications can affect the whole country for weeks afterwards. 
Urban drainage flooding during extreme precipitation events is caused by an insufficient capacity of the piped 
system or less effective drainage into an outfall because river levels are raised. The excess water travels down roads 
and other paths of least resistance and floods low lying areas. Urban flooding is exacerbated by saturated or impervious 
soils. As such, built environments with roads, infrastructure and substantial surface sealing prevent rainfall from 
infiltrating into the ground, thereby causing a higher surface run-off that may be in excess of local drainage capacity. 
Groundwater flooding, caused by extensive periods of precipitation (weeks or months), may lead to a slow move 
of groundwater to low-laying areas where the groundwater table breaks the groundwater. Depending on the local 
hydro‑geological situation, groundwater rising or subsurface flows can be other causes in the generation of urban floods. 
systems causing flooding in lower lying urban areas 
combined with sewer overflow (urban drainage 
flooding). 
Photo: © Katman1972
Climate change challenges and response options 
Urban adaptation to climate change in Europe 37 
Table 2.5 Factors contributing to flooding 
Meteorological factors Hydrological factors Human factors aggravating 
natural flood hazards 
• Rainfall 
• Storm surges 
• Temperature 
• Snowfall and snowmelt 
• Soil moisture level 
• Groundwater level 
• Presence of impervious cover 
• Channel cross-sectional shape and 
roughness 
• Topography, slope, basin geometry 
• Presence or absence of over bank flow, 
channel network 
• Synchronisation of run-offs from various 
parts of watershed 
• High tide and heavy swell impeding 
drainage 
• Presence of strong ice cover on rivers 
• Land-use changes (e.g. surface sealing 
due to urbanisation, deforestation) 
• Inefficiency or non-maintenance of 
sewage system; river margins clearing 
• Building in flood-prone areas 
• Reducing/cutting off retention areas 
In the main text of this section, we focus on the kinds 
of floods and flood impacts that are most relevant 
for urban areas. We do not elaborate in detail as to 
the effects of high winds (for additional information 
see Box 2.13) neither do we address the secondary 
effects of climate impacts, such as flooding, outside 
the city area. 
Flood determinants and their effects 
Floods result from a combination of meteorological 
and hydrological extremes. In most cases floods 
are additionally influenced by human factors. 
For example, human settlement into flood prone 
areas and lack of flood response plans increase the 
damage potential. Although human influences are 
very diverse, they generally tend to aggravate flood 
hazards by accentuating flood peaks. Thus, flood 
hazards in built-up environments have to be viewed 
as the consequence of natural as well as man-made 
factors. Table 2.5 lists meteorological, hydrological 
and human factors contributing to flooding. In order 
to manage urban floods, it is essential to understand 
the causes and impacts of each one of them. 
2.2.2 What are the potential flooding impacts on 
Europe's cities? 
River floods 
Future projections made by multi-model simulations 
with global and regional climate models show a 
precipitation increase in northern Europe during all 
seasons, whereas a decrease for Southern Europe is 
found. In central Europe, precipitation is projected 
to rise in winter and decline in summer (Christensen 
and Christensen, 2007; Van der Linden and 
Mitchell, 2009; Harris et al., 2010). Besides extreme 
precipitation snowmelt can also cause floods in 
snow-affected river catchments. Due to increased 
temperatures, the snow pack decreases and leads 
to lower snow melt induced flood peaks. Snowmelt 
starts earlier within the year and leads to a temporal 
shift of the snowmelt peak. 
Projections of river flood hazard in Europe show 
that climate change leads to an increase in the 
likelihood and intensity of extreme high river 
flows for large parts of Europe (Lehner et al., 2006; 
Hirabayashi et al., 2008; Dankers and Feyen, 2008). 
In other regions the frequency and intensity of 
floods could decrease, yet even in regions that will 
become dryer on average, floods could occur on a 
more frequent basis. Map 2.8 shows the projected 
change in the river discharge for a flood which 
indicates an extreme flood event that statistically 
returns only once every 100 years. Other flood 
projections have recently been performed in the 
ClimWatAdapt project. It projects an increase of 
water level for 100 year flood events in northern 
United Kingdom and along the North Sea coast in 
the Netherlands and Belgium, the United Kingdom, 
Ireland, and Norway by 2025. In 2050 such a once 
every 100 years event could cause severe floods in 
more than 80 % of the area of the United Kingdom, 
Western France, Belgium, Netherlands, western 
Germany, Finland, as well as large areas in Portugal 
and Spain according to the upper end of projected 
ranges (Flörke et al., 2011).
Climate change challenges and response options 
38 Urban adaptation to climate change in Europe 
Map 2.8 Relative change in the river discharge for flood events that have a probability to occur 
once every hundred years between the scenario run (2071–2100) and the control run 
(1961–1990) 
Note: Simulations with LISFLOOD model driven by HIRHAM — HadAM3H/HadCM3 and IPCC SRES scenario A2. Only rivers with a 
catchment area of 1 000 km2 or more are shown. Map elaboration by EC JRC/IES. 
50° 60° 70° 
40° 
40° 
30° 
30° 
20° 
20° 
10° 
10° 
0° 
-30° -20° -10° 0° 
60° 
50° 
50° 
40° 
40° 
0 500 1000 1500 km 
Relative change in the 
river discharge for flood 
events that have a 
probability to occur 
once every hundred 
years between the 
scenario run (2071–2100) 
and the control run 
(1961–1990) 
+ 40 
+ 20 
+ 10 
+ 5 
– 5 
– 10 
– 40 
Change in % 
– 20 
More flood events Less flood events 
The sensitivity of cities depends on several 
factors. Urban areas situated on low-lying areas 
in the middle or lower reaches of river basins are 
particularly sensitive to extensive riverine floods. 
Increased urbanisation via land take and soil sealing 
combined with deforestation and the reduction of 
wetlands in the wider region diminish the natural 
water storage capacity. As a result run-off increases. 
In the event of intensive precipitation this leads to 
a growth in the flow amplitude and a shorter time 
before peaking. Parts of the city below the flood line 
and protected by artificial levees face devastating 
flooding through the breaching of the levees. 
Map 2.9 depicts the percentage of the urban area 
of a city that would be flooded in the event the 
water rises by one metre. The map indicates if a 
city has a large share of low-lying parts but one 
should expect that the potential damage increases 
with a larger flooded area. The map indicates the 
risk of considerable damage throughout Europe in 
particular deltas in the Netherlands (Rhine-Meuse) 
and North Italy (Po). However, the map should be 
interpreted with caution, since neither coastal floods 
nor flood protection measures are considered in the 
calculations.
Climate change challenges and response options 
Urban adaptation to climate change in Europe 39 
Note: The background (= Map 2.8) shows the relative change in 100-year return level of river discharge (red = decreased 
discharge, blue = increased discharge). 
Neither coastal floods nor flood protection measures are considered in the calculations. 
The potential flooded area is based on a 'volume model'. This model is based on water level and subsequent 
difference between modelled water level and the digital elevation model. The city is defined by its morphological form 
(Urban Morphological Zone) inside the core city boundaries derived Urban Audit (Eurostat, 2012). 
Source: EC JRC/IES; EEA. 
Map 2.9 Percentage of the city that would be flooded in case rivers rise one metre 
50° 60° 70° 
40° 
40° 
30° 
30° 
20° 
20° 
10° 
10° 
0° 
-30° -20° -10° 0° 
60° 
50° 
50° 
40° 
40° 
0 500 1000 1500 km 
Percentage of the city 
that would be flooded 
in case rivers rise 
1 m 
 5 
5–10 
10–20 
20–40 
 40 
+ 40 
+ 20 
+ 10 
+ 5 
– 5 
– 10 
– 40 
– 20 
More flood events Less flood events 
Relative change in the 
river discharge for flood 
events that have a 
probability to occur 
once every hundred 
years between the 
scenario run (2071–2100) 
and the control run 
(1961–1990) (%) 
On a country level, Figure 2.5 reveals that 
roughly one fifth of European cities with over 
100 000 inhabitants can be placed into the vulnerable 
category ( 40 % flooded). The share of these cities 
is in particular high in the Netherlands, Croatia, 
Slovenia, Greece and Finland. In some countries, 
such as Ireland, the risk is more uniformly 
distributed, with cities only in the lower categories. 
In other countries, such as the Netherlands and the 
United Kingdom, the differences amongst the cities 
are large. 
These results suggest that cities sensitive to river 
floods do not cluster in one region only. High 
sensitivities can be found in areas with a projected 
increase and decrease in flood events. Local city 
characteristics tend to be more important than 
similar regional characteristics. 
Different scenarios indicate that between 250 000 
and 400 000 additional people per year in Europe by 
the 2080s will be affected by river flooding — most 
of them in cities (Ciscar et al., 2011). Socio-economic
Climate change challenges and response options 
40 Urban adaptation to climate change in Europe 
trends such as urbanisation can exacerbate the 
risk. The highest numbers of people affected by 
severe floods will be in areas with large population 
densities. Urbanisation and associated increases of 
impermeable land surface coupled with housing 
and business development of river floodplains 
exacerbate flood risk in urban areas. Building on 
floodplains and flood retention areas increases 
the risk as shown in the Dresden example. The 
comparison of three major flood events from the 
river Elbe in 1845, 1890 and 2002 shows that the 
built-up area increased dramatically over time. 
Although the total flooded area in 2002 was only 
slightly bigger than in 1890 and smaller than in 
1845, the settlement area in flood plains had grown 
considerably over the past century (Schumacher, 
2005; EEA, 2010b) (see Figure 2.6). 
Figure 2.5 Percentage of the urban area that would be flooded as displayed in Map 2.9 
— share of cities per class per country 
Note: Generally, only cities with more than 100 000 inhabitants are considered. 
0 
500 
1 000 
1 500 
2 000 
2 500 
3 000 
3 500 
31.03.1845 06.09.1890 17.08.2002 
Flooded area in ha 
Total area flooded Settlement area flooded 
Figure 2.6 Flood events and flooded built-up 
areas in Dresden, Germany 
Source: Schumacher, 2005; EEA, 2010b. 
0 20 40 60 80 100 
Croatia 
Netherlands 
Greece 
Finland 
Slovenia 
Italy 
Hungaria 
Czech Republic 
Bulgaria 
Romania 
Austria 
Norway 
Spain 
Belgium 
France 
Slovakia 
Germany 
Poland 
United Kingdom 
Sweden 
Portugal 
Switzerland 
Denmark 
Latvia 
Ireland 
Lithuania 
Estonia 
Luxembourg 
Malta 
Percentage of cities in the country per class 
Percentage of city area flooded 
 40 % 20–40 % 10–20 % 5–10 %  5 % 
%
Climate change challenges and response options 
Urban adaptation to climate change in Europe 41 
Urban drainage floods 
In regions with an increase in average precipitation, 
the occurrence of intense precipitation events 
(frequency or proportion of total precipitation) is 
very likely to increase (IPCC, 2012). The reverse is 
true for regions with declining average precipitation. 
Map 2.10 shows the projected change in the annual 
number of days with heavy rainfall in 2071–2100 
against the reference period (1961–1990). It shows 
an approximate north-south division with the 
imaginary division line being the Alps. Projections 
for regions south of the line show, in general, 
a decline in the number of days with extreme 
precipitation of up to five days and more. Most 
regions north of the line expect an increase, mostly 
of one to three days. Yet the coastline of Norway as 
well as Ireland and western United Kingdom and 
some parts off the Atlantic coast of France can expect 
an increase of between four and 13 days (Greiving 
et al., 2011). 
50° 60° 70° 
40° 
40° 
30° 
30° 
20° 
20° 
10° 
10° 
0° 
-30° -20° -10° 0° 
60° 
50° 
50° 
40° 
40° 
0 500 1000 1500 km 
Urban flooding – 
impervious surfaces 
reduce the drainage of 
rain water and increase 
the risk for urban flooding 
Mean percent soil sealing 
of the urbanised area (UMZ) 
of the core city 
7–24 
25–49 
50–74 
75–100 
– 8.0 to – 5.0 
– 4.9 to – 1.0 
– 0.9 to 1.0 
1.1 to 5.0 
5.1 to 13.1 
Change in annual mean 
number of days with 
extreme precipitation 
( 20 mm/day) 
Increase Decrease 
No data 
Outside data 
coverage 
Map 2.10 Urban flooding — impervious surfaces reduce the drainage of rain water and increase 
the risk for urban flooding 
Note: Mean per cent soil sealing per city and change in annual mean number of days with extreme precipitation ( 20 mm/day) 
between the CCLM scenarios run (2071–2100) and the reference run (1961–1990) for IPCC scenario A1B. 
The city is defined by its morphological form (Urban Morphological Zone) inside the core city boundaries derived from Urban 
Audi (Eurostat, 2012). 
Source: EEA (soil sealing); Lautenschläger et al., 2009 (precipitation). 
In addition, Map 2.10 shows the degree of mean 
soil sealing per urbanised areas of cities. This 
indicates reduced natural drainage as the water is 
passed on to the sewage system. Cities with high 
soil sealing and an increasing number of intensive 
rainfall events — in particular in north-western 
and northern Europe — face a higher risk of urban 
drainage flooding. Nevertheless cities in areas 
with a decreasing number of such events but high 
soil sealing still face a flooding risk, just less often. 
Cities of high and low soil sealing can be found in 
all regions and do not cluster in a particular region 
with the exception of low sealing levels in cities in 
Finland, Norway, Slovenia and Sweden. Cyprus, 
Estonia, Greece and Luxembourg are countries with 
a high share of cities with elevated levels of soil 
sealing (Figure 2.7).
Climate change challenges and response options 
42 Urban adaptation to climate change in Europe 
Figure 2.7 Degree of mean soil sealing per city — share of cities per class per country 
(based on Map 2.10) 
A city's weakness does not depend solely on 
soil sealing but also on rain water management. 
For decades urban drainage systems have been 
optimised to drain a shower with a particular return 
period. Considering future climate and on-going 
urbanisation, this 'carrying capacity' has already 
turned out to be inadequate in a number of cities 
(see the Copenhagen example in Box 2.10). There are 
several factors that tend to increase the risk. 
• Old drainage infrastructure often does not keep 
pace with on-going urbanisation. The increase 
in the share of impervious surfaces overloads 
the capacity of the sewage system in the face of 
extreme events. 
• The conventional way of dealing with rainfall 
and waste water in urban areas has been to carry 
Note: Generally, only cities with more than 100 000 inhabitants are considered. 
0 20 40 60 80 100 
Cyprus 
Estonia 
Luxembourg 
Greece 
Hungary 
Romania 
Slovakia 
Croatia 
Poland 
Spain 
Bulgaria 
Czech Republic 
Germany 
Latvia 
Ireland 
Lithuania 
Italy 
Netherlands 
France 
Portugal 
Austria 
Belgium 
Switzerland 
Denmark 
United Kingdom 
Finland 
Malta 
Norway 
Sweden 
Slovenia 
Percentage of cities in the country per class 
Degree of mean soil sealing of the city area 
 75 % 50–74 % 25–49 %  25 % 
% 
it away as quickly as possible via underground 
pipes and sewers. Older areas normally have a 
combined sewer system, where rainfall drains 
into sewers carrying sewage and both are 
transferred to sewage treatment works. These 
systems are more vulnerable to excessive rainfall 
than a separate treatment. 
• The existence of inadequate maintenance of the 
drainage channels to monitor debris and solid 
waste within such systems. 
• Inadequate discharge of excess water to the 
regional water system. This is particularly 
apparent in delta areas in the Netherlands where 
surface level differences and hydraulic gradients 
are small and urban flooding occurs easily.
Climate change challenges and response options 
Urban adaptation to climate change in Europe 43 
Box 2.10 Flooding in Copenhagen, Denmark on 2 July 2011 
After a substantially hot period Copenhagen was hit by a huge 
thunderstorm on 2 July 2011. During the afternoon clouds and thunder 
had been building up over the southern part of Sweden. During a two 
hour period over 150 mm of rain fell in the city centre. This constituted 
the biggest single rainfall in Copenhagen since measurements began in 
the mid-1800s. 
The city's sewers were unable to handle all of the water and as 
a result many streets were flooded and sewers overflowed into 
houses, basements and onto streets thereby flooding the city. The 
consequences were quite drastic as emergency services had to close 
roads and attend to people trapped in their cars. The emergency 
services were within minutes of having to evacuate the city's two 
biggest hospitals because of flooding and power cuts. 
Insurance damages alone were estimated at EUR 650–700 million. 
Damage to municipal infrastructure not covered by insurance, such as 
roads, amounted to EUR 65 million. 
That the city's sewers could not handle the huge amounts of rain water 
was no surprise — they are designed to handle much smaller amounts 
of precipitation. The city's sewage system combines rainwater and 
sewage together thereby making the city vulnerable if the amount and 
intensity of rainfall increases. 
The fact that Copenhagen over the last year has experienced a number 
of torrential rain falls has caused the city to really take notice. The 
city has prepared and approved a climate adaptation plan with the 
principle aim being to separate as much rain water from sewage water 
as possible. The city has estimated that it is currently not an option to 
expand the sewage system to handle the predicted larger amounts of 
rain water. 
The city is currently preparing a so-called 'cloudburst plan'. The plan has four steps: 
• Rescue services — the city is preparing a new rescue service plan to handle extreme rainfall. This includes 
warning systems and pumps to ensure quick relief. 
• Vulnerability — communication with citizens, businesses and public institutions to provide advice on taking 
appropriate measures to protect properties and vital systems (such as technical systems which are typically in 
basements). 
• Optimising the city's existing sewage system. The water utility company has prepared a number of initiatives 
to allow the sewage system to handle more rain water by having a 'cloudburst' control which can be activated 
in case of heavy rain and will enable the system to handle more water. 
• A long term plan has been suggested to process the majority of the surface rain water via a system of 
small canals that can divert the water either to streams, the harbour or areas where it can be stored until 
being processed into the sewage system. This plan will be implemented in cooperation with neighbouring 
municipalities that also process their sewage water through Copenhagen. 
Sources: Lykke Leonardsen, city of Copenhagen, personal communication, 2011. 
Copenhagen climate plan (short version): http://kk.sites.itera.dk/apps/kk_publikationer/pdf/794_kZEjcvbgJt.pdf; 
long version (Danish): http://www.kk.dk/sitecore/content/Subsites/Klima/SubsiteFrontpage/~/media/1366A5817180444D 
88FD0DAE316229A0.ashx. 
Flash floods 
In Europe, 40 % of the flood-related casualties 
in the period 1950–2006 were due to flash floods 
(Marchi et al., 2010; Barredo, 2006). Most flash 
floods occurred in a geographical belt crossing 
Europe from western Mediterranean (Catalonia 
and south‑western France) to the Black Sea, 
covering northern Italy, Slovenia, Austria, 
Slovakia and Romania. In the Mediterranean and 
Alpine-Mediterranean regions, flash floods occur 
predominantly in the autumn, whereas in the 
inland continental region their occurrence is often 
during summertime, suggesting the impact of 
different climatic factors. In addition, flash floods in 
Mediterranean areas are generally more intense, and 
the spatial extent and duration of the events larger 
than in continental areas. 
Photo: © Risager
Climate change challenges and response options 
44 Urban adaptation to climate change in Europe 
Box 2.11 Flash flood in Dresden, Germany in August 2003 
On the 12 and 13 of August 2002, the city of Dresden 
in Germany and surrounding settlements were hit by 
a flash flood from the river Weißeritz, a small tributary 
of the Elbe (Hutter et al., 2007). The low pressure 
system 'Ilse' caused continuous, intensive rainfall for 
1.5 days over the eastern parts of the Federal State of 
Saxony. The situation around Dresden was exacerbated 
by its topography leading to heavy rainfall in the Ore 
Mountains. The area faced the highest precipitation in 
a two day period since records began. The total rainfall 
amounted to 180 mm in Dresden, 250 to 300 mm in 
the lower and middle ranges of the Ore Mountains, and 
more than 300 mm in the upper ranges (locally up to 
400 mm). The water masses caused heavy flash floods 
in river catchments of four Elbe tributaries (Goldberg 
et al., 2003). The flash flood of the Weißeritz hit Dresden 
and was later classified as a flood event likely to take 
place only once every 500 years. The discharge at 
Freital, a town located at the edge of Dresden's city 
boundary, was 300 times higher than normal (Goldberg 
et al., 2003). In Dresden the river used its old riverbed as a second discharge channel. The riverbed had been 
replaced in the 19th century. The flood caused several casualties and large damage to buildings, bridges, railway 
tracks, streets and other infrastructure (Goldberg et al., 2003; Hutter et al., 2007). The material damage in the 
Weißeritz catchment amounted to EUR several hundred million (Goldberg et al., 2003), while for Dresden alone 
damage was estimated to be EUR 250 million (Hutter et al., 2007). 
Several days after the flash floods, a flood wave from the river Elbe arrived, caused by heavy rainfall in eastern 
Germany and the Czech Republic. The peak of this flood, with an unprecedented height of 9.40 metres, reached 
the city on 16 August (Landeshauptstadt Dresden, 2011). Several areas of the city were flooded for a second time. 
Photo: © Archiv BF Dresden 
Flash floods depend on a complex array of factors 
including rainfall intensity, rainfall duration, 
surface conditions and the topography and slope 
of the receiving basin. Therefore, it is difficult to 
predict future risk assessments, in particular at the 
European level. The projected increase in frequency 
of extreme precipitation events will increase the risk 
of flash floods. Also, the potential impact (casualties, 
economic damage) could well increase in a number 
of regions in flash-flood prone areas in Europe due 
to the increasing pressure on land use (Marchi et al., 
2010). 
In densely populated areas flash floods are more 
destructive than other types of flooding because of 
their unpredictable nature and unusually strong 
currents carrying large concentrations of sediment 
and debris. Little time would be available for 
communities living in the flood's path to adequately 
prepare for its arrival leading to major destruction to 
infrastructure and humans. 
Coastal flooding 
Sea level rise projections for Europe indicate the 
greatest increases for the Baltic and Arctic coasts 
and northern Mediterranean coasts (Johansson 
et al., 2004; Meier, 2006; Nicholls, 2004). Wave 
height is likely to increase from North Sea storm 
surges predominantly affecting those coastal urban 
areas in north-west Europe where major cities and 
economic centres are located (EEA et al., 2008). The 
latest projections on sea level rise on the basis of a 
balanced scenario indicate values for the year 2100 
that are between 0.97 and 1.56 meters above the 
1990 annual mean sea level. This follows the SRES 
A1B scenario (Vermeer and Rahmstorf, 2009). These 
results should be viewed with caution due to the 
fact that the physical basis of the models for these 
estimates is lacking (Stocker et al., 2010).
Climate change challenges and response options 
Urban adaptation to climate change in Europe 45 
Future projections indicate a slight decrease in the 
number of storms, but an increase in the strength 
of the heaviest storms. Projections to the end of the 
21st century show a significant increase in storm 
surge elevation for the continental North Sea and 
south‑east England (EEA et al., 2008). Map 2.11 
shows how major cities are potentially affected by 
the change of inundation height given a 100 year 
coastal storm surge event that includes sea level 
rise. Primarily cities at the Dutch, German, Belgium 
and northern Italian coastlines would expect severe 
changes. Due to data constraints, coastal defence 
systems such as dikes could not be considered in 
these calculations so that the map only shows the 
potential effect on urban areas. The hotspots which 
emerge from this analysis appear, however, to be 
plausible and can serve as a basis for checking 
local and regional preparedness to climate change 
accelerated coastal storm surges. 
The city is defined by its morphological form (Urban 
Morphological Zone) inside the core city boundaries 
derived from Urban Audit database (Eurostat, 2012). 
Although the increase in sea level during a storm 
surge may be temporary, the flooding of urban 
areas can last much longer depending on the ability 
of the urban area to drain the excess flood-water. 
Accelerated coastal erosion, loss of property and 
land and the loss of human life are all indirect 
effects of storm surges. When major urban areas 
are located on the coast, disruption to transport and 
communications can affect the whole country for 
weeks afterwards. See Box 2.12 for an example in 
Belgium. 
Many coastal areas were preferred to establish 
large cities and urban agglomerations due to the 
importance of international maritime transport. 
They have seen rapid population increases and 
urbanisation (McGranahan et al., 2007; Nicholls 
Map 2.11 Potential inundation exposure for coastal cities due to projected sea level rise and storm 
surge events 
Note: This calculation includes the change of inundation height due to coastal storm surge events generated by the DIVA project. 
A potential sea level rise of one metre has been calculated. 
Source: Greiving et al., IRPUD 2011, © ESPON 2013 (inundation); EEA (Urban Atlas, UMZ). 
50° 60° 70° 
40° 
40° 
30° 
30° 
20° 
20° 
10° 
10° 
0° 
-30° -20° -10° 0° 
60° 
50° 
50° 
40° 
40° 
0 500 1000 1500 km 
Potential inundation 
exposure for coastal 
cities due to projected 
sea level rise and 
storm surge events 
Urbanised area per core 
city affected (%) 
 0–5 
6–10 
11–20 
21–40 
41–100 
No data 
Outside data 
coverage
Climate change challenges and response options 
46 Urban adaptation to climate change in Europe 
Box 2.12 Coastal erosion and urban areas at the Flemish coast, Belgium 
Coastal erosion occurs naturally with or without climate 
change. It mostly affects natural and rural areas. 
However, where it happens in proximity to urban areas, 
local implications can be significant in terms of loss of 
buildings, infrastructure, and flood defence systems. An 
increasing urbanisation of coastal areas has interrupted 
or changed natural processes of erosion and accretion 
and exacerbated the problem. Further exacerbation from 
climate change could well follow. 
Along large parts of the Flemish coastline erosion forms 
an acute threat despite numerous protection measures 
taken. The existing almost linear coastline is man-made. 
The seawall is the main barrier to protect the coast, its 
inhabitants and the lower lying hinterland from storm 
tides and floods. Both the coast and the polders behind 
are densely populated and of high economic, social, 
recreational and ecological value. 
In the city of Oostende, for example, the old town centre 
with its seawards position compared to the rest of the 
coastline (see photo) and low-lying city centre at the 
mean high-water level, is protected against flooding by a 
seawall which was built some 140 years ago. The seawall 
has, over years, accelerated the erosion process of the 
beach in front. The remaining narrow beach and the 
seawall offered only limited protection against damages 
from storm surges and by consequence the city centre 
was until recently only protected against flooding for 
storm events statistically occurring once every 25 years. 
During regular yearly storms water was frequently washed over the sea wall. In 1953 a storm caused serious city 
centre flooding in which eight people died and extensive material damage took place. In 2004, emergency beach 
replenishment ('nourishment'), in anticipation of a more sustainable project, created a beach that increased the 
protective level against a storm the size of which would only occur once every one 100 hundred years. This is 
a temporary measure which requires continuous maintenance work. The measure was not sufficient to protect 
against a storm the size of which would occur once every 1 000 years, something which is required by the Flemish 
government's coastal protection plan released in 2011. 
The coastal protection plan for Oostende now foresees a new beach which will protect the city from flooding by a 
storm of that size. The most important stabilising element for this beach is a dam construction perpendicular to 
the coastline at the north-eastern side of the new beach. This dam reduces the movement of sand along the shore 
and stabilises the new beach. It will reduce the need for beach replenishment to once every ten years. The coastal 
protection plan for Oostende was combined with the harbour improvement plan and several additional projects such 
as the renovation of the promenade and the construction of an underground parking area forming part of the dike. 
These measures are part of the Flemish government's coastal protection plan of 2011. It requires a minimal 
protection level for a storm the size of which would only occur once every 1 000 years including the projected 
levels of sea level rise up to 2050 and a protection against higher storm surges in cases of significant residual 
risk of damage or casualties. Where possible, it opts for more natural options such as replenishing the beach and 
supplementing this with fixed constructions including sea dikes. 
Source: Coastal Atlas: http://www.coastalatlas.be/en/themes/coastal-defence-management. 
Coastal protection plan: http://zeeweringenkustbeheer.afdelingkust.be/level2.asp?TAAL_ID=1ITEM_L1_ID=12ITEM_L2_ 
ID=24. 
Photo: © Sillevl 
et al., 2007). Projections made by Ciscar et al., 2011 
show that without adaptation the number of people 
affected annually in the 2080s would increase 
significantly in all scenarios. This could potentially 
affect between and 775 000 and 5.5 million people. 
The British Isles, central Europe, northern and 
southern Europe are the areas potentially most 
affected by coastal floods (Ciscar et al., 2011). 
However, when adaptation (dikes and beach 
replenishment) is taken into account, the number 
of people potentially exposed to floods is reduced 
significantly.
Climate change challenges and response options 
Urban adaptation to climate change in Europe 47 
Box 2.13 Risks of storms and high winds for cities — not only on the coast 
Storms are, together with other extreme events, the main threat of climate change for built-up areas. Casualties 
can occur, but their number is relatively low compared with other extreme events such as heatwaves or floods 
(Schauser et al., 2010). Wind-related insured losses in Europe are projected to increase by 5 % until 2080, 
considering only climate change factors (Hunt and Watkiss, 2010). Built-up areas (especially roofs and facades) 
and green areas are particularly vulnerable. Furthermore, transport and supply systems may be jeopardised, 
particularly by fallen trees and lampposts. Failures in these systems affect almost every field of contemporary 
life (Schauser et al., 2010; VÁTI, 2011). For Europe, the total number of storms is projected to decrease, while 
the strength of heavy storms might increase (EEA et al., 2008). However, in the entire Atlantic region of Europe 
(Benelux, north-western parts of France and Germany, Ireland and the United Kingdom) storms are projected to 
be more intensive and frequent. In southern Europe storm wind speeds of are projected to decrease (Schauser 
et al., 2010). Projections of intensity and frequency of storm events are very uncertain (Hunt and Watkiss, 2010; 
EEA et al., 2008). Storms appear often in combination with other extreme events such as storm surges, hail, 
thunder or heavy precipitation. 
Cities facing increasing risks of storm damage can respond in several ways. Grey infrastructure approaches can 
include the design of buildings in a more wind-resistant way and the reconstruction of vulnerable buildings, 
decentralisation of energy systems and placement of electricity and other cables underground. Soft measures 
can include the adjustment of building regulations, financial support for retro-fitting of buildings, insurances to 
finance repairs and replacements after storm events, preparation or adjustment of emergency response plans. 
This would include for public transport in the case of blocked roads, electricity supply back-up systems for health 
care and other emergency services and the strengthening of local disaster management (e.g. improve or expand 
equipment, develop tactics). Forecasting and early warning systems are fundamental for emergency responses. 
Cooperation with meteorological services can help to improve these arrangements (Schauser et al., 2010; VÁTI, 
2011; ONERC, 2010; OECD, 2010; CoR, 2011a). 
In the Hungarian city of Tatabánya, the CLAVIER research project evaluated the vulnerability of buildings to 
storms. It categorised the buildings depending on their exposure (basic wind load), sensibility (height and roof 
construction of the building, building density of neighbourhood) and ability to adapt (age, design). The results 
were incorporated in a map, which can be used for urban planning and focused response policies (VÁTI, 2011). 
Map 2.12 Relative change of mean annual storm loss potential on nine GCM (upper row) 
and eight RCM (bottom row) simulations for 2071–2100 compared to 1961–2000 
(SRES A1B scenario) 
Source: Donat et al., 2011. 
50° 60° 70° 
40° 
40° 
30° 
30° 
20° 
20° 
10° 
10° 
0° 
-30° -20° -10° 0° 
60° 
50° 
50° 
40° 
40° 
0 500 1000 1500 km 
UK and Ireland 
BE, NL and LU 
Poland 
Germany 
France 
Spain and Portugal 
 20 % 
10–20 % 
0–10 % 
– 10.1 (±10.0) 
+ 17.4 (±32.3) 
+ 18.5 (±18.6) 
+ 17.6 (±21.2) 
+ 8.0 (±11.4) 
+ 37.7 (±31.0) 
+ 15.1 (±17.1) 
+ 12.1 (±18.3) 
+ 6.1 (±9.9) 
+ 9.0 (±13.2) 
+ 5.8 (±7.4) 
 0 % 
– 4.2 (±5.6) 
Relative change of mean 
annual storm loss potential 
based on nine GCM (upper 
row) and eight RMC (buttom 
row) simulations for 
2071–2100 compared to 
1961–2000 
Mean of 9 GCMs 
Mean of 8 RCMs
Climate change challenges and response options 
48 Urban adaptation to climate change in Europe 
Social sensitivity 
Factors determining sensitivity of people to floods 
are in principle similar to those influencing heat. 
Usually the elderly, young children and people with 
health problems are more vulnerable. It appears 
that in a large number of cities in Belgium, Germany 
and Italy the proportion of elderly people as a 
percentage of the population is relatively high (see 
Map 2.7 in Section 2.1.2). Furthermore, a number 
of other factors have to be taken into account 
including income, social status, housing type, type 
of households, number of social hot spots such as 
schools, hospitals, kindergartens and pensioners' 
homes (Schauser et al., 2010). 
Current and future flood impacts are the result 
of several intertwined trends — climatic and 
non‑climatic — which make population and 
economy more sensitive to flooding. Besides climate 
change, economic and demographic developments 
are very important drivers. Where development and 
economic growth continues the scale of potential 
losses will also rise. Economic growth tends to take 
place in cities which may lead to an increase in 
related climate change risks rather than in suburban 
and rural areas. 
2.2.3 How can cities adapt to flooding? 
Strategic planning for flood risk management 
The cross-border nature of flooding requires a 
regional approach in which local measures are 
embedded. Flood risk management plans involve a 
region much larger than the city itself. Multi-level 
action is required involving decision makers at 
regional, national and sometimes even international 
levels. 
Table 2.6 Adaptation measures to flooding in cities and regions following the structure of Box 2.2 
Grey measures Green measures Soft measures 
• Make new buildings and 
infrastructure flood proof 
by appropriate design and 
material use. 
• Maintenance/upgrade of 
drainage system. 
• Temporary water storage in 
basins or fascines. 
• Separate treatment of rain 
water, disconnected from 
sewage, improved ground 
drainage. 
• Innovative design of buildings 
and areas such as elevated 
entrances, building on poles, 
floating houses, temporary 
water storage, green roofs. 
• Dams, flood defences. 
• Avoid/remove impervious 
surfaces wherever possible. 
• Maintain and further increase 
green infrastructure in cities, 
parks and gardens, wetlands, 
water bodies but also green 
roofs. 
• Maintain and manage 
green areas outside and 
inside the cities for flood 
retention including the use of 
appropriate agricultural and 
forest practices. 
• 'Re-naturalisation' of rivers 
and wetlands. 
• Mapping of flood risks taking into account climate change 
scenarios and information distribution. 
• Forecasting and early warning systems. 
• Awareness raising, knowledge and capacity building for all 
groups to cope with floods and flood risks. 
• Strategic planning in river basins — ban building in flood prone 
areas, protect flood retention and other green areas. 
• Flood risk management plans. 
• Rain water management. 
• Guidance for behaviour changes such as not storing valuables 
in basements. 
• Adapting building and planning codes to include flood 
resistance. 
• Taxes or incentives, such as concerning the amount of sealed 
area per property, amount of waste water used (including rain 
water). 
• Insurance of damages. 
To support the transition from traditional flood 
defence strategies to a flood risk management 
approach at the scale of entire river basins in 
Europe, the European Union has adopted a floods 
Directive (EC, 2007a). This Directive requires 
Member States to develop and implement flood risk 
maps and management plans (de Moel et al., 2009; 
EEA, 2010e). These plans shall take into account the 
likely impact of climate change on the occurrence 
of floods. This will have consequences for land 
use practices taking place in a river basin and for 
floodplains and riverine cities. Member States are 
currently uploading their preliminary flood risk 
assessment to the European Commission and the 
EEA and will include these in the Water Information 
System for Europe (WISE). The European flood 
action programme emphasises the importance of 
damage prevention by appropriate spatial planning. 
Important aspects include: 
• avoiding construction of houses and industrial 
buildings in current and future flood-prone 
areas; 
• adapting future developments to the risk of 
flooding; 
• appropriate land use, agricultural and forestry 
practices (EC, 2004). 
At the regional or river basin level some trans 
national prevention programmes exist. Examples 
include the Rhine across, France, Germany, the 
Netherlands and Switzerland and the Meuse across 
Belgium, France and the Netherlands. Wider trans 
national cooperation is stimulated by macro-regional 
strategies of EU regional policy, for example, for 
the Baltic and the Danube (EC, 2009c; EC, 2010a; 
EC, 2010c).
Climate change challenges and response options 
Urban adaptation to climate change in Europe 49 
Grey infrastructure approaches 
Integrated water management at the river basin 
level 
Infrastructure beyond the urban fringe, such as 
temporary overflow areas or by-passes, can prevent 
flood waters from reaching the cities. Such measures 
need to be established through regional or national 
collaboration. The Dutch government initiated the 
program 'room for the river' in 2006. By providing 
more space for water around Dutch rivers, flood 
risks in downstream areas, including cities, will be 
reduced. One example of this project will take place 
in the town of Nijmegen. The Dutch government 
has targeted the building of a replacement inland 
dike alongside the river Waal in Nijmegen as the 
best solution to reduce flood risk (see also Box 2.14). 
A by-pass of the river IJssel is projected to reduce 
flood risk in the Dutch city of Kampen. 
Another example of the FloodResilienCity project is 
the Dijle River basin, the source of which is situated 
half in the Walloon and half in the Flemish regions 
of Belgium. Because of a high risk of flooding the 
authorities decided to designate and redevelop 
roughly 1 200 ha of natural area as an overflow and 
create an additional artificial temporary storage 
basin closer to the city to protect the medieval inner 
city of Leuven against rainfall levels that are only 
predicted to occur once every hundred years (FRC, 
2012). 
Urban storm water disposal 
Options to prevent urban drainage floods focus on 
improvement of the local drainage and the sewerage 
system. Urban drainage floods, including adaptation 
options, are currently being studied in Copenhagen, 
London, Malmö and Rotterdam. The City of 
London Corporation, for example, has identified 
'hot spots' vulnerable to flooding, where it plans 
to install new sustainable drainage systems and 
invest in maintenance to accommodate the expected 
rise in the volume of precipitation (PBL, 2011; 
Box 2.14 Urban and building design options to prevent flood damage 
Amsterdam and Almere in the Netherlands have 
built man-made islands with floating houses which 
'naturally' adapt to water levels (http://www.deltasync. 
nl/deltasync; http://marquetteturner.com/2011/the-floating- 
houses-of-amsterdam). 
Malmö in Sweden manages rainwater flows with a 
new open storm-water-system. Here, green roofs and 
open water channels lead rainwater into collection 
points that form a temporary reservoir to collect surplus 
water (http://www.malmo.se/English/Sustainable-City- 
Development/Augustenborg-Eco-City/The-Green-City. 
html; http://www.malmo.se/English/Sustainable-City- 
Development/Bo01---Western-Harbour/Green-City.html). 
In Rotterdam, the Netherlands, open water channels 
in new neighbourhoods have been built to funnel water 
flow and increase storage and drainage capacity. The 
city plans so-called 'water squares', low-lying public 
spaces which can be used for temporary water storage during heavy precipitation or flooding events (http://www. 
rotterdamclimateinitiative.nl/en/english_2011_design/100_climate_proof/projecten/water_plazas_playgrounds_ 
doubling_as_water_storage?portfolio_id=59). 
In Vienna, Austria, the sewage system itself provides storage. The loading of the sewer system is monitored 
continuously in real time and interventions are possible through centrally controlled sluices and pump stations 
to optimise the full storage capacity of the 2300 km long system and prevent outflows during high precipitation 
events (http://www.wien.gv.at/umweltschutz/umweltbericht/pdf/abwasser.pdf). 
Nijmegen, the Netherlands, explores opportunities in which buildings are part of the flood defence. In the concept 
Adaptable Flood Defences (AFD), structures such as car parks, buildings, dwellings or roads are transformed and 
redesigned with protection of the hinterland against flooding in mind (Stalenberg and Vrijling, 2009). 
A new metro line is being built in Copenhagen, Denmark. Entrances will be elevated to avoid storm water 
flooding the tracks (http://www.cowi.com/menu/specialfeatures/climate/COWIsclimatestrategy/Documents/0212- 
1900-001e-09b_COWIClimateChangeServices_low.pdf). 
Photo: © inhabitat.com
Climate change challenges and response options 
50 Urban adaptation to climate change in Europe 
Kamal‑Chaoui and Robert, 2009). The town of 
Cascais in Portugal has recognised the importance 
of drainage system maintenance and has put into 
practice by cleaning and restoring small streams to 
reduce flood risks (Oliveira et al., 2010). 
Source control techniques are particularly attractive 
for storm water treatment. They reduce the amount 
of storm water which needs to be taken up by the 
sewage system and thus reduce the necessity to 
extend and upgrade the existing sewage system. It 
includes a variety of techniques that aim to reduce 
the quantity and improve the quality of storm 
water at or near its source by using infrastructure 
or natural physical resources. Source control 
includes further soft measures to change behaviour 
or force the implementation of measures. The city 
of Stockholm, as well as several municipalities 
in Denmark, currently plan to implement source 
control techniques to all new sewage projects 
(Chouli et al., 2007). 
Temporary water storage in the city 
Integrating water storage in the design of new 
city areas or redesigning existing areas is another 
adaptation option which is often cheaper than 
extending the sewage system. It can also increase the 
attractiveness of public spaces. 
Innovative design of buildings and infrastructure 
Adaptation options are also available for individual 
buildings. This can range from minimal changes 
such as elevated entrances to highly innovative 
constructions. Short-term measures usually can be 
taken in existing buildings and infrastructure (green 
roofs, maintenance drainage system and specific 
usage of lower floors in flood-prone buildings), 
while medium to long term measures can focus 
on the climate-proof design of residential and 
commercial buildings and new urban developments. 
The fact that cities are continuously changing 
suggests that such measures would have minimal 
costs (PBL, 2011). 
Green infrastructure approaches 
The capacity of soils and vegetation to retain 
water is an important flood prevention feature 
as it reduces peak discharges across river basins. 
The way agricultural and forestry land is used is 
therefore relevant to flood risk management on 
a regional scale. The European Union's Common 
Agricultural Policy (CAP) reform of 2003 and 
on‑going policy development may contribute to 
flood prevention by promoting soil protection and 
the maintenance of permanent pastures and thereby 
improving the capacity of soils for water retention in 
areas upstream of flood-prone cities. 
Box 2.15 River restoration as urban flood protection in Łódź, Poland 
Łódź, meaning 'boat' in Polish, is a city whose history 
has been shaped by water. Many severe environmental 
problems have resulted from the industrial history 
of the city: loss of forests and green spaces, soil 
contamination, degradation of rivers and streams and 
poor water quality. During the periods of industrialisation 
and urbanisation most of the city's urban streams were 
converted to a mixed storm water drainage and sewage 
system. 
Łódź has been subject to frequent flooding due to the 
reduced water absorption capacity of its land area. As 
a solution to many of these problems, Łódź is focusing 
on ecohydrology and integrated water management 
including the restoration of the city's rivers, notably the 
river Sokolowka. Restoration has included the building of 
reservoirs, the invention of a storm water bio-filtration 
system and the development of a wider development 
plan for the river valley. 
This broader approach reflecting on the linkages between the water cycle and other aspects of urban development 
and beyond has proven a success. Stakeholder involvement through the city's Learning Alliance (which was 
established during the SWITCH project) has succeeded in changing mind-sets, so that up-scaling to the rest of the 
city's rivers is planned. 
Source: Loftus, 2011; http://www.switchtraining.eu/fileadmin/template/projects/switch_training/files/Case_studies/Case_study_ 
Lodz_preview.pdf. 
Photo: © Jorge Ueyonahara
Climate change challenges and response options 
Urban adaptation to climate change in Europe 51 
Sustainable land use practice in the context of 
river‑basin management preferably encompasses 
flood prevention measures in combination with agri 
environmental practices, territorial planning policies 
and nature development strategies, including river 
restoration. Green roofs, parks, natural depressions 
and wide river beds can all store storm water. River 
restoration can act as a catalyst for sustainable 
urban development that takes into account green 
infrastructure in combination with other solutions 
(Box 2.15). 
Soft measures 
Forecasting and early warning systems 
Mapping of flood risks, forecasting and early 
warning systems enhances flood preparedness. 
Warning the authorities and the public by 
forecasting severe weather events several days 
or hours ahead of approaching storm events is 
crucial for emergency actions. These can include 
evacuating vulnerable areas and buildings and the 
transportation of the population to storm shelters. 
Awareness raising, knowledge, capacity building 
and training 
Awareness raising, knowledge, capacity building 
and training are important tools to enable cities 
and citizens to cope with flooding. The city of 
Orléans, the Val de Loire conurbation, and the 
Loiret departmental council in France are working 
together on the project 'FloodResilienCity' (FRC). 
The aim of the project is to raise awareness of the 
potential impact of flooding by the River Loire to the 
public, among stakeholders and with government 
and decision-makers. The goal is to reduce the risk 
of wealth destruction and human health impact 
by increasing the resilience of buildings and 
infrastructures and by preparing evacuation and 
recovery plans preventively. The United Kingdom's 
Climate Impacts Programme (UKCIP) (7) provides 
climate scenarios, as well as an adaptation wizard 
to help users to work their way through potential 
vulnerabilities and methodologies to appraise 
options and make decisions. Flood-risk maps, such 
as those provided by the Environment Agency 
of England and Wales, are a valuable tool in 
developing strategic spatial plans. 
Box 2.16 Examples of forecasting and early warning systems 
The website www.meteoalarm.eu provides European weather warnings 
from EUMETNET countries and facilitates the exchange of warning 
information at the European scale. National meteorological services can 
submit and retrieve severe weather reports via the European Severe 
Weather Database (ESWD, http://essl.org/ESWD). The European 
Centre for Medium-Range Weather Forecasts (ECMWF) provides 3- to 
15‑day weather forecasts to its Member States and cooperating states. 
National meteorological services tend to share information on their 
web pages whereas in some countries this is the responsibility of 
the emergency authorities. Denmark (photo), Germany, Hungary 
and the Netherlands provide text message alerts to mobile phones. 
Finnish media are obliged to immediately announce extreme weather 
events. In Portugal, the National Meteorological Institute provides 
meteorological warnings, while the National Authority for Civil 
Protection sets alert levels for risks linked to meteorological and other 
emergency situations on their official site. 
The Finnish Meteorological Institute (FMI) receives weather-related 
emergency reports directly from the emergency response centres which manage emergency calls. 
Hungary and Germany utilise spotter groups to support the meteorologist services with weather reports. A storm 
spotter actively maintains the development and progression of specific weather events while relaying important 
information to the local weather agency in a timely manner. 
More than one million people subscribe to the flood warning system of the Environment Agency of England and 
Wales. 
Source: Rauhala and Schultz, 2009. 
(7) http://www.ukcip.org.uk.
Climate change challenges and response options 
52 Urban adaptation to climate change in Europe 
Integrate climate change into building codes and 
spatial planning 
Inclusion of storm and flood resistance into all 
building codes can decrease the losses from wind 
storms and floods. However, climate change has 
not yet been included in the EUROCODES for the 
design of buildings and other civil engineering 
works and construction products (8). Spatial 
planning plays an important role in flood prevention 
by restricting building in flood plains, conserving 
flood retention areas and minimising impermeable 
surfaces. Malmö, Sweden uses a green scoring factor 
for new urban developments. The system ensures 
that a certain proportion of the development will 
consist of green space. Different solutions receive 
different scores depending on their efficiency 
(e.g. sealed surface = 0; green roof = 0.7; vegetation 
on the ground = 1), which allows the developer some 
flexibility but also ensures that the requirements for 
green space provision are met (Kruuse, 2010). For 
the development of the Western Harbour area, for 
example, developers had to ensure an allocation of 
50 % share to green space. 
Regulations and fiscal incentives 
Different policy instruments such as taxes, 
specific regulations and controls and information 
campaigns can all be applied. In Germany the 
North Rhine‑Westphalia region obliges all new 
development projects to allow for storm water 
channelling and offers funding to municipalities. 
The water company in Dresden collects taxes 
based on the imperviousness level of properties 
(Mechler et al., 2011; Chouli et al., 2007). A policy 
in the Netherlands aimed to reduce by 50 % the 
combined sewer overflow by 2005. Municipalities 
and industries pay fees to the water authorities, 
depending on the level of pollution apparent 
(8) http://eurocodes.jrc.ec.europa.eu/home.php. 
in waste water. This policy has forced many 
municipalities to construct new waste water 
treatment plants with the capacity to treat both 
wastewater and storm water. A new national policy 
in the Netherlands aims to disconnect rain water 
drainage from the sewer network in 20 % of all 
urban areas in order to separate rain and waste 
water (Chouli et al., 2007). 
Municipalities organise public information 
campaigns, offer technical guidance and financial 
help to those who wish to disconnect. House owners 
in Nijmegen in the Netherlands receive EUR 5 
per m2 disconnected area, meanwhile in the city 
of Dresden in Germany collects taxes based on the 
impervious surface of the property (Chouli et al., 
2007). 
Insurance 
Insurance serves to finance the repair or replacement 
of structures that suffer irregular and unforeseeable 
losses. Several European insurance companies have 
already included climate change driven wind storms 
and flood events into their insurance portfolio such 
as Munich Re in Germany. Well-designed insurance 
contracts can provide incentives for risk reduction. 
However, insurance can also provide disincentives 
for people to prevent losses if, for example, those 
insured become less diligent in reducing losses due 
to their 'safety net'. Insurance providers can liaise 
with governments and communities to promote land 
use planning, emergency response and other types 
of risk-reducing behaviour (Mechler et al., 2011). 
Mainstreaming activities across Europe are not yet 
feasible because of different administrative and 
political conditions. 
Further reading 
• Shaw, R., Colley, M. and Connell, R., 2007, Climate change adaptation by design: a guide for sustainable 
communities, TCPA, London (http://www.preventionweb.net/files/7780_20070523CCAlowres1.pdf). 
• SWITCH Managing Water for the City of the Future — Trainings Desk (http://www.switchtraining.eu/home). 
• CoR, 2011a, Adaptation to Climate Change: Policy instruments for adaptation to climate change in 
big European cities and metropolitan areas, European Union, Committee of the Regions, Brussels 
(http://80.92.67.120/en/documentation/studies/Documents/Adaptation%20to%20Climate%20Change/ 
EN.pdf). 
• Kazmierczak, A. and Carter, J., 2010, Adaptation to climate change using green and blue infrastructure. 
A database of case studies, University of Manchester, United Kingdom (http://www.grabs-eu.org/ 
membersArea/files/Database_Final_no_hyperlinks.pdf).
Climate change challenges and response options 
Urban adaptation to climate change in Europe 53 
2.3 Water scarcity and droughts 
Key messages 
• Socio-economic factors such as population growth, increased consumption, and land use have a huge impact 
on water scarcity with climate change exacerbating the problem. 
• Water resources are expected to decrease in Europe as a result of increasing imbalance between water 
demand and water availability. 
• Many cities in southern and eastern Europe, as well as some in western Europe are already experiencing 
water stress during the summer. Future projections see an aggravation and also northwards extension of the 
problem. 
• Cities can overcome regional water scarcity through imported water yet they become more dependent on 
other regions and the price would then rise. 
2.3.1 Why are water scarcity and drought 
challenges for cities? 
Water availability and cities 
Water scarcity and droughts pose serious problems 
with drastic measures often being required to solve 
them. The 2008 example of Cyprus can illustrate 
this point. The country had suffered its fourth 
consecutive year of low rainfall and drought and 
was obliged to ship in water from Greece by tanker 
and concurrently cut the domestic water supply by 
30 %. 
Europe's larger cities generally rely on the 
surrounding region for their water resources. The 
availability of adequate clean and fresh water is 
crucial and is a basic requirement for sustainable 
development. Fresh water is used for drinking, 
by industry (production processes and cooling), 
energy production, recreation, transport and 
nature. Sufficient water of good quality is therefore 
indispensable to ensure human health and to fuel 
the economy. 
However, water scarcity and droughts are not 
exclusive to the drier areas in Europe but have 
become an issue in many other regions. During the 
drought of 2003, the affected area extended from 
Portugal and Spain to the Czech Republic, Romania 
and Bulgaria (EEA, 2010e). Water resources are 
expected to decrease in Europe as a result of the 
increasing imbalance between water demand and 
water availability. Cities compete with agriculture, 
energy generation and other sectors. Climate change 
will most likely exacerbate the adverse impacts, 
with the occurrence of more frequent and severe 
droughts in many parts of Europe. 
Determinants of water scarcity and droughts 
Water scarcity and droughts are two separate issues. 
Water scarcity refers to long-term water imbalances 
between water demand and available natural 
resources. This is when water demand exceeds 
the supply capacity of the natural resources. Such 
situations usually emerge in areas with low water 
availability or rainfall. However, they can also occur 
in regions with high water consumption due to 
high population density, or as result of intensive 
agriculture or industrial activities. Moreover, water 
imbalances can lead to problems with the water 
quality. This may exacerbate the water scarcity 
problem because, for example, the water available is 
unsuitable for consumption. 
Drought refers to a temporary decrease in water 
availability. A distinction can be made between 
meteorological drought (low rainfall), hydrological 
drought (low river flow and abnormal low 
groundwater levels), and agricultural drought 
(low soil moisture content). The primary cause 
of the emergence of drought is usually rainfall 
deficiency in a region. High air temperatures 
and evapotranspiration rates can exacerbate the 
acuteness and duration of droughts. Droughts can 
occur anywhere in Europe. 
In conclusion, droughts are mainly caused by 
climate conditions and soil properties, whereas 
water scarcity is to a large extent human driven 
depending on the balance between water availability 
(climate driven) and demand.
Climate change challenges and response options 
54 Urban adaptation to climate change in Europe 
Box 2.17 Water scarcity a problem in the south — Ankara, Turkey… 
From 2006 until 2008, Ankara suffered from severe 
droughts. In August 2007 the water supply had to be cut 
off because the capacity of eight major water reservoirs 
dropped to 5 % of normal levels. The situation was 
aggravated by the bursting of two main pipelines. From 
April 2007 to March 2008 an emergency plan came into 
action and the municipality constructed a system of 
pipelines from the Kizilirmak dam. 
Drought is not unusual in Turkey caused by the large 
variation in rainfall over the years. During the previous 
80 years the situation in Ankara regarding water demand 
has changed dramatically. The population increased from 
75 000 in 1927 to 3.2 million in 2000 and is expected 
to grow further to 7.7 million in 2025. This will put an 
enormous strain on the city's water supply that is already 
insufficient to meet current demands. Moreover, due to an 
increase in prosperity, water consumption per person has 
increased and is expected to increase further from 169 litres per day in 1995 to 203 litres in 2025. 
While Ankara's population is expected to increase further, precipitation and river flows are expected to decrease 
due to climate change. Hence, the frequency and intensity of drought periods will likely increase in the coming 
decades. 
Source: Ceylan, 2009; GWI, 2007; Tigrek and Kibaroglu, 2011; EEA, 2009; EEA, 2010e. 
… but also in the north, London, the United Kingdom 
The amount of water available per citizen in London is by far the lowest in the United Kingdom due to the relatively 
low annual average precipitation of 690 mm in the Thames catchment area and the large population. Even in 
comparison with much hotter and drier countries it is strikingly low and comparable to countries such as Israel. 
London has already experienced water shortages in 2003 and 2006. The probability of a drought event is currently 
low. However, changes in precipitation patterns will increase the likelihood of such an event to occur. The principle 
water sources for London — the rivers Thames and Lee and a chalk aquifer underneath the city — are rain fed. 
Climate change projections for the south-east of England show that rainfall will become more seasonal with 
wetter winters (10 to 20 % more precipitation by 2050, up to 30 % by 2080) and drier summers (20 to 40 % less 
precipitation by 2050, up to 50 % by 2080). Despite higher winter precipitation, groundwater recharge might be 
reduced due to increasing evaporation and public water demand. Hence, prolonged periods with water scarcity 
become more likely. 
Since the 1970s, water consumption has increased from 110 litres to 161 litres per person per day, which is above 
the UK average of 150 litres. At present, there are no incentives to reduce water spillage. Four-fifths of households 
pay a flat rate, based on the historic taxable value of the property. Only one-fifth of all households have a water 
meter. Furthermore, one quarter of the water distributed does not reach its destination due to network leakages. 
London's water network is in in many areas older than 100 or 150 years and often in poor working condition. 
To improve the situation of London's water supply a water management strategy has been proposed with the 
following priority: 
1. Reduction of losses through better leakage management; 
2. Improving water efficiency; 
3. Grey water recycling and rain water harvesting for non-potable uses; 
4. Develop the water resources with the least environmental impact. 
Source: Greater London Authority, 2010; London Climate Change Partnership, 2002. 
Photo: © Manyag
Climate change challenges and response options 
Urban adaptation to climate change in Europe 55 
Table 2.7 Factors contributing to water scarcity and droughts 
Meteorological factors Hydrological factors Human factors aggravating water scarcity and 
droughts 
Precipitation deficit 
High temperatures (large 
evaporation) 
Low soil moisture level and low 
soil water retention capacity 
Low groundwater level and 
limited quantity 
Low surface water availability 
Land cover (less vegetation and 
wetlands; impervious soil) 
Salt water intrusion into 
rivers and groundwater due to 
sea‑level rise 
Increase of population and economic activities 
Increasing water withdrawal for use in cities (citizens, business, 
industries) and in the surrounding area, e.g. by agriculture 
Land-use changes (e.g. surface sealing due to urbanisation, 
deforestation) altering run-off and groundwater level; occupation 
of areas important for groundwater generation; e.g. wetlands 
Melioration 
Water pollution 
Inefficient water supply infrastructure 
Lifestyle with high water consumption patterns 
Inefficient water management policies 
Table 2.7 presents a list with factors contributing 
to water scarcity and droughts. Even though 
freshwater resources are widely available in Europe, 
their spatial and temporal distribution leads to 
water scarce areas and periodic drought situations. 
However, additional non-climatic drivers need 
to be highlighted as they contribute significantly 
to increasing climate related impacts. Changing 
lifestyles, reduced water availability due to climate 
change and drinking water standards that prohibit 
using water in and around large cities (due to 
pollution) are all factors making cities vulnerable 
to water scarcity and droughts. The impacts 
of economic and social development on water 
resources may be of the same magnitude as that of 
climate change on water availability. 
Additional factors include: 
• Water pricing policies generally do not reflect 
the level of sensitivity of water resources at 
local level. The 'user pays' principle is rarely 
implemented and leads to mismanagement of 
water resources. 
• Spatial planning can be one of the main drivers 
of water use. Inadequate choice of city location 
results in imbalances between water needs and 
existing water resources. 
• Cities compete with other sectors for water 
— energy generation is the major user with 
45 %, followed by agriculture with 22 % and 
public water supply with 21 % (EEA, 2010e). In 
addition, tourism puts strong seasonal pressure 
on water use in certain regions, particularly in 
southern Europe and in coastal areas. 
• European countries waste between 10 and 25 % 
of their water due to inefficiency, e.g. through 
losses in public water supply and irrigation 
networks, inadequate water appliances in 
households and inefficient water practices in 
industry and agriculture (EEA, 2010e). 
2.3.2 What are the potential impacts of water 
scarcity and droughts on Europe's cities? 
European cities — present and future exposure to 
water scarcity and drought 
During the 20th century there has been a clear trend 
towards drier conditions, with decreases in rainfall 
and moisture availability in all Mediterranean 
regions with the exceptions of north-western Iberia 
and most of Turkey that reveal an increase of 
moisture availability (Sousa et al., 2011). As a result, 
severe drought episodes (in a meteorological and 
hydrological context) have become more frequent 
and persistent, namely in the Balkans and Iberia. 
The total area affected by water scarcity and droughts 
doubled — from 6 to 13 % — during the last 
30 years. Peaks appeared in 1976, 1989–1991, 2003 
and 2005 (EC, 2007b). The duration of each event, 
as well as the area affected, varies considerably. 
In Mediterranean countries droughts can last one 
or several years, while in central and northern 
countries droughts last several months. Droughts 
affect a large part of some countries, whereas in 
others they often only affect specific regions but 
with higher frequency. Map 2.13 shows how the 
precipitation deficit is projected to change in the 
future in summer and winter.
Climate change challenges and response options 
56 Urban adaptation to climate change in Europe 
Map 2.13 Precipitation deficit in summer (JJA) and winter (DJF) for the periods 2021–2040, 
2041–2060 and 2061–2080 
Note: Data are obtained from 8 RCMs (ENSEMBLES) and are bias corrected using distribution fitting method. The spatial resolution 
is 25 km. 
Source: EEA. 
Climate and socio-economic drivers are both 
drivers for water scarcity and need to be considered 
together. The water stress indicator (WEI) describes 
the ratio between total water withdrawals against 
water availability. It illustrates to which extent the 
total water demand puts pressure on the available 
water resources in a given territory and points 
out the territories that have high water demand 
compared to their resources. 
Map 2.14 shows the water stress related to the major 
river basins based on modelled estimates of water 
demand. The modelled results show that parts of 
southern and north-western Europe are already 
under severe water stress. Under an 'economy 
comes first' scenario the situation worsens and most 
parts of Europe will be under severe or medium 
water stress with the exception of northern Europe. 
The map refers to annual average conditions, while 
during drought periods it is likely that demand will 
be higher with availability lower. 
The impact on cities 
An increase in water related stress is expected in 
areas of high urbanisation and population density, in 
western Europe and coastal areas. 
50° 60° 70° 
40° 
40° 
30° 
30° 
20° 
20° 
0° 10° 
-30° -10° 0° 
60° 
50° 
50° 
40° 
40° 
0 500 1000 1500 km 
50° 60° 70° 
40° 
40° 
30° 
30° 
20° 
20° 
0° 10° 
-30° -10° 0° 
60° 
50° 
50° 
40° 
40° 
0 500 1000 1500 km 
50° 60° 70° 
40° 
40° 
30° 
30° 
20° 
20° 
0° 10° 
-30° -10° 0° 
60° 
50° 
50° 
40° 
40° 
0 500 1000 1500 km 
50° 60° 70° 
40° 
40° 
30° 
30° 
20° 
20° 
0° 10° 
-30° -10° 0° 
60° 
50° 
50° 
40° 
40° 
0 500 1000 1500 km 
50° 60° 70° 
40° 
40° 
30° 
30° 
20° 
20° 
0° 10° 
-30° -10° 0° 
60° 
50° 
50° 
40° 
40° 
0 500 1000 1500 km 
50° 60° 70° 
40° 
40° 
30° 
30° 
20° 
20° 
0° 10° 
-30° -10° 0° 
60° 
50° 
50° 
40° 
40° 
0 500 1000 1500 km 
Summer 2021–2040 Summer 2041–2060 Summer 2061–2080 
Winter 2021–2040 Winter 2041–2060 Winter 2061–2080 
Precipitation deficit in summer (JJA) and winter (DJF) for the periods 2021–2040, 2041–2060 and 2061–2080. Deficits 
are presented as probability for extreme dry situation using SPI-12 (according to the definition of SPI extreme dry is 
SPI below – 1.5 means having 1.5 standard deviation less precipitation as in the baseline period) 
No data Outside data coverage Probability for dry events 
Low High 
0.1 
0.2 
0.3 
0.4 
0.0 
0.5
Climate change challenges and response options 
Urban adaptation to climate change in Europe 57 
Map 2.14 Water stress indicator WEI for annual average on river basin level for the a) baseline, 
b) 2050 under the 'economy comes first' scenario, and c) compared with urban 
population numbers 
Source: Flörke et al., 2011. 
Cities have adapted to current water scarcity in their 
own way. Cities such as Athens, Istanbul and Paris 
have managed to obtain sufficient water from other 
regions via various transportation networks. This 
will increase dependency on far-off resources and 
increase the cost. 
Factors determining the sensitivity of people 
to water scarcity and droughts are in principle 
similar to those influencing sensitivity to heat and 
floods and affect similar groups — the elderly (see 
Map 2.7 in Section 2.1.2), young children and people 
with health problems. Regarding water scarcity, 
socio‑economic factors are, however, related to the 
ability to pay higher prices. Map 3.6 in Section 3.1 
provides an overview regarding the general 
economic situation in north-western European cities 
with a much higher gross domestic product (GDP) 
than those in eastern European cities. Large income 
discrepancies will challenge social equity. 
Potential impacts 
Water scarcity situations encountered at river basin 
level have already had noticeable impacts on the 
economy, society and environment with subsequent 
effects on costs. Main sectors include: 
• public water supply and side-effects on tourism; 
• energy production: water shortage can have 
a huge impact on the energy sector because 
a lack of cooling water limits the production 
by thermal power plants, can cause incidents 
in nuclear power plants, and/or because low 
water levels in reservoirs limit hydropower 
production; 
• income losses; 
• social impacts can be created by the 
possible increase of water prices due to the 
implementation of compensating measures 
(e.g. desalination units); 
• impacts on groundwater (with possible aquifer 
depletion due to over-pumping and seawater 
intrusion), surface waters (with minimum water 
flows not always being ensured and increased 
water temperature and concentrations of 
pollutants due to less dilution) and wetlands, 
as well as impacts on soils through erosion and 
desertification; 
• health: water-borne infectious diseases 
associated with water scarcity and higher water 
temperatures, however no fatality could be 
attributed in past droughts in Europe; 
50° 60° 70° 
40° 
40° 
30° 
30° 
20° 
20° 
10° 
10° 
0° 
-30° -20° -10° 0° 
60° 
50° 
50° 
40° 
40° 
0 500 1000 1500 km 
50° 60° 70° 
40° 
40° 
30° 
30° 
20° 
20° 
10° 
10° 
0° 
-30° -20° -10° 0° 
60° 
50° 
50° 
40° 
40° 
0 500 1000 1500 km 
Water stress indicator WEI for annual average on river basin level for the a) baseline, b) 2050 under 'economy 
comes first' scenario, and c) compared with urban population numbers 
0–0.2 (low water stress) 
0.2–0.4 (mid water stress) 
 0.4 (high water stress) 
No data 
Outside data coverage 
 100 000 
100 000–250 000 
250 000–500 000 
500 000–1 000 000 
 1 000 000 
Withdrawals-to-availability ratio Total population in cities, 2004 
50° 60° 70° 
40° 
40° 
30° 
30° 
20° 
20° 
10° 
10° 
0° 
-30° -20° -10° 0° 
60° 
50° 
50° 
40° 
40° 
0 500 1000 1500 km 
a) b) c)
Climate change challenges and response options 
58 Urban adaptation to climate change in Europe 
EUROPEAN UNION 
Part-financed by the european Regional Development fund 
INVESTING IN YOUR FUTURE 
Regional level: NUTS 2 
Source: ESPON 2013 Database 2010 
Origin of data: Eurostat, NSIs, Estimations, 2009–2010 
© EuroGeographics Association for administrative boundaries 
Change in regional populations in 2005–2050, in %, 
'Status Quo' (STQ) scenario 
– 73.0 to – 40.0 (34) 
– 40.0 to – 30.0 (28) 
– 30.0 to – 20.0 (35) 
– 20.0 to – 10.0 (31) 
– 10.0 to 0.0 (40) 
0.0 to 10.0 (45) 
10.0 to 20.0 (32) 
20.0 to 30.0 (24) 
30.0 to 170.0 (14) 
No data 
Canarias 
Guadeloupe Martinique Réunion 
Guyane 
Madeira 
Acores 
This map does not 
necessarily reflect the 
opinion of the ESPON 
Monitoring Committee 
Change in regional populations in 2005–2050, in %, 'Status Quo' (STQ) scenario 
– 73.0 to – 40.0 (34) 
– 40.0 to – 30.0 (28) 
– 30.0 to – 20.0 (35) 
– 20.0 to – 10.0 (31) 
– 10.0 to 0.0 (40) 
0.0 to 10.0 (45) 
10.0 to 20.0 (32) 
20.0 to 30.0 (24) 
30.0 to 170.0 (14) 
No data 
Map 2.15 Change in population between 2005 and 2050 under a status quo scenario 
Source: ESPON DEMIFER, 2010; © ESPON, 2013.
Climate change challenges and response options 
Urban adaptation to climate change in Europe 59 
Box 2.18 Droughts and high temperatures increase the risk of forest fires and also threaten 
cities 
Higher temperatures during longer periods, reduced 
precipitation, and changing wind patterns increase the 
risk of forest fires in many European regions. These 
climatic changes can not only lead to a higher number 
of forest fires but also to fires of increased intensity and 
longer fire seasons. The threat is especially growing 
in the Mediterranean region and Central and Eastern 
Europe particularly in regions with warmer and drier 
climates and more conducive weather (EEA et al., 2008). 
Nevertheless, the risk of forest fire is growing in other 
regions such as the Alps (Schauser et al., 2010; EEA, 
2010a; EEA et al., 2008). 
Forest fires inside and outside city boundaries can affect 
cities directly and indirectly such as with the demolition 
of houses, loss of life, pollution as well as the disruption 
to energy, water and food supplies. 
A forest fire on the outskirts of Marseille in July 2009 led 
to hundreds of homes being evacuated (MailOnline, 2009). 
Many city authorities seem unaware about the increasing threat (Caballero, 2008). Following analysis of 
European cities, only one city acknowledged forest fires as a challenge caused by the impact of climate change 
(CoR, 2011a). 
Fighting forest fires calls for a coordinated and cooperative approach between cities and the surrounding 
municipalities regarding adaptation measures. Cities have several adaptation options concerning the increase in risk 
of forest fires. Better urban and building design alongside forest management can contribute to the reduction of fire 
risks (Schauser et al., 2010; Caballero, 2008). The city of Tatabánya in Hungary has enhanced the capability of fire 
brigades to fight forest fires by providing specialist training and equipment which has led to a reduction in damage 
from forest fires and casualties among fire fighters (CoR, 2011a; VÁTI, 2011). Improving the road network in forest 
areas enhances accessibility to the fire for the emergency services. Watchtowers or camera systems as well as 
well-managed emergency response systems help to recognise forest fires at an early stage. The use of fire weather 
indices helps the fire brigade to prepare for and respond to such events (CoR, 2011a; Schauser et al., 2010). 
A strengthening of local and regional disaster management does not only help to deal with forest fires but with other 
natural hazards which are projected to occur more frequently because of climate change e.g. storm events, floods 
(VÁTI, 2011). 
Photo: © titdark 
• clay shrinking and swelling threatens the 
supporting structures in buildings and other 
infrastructures. 
The overall economic impacts of water scarcity and 
drought events in the past 30 years are estimated at 
EUR 100 billion at EU level (EC, 2007b). From 
1976–1990 to the following 1991–2006 period 
the average annual impact doubled, rising to 
EUR 6.2 billion per year in the most recent years. 
The exceptional drought in 2003 was estimated to 
have cost EUR 8.7 billion (EEA, 2010e). 
Droughts in combination with heatwaves can 
acerbate the threat of serious forest fires. Forests in 
proximity to cities increase such risks (Box 2.18). 
2.3.3 How can cities adapt to water scarcity and 
droughts? 
Generally cities have two options regarding 
reacting to water scarcity: decreasing water use or 
increasing supply. Water resource management can 
take place on three levels: the catchment area, the 
urban or neighbourhood scale and the buildings. 
The European Commission carries out an extensive 
programme on responding to water scarcity and 
droughts, covering four major areas: 
• increasing water efficiency in buildings; 
• efficiency of water-using products in 
households, commercial business, industry and 
agriculture;
Climate change challenges and response options 
60 Urban adaptation to climate change in Europe 
Table 2.8 Examples of adaptation measures related to water scarcity and droughts in urban areas 
and their regions following the structure of Box 2.2 
Grey measures Green measures Soft measures 
• Water saving devices 
• Grey water recycling systems 
• Ground water recharge 
systems 
• Rain water harvesting 
systems 
• Supply from more remote 
areas (pipelines) 
• Desalination plants 
• Rain water storage in 
wetlands and water bodies for 
later use 
• Maintain and manage green 
areas outside and inside the 
cities to ensure water storage 
instead of high run offs 
• Use of plants which have 
adapted to drought conditions 
• Mapping of drought risks and water availability via climate 
change scenarios 
• Forecasting and early warning systems 
• Awareness raising knowledge and capacity building to save 
water 
• Spatial planning 
• Water pricing as incentive to use water more efficiently 
• Restriction of water use 
• Drought and water management plans 
• Organisation of emergency water supply 
• reducing leakages in water networks; 
• halting desertification through technologies and 
good practices (EC, 2012b). 
Grey infrastructure approaches 
Desalination and re-allocation of water resources 
from water-rich regions to water-stressed regions 
are options to increase the water supply. These 
solutions are, however, often expensive and need 
to be addressed at a national level rather than at a 
municipality level. Spain and Turkey are planning 
such infrastructure solutions. However, cities such 
as Ankara, Barcelona or Istanbul cannot afford such 
investment on their own. Such solutions run the risk 
of being poor adaptation measures due to increased 
energy demand and the fact that the projects 
themselves may be vulnerable to climate and other 
stresses. 
Local solutions include rainwater harvesting, 
ground water recharge and grey water recycling, 
e.g. for toilet flushing and irrigation. Such solutions 
can be simpler with additional benefits including 
increasing soil moisture levels for vegetation, 
sustaining evaporative cooling and reducing the risk 
of urban flooding (Shaw et al., 2007). Water saving 
technology and devices in households and industry 
as well as a proper maintenance of the supply 
system avoiding water loss will reduce overall 
demand. 
Green infrastructure approaches 
Vegetated areas slow down water run-off, store 
storm water and allow water infiltration in the soil 
keeping it available for vegetation or other uses. 
Natural depressions, rivers and wide shallow 
water‑ways can also store storm water. Green roofs 
can contribute rainwater harvesting. 
Green infrastructure approaches can offer 
occasional problems via the solutions offered. 
Although the shade provided by trees lowers 
the temperature and reduces evaporation and 
thus water loss, the trees themselves need water. 
A careful selection of plants for gardens and 
public areas, which are drought resistant but still 
attractive as a part of an urban green space, is 
necessary combined with watering them with grey 
water or harvested rainwater. 
Soft solutions 
While grey and green solutions generally focus 
on prevention, those soft solutions addressing 
water scarcity and droughts aim to enhance 
preparedness. Specifically coping with droughts 
requires the availability of timely and reliable 
climate information which aids decision-makers 
at all levels in making critical decisions. Central 
and local government and water authorities are 
the most important for managing water systems 
and enhancing the level of preparedness for 
drought situations. Through public awareness 
campaigns water conservation can be promoted 
to encourage individual action. Drought 
management plans reduce risk and economic, 
social and environmental impacts. They emphasise 
efficient use of existing water supplies and contain 
guidelines and drought contingency plans for 
public water suppliers, but also restrictions on 
water use, rationing schemes, special water tariffs 
or the reduction of low-value uses. Alternatively, or 
additionally, the price of water can be temporarily 
raised to suppress demand.
Climate change challenges and response options 
Urban adaptation to climate change in Europe 61 
Box 2.19 Zaragoza, Spain combines awareness raising and regulatory measures to enhance 
water efficiency 
Following water shortages in the mid-1990s, the 
municipality of Zaragoza increased water supply and 
managed demand by developing a 'water saving culture' 
targeting businesses, industries and the local population. 
The Zaragoza Water Saving City programme was 
initiated in 1996 by the NGO Fundación Ecologica y 
Desarollo (FED) with support from the municipality. 
It included awareness raising campaigns, the 
implementation of 50 examples of good practice 
and voluntary public commitments by citizens and 
businesses. The water tariffs were revised to ensure a 
full cost recovery through revenues as well as ensuring 
affordable access for low income households. They now 
provide a disincentive for water consumption and waste 
water and an incentive for savings in the form of a water 
bill for households that reduced their consumption by at 
least 10 %. Measures to control leakages led to further 
savings. 
After 15 years the city achieved a reduction of water consumption by almost 30 %, despite a 12 % population 
increase. The bulk of achievements were due to changes in water use behaviour. The results allowed one to 
conclude that combining changes in water use behaviour, water efficiency technology and reduced leakage can 
generate sufficient savings to make new and costly water supply infrastructure redundant. 
Factors behind this success included the active promotion of a 'water saving culture', the multi-stakeholder 
approach and the broad participation of the citizens themselves. The establishment of a central coordination unit, 
working directly with stakeholders and leading by example and political commitment were key factors of success. 
Sources: Philip, 2011; CoR, 2011a; http://www.switchtraining.eu/fileadmin/template/projects/switch_training/files/Case_studies/ 
Zaragoza_Case_study_preview.pdf. 
Photo: © D. Talukdar 
Further reading 
• Shaw, R., Colley, M. and Connell, R., 2007, Climate change adaptation by design: a guide for sustainable 
communities, TCPA, London (www.preventionweb.net/files/7780_20070523CCAlowres1.pdf). 
• SWITCH Managing Water for the City of the Future — Trainings Desk (http://www.switchtraining.eu/home). 
• CoR, 2011a, Adaptation to Climate Change: Policy instruments for adaptation to climate change in 
big European cities and metropolitan areas, European Union, Committee of the Regions, Brussels 
(http://80.92.67.120/en/documentation/studies/Documents/Adaptation%20to%20Climate%20Change/ 
EN.pdf) 
• Kazmierczak, A. and Carter, J., 2010, Adaptation to climate change using green and blue infrastructure. 
A database of case studies, University of Manchester, United Kingdom (http://www.grabs-eu.org/ 
membersArea/files/Database_Final_no_hyperlinks.pdf).
62 
Planning urban adaptation 
Urban adaptation to climate change in Europe 
Figure 3.1 Placing Chapter 3 within the framework of the report 
Climate change 
exposure 
– Temperature 
– Precipitation 
– Sea level 
Sensitivity of cities to 
– Heat 
– Flooding 
– Water scarcity 
Potential climate 
change impacts 
on cities 
Possible adaptation 
measures reducing 
the sensitivity 
Chapter 2 — Climate change challenges Chapter 3 — Planning urban adaptation 
Chapter 4 — Multi-level governance 
Adaptive capacity of 
cities to cope with the 
impacts and reduce 
the vulnerability 
Planning 
urban 
adaptation 
and 
success 
factors 
Multi-level governance action to facilitate 
and implement adaptation 
3 Planning urban adaptation 
In Chapter 2, specific adaptation options were 
discussed for different climate risks including heat 
stress, floods and water scarcity. Successful delivery 
of these relevant solutions needs to be supported by 
the improvement of the overall adaptive capacity of 
an urban area (Section 3.1) following a systematic 
adaptation planning process (Section 3.2) and 
taking into account a number of planning principles 
(Section 3.3). 
Key messages 
• Enhancing adaptive capacity can decrease vulnerability of cities to climate-related risks. Adaptive capacity 
includes several components such as knowledge and equity, access to technology and infrastructure, economic 
resources and effective institutions. 
• Adaptive capacities vary between European cities and both within and between countries. 
• Some indicators point to cities in north-western Europe being characterised by higher levels of equity, access 
to knowledge and technology and government effectiveness. The cities in the Benelux and Scandinavian 
countries score particularly high on indicators relating to education and social trust. Cities in eastern and 
southern Europe have a lower age dependency index meaning that currently they may cope better with the 
financial pressures of adaptation of climate change compared to north-western Europe which is burdened with 
the cost of the ageing population. 
3.1 Capacity to adapt in Europe's cities
Planning urban adaptation 
Urban adaptation to climate change in Europe 63 
IPCC (2007) defines adaptive capacity as 'the 
ability of a system to adjust to climate change 
(including climate variability and extremes) to 
moderate potential damages, to take advantage of 
opportunities, or to cope with the consequences'. 
Adaptive capacity should thus be seen as a set 
of enabling conditions, conducive to adaptive 
action. Thus, two areas of similar geographic and 
socio‑economic characteristics, when exposed to the 
same climate threats, may demonstrate differing 
impacts depending on their respective adaptive 
capacities (Næss et al., 2005; Keskitalo, 2010e). 
Consequently, policy measures should be directed 
not only at short-term promotion of adaptive 
measures in response to risk (as discussed in 
Chapter 2), but also at long-term development and 
maintenance of structural conditions for adaptation 
(Keskitalo, 2010e). 
Adaptive capacity can be assessed at different 
spatial scales, from national (Yohe and Tol, 2002; 
Greiving et al., 2011; Haddad, 2005; Westerhoff et al., 
2011) to local. However, as adaptation decisions are 
context-specific, and the adaptation decisions are 
often made at the local level, the local and regional 
scales are particularly relevant for assessment of 
adaptive capacity (Storbjörk, 2007; Engle and Lemos, 
2010; Greiving et al., 2011). 
Elements that appear to support climate change 
policymaking at the local scale have been identified 
as, inter alia: 
• good governance; 
• presence of national programmes facilitating 
local action; 
• democratic and participatory nature of 
institutions; 
• cities' competences and authority to regulate 
climate-relevant issues; 
• the commitment of cities to take climate action, 
including the presence of a local champion; 
• availability of economic resources, 
knowledge and information, for example 
via the involvement of cities in national and 
transnational networks facilitating the exchange 
of experience (Martins and Ferreira, 2011; Kern 
and Alber, 2008). 
These elements are clearly interlinked. The 
determinants of adaptive capacity in this report are 
grouped under three dimensions (Schröter et al., 
2004; Greiving et al., 2011; Smit and Pilifosova, 
2001): 
• The awareness dimension highlights the role of 
knowledge in adaptive capacity. This includes 
not only education and the provision of and 
access to information about climate change, but 
also perception of risks and human and social 
capital. 
• The ability dimension reflects the potential of 
a society to design and implement adaptation 
measures, and is associated with access to 
technology and infrastructure 
• The action dimension, which relates to the 
potential of implementing the adaptation 
solutions, is associated with the economic 
resources available and the effectiveness of 
institutions. 
3.1.1 Awareness: knowledge and equity 
The awareness of the need to adapt, the ability 
to develop available options and the aptitude to 
assess and implement them are crucial for adaptive 
capacity (IPCC, 2001). Firstly, there is a fundamental 
and persistent need to create understanding 
of the problem of climate change and to gain 
public support for climate change adaptation 
policy. Without this it is very difficult to promote 
adaptation activities. Creating understanding comes 
through awareness raising and communication to 
a wide audience (Rob Swart et al., 2009) including 
policymakers, planners, and the public. Support 
for climate change awareness can be promoted 
through national communication initiatives. 
Development of multi-level, virtual information 
hubs on adaptation is particularly helpful. Examples 
include the UK Climate Impacts Programme and the 
following websites: klimatilpasning.dk (Denmark), 
klimatilpasning.no (Norway), climate‑guide.fi 
(Finland) and KomPass (Germany). These initiatives 
can increase the support for certain measures 
that are taken by the government at different 
administrative levels, including cities.
Planning urban adaptation 
64 Urban adaptation to climate change in Europe 
It is important to note, however, that 
implementation of adaptive measures does not 
follow directly from providing more information 
on climate impacts. The availability of up-to-date 
information does not easily translate into adaptive 
action due to a number of constraints, including 
the lack of trust in the practical relevance of the 
information in local decision-making (Demeritt and 
Langdon, 2004). Thus, there is a clear requirement 
for the information relating to adaptation to be 
tailored to the local level. This also includes the 
access to downscaled climate change scenarios and 
their impacts. 
Skilled, informed and trained personnel enhance 
adaptive capacity of governmental organisations. 
One way to provide effective and efficient 
adaptation is to learn from knowledge on climate 
and climate change impacts elsewhere in the world. 
For example, the participants in the INTERREG IVc 
GRaBS project took part in an intensive programme 
of project meetings and mentoring visits, where the 
partners would perform the role of either the mentor 
or the mentee, which facilitated the exchange of 
knowledge and experience between the individuals 
working for different local and regional authorities 
across Europe. 
The distribution of adaptive capacity is the result of 
social and economic processes that affect not only 
the society as a whole, but also individuals based 
on, inter alia, their age, gender, health and social 
status (IPCC, 2012). Thus, equity in terms of even 
access to resources or decision-making processes is 
an important consideration in relation to resources 
and power in governing resources for adaptation 
Map 3.1 Education — percentage of population aged 15–64 having a level of education following 
secondary schooling (qualified at tertiary level), 2004 
Note: Data for Finland, Italy, Poland, Portugal, Slovenia, Slovakia and Spain are from 2001. 
Source: Eurostat Urban Audit database, 2004. 
! 
! 
! 
! 
! 
! 
! 
! 
!! 
! 
! 
! 
! 
! 
! 
! 
! 
! 
! 
! 
! 
! 
! ! 
! 
! 
! 
! 
! 
! 
! 
! 
! 
! 
! 
! 
! 
! 
! 
! 
! 
! 
! 
! 
! 
! 
! 
! 
! 
! 
!!! 
! 
! 
! 
! 
! 
! 
! 
! 
! 
! 
! 
! 
! 
! 
! 
! 
! 
! 
! 
! 
! ! 
! 
! 
! 
! 
! 
! 
! 
! 
! 
! 
! 
! 
! 
! 
! 
! 
! 
! 
! 
! 
! 
! 
! 
! 
! 
! 
! 
! 
! 
! 
! 
! 
! 
! ! 
! 
! 
! 
! ! 
! 
! 
! 
! 
! 
! 
! 
! ! 
! ! 
! 
! 
! 
! 
! 
!!! 
! 
! 
! 
! ! 
! 
! 
! 
! 
! 
! 
! ! 
! 
! 
! 
! 
! 
! 
! 
! 
! 
! 
! 
! 
! 
! 
! 
! 
! 
! 
! 
! 
! 
! 
! 
! 
! 
! 
!! 
! 
! 
! 
! 
! 
! 
! 
! 
! ! 
! 
! 
! 
! ! 
! 
! 
! 
! 
! 
! 
! 
! 
! 
! 
! 
! 
! 
! 
! 
! 
! 
! 
! 
! 
!! 
! 
! 
! 
! 
! 
! ! 
! 
50° 60° 70° 
40° 
40° 
30° 
30° 
20° 
20° 
10° 
10° 
0° 
-30° -20° -10° 0° 
60° 
50° 
50° 
40° 
40° 
0 500 1000 1500 km 
 10 
10–20 
20–25 
25–30 
 30 
Education — percentage 
of population aged 15–64 
having a level of education 
following secondary 
schooling (qualified at 
tertiary level), 2004 
No data 
Outside data 
coverage
Planning urban adaptation 
Urban adaptation to climate change in Europe 65 
Map 3.2 Perceptions on 'city committed to fight against climate change' (synthetic index 0–100), 
2009 
Source: DG REGIO/Eurostat: Urban Perception survey 2010; data 2009. 
! 
! 
! 
! 
! 
! 
! 
! 
! 
! 
! 
! ! 
! 
! 
! 
!! 
! 
! 
! 
! 
! 
! 
! 
! 
! 
! 
! 
! 
! 
! 
! 
! 
! 
! 
! 
! 
! 
! 
! 
! 
! 
! 
! ! 
! 
! 
! 
! 
! ! 
! 
! 
! 
! 
! 
! 
! 
! 
! 
! 
! 
! 
! 
! 
! 
! 
! 
! 
! 
! 
! 
! ! 
50° 60° 70° 
40° 
40° 
30° 
30° 
20° 
20° 
10° 
10° 
0° 
-30° -20° -10° 0° 
60° 
50° 
50° 
40° 
40° 
0 500 1000 1500 km 
Perceptions on 'city 
committed to fight 
against climate change' 
(synthetic index 0–100), 
2009 
More 
negative 
answers 
More 
positive 
answers 
Index 50 
19–20 
21–40 
41–60 
61–80 
81–100 
No data 
Outside data 
coverage 
(IPCC, 2001). Equity concerns also relate to the 
distribution of material and economic resources 
which are also often distributed unequally, resulting 
in a lower adaptive capacity in certain areas or with 
certain groups or individuals (Keskitalo, 2010e). 
All aspects of adaptive capacity, including the 
dimension of awareness, are difficult to assess. 
Maps 3.1–3.3 offer examples of indicators that 
give some indication of the current levels of local 
awareness, education and equity. These indicators 
can be considered as proxies for the awareness 
dimension of the adaptive capacity of Europe's 
cities. Cities with the highest percentage of people 
having a level of education following secondary 
schooling are present in Scandinavia, the Baltic 
States and the Benelux countries. Cities, where most 
citizens feel that their administration is committed 
to fighting climate change, are predominantly 
located in western and northern Europe. The 
percentage of women among elected members in 
the city, which can be seen as indicative of equity, is 
lower in eastern, south‑eastern and southern Europe 
(with the exception of Spain) compared to the 
higher percentage in north-western Europe (slightly 
lower in Ireland and the United Kingdom). These 
indicators suggest that European cities are divided 
in terms of adaptive capacity based on awareness. 
This division could potentially be bridged by further 
development of knowledge exchange programmes 
and strengthening equity and participatory 
processes.
Planning urban adaptation 
66 Urban adaptation to climate change in Europe 
Map 3.3 Equity — percentage of women among elected city representatives, 2004 
Note: Data for Czech Republic, Greece, Hungary, Lithuania, the Netherlands, Slovenia and partially Belgium are from 2001. 
Source: Eurostat, Urban Audit database, 2004. 
3.1.2 Ability: access to technology and 
infrastructure 
Technological resources can contribute to the design 
and utilisation of adaptation measures. Societies 
that lack access to technology and perform poorly in 
developing new technologies have lower adaptive 
capacity. This is because many of the strategies 
that can be identified in response to climate change 
involve technology (IPCC, 2001). Development of 
technologies can be undertaken by both the public 
and the private sector and innovation is considered 
an important factor in this. Thus, technological 
development may determine ways in which 
adaptation options can be developed, for instance, 
whether high-tech or low-tech solutions are possible. 
It is important to highlight the distinction between 
general technological capacity versus a particular 
technological response that can be developed for 
a specific climate change impact (IPCC, 2012). 
Chapter 2 provides information on a variety of 
technological or 'grey' adaptation options for specific 
climate risks. 
Map 3.4 presents a synthetic index prepared in the 
'ESPON CLIMATE' project (Greiving et al., 2011) 
on technology as one determinant of adaptive 
capacity. The index is compiled of three distinct 
indicators: Research and development (RD) 
expenditure relative to GDP, personnel working 
in RD functions and the number of patent 
applications. The map highlights regions in central 
and northern Europe that are currently equipped 
with high technological capacities, and also active in 
innovation. These regions are more likely to develop 
technological responses to pressing climate change 
problems. 
! 
! 
! 
! ! 
! 
! 
! 
! 
! 
! 
! 
! 
! 
! 
! 
! 
! 
! 
! 
! 
! 
! 
! 
! 
! 
! 
! 
! 
! 
! 
! 
! 
! 
! 
! 
! 
! ! 
! 
! 
! 
! 
! 
! 
! 
! 
! 
! 
! 
! 
! 
! 
! 
! 
50° 60° 70° 
40° 
40° 
30° 
30° 
20° 
20° 
10° 
10° 
0° 
-30° -20° -10° 0° 
60° 
50° 
50° 
40° 
40° 
0 500 1000 1500 km 
! 
! 
! 
! 
! 
! 
! 
! 
! 
! 
! 
! 
! 
! 
! ! 
! 
! 
! 
! 
! 
! 
! 
! 
! ! 
! 
! 
! 
! 
! 
! 
! ! 
! 
! 
! ! 
! 
! 
! 
! 
! ! 
! 
! 
! 
! 
! 
! 
! 
! 
! ! 
! 
! 
! 
! 
! 
! 
! 
! 
! 
! 
! 
! 
! 
! 
! 
! 
! 
! 
! 
! 
! 
! ! 
! 
! 
! 
! ! 
! 
! 
! 
! 
! 
! 
! 
! 
! 
! 
! 
! 
! 
! ! 
! ! 
! 
! 
! ! 
! 
! 
! 
! 
! 
! ! 
! 
! 
! 
! 
! 
! 
!! 
! 
! 
! ! 
! 
! 
! 
! 
! ! 
! 
! 
! 
! 
!! 
! 
! 
! 
! 
! 
! 
! 
! 
! 
! 
!! 
! 
! 
! 
! 
! 
! 
! 
! 
! 
! 
! 
! 
! 
! 
! 
! 
! 
! 
! 
! 
! ! 
! 
! 
! 
! 
! 
! 
! 
! 
! 
! 
! 
! 
! ! 
! 
! ! 
! 
! 
! 
! 
! 
! 
! 
! 
! 
! 
! 
! ! 
! 
! 
! 
! 
! ! 
! 
!! 
! 
! 
! 
! 
! 
! 
! 
! 
! 
! 
! 
! 
! 
! 
! 
! 
! 
! 
! 
! 
! 
! 
! 
! 
! 
! 
! 
! 
! 
! 
! 
! 
! 
! 
! 
! 
! ! 
! 
! 
! 
! 
! 
! 
! 
! 
! 
! 
! 
! 
! 
! 
! 
! 
Equity — percentage of 
women among elected 
city representatives, 
2004 
0–10 
11–20 
21–30 
31–40 
41–60 
No data 
Outside data 
coverage
Planning urban adaptation 
Urban adaptation to climate change in Europe 67 
EUROPEAN UNION 
Part-financed by the european Regional Development fund 
INVESTING IN YOUR FUTURE 
Regional level: NUTS 3 
Origin of data: ESPON Database 2006, Eurostat 2010, NSIs 2010 
© EuroGeographics Association for administrative boundaries 
Canarias 
Guadeloupe Martinique Réunion 
Guyane 
Acores 
Madeira 
This map does not 
necessarily reflect the 
opinion of the ESPON 
Monitoring Committee 
Adaptive capacity: Technology 
Highest capacity 
High capacity 
Medium capacity 
Low capacity 
Lowest capacity 
No data 
Technological capacity to adapt to climate change classified 
by quintiles. 
The technology dimension of adaptive capacity towards climate 
change combines indicators on research and development 
expenditure, research and development personnel and patent 
applications. 
Map 3.4 Technology as one determinant of adaptive capacity, based on the NUTS 3 level 
Source: Greiving et al., 2011; © ESPON, 2013. 
Adaptive capacity: Technology 
Highest capacity 
High capacity 
Medium capacity 
Low capacity 
Lowest capacity 
No data 
Technological capacity to adapt to climate change classified 
by quintiles. 
The technology dimension of adaptive capacity towards climate 
change combines indicators on research and development 
expenditure, research and development personnel and patent 
applications.
Planning urban adaptation 
68 Urban adaptation to climate change in Europe 
Map 3.5 Infrastructure as one determinant of adaptive capacity 
Source: Greiving et al., 2011; © ESPON, 2013. 
Madeira 
Adaptive capacity: Infrastructure 
Highest capacity 
High capacity 
Medium capacity 
Low capacity 
Lowest capacity 
No data 
EUROPEAN UNION 
Part-financed by the european Regional Development fund 
INVESTING IN YOUR FUTURE 
Origin of data: EEA 2006, Eurostat 2010, NSIs 2010 
Infrastructural capacity to adapt to climate change 
classified by quintiles. 
The infrastructural dimension of adaptive capacity 
towards climate change combines indicators on 
the road network density, hospital beds and 
sustainable water use. 
Acores 
Madeira 
Guyane 
Guadeloupe Martinique Réunion 
Canarias 
This map does not 
necessarily reflect the 
opinion of the ESPON 
Monitoring Committee 
Adaptive capacity: Infrastructure 
Highest capacity 
High capacity 
Medium capacity 
Low capacity 
Lowest capacity 
No data 
Infrastructural capacity to adapt to climate change 
classified by quintiles. 
The infrastructural dimension of adaptive capacity 
towards climate change combines indicators on 
the road network density, hospital beds and 
sustainable water use.
Planning urban adaptation 
Urban adaptation to climate change in Europe 69 
Infrastructure often forms the basis for the 
development of adaptation options and measures, 
as it underlies the basic functions of societies. 
Different types of infrastructure are also vulnerable 
to particular impacts of climate change, and a 
greater variety can help to buffer the impacts of 
climate change in both the short and long term. 
Infrastructure is also important in the capacity of 
a system to cope with sudden impacts of climate 
change such as extreme weather events. Cities 
depend on their infrastructures for their safety and 
well-being. 
In terms of indicator development, especially 
at regional and city level, infrastructure poses 
a number of challenges. Constructing uniform 
indicators on urban infrastructure is constrained 
by data availability and quality issues. Urban audit 
data does not properly cover this thematic area. An 
attempt has been made in the 'ESPON CLIMATE' 
project (Greiving et al., 2011) to assess the level 
of adaptive capacity related to infrastructure. An 
index at regional level is used for three underlying 
indicators: the density of the road network, the 
number of hospital beds, and the water exploitation 
index. Map 3.5 shows this index, which seems 
to highlight certain countries and regions, with 
no evident patterns. It should be noted that data 
constraints and quality concerns persist here as well. 
3.1.3 Action: economy, resources and institutions 
Economic resources, capital assets and financial 
means are important parts of adaptive capacity 
(Smit and Pilifosova, 2001). Wealthy societies are 
better placed to adapt as they are able to bear the 
costs of adaptation and plan and pay for measures 
to increase their capacity. However, high income per 
capita alone is neither a necessary nor a sufficient 
indicator of the capacity to adapt (IPCC, 2001). 
While it seems evident that rich cities are better 
positioned than poor cities to adapt, very little 
information on costs of adaptation is available, 
other than for a small number of options such 
as flood defences. 'Green' and 'soft' solutions 
(see Chapter 2) can often provide low-cost solutions 
and there is usually enough knowledge for their 
implementation. High-tech and new solutions 
usually require more resources, knowledge, 
experience and training. 
Map 3.6 shows the current GDP per capita figures 
for urban audit cities. It shows a marked divide 
in wealth between cities in eastern and western 
Europe, and a less marked one between northern 
and southern European cities. In some countries 
(notably Germany and the United Kingdom) the 
disparities between cities are greater than in others, 
which points to the importance of subnational, 
city‑level measures, often masked by national 
averages. 
Insurance can be seen as a consequence of the 
economic aspect of adaptive capacity since it is 
predominantly an instrument used by wealthier 
nations and individuals. Insurance can be very 
important in terms of coping capacity for example in 
the aftermath of extreme weather events. Depending 
on the use of insurance instruments, it can also 
guide long term development in adaptive capacity 
(i.e. the total withdrawing of insurance coverage 
from the riskiest locations). Figure 3.2 on insurance 
penetration shows the overall share of GDP used for 
insurance per country. The figures cover different 
types of insurance, including health and property, 
not only insurance instruments directly related 
to climate change impacts. The national figures 
demonstrate a rather clear east-west divide in 
Europe. The differences are further accentuated by 
the respective differences in GDP per country.
Planning urban adaptation 
70 Urban adaptation to climate change in Europe 
! 
! 
! 
! 
! 
! 
! ! 
! 
! 
! 
! 
! 
! 
! 
! 
! 
! 
! ! 
! 
! 
! 
! 
! 
! 
! 
! 
! 
! 
! 
! 
! 
!! 
! 
! 
! 
! 
! 
! 
50° 60° 70° 
40° 
40° 
30° 
30° 
20° 
20° 
10° 
10° 
0° 
-30° -20° -10° 0° 
60° 
50° 
50° 
40° 
40° 
0 500 1000 1500 km 
! 
! 
! 
! 
! 
! 
! 
! 
! 
! 
! 
! 
! 
! 
! 
! 
! 
! ! 
! ! 
! 
! 
! 
! 
! 
! 
! 
! ! 
! 
! 
! 
! 
! 
! 
! ! 
! 
! 
! 
! 
! 
! 
! 
! 
! 
! 
! 
! 
! 
! 
! 
! 
! ! 
! 
! 
! ! 
! 
! 
! 
! 
! 
! 
! 
! 
! 
! 
! 
! 
! 
! 
! 
! 
! 
! 
! 
! 
! 
! 
! 
! 
! 
! 
! 
! 
! 
! 
! 
! 
! ! 
!! 
! 
! 
! 
! 
! 
! 
! 
! ! 
! 
! 
! 
! 
! 
! 
! 
! 
! 
! 
! 
! 
! 
! 
! 
! 
! 
! 
! 
! 
! 
! 
! 
! 
! 
! 
! 
! 
! 
! 
! 
! ! 
! 
! 
! 
! 
! 
! 
! 
! 
! 
! 
! ! 
! 
! 
! 
! 
! 
! 
! 
! 
! 
! 
! 
! 
! 
! 
! 
! 
! 
! 
! 
! 
! 
! 
! 
! 
! 
! 
! 
! 
! 
! 
! 
! 
! 
! 
! 
! 
! ! 
! 
! 
! 
! 
! 
!!! 
! 
! 
! 
! ! 
! 
! 
! 
! 
! 
! 
!! 
! ! 
! 
! 
! 
! 
! 
! 
! 
! 
! 
! 
! ! 
! 
! 
! 
 5 000 
5 000–10 000 
10 000–20 000 
20 000–30 000 
 30 000 
Economic determinant — 
GDP per capita figures 
for European cities, 
2004 (EUR) 
No data 
Outside data 
coverage 
Map 3.6 Economic determinant — GDP per capita figures for European cities, 2004 (EUR) 
Note: Data for Spain are from 2001 due to data-quality issues. 
Source: Eurostat, Urban Audit database, 2004. 
Source: CEA Statistics No 42, European Insurance in Figures. November 2010. 
Figure 3.2 Insurance penetration as proportion of GDP 
Cyprus 
Estonia 
Luxembourg 
Greece 
Hungary 
Romania 
Slovakia 
Croatia 
Poland 
Spain 
Bulgaria 
Czech Republic 
Germany 
Latvia 
Ireland 
Lithuania 
Italy 
Netherlands 
France 
Portugal 
Austria 
Belgium 
Switzerland 
Denmark 
United Kingdom 
Finland 
Malta 
Norway 
Sweden 
Slovenia 
0 
2 
4 
6 
8 
10 
12 
14 
16 
% 
Iceland 
Turkey 
Liechtenstein 
165 %
Planning urban adaptation 
Urban adaptation to climate change in Europe 71 
Note: The number of people under 20 years old and over 65 years old is divided by the number of people 20–65 years old and 
multiplied by 100. 
Data for Bulgaria, Cyprus, Czech Republic, Finland, France, Ireland and Latvia are for 2001. 
Source: Eurostat Urban Audit database, 2004. 
Map 3.7 Human resources — age dependency index, 2004 
! ! 
! 
! 
! 
! 
! 
! 
! 
! 
! 
! 
! 
! 
! 
! ! 
! 
!! 
! 
! 
! ! 
! 
! 
! 
!! 
! 
! 
! 
! 
! 
50° 60° 70° 
40° 
40° 
30° 
30° 
20° 
20° 
10° 
10° 
0° 
-30° -20° -10° 0° 
60° 
50° 
50° 
40° 
40° 
0 500 1000 1500 km 
! 
! ! 
! 
! 
! 
! 
! 
! 
! 
! 
! 
! 
!! 
! 
! 
! 
! 
! 
! 
! 
! 
! 
! 
! 
! 
! 
! 
! ! 
! 
! 
! 
! 
! 
! 
! 
! 
! 
! 
! 
! ! ! 
! 
! 
! 
! 
! ! 
! 
! 
! 
! 
! 
! ! 
! 
! 
! 
! 
! 
! 
! 
! 
! ! 
! 
! 
! 
! 
! 
! 
! 
! 
! 
! 
! 
! 
! ! 
! 
! 
! 
! 
! 
! 
! 
! 
! 
! 
! 
! 
! 
! 
! 
! 
! 
! 
! 
! 
! 
! 
! ! 
! 
! 
! 
! 
! 
! 
! 
! 
! 
! 
! 
! ! 
! 
! 
! 
! 
! 
! 
! 
!! 
! 
! 
! 
! 
! 
! 
! 
! 
! 
! 
! 
! ! 
! 
! 
! 
! 
! 
! 
! 
! 
! 
! 
! 
! 
! 
! 
! 
! 
! 
! 
! 
! 
! 
! 
! ! 
! 
! 
! 
! 
! 
! 
! 
!! 
! 
! 
! 
! 
! 
! 
! 
! 
! 
! 
! 
! 
! 
! 
! ! 
! 
!! 
! 
! 
! 
! 
! 
! 
! 
! 
! 
! 
! 
! 
! 
! 
! 
! 
! 
! 
! 
! 
! 
! 
! 
! 
! 
! 
! 
!! 
! 
! 
! 
! ! 
! 
! 
! 
! 
! 
! 
! 
! 
! 
! 
! 
! 
! 
! ! 
! 
! 
Human resources — age 
dependency index, 2004 
42–52 
53–56 
57–59 
60–65 
66–81 
! 
! 
! 
No data 
Outside data 
coverage 
An indication of resources that include human 
actions and not uniquely economic activity is 
also relevant when considering adaptive capacity. 
Map 3.7 concentrates on the issue of human 
resources, as reflected by age dependency, i.e. the 
dependency level of young and old people on the 
economically more active part of the population. 
The age dependence indicator reflects demographic 
changes (ageing, fertility) and is relevant for the 
burden of support in economic and other terms 
between the active, working age population and 
everyone else. Contrary to the GDP indicator, 
cities in central, eastern and south-eastern Europe 
currently demonstrate higher adaptive capacity. This 
is due to a lower proportion of the young and the 
elderly in relation to the proportion of those more 
economically active. In the future this could well 
change due to projected demographic changes in 
Europe. There are, however, no projections at city 
level available. 
Having well-functioning and efficient institutions 
(defined as the formal and informal structures and 
practices that hold society together) can enable 
adaptation to take place and reduce the impacts of 
climate-related risks (IPCC, 2001). Countries that 
have well developed and functioning institutions 
are considered to have higher adaptive capacity in 
relation to developing or transition countries. Such 
institutions and governance structures not only have 
the capacity to deal with present day challenges but 
also enable planning for the future. In Chapter 4, 
the roles and responsibilities of institutions at 
different administrative levels are discussed in a 
multi-level governance perspective, taking into 
account that different European countries have 
different governance systems ranging from federal 
to centralised. Social capital has been seen as 
an elusive but important aspect of institutional 
adaptive capacity. It refers to norms and networks 
that enable people to act collectively. One aspect of
Planning urban adaptation 
72 Urban adaptation to climate change in Europe 
social capital is to trust both in other people and in 
institutions. Thus, it can be seen as an underlying 
factor of institutional adaptive capacity, relevant for 
predicting whether communities will act together 
facing future climate change adaptation challenges 
(Adger, 2001; Adger et al., 2008; Yohe and Tol, 2002). 
Maps 3.8 and 3.9 present indicators that can be used 
as proxies for the current strength of governance 
at the city level. They measure the effectiveness of 
the central government and levels of social capital 
(measured by trust in other people). They suggest 
that the adaptive capacity in north west Europe 
is likely to be higher than of those in south‑east 
Europe. 
3.1.4 Summarising the adaptive capacity of cities 
Current adaptive capacity varies among European 
cities. As with the impact indicators described in 
Chapter 2, the adaptive capacity seems not uniquely 
dependent on the country and region but also 
50° 60° 70° 
40° 
40° 
30° 
30° 
20° 
20° 
10° 
10° 
0° 
-30° -20° -10° 0° 
60° 
50° 
50° 
40° 
40° 
0 500 1000 1500 km 
World Bank Government 
effectiveness index, 
2010 
– 0.9 to – 0.5 
– 0.4 to 0.5 
0.6 to 1.0 
1.1 to 25.0 
Outside data 
coverage 
Better 
relates to the cities themselves. This emphasises the 
importance of subnational and city-level approaches 
and indicators. Whilst it is difficult to distinguish 
clusters of cities of similar adaptive capacity, several 
geographical trends can be observed. 
In general, cities in north-western Europe are 
characterised by higher levels of equity, access 
to knowledge and technology and government 
effectiveness. Cities in the Benelux and Scandinavian 
countries score particularly high on indicators 
relating to the qualifications of the population and 
social trust. However, cities in eastern and southern 
Europe have a lower age dependency index. This 
means that currently they may cope better with the 
financial pressures of adaptation of climate change 
compared to north-west Europe which is burdened 
with the cost of providing for an ageing population. 
This spatial distribution suggests, firstly, that 
regional programmes relating to climate change 
adaptation can be tailored to different locations. 
For example, whilst south-eastern Europe would 
Source: World Bank, 2012. 
Map 3.8 World Bank Government effectiveness index, 2010
Planning urban adaptation 
Urban adaptation to climate change in Europe 73 
benefit from awareness raising and the increased 
commitment of local governments to climate 
change adaptation, in north-western Europe the 
economic, social and demographic conditions 
would be appropriate for promotion of bottom‑up, 
community-based approaches. Moreover, the 
differences between European cities present an 
excellent opportunity for exchange of experiences 
and learning. Cities in the north-west can relate their 
own experiences in developing adaptation strategies 
and using technological solutions. Valuable lessons 
can be learned from experiences of countries in 
the south as regards dealing with heat and water 
scarcity, for example in traditional urban design, and 
by evaluating current strategies and techniques. 
One must use the presented indicators with caution. 
Data on cities are not comprehensive across Europe, 
and the selection of indicators is constrained by 
! 
! 
! 
! 
! 
! 
! 
! 
50° 60° 70° 
40° 
40° 
30° 
30° 
20° 
20° 
10° 
10° 
0° 
-30° -20° -10° 0° 
60° 
50° 
50° 
40° 
40° 
0 500 1000 1500 km 
! 
! 
! 
! 
! 
! 
! 
! 
! 
! 
! 
! 
! 
! 
! 
! 
! 
! 
! 
! 
! 
! 
! 
! 
! 
! 
! 
! 
! 
! 
! 
! 
! 
! 
! 
! 
!! 
! 
! 
! 
! 
! 
! 
! 
! 
! 
! 
! 
! 
! 
!! 
! 
! 
! 
! 
! 
! 
! 
! 
! 
! 
! 
! ! 
Social capital — trust in 
other people (synthetic 
index 0–100), 2009 
More 
negative 
answers 
More 
positive 
answers 
Index 50 
22–40 
41–60 
61–80 
81–100 
No data 
Outside data 
coverage 
Map 3.9 Social capital — trust in other people (synthetic index 0–100), 2009 
Source: DG REGIO/Eurostat: Urban Perception survey 2010; data 2009. 
data availability and quality. The presented results 
can, therefore, only serve as a starting point for 
discussion and require further in-depth analysis. 
Additional research is needed to show which 
determinants are more predictive than others as 
to how they support actual adaptive measures. 
Moving from generic to more predictive indicators 
of adaptive capacity would require improved 
data on adaptive capacity indicators with broader 
coverage, better data on actual adaptive measures 
taken in cities and finally further research on the 
correlation of certain determinants and actual 
adaptive measures (to serve as basis for weighting 
the different determinants). Thus, there is a clear 
need for improved city-level indicators for coherent 
comparisons of adaptive capacity. It would be 
especially important in this respect to develop a 
coherent system of monitoring actual adaptive 
policies and measures).
Planning urban adaptation 
74 Urban adaptation to climate change in Europe 
3.2 Planning steps to urban adaptation 
Key message 
Planning urban adaptation should be a systematic and cyclical process. This report proposes six basic steps: 
• Getting started; 
• Assessing risks and vulnerabilities to climate change; 
• Identification of adaptation options; 
• Assessment of adaptation options; 
• Implementation; 
• Monitoring and evaluation of adaptation actions. 
To be successful and effective, adaptation planning 
for urban areas should be systematic and follow 
a logical process. A number of approaches to 
adaptation planning have been developed (Smit 
et al., 2000; Ribeiro et al., 2009; CBT, 2009). This 
report follows the 'one step at a time' approach 
to adaptation planning which is derived 
from the United Kingdom Climate Impacts 
Programme's (UKCIP) adaptation wizard and 
used in the European climate adaptation platform 
CLIMATE‑ADAPT (EEA and EC, 2012). The steps 
are based on a policy cycle, highlighting that 
climate change adaptation is an iterative process 
(Figure 3.3). 
These six steps are summarised below. The 
European Climate Adaptation Platform 
CLIMATE‑ADAPT provides extensive information 
Figure 3.3 Adaptation planning steps 
1. 
Getting 
started 
3. 
Identify 
adaptation 
options 
4. 
Assess 
adaptation 
options 
5. 
Implement 
adaptation 
options 
6. 
Monitor and 
evaluate 
adaptation 
action 
2. 
Assess risk and 
vulnerability 
in relation to each of the steps, including data, 
documents, websites, tools and guidance materials. 
3.2.1 Get started: initiate adaptation, ensure 
commitment and management 
Decision makers may ask why they should include 
adaptation to climate change on their agenda, given 
the other challenges facing Europe. In science it is 
well established that a certain amount of warming 
is unavoidable, due to greenhouse gases that are 
already present in the atmosphere. The effects 
of global warming have already been observed, 
and will continue to do so for decades to come. 
Adaptation is crucial to soften the impacts of 
the unavoidable changes in climate and to take 
advantage of the opportunities. 
However, not all decision makers may be convinced 
by scientific evidence alone. In some countries 
national adaptation plans and strategies provide a 
stimulus for the development of adaptation plans 
at the city level. However, where there is little or no 
policy pressure adaptation planning at the local level 
tends to be triggered by various influences. This can 
include recent extreme weather events, a presence 
of a motivated individual within the institution, a 
concerned NGO, an engaged private‑sector body 
or a research institution with an interest in climate 
impacts and adaptation, publication of a study 
concerning climate change impacts in the area or 
providing good practice examples from other cities. 
These triggers may be used to generate interest. If 
the interest is present, gaining political backing and 
managerial commitment is essential to progressing 
the adaptation agenda (M. Ribeiro et al., 2009) 
(see Box 3.1) followed by establishment of a clear 
mandate for the management of the adaptation 
process. This responsibility often rests with the local
Planning urban adaptation 
Urban adaptation to climate change in Europe 75 
municipal authority or particular NGO. The power 
and responsibilities of the managing unit should 
be well defined over a sufficiently long time-scale 
to cover the development, implementation and 
evaluation of the adaptation plan. 
3.2.2 Assess potential climate change risks and 
vulnerabilities 
In this particular step, those responsible should 
assess any urban vulnerability (see Chapter 2) and 
elements such as the built environment, transport 
networks and critical infrastructure, including 
electricity and water supply. This should be done 
in relation to analysing all other climate impacts 
which can affect the functioning of the urban area 
and the well-being of its residents. Costs of climate 
change impacts can also be taken into consideration 
(see Box 3.2). A map with relevant locations to be 
viewed as priority areas for adaptation could be one 
suggested way of analysing data. 
The uncertainty of the scale of climate change 
impacts should be taken into consideration, 
alongside the uncertainty of future socio-economic 
scenarios. Developing contrasting scenarios for 
the city and exploring the need for adaptation 
under different climatic and socio-economic 
conditions could assist with this task. A number of 
pan-European and national projects have created 
Box 3.1 Gaining support and securing leadership from the local government in Southampton, 
United Kingdom 
The cities, provinces and regions participating in the 
'GRaBS' project (Green and Blue Space Adaptation for 
Urban Areas and Eco Towns) went through a specific 
process when preparing their adaptation action plans. 
One important step was the development of a high 
level policy statement noting the aims and objectives of 
the adaptation plan, which could be then accepted and 
signed off by the elected members. 
The city of Southampton's low carbon strategy, is one 
example, which combines mitigation and adaptation 
goals. The foreword was provided by the cabinet 
member for Environment and Transport at the council, 
followed by eight key priorities for a city that can 
thrive in a low carbon economy and be competitive and 
prosperous despite the changing climate. 
Involving local politicians in adaptation planning ensures 
their support. In Southampton's case, the commitment 
of the politicians helped to move adaptation from a 
peripheral position on the city's agenda to the forefront, 
thus ensuring that adaptation planning was not affected 
by budget cuts. 
Source: Southampton City Council, 2011. Photo: © Ian Britton 
different socio-economic and climate scenarios 
across a variety of sectors (see the European Climate 
Adaptation Platform CLIMATE-ADAPT). 
As part of preparing for adaptation planning the 
city's adaptive capacity should also be evaluated. 
This step is crucial for cities to set priorities for 
public and private spending, as the optimal 
allocation of resources is part of good governance. It 
should be noted that the assessment of impacts and 
vulnerability should not be limited to an economic 
analysis but also include the impacts on goods not 
on the market, such as ecosystem services. 
3.2.3 Identify a wide range of adaptation options 
After the priority areas, sectors and elements of the 
urban system have been decided, adaptation options 
able to reduce particular climate risks should be 
identified. Adaptation options aim to manage 
climate risk to an acceptable level and enable 
advantage to be taken of any positive opportunities 
that may arise. Chapter 2 describes a number of 
'grey', or structural, 'green' and 'soft' adaptation 
options which can be considered. Alongside concrete 
actions, adaptation options include solutions that 
help to build general adaptive capacity. The latter 
is seen as an important response to cope with the 
inherent uncertainty in climate projections. Building 
adaptive capacity involves developing the ability
Planning urban adaptation 
76 Urban adaptation to climate change in Europe 
Box 3.2 Costs and benefits of adaptation 
Due to the relatively recent focus on adaptation, little 
is known about the cost of potential climate damage, 
the cost of inclusion of adaptation in urban policies and 
projects and the cost of actual adaptation measures. 
Preliminary estimates suggest that benefits often exceed 
costs. Taking advantage of opportunities related to urban 
renewal as well as designing multi-purpose solutions can 
result in adaptation benefits exceeding the costs. 
Two recent European projects (ClimateCost FP7 and 
PESETA) have looked at the costs in damage terms 
related to climate change for coastal systems, human 
health, agriculture tourism, and floods (Watkiss, 2011; 
Ciscar et al., 2009). In relation to health, the mortality 
rate related to heat exposure in Europe is likely to 
increase in all European regions, in particular southern 
Europe (Watkiss, 2011). The cost of heat-related deaths 
varies according to the method used. If the 'value of a 
statistical life' method is used estimated welfare costs 
will be EUR 30 billion average per year during the 
period 2011–2040, EUR 102 billion for 2041–2070 and 
EUR 146 billion for 2071–2100. However, if the 'value of a life year lost' method is used, these values decrease 
more than tenfold (Watkiss, 2011). This means that a careful consideration of costs is needed to guide the 
eventual choice of adaptation solution. 
Adaptation planning does not necessarily have to be a costly and time-consuming process when it is integrated as 
one of the drivers into the development of urban policies. The 'Climate as Opportunity' project assessed 100 large 
infrastructural investment projects in the Netherlands, mostly related to spatial planning and water management 
with several of them in cities. The findings demonstrated that integrating climate change in planned urban renewal 
and upgrading projects improved project sustainability thus reducing the future costs. This was achieved via the 
following: 
• lengthening the time scale; 
• widening the scope of projects; 
• exploring options for multi-functional land use; 
• placing the projects in a much wider spatial context; 
• involving a larger group of stakeholders; 
• offering opportunities for private sector initiatives; 
• improving the quality of projects generally without additional costs (Watkiss, 2011; Sedee and Pijnappels, 
2010). 
Adaptation costing studies to date have predominantly focused on a limited set of easily monetised measures 
such as flood defences or other infrastructure. Costing of measures such as urban greening is more complex. 
A recent study (Altvater et al. 2011; 2011a; 2011b) estimated the costs of green space maintenance and the 
installation of green roofs in those European cities included in the Urban Audit database by extrapolating the 
findings of individual case studies to the European level. These amount to over EUR 5 billion for green spaces and 
EUR 100 billion for green roofs annually, following an initial investment of about EUR 7 billion. The estimates for 
green spaces are based on the loss of profits from potential development on the allocated land. The calculations 
are based around the adaptation needs related to current rather than projected climate issues and they do not 
consider the intangible benefits, such as human well-being. Similarly, the estimates for green roofs reflect private 
and public expenditure, and ignore the savings made, for example, by insulation. It is therefore important to take 
into account all costs as well as all benefits of the adaptation options available to estimate their real economic 
feasibility. 
The ClimateCost findings also show that adaptation is generally very effective at reducing the impacts of climate 
change at low cost. However, uncertainty in the climate models affects adaptation costs and benefits as well 
as costs resulting from inaction. This highlights the need for adaptation strategies which are effective within a 
framework of decision-making made with some levels of uncertainty (Watkiss, 2011) (see also Section 3.3.5). 
Co-benefits are, furthermore, decisive for getting adaptation action prioritised in the political process and 
subsequently implemented. 
Source: Altvater et al. 2011; 2011a; 2011b; Ciscar et al., 2009; Sedee and Pijnappels, 2010; P. Watkiss, 2011. 
Photo: © City of Malmö
Planning urban adaptation 
Urban adaptation to climate change in Europe 77 
of people and ecosystems to respond effectively 
to climate change and is discussed in detail in 
Section 3.1. 
3.2.4 Assess and prioritise adaptation options 
The appraisal and prioritisation of adaptation 
options follows the initial exploratory exercise 
as described in the previous step. Once potential 
adaptation options have been identified, an 
assessment should be carried out in order to 
determine which of them suit the city's specific 
context. Possible adaptation options should be 
assessed based on their potential to meet the 
adaptation objectives and their feasibility. In 
addition they should be effective and efficient 
in order to be considered for implementation. 
Effective options are options that reduce certain 
vulnerabilities to a desired level. Efficient options 
are those options whose benefits (economic, social 
and environmental) exceed their costs and are more 
cost-effective than the alternatives (see Box 3.2 for 
costs and benefits of adaptation). Other typical key 
issues affecting the choice of adaptation options for 
cities are: national legislation, financial feasibility, 
spatial requirements, time scales, ecological 
concerns, cultural heritage protection and public 
acceptability. 
Thorough assessment of feasible options can help 
avoiding decisions that lead to maladaptation. 
Different sets of criteria or success factors have 
been used to assess adaptation options. The most 
important ones are discussed in Section 3.3. The 
selected adaptation options should preferably 
have elements of 'low-regret', which means that 
they are either reversible or can deliver a number 
of related co-benefits (see Section 3.3.3). Solutions 
that offer the opportunities to work with the forces 
of nature rather than against them are preferred 
(see Section 3.3.5), hence the focus on green 
infrastructure solutions in this report. An important 
criterion for the selection of adaptation measures 
should be that the measure is consistent, or even 
complementary to adaptation or mitigation efforts in 
other sectors (Smit and Pilifosova, 2001). 
Tools and guidance documents are provided 
in the European Climate Adaptation Platform 
CLIMATE-ADAPT to assist in selecting assessment 
procedures and feasible options. Many different 
approaches exist to evaluate, or prioritise adaptation 
policy options. This includes cost-benefit analysis, 
focusing narrowly on quantifiable economic 
costs and benefits, and multi-criteria analysis that 
uses more than one criterion to assess and rank 
various options. Examples of tools and guidance 
for inventorying and screening adaptation options 
include the Adaptation Wizard (UKCIP), the 
Adaptation Decision Explorer (weADAPT) and 
the Digital Adaptation Compendium (EU ADAM 
project). In addition see EEA (2007) for more details 
on the economy of adaptation in relation to the 
aggregate costs of adaptation and inaction. 
3.2.5 Implement adaptation actions 
This next step relates to the development of an 
implementation plan which converts adaptation 
options into action by listing the objectives, 
assigning the responsibilities and setting the 
deadlines for completion. Implementation of 
the chosen adaptation options will be strongly 
influenced by existing policies and procedures. 
At present, the experience of implementing 
adaptation actions is limited. Many of the examples 
provided in this report actually relate to cases in 
which climate change adaptation was just one 
of many factors that determined how particular 
projects were implemented. Notwithstanding this 
paucity of practical experiences, the success factors 
discussed in Section 3.3 offers some guarantee that 
adaptation policies that take them into account can 
indeed be implemented effectively. 
The implementation of adaptation plans in 
European cities can be potentially threatened 
by their incompatibility with local, national or 
European policies. The adherence of the adaptation 
plan to the national and European policies in place 
should be ensured to avoid potential conflicts. 
EU regulations are also subject to change, which 
offers the potential for greater incorporation of 
climate change adaptation in a number of directives 
(Box 3.3). However, at the local level, amendment of 
the local policies (for example spatial development 
plans) could be considered in order to comply with 
adaptation principles. The adaptation plan can be 
developed as a separate document, but adaptation 
can also be streamlined by incorporation of its 
principles into the relevant policy documents. 
During policy analysis it is useful to link adaptation 
options to established policy programmes 
and funding programmes (e.g. structural and 
infrastructural development funds). Funding from 
additional sources will broaden the portfolio of 
available adaptation options for the cities and in 
many cases it makes many inaccessible options 
subsequently available. Chapter 4 elaborates 
the roles of the various actors at the relevant 
administrative levels.
Planning urban adaptation 
78 Urban adaptation to climate change in Europe 
3.2.6 Monitor and evaluate adaptation action 
Our knowledge of climate change, its impacts 
and the effectiveness of adaptation solutions is 
developing rapidly and the adaptation planning 
process should be sufficiently flexible to allow 
for changes. A crucial step in the process is the 
establishment of a long-term monitoring system 
of the implemented actions, in order to ensure 
that the actions are focused on the priority areas 
and to evaluate the effectiveness and efficiency of 
adaptation. Monitoring enables the adjustment and 
refining of the adaptation options where necessary 
thus eliminating maladaptation. For example, this 
could mean testing the 'grey' adaptation options, 
such as flood defence systems, or 'soft' responses 
such as flood or heat warning systems. 
Furthermore, learning derived from monitoring 
and reviewing processes can enhance the 
adaptation process itself. It not only helps to 
assess the suitability of adaptation measures in a 
given location, but also offers a practical example 
for other cities, thus supporting the knowledge 
exchange. Good practice states that evaluation 
and monitoring is carried out by an organisation 
independent from stakeholders involved in 
adaptation implementation. Although experiences 
with monitoring and evaluation are as yet limited, 
some countries in Europe (Finland, Germany and 
the United Kingdom) are experimenting with the 
development of evaluation methods at a national 
level. The European Climate Adaptation Platform 
CLIMATE-ADAPT provides access to up-to-date 
information regarding these efforts. 
Box 3.3 Environmental impact assessments — a tool for integrating climate change adaptation 
into other policies 
A recent OECD report emphasises the importance of mainstreaming adaptation measures with pre-existing tools 
and mechanisms that are already being used in planning and implementing various development projects and 
programmes (Agrawala et al., 2010). Environmental impact assessments (EIAs) are seen as particularly relevant 
for the purpose of procedural integration at an international scale, due to the broad thematic and institutional 
reach of EIAs. 
The White Paper on Adaptation (EC, 2009b) sees the revision of the EU Directives on EIA and SEI (EC, 2011a; 
EC, 2001) as a way of ensuring that plans and projects which are the subject of environmental assessments also 
require climate proofing as a pre‑condition (Mickwitz, 2009; Agrawala et al., 2010; Birkmann and Fleischhauer, 
2009). The obstacles for implementation include the limited availability of detailed information on the historical 
climate; the uncertainties associated with the future climate projections for specific locations and thus the risk of 
counterproductive investments in altering project design (Agrawala et al., 2010). Therefore, there is a need for a 
degree of flexibility when reflecting on new information on climatic changes in the EIA process. 
Further reading 
• UKCIP Adaptation Wizard (http://www.ukcip.org.uk/wizard). 
• Snover, A. K., Whitely Binder, L., Lopez, J., Willmott, E., Kay, J., Howell, D. and Simmonds, J., 2007, Preparing 
for Climate Change: A Guidebook for Local, Regional, and State Governments, ICLEI — Local Governments for 
Sustainability, Oakland, CA, USA (http://www.icleiusa.org/action-center/planning/adaptation-guidebook). 
• VÁTI, 2011, Climate-Friendly Cities: A Handbook on the Tracks and Possibilities of European Cities in 
Relation to Climate Change, Ministry of Interior Hungary — VÁTI, Budapest (http://www.eukn.org/ 
dsresource?objectid=224489). 
• CoR, 2011a, Adaptation to Climate Change: Policy instruments for adaptation to climate change in 
big European cities and metropolitan areas, European Union, Committee of the Regions, Brussels 
(http://80.92.67.120/en/documentation/studies/Documents/Adaptation%20to%20Climate%20Change/ 
EN.pdf).
Planning urban adaptation 
Urban adaptation to climate change in Europe 79 
3.3 Success factors 
Key messages 
The success of adaptation planning and implementation depends on several factors: 
• Awareness-raising actions should be targeted at stakeholders ranging from citizens to national and European 
governments and cover various aspects of climate change adaptation. 
• Successful adaptation cuts across sectors and scales. Planning and implementation needs to involve horizontal 
collaboration between different sectors or policy departments, as well as vertical coordination between 
different administrative levels. 
• Adaptation solutions that deliver additional benefits, such as green urban areas, increase the willingness to 
accept and implement them. 
• Working with nature, instead of working against natural processes, and using green infrastructure are 
sustainable solutions with multiple benefits. 
• Many climate change adaptation measures can be implemented at low-cost or contribute positively in other 
areas. However, a sufficient resource base in terms of financial, human and institutional resources needs to be 
developed and secured. 
The steps outlined in the previous Section offer a 
generic guidance on how to proceed in adaptation 
planning and implementation. As the adaptation 
agenda is relatively new (Kazmierczak and Carter, 
2010; Ford et al., 2011), combined with the complex 
nature of both climate change and the urban areas, 
the planning process may be fairly complex. This 
Section aims to provide an overview where the 
processes have seen success as identified in previous 
research (Kazmierczak and Carter, 2010; CAP, 2007; 
CAG, 2009; PB, 2009; Bulkeley et al., 2009; Tanner 
et al., 2009). 
When considering the successful development and 
implementation of appropriate adaptation measures 
a number of factors can be considered. The EEA's 
European Topic Centre on Air and Climate Change, 
for example, introduces ten guiding principles 
for climate change adaptation in Europe (Prutsch 
et al., 2010). This report focuses on five interlinked 
success factors which combine principles such as 
raising awareness, working across sectors and scales, 
capturing co-benefits, dealing with uncertainties and 
long timeframes and working with nature, along 
with experiences in various cities in Europe. 
3.3.1 Raising awareness of climate change and the 
need to adapt 
Climate change will affect all sectors of human 
activity. Thus, it is paramount that adequate 
awareness of climate change exists. Awareness 
raising is particularly important among the 
following groups (Füssel, 2007): 
Senior management within decision-making 
bodies. This could include: heads of government 
agencies at national and regional levels; city mayors 
and elected members and directors of municipal 
departments. They all need to be aware of the 
necessity of climate change adaptation. The presence 
of a strong leader or champion can, firstly, help to 
prioritise the adaptation within the organisation; 
secondly, they decide about implementation of any 
changes to policies; thirdly, they can ensure the 
availability of human and financial resources for 
development of adaptation strategies. Also, leaders 
(ministers and mayors) can raise the profile of 
adaptation planning in their area and secure support 
from key stakeholders (M. Ribeiro et al., 2009). 
The staff of organisations planning the adaptation 
strategy. The understanding of the problems 
associated with climate change and the solutions is 
needed for the officers working at local, regional and 
national levels in order to be able to formulate the 
policies and develop the delivery plans. Adaptation 
to climate change requires attention and action by 
people who have not explicitly considered climate 
in previous decisions. Managers of climate-sensitive 
resources (for example water managers, forest 
managers, urban and spatial planners, architects, 
tourism managers and health care providers) have 
usually assumed regional climate is essentially 
stationary. This assumption is no longer valid under 
global climate change, in particular when long-term 
decisions are concerned (Füssel, 2007). 
Practitioners and consultants. Natural resource 
managers who would actually implement the
Planning urban adaptation 
80 Urban adaptation to climate change in Europe 
recommended changes can provide key information 
about how processes are undertaken and why. This 
information is a crucial starting point for planning 
any changes. 
Non-governmental organisations can also 
participate actively in climate change-related 
actions. If they understand the risks associated with 
climate change, they can play an important role in 
the countries where there is little regulatory push for 
local authorities to develop adaptation action plans 
(see Box 3.4 for an example in Slovakia). 
Other external stakeholders, in particular those 
responsible for critical infrastructures or emergency 
services whose understanding of the need for 
adaptation is crucial to ensure that a given area can 
function under the changing climate and cope with 
extreme weather events. 
The general public. Informing and involving the 
local communities in climate change adaptation 
actions can ensure smoother implementation of the 
necessary measures. 
The development of knowledge-sharing should be 
targeted. Four important aspects can be identified: 
• Awareness of risks associated with climate 
change. For more details see Chapter 2. 
• Understanding what adaptation is. One of 
the main constraints in the development 
of adaptation strategies is the lack of 
Box 3.4 Community network in Bratislava, Slovakia 
While in some countries the main driving forces for the 
creation of an adaptation action plan are local authorities 
or local parliamentarians, in the Slovak case the network 
was instigated by the non‑governmental sector. The 
Regional Environmental Centre in Slovakia became a 
facilitator of discussion between the local authorities 
and the non‑governmental sector, and a moderator of a 
network of community and government representatives. 
Although there was no formal agreement with the city of 
Bratislava, the network became a full member of the task 
groups preparing the Bratislava Strategic Development 
Plan. 
The active participation of environmental organisations 
within the network has led to improvements to the 
Strategic Development Plan. Climate change challenges 
and mitigation and adaptation issues were fully 
incorporated as priorities under the objectives of 
improving the quality of the environment and urban 
spaces. 
Source: Hudeková and Tvrdoň, 2011. 
Photo: © HatM 
understanding among policymakers as to what 
adaptation actually is. It is often not understood 
that adaptation is as important as mitigation, 
regardless of the level of mitigation, since 
a certain level of climate change cannot be 
avoided. 
Awareness of adaptation costs and benefits. 
If stakeholders are aware of the risks and 
knowledgeable about effective response measures, 
the awareness-raising process should focus more 
on the expected costs and benefits of the specific 
options available (Füssel, 2007). 
3.3.2 Cutting across different sectors and levels 
As the issue of climate change is cross-sectorial and 
multi-levelled, responses to climate vulnerabilities 
may be the remit of different sectors of the 
administration. Thus, climate risks need to be 
considered in all sectors, including urban planning, 
transport and health, in an integrated fashion. For 
example, in order to ensure an efficient response to 
heatwaves affecting human health, adaptive actions 
related directly to health protection (e.g. heat wave 
plans for health and social care practitioners) should 
be accompanied by, inter alia, adaptive building 
and urban design measures. In the Dutch 'Room for 
the River' project, there is a need to plan for higher 
river flows through improved drainage. Yet, sea 
level rise interferes with water drainage. Improved 
flood protection and water management, therefore, 
require considering both river flows and sea level.
Planning urban adaptation 
Urban adaptation to climate change in Europe 81 
One issue cannot be addressed independently of the 
other. Challenges can arise when responsibilities for 
issues are divided (Scarlett, 2011) thus emphasising 
the need for intra- and inter-organisational 
collaborations (see Section 3.3.3). In particular, 
different types of infrastructures, critical for the 
functioning of cities, are often mutually dependent, 
requiring coordination between the services 
responsible for them (see Box 3.5). 
Bridging the divide between different sectors 
can help to eliminate instances of maladaptation, 
i.e. where the adaptive actions in one sector 
have negative secondary effects on other sectors 
(see Box 3.6). Similarly, adaptation which can be 
successful at a specific temporal or spatial scale 
can become maladaptation at another level. In 
Chapter 4 the roles and responsibilities at different 
administrative levels are discussed in more detail, 
from local to European. Here, we focus on the 
linkages between different sectors and levels within 
a city (from building to neighbourhood to urban 
scale), capturing the various components of the 
governance systems relevant for climate change 
adaptation. 
One sector particularly important for cross-sectorial 
adaptation is land-use planning. Present and future 
land-use planning greatly affects the impacts of 
Box 3.5 Interdependencies between infrastructure types 
The report 'Infrastructure, engineering and climate 
change adaptation — ensuring services in an uncertain 
future' by the Royal Academy of Engineering (2011), 
examines vulnerabilities in different sectors of the 
United Kingdom to the effects of climate change and 
the modifications that would be needed to increase 
resilience. It also considers vulnerabilities that affect the 
infrastructure system as a whole and which arise as a 
result of interdependencies between different sectors. 
The functioning of cities depends on such viable systems. 
Extreme events in particular highlight the 
interdependencies in infrastructure as they are liable 
to lead to 'cascade failure' where the failure of one 
aspect of infrastructure, such as flood defences, can 
lead to other failures. One example of this could be 
flooded power stations leading to power cuts which 
thereby affect telecommunications networks, the 
pumping of drinking water and control systems. The 
interdependencies in infrastructure therefore need to be managed well. For example, a smart grid will mean 
energy systems rely more on information and communication technology, and the electrification of transport 
systems will mean transport is more reliant on the national grid. 
Source: Royal Academy of Engineering, 2011. 
Photo: © Genkaku 
climate change on cities and all infrastructure 
systems. This is because population distribution 
affects the location of infrastructure and hence 
the potential impacts. The way land is developed 
affects flood magnitudes and losses, water quality, 
water availability, and local heat island effects. 
Prohibition of new developments in flood zones 
is an example of land use regulation that can 
both decrease potential damages to property and 
improve hydrological conditions, thereby decreasing 
the severity of flooding. Transportation analysis 
further suggests that it can also be important to 
avoid commercial or residential development in 
areas that can often become inaccessible during 
extreme weather events. In general, good land-use 
planning will not increase vulnerability but will 
rather decrease it (Kirshen et al., 2007). If climate 
change adaptation is integrated with the regular 
plans for city renewal and expansion, costs of 
investments in infrastructure could be minimised. 
This also reinforces the importance of involving 
spatial planning departments in the development 
of adaptation strategies. Multi-scale land-use 
approaches to managing high temperatures and 
the risk of flooding are promoted by the United 
Kingdom's Town and Country Planning Association, 
focusing on three spatial scales in cities: the 
conurbation, the neighbourhood and the building 
(Figure 3.4) (Adger et al., 2005; Shaw et al., 2007).
Planning urban adaptation 
82 Urban adaptation to climate change in Europe 
Figure 3.4 Multi-scale approaches to managing high temperatures and flooding 
Note: From 'Climate Change Adaptation by Design'. Courtesy of the TCPA. Graphic by thomas.matthews (www.thomasmatthews.com). 
Source: Shaw et al., 2007. 
Box 3.6 Avoiding maladaptation 
Adaptation measures which can be successful at a 
specific temporal or spatial scale can also become 
maladaptation (Adger et al., 2005). For example, 
hotter summers will result in increased need for cooling 
buildings. However, provision of air-conditioning 
and fans would result in increased use of electricity, 
thus increased carbon emissions. Moreover, the hot 
air from the air conditioning units would increase 
street temperature, thus exacerbating the problem. 
Thus, provision of air conditioning can be seen as 
maladaptation and other solutions should be considered. 
For example, better insulation in houses can keep them 
cool in the summer and warm in winter. Meanwhile 
planting trees for shade not only provides cooling 
benefits in the summer but also allows for contact with 
nature for urban dwellers. 
In conclusion, adaptation measures need careful 
planning to avoid negative side effects and thus 
maladaptation. 
Photo: © A. Svensson
Planning urban adaptation 
Urban adaptation to climate change in Europe 83 
In order to ensure cross-sectorial planning and 
delivery of adaptive actions it is essential to 
coordinate actions between departments within the 
same level of government. Starting an adaptation 
planning process must involve setting up internal 
organisational structures and procedures across all 
relevant departments in order to institutionalise 
the adaptation 'motto' in various key sectors. 
Adaptation to climate change is very often led 
by an environment or sustainability department. 
Box 3.7 Cross-departmental collaboration and external stakeholder involvement in Kalamaria, 
Greece 
The Municipality of Kalamaria (Thessaloniki, Greece) 
has developed an adaptation action plan focusing on 
the use of green spaces as adaptation. Before starting 
the process, strategic co-operation between different 
directorates and departments in the municipality was 
lacking. The city started with an internal SWOT analysis 
(strengths, weaknesses, opportunities and threats). It 
involved interviews with personnel of the Department 
of the Land Registry Office and Municipal Property, 
the Department of Technical Works, Maintenance 
and Environment, the Planning Department; the 
Department of Greenery and the Office of Protection of 
the Environment. A cross-departmental climate change 
monitoring task force, involving representatives from 
the Department of Technical Works, Maintenance and 
Environment, Planning Department, Programming 
Department and Civil Protection, led to the development 
of an action plan with clear roles for all stakeholders. 
The task force will monitor and evaluate the 
implementation and then report to the mayor. 
The adaptation action plan was also developed in collaboration with a number of external stakeholders — the 
region of Central Macedonia, the Union of the Municipalities of Thessaloniki, Kalamaria and others, 'Anatoliki' a 
local government development company, the Aristotle University of Thessaloniki, various technical, transportation 
and planning bodies within Thessaloniki, the water company and the fire service. The meetings resulted in 
concrete proposals and their prioritisation. They were synthesised and included in the adaptation action plan. 
This cross-departmental and multi-stakeholder process brought different perspectives and types of experience to 
the adaptation action plan. They improved the understanding of climate change impacts across stakeholders and, 
as a co-benefit, helped to established long-term collaboration which otherwise would not have taken place. The 
participants felt committed to sustaining the network following completion of the adaptation action plan. 
... and Genoa, Italy 
The adaptation action plan was developed by the local planning department in the province of Genoa, Liguria. The 
adaptation action plan concerns in particular two practical projects aiming to balance development in the province 
with environmental vulnerabilities that may be exacerbated by climate change. To ensure successful delivery of 
the projects, the province of Genoa set up a multidisciplinary working team. It included representatives from 
the Department of Land and Basin Planning (three geologists, four land planners and a hydraulic engineer); the 
Department of Natural and Protected Areas (an ecologist) and finally the Department of Energy and Environment 
(a physicist). Support was provided by two external experts in landscape planning and landscape design. This 
approach was intended to allow for differing viewpoints and to deliver projects addressing both environmental 
vulnerability and climate change adaptation in a sustainable manner. 
Source: Municipality of Kalamaria, 2011; Provincia di Genova, 2011; http://www.grabs-eu.org. 
Photo: © Ioannis Tsionas 
However, engagement from other departments may 
help to mainstream adaptive actions. In particular, 
engagement from the departments responsible 
for spatial planning and development control is 
important, especially when the adaptive actions are 
targeting land-use change or promoting restrictive 
development. Coordination mechanisms can be 
either formal or informal, depending on the political 
and legal tradition (M. Ribeiro et al., 2009). Box 3.7 
provides two examples of cross-departmental 
collaboration in southern Europe.
Planning urban adaptation 
84 Urban adaptation to climate change in Europe 
The development and implementation of successful 
urban adaptation plans requires cooperation 
between a number of stakeholders. Stakeholders 
can be defined as those with an interest in 
climate change impacts on urban areas. Good 
management structures and a comprehensive goal 
where adaptation is concerned should motivate 
stakeholders to actively participate. Transparent 
decision-making processes and fair treatment of 
stakeholder interests should enhance cooperation 
and avoid potential conflicts. The example of the 
Municipality of Kalamaria, in Thessaloniki, Greece 
(Box 3.7), illustrates how different stakeholders can 
be involved in the process of development of an 
adaptation action plan. 
3.3.3 Utilising the co-benefits of adaptive actions 
While the previous Section stressed the need for 
sectors to collaborate, it is also evident that this 
becomes easier when benefits can be identified for 
more than one sector. Wherever relevant, adaptation 
Box 3.8 Natural Economy North West, United Kingdom: estimating the economic benefits of 
green infrastructure 
Natural Economy Northwest was a partnership led by Natural England, the Northwest Regional Development 
Agency and SITA Trust between 2006 and 2009. The partnership worked with a wide range of partners and 
stakeholders to help in placing ecosystem services and natural environment at the heart of thinking about 
sustainable economic development, quality of life and quality of place. It recognised that ecosystem services 
underpin the social, cultural and economic prosperity of the region. The environmental economy (public 
and private sector activities related to ecosystem services) in the north west of England already generates 
GBP 2.6 billion within the regional economy every year and employs 109 000 people. The recognised eleven major 
economic benefits are: 
• Economic growth and investment: business attract and retain more motivated staff in greener settings; 
• Land and property values: views of natural landscapes can add up to 18 % to property values; 
• Labour productivity: green spaces near workplaces reduce sickness absence, increasing productivity; 
• Tourism: rural tourism supports 37 500 jobs in the north west; 
• Health and wellbeing: green infrastructure reduces pollution which leads to asthma and heart disease; 
• Recreation and leisure: footpaths, cycle paths and bridleways enable healthy, low-cost recreation; 
• Quality of place: community-owned green spaces can create jobs and local pride; 
• Land and biodiversity: green infrastructure provides vital habitats and jobs managing the land; 
• Flood alleviation and management; urban green spaces reduce pressure on drainage and flood defences; 
• Climate change adaptation and mitigation: green infrastructure can counter soaring summer temperatures in 
cities. 
The approach helped to reaffirm that green infrastructure is necessary for a region's prosperity. It emphasised that 
green infrastructure is crucial for the functioning of the region. Strong leadership by the regional public bodies was 
the principal reason for success. 
Source: Natural Economy North West, 2012; Natural Economy North West, 2012; ECOTEC, 2008; 
http://www.naturaleconomynorthwest.co.uk/about.php. 
measures have to be examined in relation to other 
policy areas, such as those of nature conservation, 
agriculture, urban development, transport, climate 
change mitigation or energy supply and demand. 
Presenting the benefits of a given adaptation 
option in an economic manner can be particularly 
important in order to persuade decision-makers that 
adaptation measures are feasible and desirable. 
As highlighted in Box 3.8, green infrastructure 
solutions (see Section 3.3.5 for more detail) have the 
potential to deliver a number of benefits. Possibly 
the most important driver for climate change 
adaptation is the improvement in quality of life 
in cities. This could lead to increased investment 
leading to greater prosperity. The Augustenborg 
neighbourhood in Malmö, Sweden illustrates how 
solutions aimed at reducing the risk of flooding have 
also contributed to social regeneration (Box 3.9). 
The synergies between adaptation to climate 
change and mitigation action are of particular 
interest (see also Box 3.6). In some instances the two
Planning urban adaptation 
Urban adaptation to climate change in Europe 85 
Box 3.9 Sustainable urban drainage systems as a driver for urban social regeneration in the 
Augustenborg area of Malmö, Sweden 
The neighbourhood of Augustenborg has experienced 
periods of socio-economic decline in recent decades, 
and at the same time frequently suffered from 
floods caused by overflowing drainage systems. 
Augustenborg underwent significant regeneration 
between 1998 and 2002. The main drivers for this 
initiative were the difficult social and economic situation 
in the neighbourhood, flood risk management, waste 
management and biodiversity improvement. Significant 
physical changes in infrastructure took place as a result, 
focusing on the creation of sustainable urban drainage 
systems, including ditches, retention ponds, green 
roofs and green spaces. The project was carried out 
collaboratively by the city council and a social housing 
company with extensive residents' participation. The 
project was deemed successful as the rainwater runoff 
rates have decreased by half and the increase in green 
space has improved the area's image. 
Source: Kazmierczak and Carter, 2010; http://www.grabs-eu. 
org/membersArea/files/malmo.pdf. 
Photo: © Town and Country Planning Association (TCPA) 
can be in direct opposition as it may be difficult, 
for example, to combine green roofs and solar 
panels on one building. However, in many cases 
adaptation and mitigation are compatible. Building 
insulation allows energy-saving for heating but also 
maintains lower temperatures in hot periods. Green 
infrastructure solutions in particular can address 
both the root cause and the impacts of climate 
change. Vegetation provides a carbon sink whilst at 
the same time lowering temperatures in the city. The 
INTERREG IIIc project AMICA specifically focused 
on integration adaptation and mitigation in the 
areas of energy, construction, and spatial planning, 
i.e. those sectors where 'common ground' between 
adaptation and mitigation policies is expected. 
AMICA developed a tool for city planners (AMICA, 
2012). 
In some cases adaptation is the principle driver for 
action. In others it can be but one consideration 
amongst many. Examples include: 
• The floating houses development situated on 
the new island neighbourhood of IJburg in 
Amsterdam, the Netherlands respond to the 
existing demand for houses built near to water. 
Such developments also cope well with sea 
level rise or high storm surges. This example 
demonstrates the potential of climate change 
adaptation to act as a stimulus for innovation 
(see Box 2.14). 
• The 'Warm Front' (9) scheme in England 
provides heating and insulation improvements 
to households on certain income-related benefits 
living in properties that are poorly insulated 
and/or do not have a working central heating 
system. Qualifying households can qualify for 
improvements worth up to GBP 3 500. Grants 
are available for improvements such as loft 
insulation, draught proofing or cavity wall 
insulation. These improvements have also been 
efficient in reducing the risk of overheating to 
properties, thus reducing related risks to the 
vulnerable. 
• Smart homes, known as 'telecare technology', 
refers to equipping residences with a set of 
advanced electronics and automated devices. 
These are designed to enhance health care 
delivery (and remote physiological monitoring 
of residents) to enable early identification of 
possible problems and emergency situations 
and to maximize residents' safety and overall 
well‑being. Smart homes aim to assist the 
elderly in remaining independent at home by 
(9) http://www.direct.gov.uk/en/Environmentandgreenerliving/Energyandwatersaving/Energygrants/DG_10018661.
Planning urban adaptation 
86 Urban adaptation to climate change in Europe 
proactively addressing their needs. Inclusion 
of temperature and flood sensors in smart 
home technology can be important aspects of 
adaptation reducing mortality rates among 
the infirm and the elderly and improving their 
quality of life. 
In general, climate adaptation can be considered 
as not just a reactive or defensive response but as a 
proactive implementation of a long-term economic 
and sustainable development strategy. 
3.3.4 Dealing with uncertainty and long time 
frames 
Uncertainty is one of the key constraints when 
developing adaptation strategies (Ribeiro et al., 
2009). It gives decision-makers latitude to ignore 
the problems associated with climate change 
or delay development of adaptation strategies. 
Decision‑makers should aim to assess how they 
can improve the decision-making process leading 
to development and implementation of adaptation 
strategies regardless of uncertainties. This is 
certainly no easy task as uncertainties abound. The 
IPCC Special Report on Emissions Scenarios (SRES) 
(IPCC, 2000) defined six different future emissions 
pathways based on potential storylines for the 
future, and thus six scenarios for the associated 
increase in global average surface temperatures. 
Fortunately, the climate projections for the different 
emissions scenarios only start to diverge after 
2050. Therefore, considering the full range of 
climate projections is important only for adaptation 
investments with a very long life time such as flood 
protection measures. 
At the same time, in the medium term the main 
uncertainty is related to differences between the 
outputs of different climate models. In the scientific 
community, there is a trend towards development 
of increasingly complex climate models and 
downscaling the projections to more and more local 
levels. However, creating more complex models 
may not necessarily provide greater accuracy of 
predictions. There may also be a conflict between 
providing spatially precise projections, and 
making these projections accurate (Dessai et al., 
2009). The predictive power of the climate models 
is uncertain and different strategies are adopted 
to address this limitation. Focusing on either the 
upper or the lower bounds of scenarios can lead 
to, respectively, scaremongering or neglecting the 
issue. Good practice when handling uncertainties 
in climate impact scenarios is to provide a plausible 
description of any future impacts. 
Figure 3.5 Simplified cause/effect pathway regarding climate impacts on human health (in blue), 
along with sources of uncertainty (in grey) and target points for societal response 
options (in green) 
Source: Füssel et al., 2006. 
Decision 
uncertainty 
Scientific 
uncertainty 
Natural 
variability 
Non-climatic stressors 
Environmental factors 
Socioeconomic 
and other factors 
Individual behaviour 
Scientific uncertainty 
Greenhouse 
gas emissions 
Change in 
regional climate 
Regional 
weather 
Regional 
health effects 
Mitigation of climate change Adaptation to climate change 
Information collection
Planning urban adaptation 
Urban adaptation to climate change in Europe 87 
Box 3.10 Developing in-house knowledge of the local climate in Stuttgart, Germany 
Stuttgart is located in a valley basin. Due to its industrial 
activity the city has been susceptible to poor air quality 
since the 1970s. Development on the valley slopes has 
made the situation worse by preventing air from moving 
through the city which in turn has contributed to the 
urban heat island effect (see Box 2.5). 
The importance of climatic conditions for human comfort 
in health has been recognised in Stuttgart since 1938 
when the city council employed a meteorologist whose 
job was to analyse the climatic conditions in Stuttgart to 
understand the connection between climate and urban 
development. Since then meteorological conditions have 
been recorded continuously. Based on this information 
a 'climate atlas' was developed illustrating how 
landforms and structures affect the movement of air through the city. It identifies the surrounding slopes, forests 
and agricultural areas as major sources of fresh air for the city. These findings had a significant impact on city 
planning. The city established an environmental office with the task of assessing proposed developments and their 
effect on the local climate. The climate atlas was updated in 2008. The aim was to preserve those areas key to 
improving local climate through development control measures and to improve the presence of vegetation across 
the city. 
The city has accumulated a significant amount of location-specific weather and climate knowledge which is easy 
to access. This has enabled a comprehensive understanding of the weather-related problems in the city. As a 
result, green areas cover more than 60 % of the city and over 39 % of Stuttgart's surface area receives protection 
through conservation laws — a record for the whole of Germany. Other cities, such as Berlin in Germany and Kobe 
in Japan have adapted this successful approach. 
Source: Kazmierczak and Carter, 2010. 
Climate atlas region Stuttgart: http://www.stadtklima-stuttgart.de/index.php?klima_klimaatlas_region. 
In addition, it is important to recognise that when 
considering adaptation, climate is only one of many 
processes that influence outcomes. Many of the 
other processes (for example, socio-economic and 
political issues that determine vulnerability such as 
globalisation, economic priorities, regulation and 
cultural preferences) cannot be adequately predicted 
either. The on-going economic crisis; the uncertainty 
faced by the Euro zone or the 2011 political 
developments in north African and middle-eastern 
countries are examples of the unpredictable turn of 
events. Figure 3.5 presents how the uncertainties 
add up in relation to the risks of climate change to 
human health. 
Information about climate change for specific 
locations can be difficult to obtain. In this context, 
basing future adaptation strategy on past extreme 
weather events can be effective, in particular when 
current climate related risks can be considered large 
and needing action (Füssel, 2007). However, it may 
be difficult for local government to predict local 
climate risks owing to the low probability of extreme 
events occurring. Translating global and national 
information into information relevant at the more 
local level may be challenging. Thereby gathering 
local information is crucial for the formulation 
of adaptation strategies at local or regional levels 
(Ribeiro et al., 2009). In Stuttgart, Germany 
long‑term meteorological observations provided 
a thorough understanding of the weather-related 
problems in the city (see Box 3.10). 
For the majority of cities and regions the possibilities 
of developing in-house expertise are limited, which 
emphasises the importance of collaboration with 
research institutes and other stakeholders. Box 3.11 
provides an example of a simple framework, used 
in the United Kingdom, for considering current 
weather patterns and their impacts. Historical 
records describing the impact and costs of locally 
relevant extreme events are rare and often 
inadequately record key information for modelling 
future adaptation plans (Scott and Weston, 2011). 
Caution is recommended when future adaptation 
responses are based on past events. Predicting 
climate events based on previous incidents is 
not usually reliable and such risks should be 
acknowledged by city governments.
Planning urban adaptation 
88 Urban adaptation to climate change in Europe 
Box 3.11 Local Climate Impacts Profile (LCLIP) — A simple framework for considering current 
weather patterns and their impacts in order to cope with future uncertainties 
Understanding current vulnerability is an appropriate starting point for 
the preparation of an adaptation strategy. In 2006, The UK Climate 
Impacts Programme (UKCIP) developed a Local Climate Impacts Profile 
(LCLIP) as a simple framework for considering current weather patterns 
and their impacts. The purpose of preparing a LCLIP at municipality 
level is to raise awareness of current vulnerability to weather events in 
a particular area. A LCLIP should aim to provide a straightforward list of 
the main consequences of weather events to which a locality is exposed 
and some understanding of local preparedness. The logical source from 
which to gather at least some of this information is the local authority 
— particularly from emergency services' records. Such records are 
not always available therefore local media can be a good source for 
gathering information. 
Between 2006 and 2009, over one hundred LCLIPs were carried out 
by local authorities in the United Kingdom and significantly raised 
awareness of climate change impacts and vulnerability. One example 
is Manchester, where the LCLIP raised the profile of adaptation within 
the city council and brought to light areas of current and future 
vulnerability. For instance, the council's green spaces team became 
aware that increases in the frequency and intensity of future extreme 
weather events could substantially impact their budget. 
Source: UKCIP, 2009; http://www.ukcip.org.uk/lclip/; http://www.ukcip.org.uk/ 
case-studies. 
Science has provided enormous benefits to 
decision‑makers. Collaboration can involve minimal 
engagement via reporting roles to more active 
engagement such as the interpretation of scientific 
information. Scientists can also report, interpret 
and then integrate their scientific information and 
analysis into policy or management options. Indeed, 
some scientists may actually advocate particular 
Birmingham’s Local 
Climate Impacts Profile 
(LCLIP) 
FINAL DRAFT 
(source: Photos taken from BBC West Midlands, Tornado 2005, Heatwave 2006 and Flooding 2007) 
By Reena Kotecha 
Professor John Thornes and Dr Lee Chapman 
August 2008 
School of Geography, Earth and Environmental Sciences, University of Birmingham. 
Keith Budden BeBirmingham and David Ward Birmingham City Council 
policy or management options. At the far end of 
the spectrum are circumstances in which scientists 
participate in making policy choices (Scarlett, 2011). 
An advanced model of collaboration between a city 
government and a research institute is the Institute 
for Sustainable Urban Development in Malmö, 
Sweden (Box 3.12). 
Box 3.12 Translating scientific results into policy relevant information in Malmö, Sweden 
The Institute for Sustainable Urban Development 
(ISU) is a joint venture between the city of Malmö 
and Malmö University. ISU was established in recognition 
of the fact that to fully develop post-industrial Malmö, 
innovative solutions based on an increase in economic, 
ecological and social sustainability factors were needed. 
ISU was founded to develop new ways to cooperate 
in order to facilitate the development of practically 
oriented research and to collect, provide and exchange 
knowledge and experience. ISU evolved from an earlier 
cooperation between the University of Malmö and the 
city of Malmö and is run by a board with two members 
from each. The base funding for ISU comes from the 
city of Malmö and the University of Malmö. The Institute 
deals with sustainability in its broad sense, which 
includes ecological, economic, social and cultural issues. 
ISU aims to initiate, empower and study processes of 
change aimed to create sustainable urban development. 
The work comprises taking part in urban redevelopment 
projects in Malmö, and includes the transfer of 
knowledge and experiences between researchers and 
practitioners. 
Source: http://www.isumalmo.se/isumedia/ISU_ENG_WEB.pdf. 
Photo: © Sundstrom
Planning urban adaptation 
Urban adaptation to climate change in Europe 89 
The uncertainty of future climate and 
socio‑economic characteristics requires careful 
consideration of adaptation options. Even in the 
absence of accurate knowledge about future changes 
approaches can be chosen to take action with low 
risks of maladaptation or overinvestment. These 
can be categorised as 'no regrets' or 'low regrets' 
with safety margins built in, and 'flexible' measures. 
Hallegatte, 2009 and Wardekker, 2011 explain 
further: 
• Low-regret. Low regret options are options 
that yield benefits even in the absence of 
climate change, such as implementing early 
warning systems for floods and heat waves or 
extending the green and blue spaces in the cities 
to improve living conditions. This is discussed 
in more detail in Section 3.3.3 on co-utilising 
benefits of the adaptation solutions. Low-regret 
options can also be seen as those whose costs 
are small or even negative under all plausible 
climate scenarios. Assessment and selection of 
these options does not necessarily depend on 
reliable climate impact projections (Füssel, 2007). 
One example of a 'low-regret' adaptation option 
is restrictive land use, i.e. banning development 
in certain areas which may be lifted if the area is 
no longer at risk. 
Box 3.13 Safety margins provide more security in uncertain situations — Salford, United 
Kingdom 
Figure 3.6 Building with safety margins 
Large areas of the city of Salford in the United 
Kingdom risk being flooded. Concurrently the 
municipality is under pressure to provide new 
residential and non-residential developments. In 
order to resolve the conflict between development 
and flood risk a document entitled 'Planning Guidance 
on Flood Risk and Development' was adopted in July 
2008. The guidance specifies that new residential 
development proposed in high flood risk zone should 
be designed and built in a way that floor levels for 
habitable rooms and kitchens would be no more 
than 600 mm below the flood level predicted for a 
one in one thousand year extreme flood event, and 
not below the flood level predicted for a one in one 
hundred year event. Thus, the design ensures that 
no structural damage is done to the property even as 
a result of an extremely unlikely event and that the 
damage is minimised for more probable flood events. 
Source: Salford City Council, 2008. 
Groundlevel 
Raised groundlevel 
Kitchen/dining 
Living room 
Bedroom 
1:1000 year flood level 
1:100 year flood level 
• Safety margins. Urban projects can be designed 
with additional a capacity to cope with 
climate variability via a built-in safety margin 
(see Box 3.13). Other examples of safety margin 
would include low-elevation spaces with 
non‑essential functions that can store excess 
water in case of flooding. These would include 
squares, parks and parking garages all offering 
buffer capacity. Examples of redundancy 
measures include the creation of multiple 
transport routes for access and evacuation or 
designing power and water supply networks in 
such a way which secures system connectivity 
even if parts are affected by climate events. 
• Flexibility. Climate projections generally span 
50 to 100 years, while most urban planning 
strategies choose a time frame somewhere 
between 20 and 40 years (Füssel, 2007). 
Infrastructure in and around cities needs to be 
built to last. Buildings, roads and open spaces 
all need to be adequately designed for present 
as well as for future conditions including 
climatic conditions. Taking explicit account of 
a changing climate to ensure the sustainability 
of investments over their entire lifetime is often 
referred to as 'climate proofing'. In this process 
adaptation efforts have to incorporate sufficient
Planning urban adaptation 
90 Urban adaptation to climate change in Europe 
flexibility to deal with changing climate risks 
and uncertainties. In addition, the adaptation 
process itself needs to be flexible and allow 
room for on-going reviews, monitoring of results 
and potential adjustment (Box 3.14). Flexibility 
can also be incorporated in urban and transport 
design and other infrastructure. Expectant 
urban design can, through combining the best 
practice in sustainable architecture (e.g. storm 
water treatment guidelines) with creative, open, 
multi‑purpose solutions, provide convenience 
for multiple users under different climate 
change and urban development scenarios. 
Box 3.14 Flexibility in the Thames Estuary 2100 project, United Kingdom 
The 'real options' approach adopted in the Thames 
Estuary 2100 (TE2100) project is a well-known example 
of long-term adaptation planning. The project identified 
a set of decision pathways for flood defences during the 
next 100 years and mapped out available options. For 
each option thresholds for responses were calculated 
together with the required lead times necessary for 
implementation. These thresholds are related to different 
sea levels rather than to different time horizons, 
making them scenario-neutral and thus allowing flexible 
planning despite large uncertainty in the current climate 
projections. 
Source: Decision pathways for the Thames Estuary 2100 project, © UK Climate Projections 2009. 
Figure 3.7 The Thames Estuary 2100 project 
Photo: © Ian Britton
Planning urban adaptation 
Urban adaptation to climate change in Europe 91 
• Appropriate timing and windows of 
opportunity. Climate change is a relatively slow 
process, but because of the long-term effects 
of urban restructuring, spatial choices and the 
relative irreversibility of initiated developments, 
the current policy agenda requires choices 
to be made now in the light of future climate 
resilience. Different time-scales can be 
considered for various adaptation options for 
example, improvement to the drainage system 
can be seen as a short term solution, whilst 
additional provision of trees in city centres 
is a mid- to long-term solution. Furthermore, 
there are multiple windows of opportunity, in 
the short term, for combining climate change 
adaptation with other objectives. In urban areas 
in particular there are significant on-going 
projects focusing on urban densification, renewal 
and development. This provides opportunities 
for incorporating climate change adaptation 
solutions with other measures considered for 
these developments, such as those aiming at 
improved quality in the living environment or 
reduced energy consumption. 
3.3.5 Working with nature — not against 
Traditionally risks from natural processes have been 
managed with engineered or technical measures. 
These have been proven to work to a certain extent 
but when they fail the effects can be disastrous. For 
example, whilst dikes can protect against coastal 
flooding, they still require additional 'soft' protection 
measures such as emergency plans or insurance 
schemes in the event the dikes do not hold. Thus, 
they may not be the most effective or the most 
financially viable solutions. Consequently, a broader 
set of options should be considered. One approach 
is to provide adequate space allowing the natural 
processes in urban areas to take place (Box 3.15). 
Box 3.15 Working with nature, not against it: the Netherlands live with water 
For centuries, spatial planning in the low-lying 
Netherlands has been a matter of separating and 
maintaining the division between land and water. 
However, in 1999 the Ministry of Transport, Public Works 
and Water Management and the Association of Water 
Boards formed an independent committee to assess 
whether current water management policies were 
adequate to deal with the effects of climate change and 
to maintain a safe, liveable and attractive environment. 
The committee in its 'Water Management Policy in the 
21st Century' report stated that a change in water 
management policy was required, involving relinquishing 
space to water rather than winning space from it. This 
was to be achieved by lowering and widening the flood 
plains and constructing water retention and storage 
areas. 
In the case of Nijmegen, this involves moving the Lent 
dike further back from the river Waal and constructing 
an ancillary channel in the flood plains. This will create an island in the middle of the Waal river resulting in a 
unique urban park in the heart of Nijmegen with room for living, recreation, culture, water and nature. 
Sources: Kazmierczak and Carter, 2010; http://www.ruimtevoorderivier.nl/meta-navigatie/english. 
Photo: © Martin van Lokven 
The present situation with the existing dike. The dike is to be moved 350 metres inland. An ancillary channel is to be dug in order 
to give the river more room. This will create 
an elongated island. 
3 
Lent 
Nijmegen 
Waalbrug 
de Oversteek 
2 
Lent 
Nijmegen 
Waalbrug 
de Oversteek 
1 
Lent 
Nijmegen 
Waalbrug 
The measure at Lent shown in phases
Planning urban adaptation 
92 Urban adaptation to climate change in Europe 
Working with nature can provide benefits from 
the natural systems themselves (Scarlett, 2011; 
Bolund and Hunhammar, 1999). Natural ecosystem 
services have often been replaced by artificial 
equivalents in cities and urban areas such as 
drainage, shading or slope stabilisation measures. 
A move towards greater use of natural ecosystem 
services and away from technical and engineered 
approaches has been observed. This is particularly 
relevant in relation to flooding. For example, in 
the United Kingdom there is declining support 
for flood defence systems to reduce the impact of 
flooding in favour of land use planning (Ford et al., 
2011). In the case of coastal protection, traditional 
flood and storm surge protection has relied on 
'grey' infrastructure such as dikes and levees. This 
infrastructure may perform well under certain 
conditions. Yet increasing the performance of this 
grey infrastructure to withstand more frequent and 
more intense storms may be exorbitantly expensive 
in many cases relative to solutions that supplement 
existing grey infrastructure with natural solutions 
like beach nourishment, wetlands restoration and 
sea marsh protections. The latter mix of options may 
provide greater functionality and more resilience 
across a broader range of conditions than traditional 
infrastructure (Scarlett, 2011). The concept of green 
infrastructure (a network of green and blues spaces 
in and around urban areas) emphasises that green 
space planning, delivery and maintenance should 
be equally important to that of other types of 
infrastructure (transport, communications, water 
supply etc.), and is thus considered as an integrative 
Box 3.16 Sustainable urban drainage in Western Harbour, Malmö, Sweden 
Västra Hamnen in Malmö functioned as a shipyard until 
it closed several few decades ago leaving 6 000 people 
unemployed. This problematic area was turned into 
a sustainable district. The mixed-use development 
covers 24 ha, includes, to date, 1 300 apartments 
and approximately 2 000 inhabitants. One of its 
distinct features is the large open storm water system, 
managing storm water within the area and consisting 
of narrow concrete canals and ponds. The system can 
function due to the fact that every courtyard in the 
development lies above the storm water system. Each 
courtyard has its own storm water pond. The courtyard 
and roof run-off flows into the narrow canals integrated 
into streets, alleys and squares. There is a ridge along 
the centre. The storm water to one side of the ridge is 
led through vegetated ponds to the larger salt water 
canal. The water to the other side of the ridge goes to 
the sea. 
The system is not regarded as crucial for managing the storm water at the site — pipes taking the water directly 
to the sea and salt water canal would have been sufficient. However, the main purpose of including the open storm 
water system was its high aesthetic value, as well as to pilot a system of this character within a dense housing 
district. As a result, similar approaches are now being used in other new developments in the city. 
Source: Dalman; Kruuse, 2010; http://www.grabs-eu.org/downloads/Climate_Adaptation_Strategy_Malm__webb.pdf. 
Photo: © Birgit Georgi 
part of the city indispensable to its functioning 
(Pauleit et al., 2011). Green infrastructure consists 
of natural or semi-natural areas in cities, including 
forest areas, parks, playing fields and other open 
spaces; vegetated road-sides and tree-lined roads; 
private gardens; rivers, canals, lakes, wetlands, 
wades and seashores; green roofs and green walls. 
Perhaps the most important role of green 
infrastructure in climate change adaptation in 
cities is reducing temperatures in urban areas. 
In particular, tree shading reduces the surface 
temperatures thus significantly improving human 
comfort (Ennos, 2011). Whilst replacing sealed 
surfaces such as concrete with grass also brings 
some cooling benefits, tree planting is the preferred 
adaptation option for cooling with green walls and 
roofs being used for building insulation. 
Green spaces also contribute to flood prevention. 
A study in the Greater Manchester area, United 
Kingdom, indicated that green infrastructure led to 
a significant reduction in surface run-off following 
rainfall. For example, on sandy soils, for an 18 mm 
precipitation event in the Greater Manchester 
conurbation, low-density residential areas (66 % 
vegetated area) were characterised by 32 % runoff, 
compared with 74 % runoff in town centres (20 % 
vegetated area) (Gill et al., 2007). Green and blue 
infrastructure (a combination of vegetated areas 
and water bodies) is being used in management of 
surface water runoff for example in Malmö, Sweden 
(Box 3.16) and Łódź, Poland (Box 2.15).
Planning urban adaptation 
Urban adaptation to climate change in Europe 93 
Green spaces in cities can both promote and 
hinder climate change adaptation (Kazmierczak 
and Carter, 2010). While the current emphasis on 
sustainability and contribution of green spaces 
to the attractiveness of cities could be used as 
additional leverage for adaptation responses, the 
need for the financial gains from urban development 
and regeneration, often associated with the 
administrative and socio‑economic situation of 
the area, can be a conflicting issue. In addition, 
short term investments in grey infrastructure 
provide greater returns and long term benefits 
of green infrastructure are often considered in 
terms of indirect or non-monetary value. Thus, 
in the case of green infrastructure trade-offs are 
necessary. However, as highlighted in Box 3.8, green 
infrastructure provides a number of additional 
benefits. 
It is also important to acknowledge that green 
infrastructure in many cases can perform its 
functions only when well-maintained and adapted 
to current and future climate conditions. It is 
essential to incorporate green infrastructure in 
the early stages in the development of new urban 
areas (see Box 3.16) to ensure it is not considered 
as an afterthought. For example, parks lacking in 
lush vegetation have a limited potential to provide 
cooling. As the European summers are likely to 
become drier and hotter it is important to consider 
green infrastructure in conjunction with other 
adaptation solutions, such as using drought resistant 
plants, stored flood water, harvested rain water or 
recycled grey water for watering the vegetation. 
3.3.6 Securing resources for adaptation 
Many climate change adaptation measures can be 
implemented at low-cost. Some measures, such 
as infrastructural measures that would not have 
to be taken without climate change, could require 
major investments. For both low-cost and high-cost 
measures, a sufficient resource base in terms of 
financial, human and institutional resources needs 
to be developed and secured. 
The 'Financing the Resilient City' report (ICLEI, 
2011) offers a bottom-up strategy for building 
capacity to finance and implement resilient urban 
development. The idea of this strategy is not 
merely to raise funds for adaptation projects, but 
more comprehensively to build local capacities to 
plan, finance and implement resilience upgrades. 
The report thus calls for a shift in both adaptation 
and disaster risk reduction, from a singular and 
specific focus on affected locations towards a more 
integrated focus on overall risks, development 
conditions and local area performance. 
The integrated strategy foresees that local capacity 
needs to be built in order to prepare, structure and 
manage large scale redevelopment and to leverage 
the right finance for this purpose. Capacity is 
also needed at the local level to organise effective 
demand for resilience as one of the key conditions 
for comprehensive upgrading of vulnerable urban 
areas. This would allow locally driven, large 
and complex projects to advance as quickly as 
conventional top-down projects. 
The key challenge is to match local demand for 
resilience with the right supply of enabling finance. 
This requires preconditions to be met at the local 
level. Stages include: 
• bottom-up planning processes need to be in 
place for identifying vulnerabilities and risks, 
and linking the related risk mitigation solutions 
with priority performance enhancements in 
relevant areas or systems; 
• technical and institutional capacity needs to 
be enhanced for designing comprehensive 
resilience upgrading projects, for managing 
and staging complex project execution, and for 
preparing the related investment propositions; 
• support for bottom-up procurement of 
investment through managed, competitive 
sourcing mechanisms and processes. 
When it comes to mobilising financial resources a 
number of approaches are generally available such 
as using local budgets, tapping into private sources 
and obtaining supportive funding from national 
governments and at the European level. These 
include climate-based taxes and charges, subsidies 
and budget allocations, removal of subsidies or taxes 
with harmful impacts, rules stipulating the ways 
public funds can be used and monitored (Mickwitz 
et al., 2009). Examples of such local revenues are 
given in Section 2.2.3. 
As with other climate proofing efforts, funding 
options should be developed jointly between 
local and higher levels of governance. Additional 
funding from the national and European level, such 
as the EU Structural Funds, can make a decisive 
contribution. Funds aimed at disaster risk reduction, 
such as INTERREG and LIFE+, would also be valid. 
For the period 2014–2020, the European Commission
Planning urban adaptation 
94 Urban adaptation to climate change in Europe 
has proposed allocating at least 20 % of the overall 
Multiannual Financial Framework for both climate 
change mitigation and adaptation measures. This 
20 % will be sourced from the budgets of a wide 
variety of policy sectors (EC, 2011b). This is further 
discussed in Section 4.3.4. 
Private investments of different kinds, including 
the insurance sector, are another funding source. 
Although governance in adaptation cannot rely 
on market actors as heavily as in the field of 
mitigation, and, consequently, the overall weight 
for some measures, such as flood defences, has to 
be carried by public actors. There are exceptions, 
such as green roofing for which the burden falls 
on private actors, unless local governments decide 
to subsidise such practices. Challenges of using 
market-based instruments and private funding in 
the context of adaptation are that market failure may 
also hinder effective adaptation, as incentives for 
change are not diffused effectively through market 
mechanisms. Climate change is dealt with in a 
narrow way through a subset of policies targeting a 
limited range of actors or investments. Compared to 
mitigation‑related market signals, adaptation‑related 
market mechanisms remain clearly underdeveloped. 
This may slow change and limit the 
cost‑effectiveness of climate policy initiatives across 
levels of government. This also implies that the 
promotion of win-win measures addressing climate 
change mitigation and adaptation concurrently 
could be a method for obtaining private funding in 
this area. 
Further reading 
• Shaw, R., Colley, M. and Connell, R., 2007, Climate change adaptation by design: a guide for sustainable 
communities, TCPA, London (www.preventionweb.net/files/7780_20070523CCAlowres1.pdf). 
• AMICA tools (http://www.amica-climate.net/materials.html). 
• ICLEI, 2011, Financing the Resilient City: A demand driven approach to development, disaster risk reduction 
and climate adaptation — an ICLEI White Paper, ICLEI Global Report, ICLEI, Bonn (http://iclei.org/fileadmin/ 
user_upload/documents/Global/Publications/Report-Financing_Resilient_City-Final.pdf). 
• VÁTI, 2011, Climate-Friendly Cities: A Handbook on the Tracks and Possibilities of European Cities in 
Relation to Climate Change, Ministry of Interior Hungary — VÁTI, Budapest (http://www.eukn.org/ 
dsresource?objectid=224489). 
• CoR, 2011a, Adaptation to Climate Change: Policy instruments for adaptation to climate change in 
big European cities and metropolitan areas, European Union, Committee of the Regions, Brussels 
(http://80.92.67.120/en/documentation/studies/Documents/Adaptation%20to%20Climate%20Change/ 
EN.pdf). 
• Ribeiro, M., Losenno, C., Dworak, T., Massey, E., Swart, R., Benzie, M. and Laaser, C., 2009, Design of 
guidelines for the elaboration of Regional Climate Change Adaptations Strategies. Study for European 
Commission.
95 
Multi-level governance — enabling urban adaptation 
Urban adaptation to climate change in Europe 
Climate change 
exposure 
– Temperature 
– Precipitation 
– Sea level 
Sensitivity of cities to 
– Heat 
– Flooding 
– Water scarcity 
Potential climate 
change impacts 
on cities 
Possible adaptation 
measures reducing 
the sensitivity 
Chapter 2 — Climate change challenges Chapter 3 — Planning urban adaptation 
Chapter 4 — Multi-level governance 
Adaptive capacity of 
cities to cope with the 
impacts and reduce 
the vulnerability 
Planning 
urban 
adaptation 
and 
success 
factors 
Multi-level governance action to facilitate 
and implement adaptation 
4 Multi-level governance — enabling 
urban adaptation 
4.1 Governing adaptation at different 
spatial levels 
Figure 4.1 Placing Chapter 4 within in the framework of the report 
Key message 
• Urban adaptation to climate change in Europe is a task that concerns all governmental levels — from 
local to European. While municipalities and regions focus on the implementation of place-based 
adaptation measures, national and European governments should have a supporting role. 
Taking a place-based approach to adaptation 
policies is a way to further policy integration and 
coherence. The key question here is how different 
policy sectors and levels of government interact 
to support the implementation of local adaptation 
measures. Looking at adaptation through an urban 
lens, different ways can be identified for varying 
levels of government to contribute to successful 
adaptation. 
Berkhout (2005) has identified five key challenges 
facing climate adaptation and uses these as a basis 
for proposing rationales for policy action on climate 
adaptation. These relate to: 
• information provision and research; 
• early warning and disaster relief; 
• facilitating adaptation options in a bottom 
up way, for example, by farmers, harbours or 
municipalities; 
• regulating the distributional impacts of 
adaptation, for example, the allocation of water 
resources;
Multi-level governance — enabling urban adaptation 
96 Urban adaptation to climate change in Europe 
• developing, funding and regulating the 
maintenance of infrastructures such as dikes. 
Table 4.1 summarises the roles of local, regional, 
national and European action in the field of climate 
change adaptation on the local level. Action at the 
local level contributes to the implementation of 
adaptation programmes and strategies at higher 
policy levels. 
4.1.1 The local level 
Role and options 
As adaptation is place-based local level 
decision‑making is important. Local conditions 
determine vulnerability and adaptive capacity. The 
local level can best implement adaptation activities. 
Local stakeholders know the specific conditions 
well and can devise flexible solutions using their 
knowledge (Corfee-Morlot et al., 2009). Some cities 
are already very ambitious in working on climate 
policies and many adaptive actions have emerged 
without guidance or support from higher levels of 
government (Mickwitz, 2009; Kern and Bulkeley, 
2009; Keskitalo, 2010e). 
In new urban developments and restructuring 
projects, cities can implement structural measures 
Table 4.1 Actions at different governmental levels towards urban adaptation 
Local action Regional action National action European action 
Implementing action 
• Planning and implementation 
of local adaptation strategies 
• Mainstreaming of adaptation 
concerns into other policy 
areas 
• Spatial integration of 
adaptation needs through 
urban planning 
• Local emergency plans 
• Allocation of municipal 
resources and raising of other 
funds 
• Upgrading local infrastructure 
to make it resilient to climate 
change 
• Engaging civil society and 
private actors 
• Providing incentives, funding 
and authorisation to enable 
local action 
• Addressing inter-municipal 
and urban-rural relations of 
climate change impacts and 
vulnerabilities 
• Developing and implementing 
with cities regional 
approaches, e.g. in river 
basins 
• Ensuring regional coherence 
of local /municipal plans and 
measures 
• Providing a supportive 
national legal framework, 
e.g. appropriate building 
standards 
• Mainstreaming of urban 
adaptation into the different 
national policy areas and the 
national adaptation strategy 
• Funding of local adaptation 
measures 
• Providing national information 
related to climate change 
and regionally downscaled 
information 
• Funding of research and 
knowledge development for 
urban adaptation 
• Supporting boundary 
organisations who link 
science and policy to local 
adaptation needs 
• Adjusting the degree 
of decentralisation of 
competences and authorities 
• Providing a supportive 
European legal framework 
• Mainstreaming of urban 
adaptation needs into the 
different European policy 
areas, e.g. cohesion policy 
• Funding of local adaptation 
measures as well as 
knowledge development for 
urban adaptation; 
• Providing European and 
global information related to 
climate change 
• Enabling and coordinating 
exchange of knowledge and 
experience across national 
borders 
• Addressing and coordinating 
cross-border adaptation 
issues 
Supporting action 
such as the construction of parks, canals, ponds, 
thermal energy storage and modified sewerage 
systems. The key players at neighbourhood or 
city scales are municipal councils and real estate 
developers. In existing urban areas the most 
appropriate measures involve adaptation at the scale 
of individual buildings or streets such as insulation, 
green roofs and modifying street paving for water 
retention. The key actors at this scale are housing 
corporations, companies and private property 
owners. 
Urban areas are constantly changing and if 
municipal authorities, developers, housing 
corporations and private owners consistently 
incorporate climate resilience into their investments 
in the urban environment they can minimise the 
additional costs of climate adaptation (PBL, 2011). 
There are many opportunities for combining these 
tasks with other objectives, such as improving the 
quality of life, reducing energy consumption and 
cutting emissions of greenhouse gases. Municipal 
authorities are the best suited to play a leading role 
in coordinating and managing these adaptation 
efforts. 
Local governments can use different methods of 
governance to foster adaptation as described in 
Table 4.2.(Kern and Alber, 2008).
Multi-level governance — enabling urban adaptation 
Urban adaptation to climate change in Europe 97 
Mode 
of local 
governance 
Explanation Instruments Adaptation action Examples 
Self-governing 
The capacity 
of local 
governments to 
govern their own 
activities. 
Internal 
reorganisation, 
institutional 
innovation, 
strategic 
investment. 
Adapting local assets such as public 
buildings and infrastructure to 
climate change. With adaptation 
measures such as flood protection 
and cooling, the municipality sets 
an example for other local actors. 
Storm water systems in Malmö, 
Sweden (see Box 3.16). 
Water squares in Rotterdam, the 
Netherlands (see Box 2.15). 
Enabling Coordinating 
and facilitating 
partnerships with 
private actors 
and promoting 
community 
engagement. 
Persuasion, 
positive 
incentives, 
participatory 
mechanisms. 
Raising awareness; 
engaging interest groups and 
encouraging private actors in 
participatory planning; 
identify vulnerable groups and 
motivate. 
Extreme weather events can 
be used as 'focusing events' for 
communication efforts, as they 
boost stakeholders' motivation 
and provide media attention for 
adaptation. 
Comprehensive approach with the 
participation of many stakeholders 
to cope with urban flooding in 
Copenhagen, Denmark. The 
devastative flood in 2011 has 
given the activities a higher profile 
(see Box 2.10). 
Provision Delivery of 
particular forms 
of services and 
resources. 
Infrastructure, 
financial policy. 
Service provision such as the 
creation of local warning systems 
and emergency planning. 
Municipalities provide various 
services (e.g. health care and social 
services), which can be used to 
promote adaptation. 
Botkyrka, Sweden has mapped 
out where inhabitants vulnerable 
to high temperatures live, which 
enables the municipal services 
to formulate plans to assist them 
(see Box 2.2). 
Regulation Use of traditional 
forms of 
authority. 
Legislation, 
control and 
sanction 
mechanisms. 
Urban planning regulations, local 
building codes, 
regulations for watering of gardens 
etc. 
Town planning regulation provides 
extra building capacity available to 
developers in return for green space 
in Faenza, Italy (see Box 4.1). 
Table 4.2 Modes of local governance and available instruments 
Source: Adapted from Kern and Alber, 2008. 
Box 4.1 Local regulation in Faenza, Italy, encourages developers to create green space 
The Municipality of Faenza implemented a bio‑neighbourhood 
incentive programme for developers. This was included in their town 
planning regulations. The incentive programme aims to achieve 
energy savings, promote aesthetic qualities of neighbourhoods, and 
also to create better microclimate conditions to prepare for future 
rising temperatures associated with climate change. The incentive 
programme allows developers to extend the size of buildings in 
bio‑neighbourhoods in excess of approved standards if the buildings 
meet certain criteria of environmental sustainability. These include 
green roofs, green walls and water retention systems as well as the 
creation of continuous public green spaces by developers. 
These regulations do not include a set of standards. Agreements 
are negotiated on a case-by-case basis. The negotiations between 
town authorities and developers or housing associations means that 
the wait for building permits to be obtained is shortened, thereby 
providing an incentive to developers to engage in the scheme. 
Sources: 'Faenza: Extra cubature for developers in return for green space'. 
In: Kazmierczak and Carter, 2010; GRaBS project: http://www.grabs-eu. 
org/membersArea/files/faenza.pdf. 
Photo: © Julie70-Flickr
Multi-level governance — enabling urban adaptation 
98 Urban adaptation to climate change in Europe 
Limitations of local governance 
Local authorities face different obstacles in their 
efforts to design and implement adaptation policies. 
Factors affecting local policy design can be of a 
variety of natures including jurisdictional and 
institutional and economic and budgetary. They 
can stem from local sources such as local legislation 
and policy but also from other levels including 
national and European legislative frameworks. 
A summary of typical constraints and possible 
multi-level governance responses are further listed 
and discussed in Section 4.2.2 and Table 4.5. 
Important limitations relate to the scale of 
intervention. Although boosting green urban 
infrastructure can contribute effectively to the 
reduction of heat island effects, municipalities 
cannot solve the problems of river flooding on 
their own. This requires up-stream interventions 
and often a regional or even national approach 
and proper inter-municipal coordination. The 
municipalities' efforts need to encompass both 
horizontal co-operation with other municipalities 
and vertical cooperation with regional and state 
authorities. Moreover, depending on the Member 
State, municipalities do not have the same 
regulatory competences and financial capacities 
which can lead to problems in the design and 
implementation of cross-border adaptation action. 
4.1.2 The regional level 
Role and options 
As mentioned under the limitations for local action 
in the example of flood management (Section 4.1.1), 
regional governments play an important role when 
adaptation issues exceed municipal boundaries. 
Municipalities often need to cooperate with their 
neighbours to address the problem of institutional 
fit, i.e. the match between the spatial dimensions of 
the adaptation challenge and municipal jurisdiction 
(Young, 2002). Hence a key area of collaboration is 
spatial planning across municipal borders. 
Such regional approaches can not only ensure 
success but provide further benefits in the form 
of higher efficiency. Some measures supported 
beyond city borders can come at a lower cost and 
are more sustainable than building flood barriers 
within the city. In addition, shared costs for regional 
vulnerability and impact assessments can reduce the 
burden for each stakeholder. 
The specific role that regional governments can take 
depends on the dynamics of national structures. 
While an elected regional government can play a 
significant role in developing regional adaptation 
policies, administrative regional bodies may only 
play a role in implementing state policy. In a federal 
state a large part of decision-making rights will be 
based in the regions, resulting in relatively large 
differences between regions in how they act on 
adaptation (Keskitalo, 2010a). 
Limitations of regional governance 
The regional scale is an emerging level of adaptation 
strategy development with significant potential and 
room for improvement. Regional strategies focus 
more on letters of intent than concrete action plans. 
In countries where the regional level is weak and 
has no constitutional backing, the regional level may 
suffer from limited influence, lack of resources and 
institutional instability such as in the case of the 
United Kingdom (Box 4.2). 
As with other levels of government, the key 
determinants are institutional fit, scale and interplay 
between the actors (Young, 2002). Regional 
governance can be limited when an administrative 
region does not match the scale of the adaptation 
problem. This can be seen in the example of river 
systems which stretch across borders or when 
dealing with large scale water scarcity which require 
a national or cross-border approach. 
4.1.3 The national level 
Roles and options 
Despite the recent emphasis on governance through 
non-hierarchical networks, where cities and city 
networks can bypass administrative levels and 
collaborate directly with the European Commission, 
national governments provide the crucial link 
between EU priorities and local adaptation action. 
National institutional structures may even be 
the most important element determining how to 
integrate adaptation as a policy aim (Keskitalo, 
2010e). 
Firstly, national governments can provide a strategic 
framework. National adaptation strategies have 
become a key instrument. These strategies can 
embed local action into the national context and
Multi-level governance — enabling urban adaptation 
Urban adaptation to climate change in Europe 99 
Box 4.2 Consequences of the abolishment of the regional planning level for adaptation in the 
United Kingdom 
Until May 2010 the governance structure in England consisted of national, regional and local tiers. At the national 
level detailed planning policy guidance was issued, including documents directly pertaining to adaptation to 
climate change and associated problems, such as flooding. The government's regional body, alongside the 
Regional Development Agencies (RDA), was producing spatial, housing and economic strategies which in many 
cases also related to climate change adaptation. In addition, there are examples of climate change action plans 
being developed by partnerships at the regional level, for example in the north west of England, where the RDA 
developed a robust region-wide green infrastructure framework for adaptation (Kazmierczak and Carter, 2010). 
The current government brought a substantial change. It includes the simplification of the detailed national policy 
guidance to overall principles of sustainable development; removal of the National Performance Framework; and 
abolition of the regional tier. Instead, duties for local authorities to coordinate their actions have been introduced, 
and a bottom-up system of spatial planning has been proposed. The Localism Bill proposes the introduction of a 
new neighbourhood scale system of spatial planning, where the communities set out specific policies and land use 
designations for the local area. These neighbourhood plans will be adopted as part of the official local development 
plan (subject to compliance with its overall vision) which would give them significant weight in the determination 
of planning applications (Adaptation Sub-Committee, 2011). 
Whilst these changes are expected to give more freedom to local authorities and engage the local communities, 
there are concerns about the consistency of such bottom-up planning between different areas due to different 
priorities of those involved in the development of the plans. In addition, certain adaptation measures such as flood 
management require regional approaches rather than those uniquely local. This, combined with the absence of 
direction from higher tiers, may jeopardise the possibility to deliver strategic objectives and implement large‑scale 
solutions. Moreover, adaptation planning requires considerable expertise which may not exist within the local 
communities. The local authorities face significant budget cuts and without national indicators adaptation is 
unlikely to be viewed as a priority (Scott, 2011). 
link cities and regions. They can set the framework 
by developing national legislation and creating a 
variety of standards and incentives (Swart et al., 
2009). 
Secondly, national governments can climate-proof 
national legislation and policy and mainstream 
adaptation into different areas whilst ensuring that 
national policies are also coherent and supportive 
for local adaptation (Corfee-Morlot et al., 2009). 
A further task is to remove barriers to urban 
governance as in the example in Box 4.3. National 
governments also can play a key role in greening 
urban finance by re-designing sub-national taxes 
and grants at local government level (OECD, 2010). 
In terms of regional development, national 
governments need to pay attention to equity issues 
and create climate change policies that address 
differences in vulnerability across different sectors 
and spatial divisions. National governments can also 
support the legal and institutional conditions for 
inter-municipal cooperation. 
Thirdly, national governments play a crucial role 
as supporters and enablers of local and regional 
strategies and action. They provide the necessary 
background information and regional climate 
data, scenarios and assessments. This is addition 
to providing tools, guidance and funding for local 
government action. Box 4.4 provides one example. 
Supporting local adaptation measures provides 
national governments the opportunity for policy 
learning. Neighbourhoods can be seen as testing 
grounds for policy providing valuable lessons on 
the performance of policy measures in different 
local contexts. National governments can observe 
and carefully study local implementation of national 
adaptation strategies, flood risk management 
procedures and other measures since they reveal the 
strengths and weaknesses of national approaches 
and measures. It also allows for the identification 
of related interests, incentives and trade-offs which 
can help or obstruct implementation and serve to 
provide input into the national framework. Local 
adaptation measures also allow for observation of 
direct costs and benefits. Such observations can 
prove to be useful especially within a national
Multi-level governance — enabling urban adaptation 
100 Urban adaptation to climate change in Europe 
Box 4.3 Better incentives for local risk management in France — getting the national 
framework right 
In France property, which is insured against damage 
such as fire, burglary and storms, is automatically 
insured against damages by natural disasters. In this 
case, the insurers and reinsurers use money from an 
additional 12 % premium to provide compensation. This 
additional premium is a legal requirement. If the main 
reinsurer, the Caisse Centrale de Reassurance (CCR), 
goes bankrupt the state grants additional money to 
insure 100 % coverage. This system has been in place 
since 1982. 
The advantage of this system is its security. Everybody 
who has a basic insurance is insured against damage in 
the case of a natural disaster. In addition those settling 
in risk areas who do not have the resources to move to 
another place to settle are supported. The system can, 
however, work against risk management at a local level. 
As the state will pay in the case of a natural disaster, 
people may still choose to settle in potentially risk prone 
areas. This can make it difficult to restrict development 
in such areas. 
Since 1995 the state has taken action to minimise any 
disadvantages arising from the CCR and to provide local governments with a better legislative framework. The 
state has agreed to develop and implement Natural Risk Prevention Plans in the various municipalities. The plans 
aim to limit urban growth in risk areas and minimise damage. 
Source: Grislain-Letremy and Peinturier, 2010; Letremy and Grislain, 2009. 
Photo: © Piotr 
Box 4.4 Stadtklimalotse — a guidance tool provided to local governments 
The German Federal Ministry of Transport, Building and Urban Development supported 
the development of the 'Stadtklimalotse' (urban climate pilot). Local governments can 
use this guidance tool when developing urban adaptation plans and measures. The 
database provides around 140 adaptation measures, relevant policy documents and 
international examples. The core element — the 'pilot' — guides the planners through: 
• Identification of the specific adaptation context; 
• Selection of the relevant thematic areas; 
• Vulnerability assessment; 
• Selection of appropriate measures; 
• Own list of action for climate change adaptation. 
The Stadtklimalotse enables not only adaptation pioneers but also other cities to 
make use of shared adaptation knowledge and experiences and to develop their own 
adaptation plans. 
Source: http://www.stadtklimalotse.net/stadtklimalotse. 
Stadt-klimalotse 
Aktionsset zur Entwicklung 
einer kommunalen 
Anpassungsstrategie 
Ein ExWoSt-Forschungsfeld 
Experimenteller Wohnungs- und Städtebau (ExWoSt) ist ein For-schungsprogramm 
des Bundesministeriums für Verkehr, Bau und 
Stadtentwicklung (BMVBS), betreut vom Bundesinstitut für Bau-, 
Stadt und Raumforschung (BBSR) im Bundesamt für Bauwesen 
und Raumordnung (BBR) 
Wissenschaftliche Begleitung 
Bundesinstitut für Bau-, Stadt-und 
Raumforschung (BBSR) im 
Bundesamt für Bauwesen und 
Raumordnung (BBR) 
Deichmanns Aue 31-37 
53179 Bonn 
Dr. Fabian Dosch 
Tel.: 0228 99401 2307 
fabian.dosch@bbr.bund.de 
Das Bundesinstitut für Bau-, Stadt-und 
Raumforschung (BBSR) im 
Bundesamt für Bauwesen und 
Raumordnung (BBR) ist eine 
Ressortforschungseinrichtung im 
Geschäftsbereich des Bundes-ministeriums 
für Verkehr, Bau und 
Stadtentwicklung (BMVBS). 
Forschungsassistenz: 
TU Dortmund 
Institut für Raumplanung (IRPUD) 
Prof. Dr. Stefan Greiving 
Tel.: 0231 755 2213 
stefan.greiving@tu-dortmund.de 
Dr. Christian Lindner 
Tel.: 0231 755 2475 
christian.lindner@tu-dortmund.de 
Weitere Informationen: 
www.bbsr.bund.de 
Herausgeber 
Bundesministerium für Verkehr, 
Bau und Stadtentwicklung 
(BMVBS) 
Invalidenstraße 44 
10115 Berlin 
Gestaltung und Satz 
Nadine Mägdefrau 
Druck 
flyeralarm GmbH 
Bildnachweis 
(nach Reihenfolge 
der Abbildungen) 
www.fotolia.com: Ron Hudson, 
www.fotolia.com: Franz Pfluegl, 
www.fotolia.com: 
Lars K. Christensen, 
www.flickr.com, CC-Lizenzen 
(http://creativecommons.org): 
Joachim S. Müller, 
www.flickr.com, CC-Lizenzen 
(http://creativecommons.org): 
Ed Yourdon, 
www.flickr.com, CC-Lizenzen 
(http://creativecommons.org): 
Steamtalks, 
Uwe Grützner, 
www.stadtklimalotse.net 
Stand 
September 2011 
Stadtklimalotse Kontakt Impressum 
Eine klimagerechte Stadtent-wicklung 
fordert stärker als 
bisher die Integration vielfälti-ger 
sozialer, ökologischer und 
ökonomischer Aspekte. 
Aufbauend auf der Vorstudie 
zum Klima ExWoSt wurde ein 
akteursspezifisches Aktions-set 
mit Maßnahmen, guten 
Beispielen und weiterführender 
Literatur zusammengetragen, 
welches über den Stadtklima-lotsen 
gezielt abgefragt werden 
kann. 
Der Stadtklimalotse ist ein 
eigenständig anwendbares 
Beratungsinstrument zur 
Auswahl von geeigneten Klima-anpassungsmaßnahmen 
für die 
kommunale Stadtentwicklung. 
Er soll Städten und Gemeinden 
ermöglichen lokalspezifisch 
und allgemein den Ursachen 
und Folgen des Klimawandels 
durch urbane Konzepte begeg-nen 
zu können. 
Der Lotse greift auf eine Daten-bank 
mit rund 140 Maßnahmen 
zurück und hilft durch verschie-dene 
Abfragemöglichkeiten 
die potenziell interessanten 
Maßnahmen für den lokalen 
Kontext auszuwählen. Wichtig 
ist dabei die Identifikation von 
Synergien und Konflikten zwi-schen 
einzelnen Maßnahmen. 
Der Stadtklimalotse wird im 
Forschungsfeld StadtKlima 
ExWoSt sukzessive weiterent-wickelt.
Multi-level governance — enabling urban adaptation 
Urban adaptation to climate change in Europe 101 
context where direct results are put in an overall 
national context (Corfee-Morlot et al., 2009). 
Limitations of national governance 
Observations point to a gap between local, 
bottom‑up adaptation and national adaptation 
strategies. The Finnish example shows that local and 
regional adaptation strategies and measures may 
develop independently with very little linkages to 
national adaptation strategies (NAS). In the case of 
the Finnish NAS, the national focus undermined 
regional and local perspectives, making the strategy 
less interesting for local actors (Juhola, 2010). 
Sweden and several other countries face similar 
limitations. Although this deficiency has been 
recognised, it provides a stark reminder that even 
well prepared national adaptation strategies do not 
automatically lead to local action. 
Another limitation for implementation at the 
national level relates to the barriers between 
policy sectors. Without flexible and cross-sectoral 
coordinated measures, adaptation efforts may be 
hampered by sectoral thinking. 
Financial constraints are present also at the national 
level, especially in austere times. In such instances 
local government funding lines are unlikely to 
stretch to climate action which becomes less of a 
political priority. 
4.1.4 The European level 
Role and options 
As at national level, the EU can support local and 
regional adaptation and assist with speeding up 
implementation. In particular, EU cohesion policy 
shall ensure that the most disadvantaged regions 
are supported. The European Commission's White 
Paper on Adaptation (EC, 2009b) complements 
national adaptation initiatives. It aims to coordinate 
adaptation at the European level and facilitate 
important trans-national connections thereby 
providing a common strategic approach and a 
supportive policy framework. The goals of the White 
Paper up until 2012 are to: 
• build a solid knowledge base on the impact and 
consequences of climate change for the EU; 
• integrate adaptation into EU key policy areas; 
• employ a combination of policy instruments 
(market-based instruments, guidelines, 
public‑private partnerships) to ensure effective 
delivery of adaptation; 
• step up international cooperation on adaptation. 
These activities will lay the ground for preparing 
a comprehensive EU adaptation strategy to be 
implemented as from 2013. All these actions support 
directly and indirectly urban adaptation. 
The newly launched European Climate 
Adaptation Platform CLIMATE-ADAPT provides 
a comprehensive knowledge platform including 
information on urban related issues. The platform 
will be updated continuously and has also the 
potential to support exchange between cities and 
other stakeholders. Furthermore, the Seventh 
Framework Programme (FP7), INTERREG, LIFE, 
ESPON and other EU programmes generate 
knowledge relevant for urban adaptation. 
DG CLIMA recently launched a project to support 
adaptation strategies for European cities (see 
Box 4.12). 
Mainstreaming of adaptation into relevant EU 
policies is an important opportunity to create the 
necessary supportive framework for effective 
climate change adaptation at local level. The 
European Commission has started concrete 
initiatives to integrate adaptation into EU sectoral 
policies, in particular with water and flood risk 
management, agriculture and rural development, 
health, and nature protection and biodiversity. The 
proposal for the Multiannual Financial Framework 
(MFF) for the period 2014–2020 draws explicitly 
on the concept that financing for climate change 
receives contribution from different policy areas 
such as cohesion, environment, agriculture, research 
and external cooperation (EC, 2011b) (Table 4.3). 
The current direct spending on climate change 
mitigation and adaptation under the EU budget 
does not reflect the importance of climate change 
for Europe's future. In 2007–2013 a total of only 
EUR 9 billion, or 3 % of the total budget, has been 
directly allocated to mitigation goals in energy 
efficiency and renewable energy. An additional 
10 % of the budget (EUR 32 billion) links to indirect 
spending on transport including clean public
Multi-level governance — enabling urban adaptation 
102 Urban adaptation to climate change in Europe 
Policy sector Integration of climate change adaptation Importance for urban adaptation 
Regional and 
cohesion 
policy 
High potential of structural funds and related 
cooperation taking place in the framework of 
INTERREG, URBACT for regional and local adaptation 
projects. 
Currently little or no input by Member States, but 
important changes towards better inclusion of climate 
change in the 2014-2020 are proposed. The budget 
share for adaptation in relation to mitigation still needs 
clarification. 
Relevant for integrated urban renewal projects, 
brownfield redevelopment, building insulation, green 
infrastructure projects etc. 
Exchange and generation of knowledge and awareness 
in INTERREG and URBACT. 
Support for local adaptation projects varies depending 
on Member States' priorities and operational 
programmes. 
At present regional policy may also be a source of 
maladaptation when large sums of money are spent on 
non-climate proof measures. 
Environment Water framework and Floods Directives (EC, 2000b; 
EC, 2007a) provide a good basis for integration of 
adaptation to floods. Droughts and Water Scarcity 
strategy (EC, 2007c) relates also to future climate 
changes. 
Nature directives do not address climate change yet. 
Natura 2000 network can be a solution for migrating 
species; the new green infrastructure strategy can also 
serve climate change adaptation. 
20 % of the future LIFE programme 2014–2020 shall 
be dedicated to climate change. 
The directives on Environmental Impact Assessment 
(EIA) and Strategic Environmental Assessment (SEA) 
(EC, 2011a; EC, 2001) do not sufficiently consider 
climate change impacts. The review of the EIA 
directive offers the opportunity for change. 
Flood directive (EC, 2007c) relevant for urban 
adaptation: urban areas are often water bottlenecks 
that require upstream adaptation of rivers. 
Combating water scarcity and drought also a priority 
for many cities. 
Green infrastructure in and around cities delivers 
important services for urban adaptation such as 
cooling under heat waves and water management. 
The national implementation of EIA makes it also 
relevant for local projects 
Agriculture 
and rural 
development 
CAP allows for spending on adaptation-related 
measures. 
Better cross-compliance with climate change through 
the CAP reform (pillar 2). 
Relevant for urban areas in regional approaches, 
e.g. upstream flood prevention measures or water 
management in water scarce regions. 
Transport and 
energy 
Mitigation-oriented sectors with limited progress in 
adaptation measures. 
EU Energy Performance of Buildings Directive 
(EC, 2010b) focuses only on mitigation, but insulation 
could also be a contribution to adapt to heat waves. 
Eurocodes for construction works and structural 
construction products, C(2003) 4639), (2003/887/EC) 
can be a suitable tool for designing construction works, 
checking the mechanical resistance of components, or 
checking the stability of structures to climate change 
impacts. 
High relevance for urban adaptation; critical 
infrastructures to be build climate-proof involving long 
time scales and far-reaching repercussions. 
Synergies between mitigation and adaptation 
measures. 
Industrial/ 
enterprise 
No integration of adaptation, but the business 
community is clearly interested in climate impacts. 
Positive responses can be expected from local 
businesses and their interest in coping with climate 
change impacts. 
Employment/ 
social 
No integration of adaptation; emphasis on green 
growth and jobs. 
Importance of addressing social equity issues and 
distributional impacts of climate change. 
Health and 
consumer 
protection 
Ample research under way; policy focus shifting to 
include climate impacts. 
EU Health Strategy 2008–2013 acknowledges the need 
for action to tackle climate impacts on health. 
Highly relevant for urban adaptation as the majority 
of European population lives in cities and many health 
impacts related to climate change concentrate here. 
Research Considerable research efforts; new information and 
monitoring systems (e.g. early warning systems). 
Clearly beneficial for local adaptation, but the uptake 
of many research outcomes remains limited. 
International 
development 
(UNFCCC) 
Focus on climate change mitigation and adaptation. 
The 'Copenhagen Accord' (2009) included a pledge 
by developed countries to raise USD 100 billion per 
year by 2020 to help poor countries fight climate 
change and adapt to its inevitable consequences. 
Establishment of a Green Climate Fund. 
Durban conference (2011) agreed on a roadmap for 
drawing up a legal framework by 2015 for climate 
action by all countries. 
Durban Adaptation Charter for Local Governments. 
So far potential for adaptive action in urban areas in 
developing countries, but little impact on European 
cities yet. 
Table 4.3 EU policy sectors, adaptation, and impacts at the urban level 
Source: Adapted from Ellison, 2010.
Multi-level governance — enabling urban adaptation 
Urban adaptation to climate change in Europe 103 
transport and investment in rail infrastructure. On 
the adaptation side the figures are clearly lower. 
Climate change adaptation financing can be linked 
to the provision of approximately EUR 6 billion 
stemming from risk prevention expenditures and 
other categories of expenditure where adaptation is 
integrated (Medarova-Bergstrom et al., 2011). 
The EU budget proposal for 2014–2020 promises 
a substantial increase — at least 20 % — around 
EUR 200 billion — shall be used for climate change 
and come from different policy fields (EC, 2011b). 
For example, the LIFE+ programme supports 
integrated projects focusing, among others, on 
themes relevant for climate change adaptation such 
as river basin management plans, cross-border 
flood prevention strategies and climate adaptation 
plans in the EU Member States. The total budget 
of LIFE+ over 2014–2020 is EUR 3.2 billion, out 
of which EUR 0.8 billion are destined for climate 
change (EC, 2011c). However, the proposed 20 % 
shall support both climate change mitigation and 
adaptation. Following the current discussion and 
under the perspective of the Europe 2020 strategy, 
the focus seems to be on mitigation rather than 
adaptation. For example, in Cohesion policy the 
proposal of ring-fencing of funding currently 
concerns only energy efficiency and renewable 
energies while the use of funding for climate change 
adaptation is not mandatory (EC, 2011d). 
The EU seeks to guarantee the effectiveness of 
climate related spending through mechanisms 
such as: 
• (ex ante) impact assessments to determine 
climatic and environmental impacts of proposed 
measures; 
• streamlining proposed measures under specific 
objectives and checking deliveries against result 
indicators; 
• tracking expenditure across different funding 
instruments to secure synergies. 
In addition, the cohesion policy foresees mechanisms 
for climate and environmental investment proofing 
(EC, 2011d; Medarova‑Bergstrom et al., 2011) and 
promotes a broader approach to sustainable urban 
development. 
Perhaps the most relevant for urban areas is the 
EU's cohesion policy with its related structural 
funds which comprise a substantial part of the 
EU budget. This is in addition to the INTERREG and 
URBACT programmes. The funds hold the potential 
to support specific adaptation projects in cities 
and regions. For example, urban renewal projects 
can actively consider climate change by providing 
sufficient green infrastructure. Furthermore, the 
funds and the INTERREG programme (Box 4.5) 
support knowledge development, testing and 
validation of knowledge development, developing 
and implementing regional adaptation strategies 
and projects and generation of awareness amongst 
relevant stakeholders and the general public 
(Ribeiro et al., 2009). However, cohesion policy 
can potentially also hinder adaptation when, for 
example, large infrastructure projects are not climate 
proofed. Systematically integrating adaptation 
requirements in projects, programmes and policy 
evaluation would help to avoid such maladaptation. 
Furthermore, EU cohesion policy, targeting 
economic growth, education, technological 
Box 4.5 INTERREG projects highly supportive for local and regional adaptation 
A series of INTERREG projects in the Baltic sea region has addressed climate change adaptation since 2002. Three 
consecutive projects: SEAREG (Sea Level Change Affecting the Spatial Development in the Baltic Sea Region, 
2002–2005), ASTRA (Developing Policies  Adaptation Strategies to Climate Change in the Baltic Sea Region, 
2005–2007) and BaltCICA (Climate Change: Impacts, Costs and Adaptation in the Baltic Sea Region, 2009–2012) 
have been important platforms for several local, regional and state agencies. This is with respect to raising 
awareness about regional and local climate impacts and the relevance of adaptation in their respective jurisdictions 
as well as devising adaptation options for particular local and regional challenges in fields such as tourism, urban 
planning, and water management. 
A number of INTERREG projects directly targeting urban or regional climate change adaptation in different regions 
of the EU have since been initiated. 
Source: Schmidt-Thomé and Peltonen, 2006; Hilpert et al., 2007. 
Project websites: SEAREG: http://www.gsf.fi/projects/seareg; ASTRA: http://www.gsf.fi/projects/astra; 
BaltCICA: http://www.baltcica.org.
Multi-level governance — enabling urban adaptation 
104 Urban adaptation to climate change in Europe 
development and infrastructure provision, 
can increase the adaptive capacity of cities by 
promoting learning and broad participatory action. 
A systematic mainstreaming of adaptation into 
policies and programmes would increase the chance 
that adaptive capacity is raised. 
Important pieces of legislation for mainstreaming 
adaptation in the EU include the Water Framework 
Directive, the Floods Directive and the Water 
Scarcity and Droughts strategy (EC, 2000b, 2007a, 
2007c). The Environmental Impact Assessment 
Box 4.6 Mainstreaming Adaptation — the Water Framework and the Floods Directive 
The Water Framework Directive (EC, 2000b) establishes 
a legal framework to protect and restore clean water 
across Europe by 2015 and ensure the longterm 
sustainable use of water. It required that river basin 
management plans for the period 2009–2015 were 
developed by December 2009 in all river basin districts 
across the EU. These were due to take climate change 
impacts into account. In addition, climate change must 
also be properly integrated in the implementation of 
the Floods Directive (EC, 2007a). Water directors of 
EU Member States issued a Common Implementation 
Strategy (CIS) guidance document (EC, 2009d) that 
addressed the integration of climate change impacts 
and adaptation in the implementation of the Water 
Framework Directive, the Floods Directive and the 
Strategy on Water Scarcity and Droughts (EC, 2007c). 
This was particularly in view of Member States' second 
(2015) and third (2021) river basin management 
plans. Under the 2012 Water Blueprint, the European 
Commission will also review the Water Framework and Floods Directives, and the Strategy on Water Scarcity and 
Droughts. 
The Flood Directive provides the background to updating national water laws and can accelerate activities as 
regards reducing the impact from flooding. In countries such as Poland, where little awareness exists on the 
impacts of climate change and adaptation needs, EU legislation such as the Floods Directive can trigger and 
support some local and regional adaptation work. Its implementation led to the assessment of flood risks in 
Poland. On this basis many cities in Poland were able to prepare adaptation plans for flood risks including: 
• the identification of vulnerable regions and cities; 
• flood impact assessment; 
• flood risk management; 
• monitoring and information system; 
• guidelines and procedures; 
• information on rescue services, resources, and regulations. 
See also: http://www.kzgw.gov.pl/pl/Wstepna-ocena-ryzyka-powodziowego.html. 
Photo: © Zoli 
Directive (EC, 2011a) can be an important tool for 
procedural integration of adaptation (see discussion 
later in Section 4.3.1). Currently it does not consider 
climate change adaptation sufficiently. The on-going 
review offers the opportunity to correct this. The 
European Commission is developing a strategy 
for an EU‑wide green infrastructure as part of its 
post‑2010 biodiversity policy. This would include 
not only areas falling under the remit of Natura 2000 
(EC, 1992) but also urban green areas, green roofs 
and walls supporting biodiversity as well as climate 
change adaptation.
Multi-level governance — enabling urban adaptation 
Urban adaptation to climate change in Europe 105 
Limitations of European governance 
The level of involvement of the European Union 
in local and regional adaptation, vis-a-vis the 
subsidiarity principle, still remains an open issue. 
The subsidiarity principle delegates regulations to 
the lowest relevant level of government. Interpreting 
this literally can lead to problems with providing 
effective climate change adaptation due to the fact 
that this involves cooperative actions at various 
levels. The extent of control that the EU will have 
over various levels of planning within the Union 
still remains to be debated (Swart et al., 2009). 
For example, Member States decide with their 
Operational Programmes which projects it will 
include and where exactly EU funds will support. It 
is in their power to ensure adaptation is sufficiently 
considered in EU spending. A governing in 
partnership model was discussed in respect to the 
Europe 2020 strategy and future cohesion policy. 
Yet a partnership gap still hinders the strategy 
as local and regional authorities have only been 
consulted, but not involved, in the conception and 
implementation of national reform programmes 
(CoR, 2011b). The process of developing the 
European Adaptation Strategy 2013 can be a 
cornerstone for a better partnership approach. 
Further reading 
• VÁTI, 2011, Climate-Friendly Cities: A Handbook on the Tracks and Possibilities of European Cities in 
Relation to Climate Change, Ministry of Interior Hungary — VÁTI, Budapest (http://www.eukn.org/ 
dsresource?objectid=224489). 
• CoR, 2011a, Adaptation to Climate Change: Policy instruments for adaptation to climate change in 
big European cities and metropolitan areas, European Union. Committee of the Regions, Brussels 
(http://80.92.67.120/en/documentation/studies/Documents/Adaptation%20to%20Climate%20Change/ 
EN.pdf). 
• Ribeiro, M., Losenno, C., Dworak, T., Massey, E., Swart, R., Benzie, M. and Laaser, C., 2009, Design of 
guidelines for the elaboration of Regional Climate Change Adaptations Strategies. Study for European 
Commission. 
Policies for economic and social cohesion have 
traditionally targeted the economy and living 
conditions across Europe. Climate change 
adaptation requires place specific approaches. The 
identification of adaptation hotspots and a cohesion 
policy which targets climate change adaptation 
needs with territorial selectivity would break new 
ground whilst acknowledging that challenges 
remain. (see discussion in Section 4.3.2). 
Achievements in the integration of adaptation 
in sectoral policies remain a challenge for the 
EU. Next to the water and nature directives, 
adaptation policy must also be embedded in 
sectoral policies such as agriculture, transport and 
energy (see examples in Table 4.3). Even if the EU's 
principle spending programmes (CAP, structural 
funds, INTERREG, LIFE) already allow for spending 
on adaptation-related measures there is ample 
room for improvement (Ellison, 2010). For example 
the URBACT programme targeting the exchange 
of experiences between cities regarding urban 
development has not one single project for climate 
change adaptation.
Multi-level governance — enabling urban adaptation 
106 Urban adaptation to climate change in Europe 
4.2 Bridging the levels — multi-level 
governance 
4.2.1 The needs and benefits of multi-level 
governance 
Cities within one nation can differ significantly, for 
instance, with regard to the degree of inclusion of 
non-governmental partners in local development. 
Cities are in a unique position to develop tailored 
responses to the impacts of climate change. They 
have first-hand knowledge of local conditions 
and can develop proactive strategies in response 
to climate change, experimenting with local 
solutions and committing to ambitious targets. 
Local authorities can work together with voluntary 
efforts such as city networks, the private sector 
and community organisations to develop new 
institutional models for local adaptation (Piorr et al., 
2011). 
Cities do not act in a vacuum. They are embedded 
in a legal and institutional context set by national 
governments, the EU and global developments — 
conditions which can be supportive or constraining. 
Ambitious local governments can complement 
national and European priorities through linkages 
with similar-minded municipalities. This can 
be viewed via initiatives such as the Durban 
Adaptation Charter for Local Governments (2011) 
and efforts from various pioneering cities. Another 
example was the 'Nottingham Declaration' in the 
United Kingdom which supported the national 
government in developing adaptation requirements 
for the local level (Keskitalo, 2010b). 
In this context, a multi-level governance approach 
can build bridges between disconnected levels 
Key messages 
• Ambitious municipalities can certainly carry out truly innovative projects in urban adaptation. Doing this 
effectively and efficiently is, however, only possible if support comes from regional, national and European 
levels. 
• Mainstreaming of adaptation in other policy areas and legislation such as the Water Framework, and the 
Floods directives, and EU cohesion policy is key. It must be stated, however, that a number of regulations 
and funding mechanisms do not mention adaptation. The proposal for the EU's next Multi-annual Financial 
Framework will require that 20 % funding for climate change mitigation and adaptation is sourced from 
different policy sectors. 
• A holistic multi-level governance approach can bridge the gaps between the different levels of governance and 
provide a coherent and effective framework for urban adaptation. 
• Since 'adaptation' is a relative newcomer in policy development, multi-level governance in the form of 
dialogue between government levels, private actors and citizens is of particular importance. 
of government, issue-specific jurisdictions and 
stakeholders to support concerted action. The 
benefits of multi-level governance are: 
• coordination can lead to implementation that is 
more than the sum of individual measures; 
• joint work between stakeholders at all levels 
avoids processes becoming locked in conflict; 
• it allows for measures which cannot be 
developed or implemented by one actor due to 
limits of jurisdiction or responsibility; 
• multi-level governance promises effectiveness 
and efficiency gains. 
The concept of multi-level governance 
Modern governance is not based on a centralised 
'command and control' system but is dispersed 
across multiple centres of authority (Hooghe and 
Marks, 2003). There are many self-organising, 
inter-organisational networks which complement 
existing hierarchies in terms of allocating resources 
and exercising control and coordination (Rhodes, 
1996). Two dimensions of governance exist: vertical 
and horizontal. As Section 3.3 has already dealt 
with the horizontal dimension, subsequent sections 
will focus on the vertical dimension i.e. multi-level 
governance. 
Different types of multi-level governance exist. 
Type 1 refers to a clear division of jurisdiction
Multi-level governance — enabling urban adaptation 
Urban adaptation to climate change in Europe 107 
between hierarchical levels of government. It 
relates to the division of tasks in federal states and 
is about power sharing among a limited number 
of governments operating at just a few levels. 
Type 2 refers to flexible networking activities 
related to a specific task. Functional jurisdictions 
are continuously shifting and have no clear borders 
(Table 4.4) (Hooghe and Marks, 2003). 
Urban adaptation policy is at an embryonic phase 
and a lack of fluidity should be accepted by 
policymakers. In this instance type 2 multi-level 
governance is of particular relevance for urban 
adaptation, although in practice a combination 
of both types is needed. This report uses the 
following definition for multi-level governance: 
non-hierarchical forms of policymaking, involving 
public authorities as well as private actors, who 
operate at different territorial levels, and who realise 
their interdependence (based on Kohler-Koch and 
Rittberger, 2006). 
The overall governance context 
Developing multi-level governance approaches for 
urban adaptation in Europe needs to consider the 
diversity of formal governmental systems within 
Europe. Government structures vary in Europe 
as well as the extent to which a centralised or 
decentralised approach is used. These systems can 
determine the ways in which local, regional and 
national authorities can act (Keskitalo, 2010a). 
In a more decentralised state, or a state with 
strong regional and local authorities, the local level 
usually has stronger decision-making rights and 
more responsibilities and options for managing 
adaptation rather than being dependent on funding 
from the state level. In federal states — such as 
Germany — regional governments usually have 
strong decision-making rights. Unitary states, where 
the central government determines the powers and 
competences, can also have strong local and regional 
Type 1 Type 2 
Tasks General-purpose jurisdictions: multiple functions, and 
in many cases, a court system and representative 
institutions 
Task-specific jurisdictions, for example, solving a 
particular common resource problem 
Members Non-intersecting memberships Intersecting memberships 
Levels Jurisdictions organised at a limited number of levels No limit to the number of jurisdictional levels 
Design System-wide architecture Flexible design, no great rigidity 
Table 4.4 Two types of multi-level governance 
Source: Based on Hooghe and Marks, 2003. 
governments. Sweden, for instance, although an 
unitary state, has strong municipal governments 
holding so called 'local planning monopolies' 
(Keskitalo, 2010a; PLUREL, 2011). 
If cities have the capacity to make more decisions 
then this will place them in the position to decide, 
relatively independently, on issues related to 
adaptation. However, if a city has not prioritised 
adaptation itself little pressure will be forthcoming. 
Large differences between the cities can develop as it 
is the case in Sweden. Adaptation as a priority does 
not always develop in vulnerable cities even if the 
administrative power to do so exists. Other factors, 
such as political leadership and the economic 
situation, can also be driving forces (Keskitalo, 
2010a; 2010b). 
In a more centralised state or administration, the 
local level is in general guided by the central or 
regional administrations. If adaptation is high on the 
national or regional agenda, legislation can ensure a 
minimum level of relevant action at the local level. 
In the United Kingdom the previous government 
developed relatively strong central steering on 
adaptation. This included an indicator on adaptation 
within the system for local government evaluation 
(Box 4.7) (Keskitalo, 2010b). However, a centralised 
state or administration that is not focused on 
adaptation may restrict possibilities for local 
governments. 
Understanding of the different governmental 
contexts in Europe is decisive when developing 
appropriate multi-level governance approaches. 
As well as interacting at the state level, local 
governments can also operate within a European 
level. This allows for cooperation between 
territories of the European Union, like the European 
macro‑regional strategies of the Baltic Sea or the 
Danube (Piorr et al., 2011). Such programmes 
can encourage cooperation between local 
governments with EU funding assisting to finance
Multi-level governance — enabling urban adaptation 
108 Urban adaptation to climate change in Europe 
adaptation‑related development (Keskitalo, 2010d; 
Juhola, 2010; Westerhoff, 2010). The EU also holds 
a large number of policies that impact local and 
regional land use, including the Habitats and Water 
Framework Directives (Ellison, 2010). 
The complex collective-action problems related to 
climate change mitigation and adaptation lead to a 
situation where no actor can resolve these problems 
single-handedly (Kooiman, 1993; Stone, 1986). In 
Europe, each level of government has a role to play 
in supporting climate change adaptation in cities 
and towns. 
4.2.2 Challenges 
Multi-level governance also faces barriers that 
cause ruptures in the policy cycle of adaptation. 
Preliminary results of a survey among the 
EU Member States presented in the European 
Climate Adaptation Platform CLIMATE-ADAPT 
lead to the conclusion that multi-level governance 
on climate change is not yet fully established. In a 
range of countries, urban adaptation still happens in 
an ad hoc fashion and in isolation. Different barriers 
lead to problems in policy formulation, knowledge 
integration for decision support, decision-making, 
implementation and, finally, in monitoring and 
evaluation. 
Box 4.7 UKCIP — an example of support for coordinating adaptation across governmental levels 
The United Kingdom Climate Impacts Programme (UKCIP) has often been 
hailed as a success story in providing support for coordination of climate 
change action across levels. A comprehensive approach, facilitating local 
and regional, public and private actors to devise and implement adaptation 
measures contributed to its success. The UKCIP provides a uniform platform 
for local authorities and for coordination on adaptation in the English regions. 
It supports bringing local authorities to certain minimum levels of adaptation. 
It also provides a uniform knowledge base of climate scenarios and an 
important channel of communication between different levels of government 
and the scientific community. 
Sources: Keskitalo, 2010b and 2010d; McKenzie Hedger et al., 2006. 
Barriers can have structural, institutional or more 
operational characters: 
• Structural challenges to governing climate 
change adaptation include: 
- Unclear authority and responsibilities, linked 
with financial constraints to urban adaptation. 
The current structures and budgets for strategy 
development and decision-making at local, 
regional, national and European level are often 
not appropriate for multi-level governance. 
- A narrow interpretation of the subsidiarity 
principle restricts interaction with other 
governmental levels. Once the responsibility of 
certain adaptation-related duties is relegated 
to one authority, others are less inclined to 
facilitate and coordinate. 
- Adaptation is a long-term process while 
political structures and persons at all levels 
are changing over shorter periods. Long-term 
decisions prove difficult to achieve (ICLEI, 
2010). 
• Operational challenges include: 
- A lack of communication and transparency 
between different spatial scales and sectors. 
A lack of understanding of each other's 
language and culture can lead to unnecessary 
conflict; it takes time to build trust and 
understanding.
Multi-level governance — enabling urban adaptation 
Urban adaptation to climate change in Europe 109 
- Inadequate organisation of the science-policy 
interface leads to a lack of capacity to raise 
awareness on adaptation challenges and 
responses, to sustain attention on adaptation, 
and to provide a sound knowledge base for 
adaptive action. 
- Financial constraints are evident barriers to 
operational multi-level governance, because 
multi-level governance requires additional 
resources. This includes costs which are 
typically subsumed as working hours. 
- The complexity of the adaptation challenge 
may well prove a problem for politicians who 
wish to demonstrate the direct impact of their 
work (ICLEI 2010). 
Table 4.5 lists typical structural and operational 
barriers governing urban adaptation at local/ 
regional and national/European level and adds 
possible responses from a multi-level approach. 
Table 4.5 Key barriers to local adaptation and possible multi-level governance responses 
Barrier type Barriers at local and 
regional level 
Possible support from a multi-level 
governance approach 
Barriers at national 
and European level 
Jurisdictional 
and 
institutional 
Lack of mandate at the 
subnational level to address 
adaptation issues and problems 
of regional coordination between 
municipalities. 
Clear mandates for local authorities, clarity of 
responsibilities between local, regional, national 
and European actors; 
Acceptance of the territorial cohesion approach 
and the Territorial Agenda. 
Narrow interpretations of 
subsidiarity leaves little 
room for flexibility. 
Maladapted institutional designs 
which hinder coordination across 
relevant issues 
(vertical/horizontal). 
Ensuring policy coherence, establishing 
mechanisms and incentives for horizontal and 
vertical coordination, addressing issues of 
scale and the problems of institutional fit and 
interplay; 
Development of the EU adaptation strategy as an 
opportunity. 
Novelty and instability of 
the adaptation agenda, 
the EU's role still being 
developed. 
National or regional laws, 
rules and regulations lead to 
maladaptation and increase 
vulnerability. 
Climate proofing/mainstreaming of local 
adaptation needs into national and European 
legislation and budgeting; 
Policy coherence through procedural integration 
of adaptation, e.g. in SIA, SEA and policy 
evaluation. 
Sectoral policies with 
vested interests. 
Political Local authorities influenced by 
particular special interests. 
Enforce the applications of the principles of good 
and democratic governance; 
Ensure broad public participation. 
Authorities influenced by 
particular special interests. 
Pressure to maintain 'business as 
usual' development pathways. 
Clear signals, including incentives, from national 
and European to local policy levels, that change 
is necessary; 
Articulate, to national and European level, local 
demand for change based on local adaptation 
experiences; 
Using the momentum of extreme weather events 
and other crises to forward the adaptation 
agenda. 
Pressure groups and 
political interests 
emphasise 'business 
as usual' development 
pathways. 
Pressures of short-term 
electoral cycles on effective risk 
management and long time-lag to 
reap full adaptation benefits. 
Raising awareness for the challenge and urgent 
need for adaptation — use local pressure where 
climate change impacts are felt first; 
At the local level, use integration into long-term 
national and European processes; 
Sustained attention on procedural integration of 
adaptation in monitoring and evaluation efforts. 
Adaptation not a priority at 
national or European level, 
rather on mitigation, eco-efficiency, 
innovation and 
green growth. 
Lack of willingness to accept costs 
and behavioural change. 
Build clear evidence on costs and benefits of 
adaptation; 
Communication about early-adapters and best 
practice; 
Exchange European-wide knowledge; good 
practice and dialogue with stakeholders across 
all levels; 
Use local pressure to act. 
Lack of willingness to 
accept costs.
Multi-level governance — enabling urban adaptation 
110 Urban adaptation to climate change in Europe 
Source: Adapted and expanded from Corfee-Morlot et al., 2009; Corfee-Morlot et al., 2010. 
Table 4.5 Key barriers to local adaptation and possible multi-level governance responses (cont.) 
Barrier type Barriers at local and 
regional level 
Possible support from a multi-level 
governance approach 
Barriers at national 
and European level 
Economic and 
budgetary 
Lack of resources or funding to 
address problems identified. 
Climate proofing the budgets at different levels; 
Provide guidance and support for applicants to 
EU and national funds; 
Support the creation of market demand for 
adaptation; 
Establish support for local adaptation policies 
and measures, e.g. through public-private 
partnerships. 
Lack of resources, 
including immediate 
challenges of financial 
austerity. 
Differences between perceived 
and real costs and benefits. 
Improve, exchange and coordinate knowledge 
across Europe; 
Grasp the chance for structural improvements in 
the context of the financial crisis; 
Search for solutions across levels. 
Uncertainty about the 
costs of climate change; 
Problems in determining 
sufficient level of 
intervention. 
Difficulties mainstreaming 
adaptation into different budget 
lines. 
Awareness raising and education of stakeholders 
in other sectors than adaptation; 
Exchange knowledge and experience with other 
regions and other level governments; 
Establish clear guidelines for systematic 
mainstreaming. 
Difficulties mainstreaming 
adaptation in different 
budget lines. 
Inter-sectoral competition over 
budgeting in view of no increase 
expected. 
Need to make an economic case on adaptation 
— show economic benefits of multi-purpose 
adaptation measures; 
Use good practice from elsewhere. 
Inter-sectoral competition 
over the national/European 
budgeting — no increase 
expected. 
Technical and 
scientific 
Lack of local scale relevant 
scientific or technical information. 
Collect and summarise knowledge and 
information via central platforms such as the 
European platform CLIMATE-ADAPT; 
National and European research aimed at local 
vulnerability and adaptation, also with high 
emphasis on practice-oriented results and tools; 
Exchanges with regional and local knowledge 
holders; 
Establish science-policy organisations (boundary 
organisations) and networks such as regional 
climate partnerships; 
Support European climate research through 
EU instruments (Framework programmes) 
and national instruments, including joint 
programming between Member States; 
Establish and develop monitoring tools for 
following progress in adaptation strategies and 
measures (e.g. national reporting comparable to 
climate policy in mitigation). 
Lack of coherent, 
comparable, up-to 
date knowledge on 
national regional and 
local vulnerabilities and 
adaptation. 
Inadequate understanding or 
ignorance of climate risks. 
Develop climate change communications 
programmes and training tools; 
Make use of communication efforts at other 
levels; 
Use of information and training tools provided at 
internet portals at national and European level 
like the European platform CLIMATE_ADAPT. 
Challenges in 
communicating climate 
change effectively. 
Scientific uncertainty; 
Lack of technical capacity or 
access to expertise. 
Establish across levels common guidelines for 
vulnerability assessments; 
Provide support tools and training from national 
and European levels; 
Support practice-relevant and academic research 
and support by boundary organisations.
Multi-level governance — enabling urban adaptation 
Urban adaptation to climate change in Europe 111 
4.2.3 Success factors 
Making multi-level governance for climate change 
adaptation a success depends on certain factors 
including: 
• broad acceptance of the complexity of 
adaptation challenges and necessary action 
together with a strong commitment from 
concerned stakeholders to cope with the 
challenges by integrated and multi-level 
governance while respecting Europe's principle 
of subsidiarity and responsibilities; 
• adequate distribution of authority and 
responsibility, correct processes and good 
relationships and coordination between spatial 
scales and actors; 
• multi-level institutional and decision-making 
structures that reflect the complexity of 
adaptation challenges and the interlinkages 
between the different governmental levels; 
• stable structures over longer periods despite 
political changes to ensure continuous work as 
increasing the adaptive capacity requires time; 
• a comprehensive knowledge base about climate 
change impacts, vulnerabilities and adaptation 
options needs to be established and continuously 
updated such as the European Climate 
Adaptation Platform CLIMATE‑ADAPT; 
• regional projections on impacts and 
vulnerabilities, alongside global and European 
information; 
• tools of active information exchange 
and continuous learning supplementing 
CLIMATE‑ADAPT and making it work via joint 
projects, development of transferability tools 
for good practice, training, staff exchange and 
coaching (Rob Swart et al., 2009; Georgi et al., 
2012). 
Research and experience on environmental policy 
integration shows that a variety of communicative, 
organisational and procedural instruments can 
also support integration. Mickwitz, 2009 points 
to measures such as making impact assessments 
climate change inclusive, coordinating territorially 
through spatial planning, using national and 
other public budgets for mainstreaming and 
introducing cross-compliance requirements (such 
as on environmental regulations) for target groups 
receiving benefits in other policy fields. 
Further reading 
• Keskitalo, E. C. H., 2010, Developing adaptation policy and practice in Europe: multi-level governance of 
climate change, Springer, Dordrecht; New York. 
• Corfee-Morlot, J., Kamal-Chaoui, L., Donovan, M., Cochran, I., Robert, A. and Teasdale, P., 2009, Cities, 
Climate Change and Multi-level Governance OECD Environmental Working Papers N° 14, OECD Publishing. 
• VÁTI, 2011, Climate-Friendly Cities: A Handbook on the Tracks and Possibilities of European Cities in 
Relation to Climate Change, Ministry of Interior Hungary — VÁTI, Budapest (http://www.eukn.org/ 
dsresource?objectid=224489).
Multi-level governance — enabling urban adaptation 
112 Urban adaptation to climate change in Europe 
4.3 Pillars for multi-level governance 
Key messages 
• Policy coherence, territorial governance, cross-level institutional capacities, access to funding and an 
adaptation knowledge base linking all levels are important building blocks towards a holistic multi-level 
governance approach. 
• The outlook on successful climate adaptation governance is rather optimistic, provided that European actors at 
different levels learn to work together and that climate change adaptation can be sustained as part of the EU 
political agenda. 
Based on these ideas and the factors mentioned in 
Section 4.2 the report elaborates the following pillars 
for multi-level governance: 
• policy coherence through multi-level climate 
proofing; 
• territorial governance and spatial planning as 
means for policy integration; 
• building institutional capacities across levels; 
• securing access to funding for adaptation 
measures; 
• developing the multi-level knowledge base. 
Table 4.6 provides a first overview. 
4.3.1 Policy coherence through multi-level climate 
proofing 
The principle goal of climate proofing is to 
adapt the legal and policy framework, removing 
inconsistencies and barriers, until it supports urban 
adaptation to climate change. There are several ways 
to achieve this. 
Firstly, policymakers can screen existing frameworks 
for climate relevance and add, where necessary, the 
requirement to consider climate change. Systematic 
climate policy evaluation work can support 
evidence-based policymaking and learning in the 
longer term (Haug et al., 2009). Obvious examples 
at EU level are the Water Framework Directive 
and the Floods Directive (EC, 2000b; EC, 2007a). 
Introducing cross-compliance requirements (e.g. on 
environmental regulations) can also play a role 
in future revision processes. The climate proofing 
project from DG CLIMA (Altvater et al., 2011) 
has made efforts in this regard by assessing the 
European legal framework in four areas, one of 
which being urban areas. 
Secondly, climate proofing should play an important 
role when new regional and local policies are 
developed such as the EU budget for 2014–2020 
(Box 4.8). Based on an analysis of sectoral policies 
and related adaptation measures, Urwin and 
Jordan (2008) suggest that climate proofing works 
best when integrated into the development of new 
policies at local and regional levels.
Multi-level governance — enabling urban adaptation 
Urban adaptation to climate change in Europe 113 
Contributions to put a multi-level governance approach into practice by: 
Local (urban) 
governments 
Regional 
governments 
National 
governments 
EU institutions Other stakeholders 
Policy 
coherence 
Linking up with 
national and EU 
adaptation strategies; 
Integration between 
city-sectoral 
programmes; 
Climate‑proof 
budgeting and 
planning. 
Integrate local needs 
with national and EU 
regional policy goals. 
Use the national 
budget as a driver for 
policy coherence; 
Eliminate national 
incentives for 
maladaptation; 
Climate-proofing and 
territorial governance. 
Use the EU budget 
as a driver for policy 
coherence; 
Mainstream 
adaptation into 
different policy areas 
providing a framework 
for national and 
subnational 
governments. 
Businesses 
can engage in 
climate‑proofing 
and support their 
local governments to 
follow suite. 
Institutional 
capacity 
Establish structures 
to access national and 
EU decision-making, 
e.g. intermediary 
associations and 
transnational 
networks such as 
CEMR, EUROCITIES, 
ICLEI. 
Establish intermediary 
organisations to 
facilitate regional 
climate co-operation 
and organise capacity 
building. 
Adjust responsibilities 
and tasks of the state; 
Establish clear roles 
and coordinating 
procedures 
between national 
and subnational 
governments. 
Facilitate access for 
local authorities in EU 
policymaking. 
NGOs and 
transnational 
municipal networks 
play an important 
facilitative role in 
climate policy and 
voicing local concerns 
at higher levels of 
policymaking. 
Spatial 
planning 
and 
territorial 
governance 
Integrate adaptation 
in urban planning 
and demand 
implementation into 
regional, national 
planning. 
Address adaptation 
in a regional planning 
approach in functional 
terms (i.e. regardless 
of city limits, bio-geographical 
regions, 
river basins etc.); 
Engage in EU 
territorial cooperation. 
Adopt and make 
use of the Territorial 
Agenda principles at 
national level; Include 
the spatial aspect 
of climate change 
impacts in national 
adaptation strategies. 
Promote the EU 
Territorial Agenda and 
encourage Member 
States to do so as 
well; 
Integrated adaptation 
into the territorial 
cohesion concept. 
Regional 
intermediaries 
(e.g. chambers 
of commerce, 
civil societies) 
can be supportive 
for territorial 
approaches. 
Funding Secure access to 
multiple sources of 
funding; 
Use value capture 
mechanisms to 
raise funds for local 
adaptation. 
Build regional 
networks and 
partnerships for 
adaptation funding. 
Facilitate local access 
to national and EU 
funding through 
national programming, 
guidelines and 
supporting tools. 
Climate-proofing the 
EU budget; 
Integrating financing 
adaptation into 
cohesion and other 
policies; 
Securing accessibility 
of EU funds to cities; 
ensure that adaptation 
is not overshadowed 
by mitigation. 
Private actors, e.g. 
insurance companies 
can facilitate 
innovation by raising 
funds. 
Knowledge Build capacities to 
knowledge absorption 
and adaptation; 
Cooperate with 
research institutions 
and individual 
knowledge providers; 
Provide local 
knowledge to other 
levels. 
Share adaptation 
knowledge on a 
regional forum; 
Provide regional 
knowledge to national 
and European level; 
Coordinate climate 
relevant research and 
development projects 
regionally to save 
costs; Encourage 
the exchange of 
knowledge and 
practice. 
Establish national 
climate change 
communication 
programmes and 
information portals 
and link with the other 
levels; 
Adaptation research; 
Guidance and training 
programmes; 
Establish boundary 
organisations to 
bridge science and 
policy. 
Channel research 
and innovation funds 
towards adaptation 
and ensure a broader 
usability in practice; 
Provide the European 
data context and 
improve data on urban 
adaptation; develop a 
coherent monitoring 
mechanisms for 
adaptation action; 
Make full use of 
CLIMATE-ADAPT 
Provide knowledge, 
e.g. universities, 
experts, citizens; 
Engage with 
practitioners at 
different levels, place 
value on practical 
applications of 
adaptation research. 
Table 4.6 Summary table of possible actions of the different stakeholders to develop the 
multi‑level governance framework and tools for urban adaptation in Europe
Multi-level governance — enabling urban adaptation 
114 Urban adaptation to climate change in Europe 
Thirdly, designing laws and policies in a way that 
provides people with sufficient adaptive capacity 
can also increase support to the legal and policy 
framework. Policies and laws in particular in the 
areas of economy, social, cohesion, education 
and research can enable society (individuals, 
organisations and networks) to cope better with 
climate change (Gupta et al., 2010). A higher level of 
education is assumed to increase citizens' adaptive 
capacity due to better knowledge absorption skills 
and higher incomes. The current proposal for 
the European Social Fund regulation (ESF) shall 
support a shift towards climate resilience through 
the reform of education and training systems, 
developing skills and qualifications (EC, 2011b). 
European programmes to support a smarter and 
more inclusive European development can thus 
increase the adaptive capacity of individuals, cities 
and societies. 
Overall, both new and existing policies and 
regulations need not only to be climate proof but 
also urban proof. This means that regional, national 
and European governments check the likely impacts 
of their policy on the options open for cities to act in 
order to be supportive rather than hindering local 
action. If, for example, rail tracks or motorways, 
planned at national level and eventually funded 
Box 4.8 Climate proofing the EU budget 2014–2020 
The Institute for European Environmental Policy (IEEP) analysed the 
opportunities for climate proofing the EU budget and developed a guide for 
policymakers. It aims to aid policymakers in the forthcoming preparations and 
negotiations for the post-2013 MFF. 
The guide aims to clarify what climate proofing the EU budget actually means 
and how it can be put into practice when addressing the forthcoming EU 
budget. Experience gained through the implementation of the current Cohesion 
Policy can also be used. It also addresses some of the key questions on the 
future EU budget, including whether or not the main priorities and policy goals 
of the EU budget are coherent with the EU's climate change objectives. If not, 
what could and should be done about this? And how can the EU budget be 
turned into a tool to support efforts to tackle climate change? 
Among the priority measures, the following are identified: 
• securing more funds for climate change, including a dedicated climate fund; 
• setting cross-cutting priorities on climate change in the EU budget; 
• applying conditionality and incentives; 
• reforming and phasing out harmful spending; 
• development of climate change-related indicators and reporting (Medarova-Bergstrom et al., 2011). 
In the case of the Cohesion Policy for the period 2014–2020, the proposal for the regulation of the Structural 
Funds already foresees climate change adaptation and risk prevention as conditionality. National and regional risk 
assessments have to be in place to obtain funding (EC, 2011e). It would ensure that infrastructure in particular, 
which lasts for decades and is very expensive, can cope with future climate changes. 
by the EU budget, cut off areas for flood retention, 
local and regional governments are left with fewer 
options for flood management. 
One facet relevant for building policy coherence is 
the so called 'procedural integration'. Procedural 
integration requires considering climate change 
adaptation in the whole process at all levels without 
dictating the outcome. See Figure 4.2 for an example 
of integration into the framework for cohesion 
policy. 
Environmental Impact Assessments (EIAs) are 
another example particularly relevant for the 
purpose of procedural integration (Agrawala 
et al., 2010). This is due to the wide thematic 
and institutional reach of EIAs. Incorporating 
adaptation concerns in EIAs would affect existing 
modalities for development project design, 
approval and implementation and would be done 
through multiple entry points. Several national 
and sub‑national (local, regional) authorities, as 
well as international organisations using EIAs have 
made some progress in examining the possibilities 
of incorporating climate change impacts and 
adaptation measures within the EIA context. Highly 
relevant for this mainstreaming effort is the on-going 
revision of the EIA directive as a way to ensure that 
Strategies and Instruments for 
Climate Proofing the EU Budget 
Keti Medarova-Bergstrom 
Axel Volkery 
Pernille Schiellerup 
Sirini Withana 
David Baldock
Multi-level governance — enabling urban adaptation 
Urban adaptation to climate change in Europe 115 
Figure 4.2 Mainstreaming climate change into 
the process of cohesion policy at 
different levels 
Source: Adapted from Claus Kondrup, 2011. 
Mainstreaming climate change 
EU Policies — EU Law — Europe 2020 — MFF 
Cohesion package — set of Regulations 
Common Strategic Framework 
National legislation, policies 
Partnership contracts 
Operational programmes 
National/regional priorities 
Selection criteria 
Calls for proposals 
Projects on the ground 
plans and projects falling under this scope require 
climate proofing as a pre-condition with implication 
for the local and regional development (Mickwitz, 
2009; Birkmann and Fleischhauer, 2009). 
The inclusion of climate change adaptation into 
EIA and SEA involves a number of challenges. 
The limited availability of detailed information 
on historical climate patterns, as well as specific 
scenarios of future climate for the project location 
poses a major challenge. In many jurisdictions 
such information is currently not available 
(Agrawala et al., 2010). In addition, if the process 
does not adequately consider the uncertainties 
associated with climate change projections, it risks 
counterproductive investments in altering project 
design. Thus, the procedures need a degree of 
flexibility to accommodate new information on 
climate change. In this sense, the climate-proof 
EIAs need to demonstrate features of adaptive 
management, where new information on both 
climatic and socio-economic changes can be factored 
into the EIA process (Pahl-Wostl, 2009). 
4.3.2 Territorial governance 
From a European perspective, the European Union 
institutions along with the national governments 
need to identify regions and cities with similar 
problems as well as hotspots for adaptation. The 
results of Chapter 2 and Section 3.1 show that the 
impacts of climate change and the adaptive capacity 
of cities differ between cities as well as regions. 
This enables them to channel their support to urban 
adaptation where it is most needed because of high 
climate impacts or a low capacity for adaptation. 
The tailored support is more effective than a 
one‑size-fit-all-approach. 
Spatial or territorial planning provides an important 
tool for bridging existing governmental levels and 
sectoral agendas and provides a procedure for 
solving multiple problems simultaneously. The 
integration of climate change considerations into 
spatial plans at different levels can increase urban 
resilience in efficient and non-disruptive ways. For 
example, a heightened flood risk and an urban heat 
island effect can both be addressed by increasing 
green and blue (water) spaces in local plans and, 
at the same time, serve recreation and nature. The 
effect will however be more efficient if regional 
planning protects vegetated areas outside the city 
for flood retention and as creators of fresh air. If 
national governments and the European Union 
have identified a particular region as an adaptation 
hotspot and support it, this will accelerate local 
adaptation and contribute to a more resilient Europe 
with a balanced and harmonious development 
(Figure 4.3). 
It seems that stakeholders at different levels broadly 
understand the importance of spatial planning but 
in practice they have yet to develop comprehensive 
and consistent territorial multi-level governance 
for adaptation. A review of European national 
adaptation strategies confirms this observation 
(Mickwitz, 2009). If the territorial approach is not 
incorporated at national and subnational levels, 
friction is likely to emerge between local planning 
and national policymaking. In Finland, for instance, 
this issue has been addressed by establishing so 
called national land use objectives above regional 
and local planning in the planning hierarchy. Among 
European countries, the Netherlands seems to place 
the use of spatial planning as the highest priority in 
its national adaptation strategy (NAS). 
EU Member States have generally rejected overtures 
from the EU on spatial planning in the past. In 
practise however, EU policies and legislation have 
influenced regional and local planning in a broad
Multi-level governance — enabling urban adaptation 
116 Urban adaptation to climate change in Europe 
Figure 4.3 Generic example of a multi-level territorial approach to adapting to flood risks and 
heatwaves in a city 
and diffuse way. EU directives focusing on air 
quality, noise and water have become a point of 
reference for regional actions. European resources, 
in particular available through structural and 
cohesion funds, have shaped territorial policies, 
while their financial requirements and evaluation 
procedures have influenced regional governments 
(Faludi, 2009). EU territorial approaches imply soft 
methods of coordination, including the evaluation of 
policy and feedback from national and sub-national 
levels as tools of coordinating adaptive actions in 
the EU. 
The EU's Territorial Agenda, a process which began 
with the European Spatial Development Perspective 
(ESDP) at the end of the 1990s, marked a turning 
point in the EU's role as regards spatial planning. 
The Territorial Agenda has moved from an implicit 
to explicit stage, even if it still lacks the status 
of official EU policy (Faludi, 2009). Importantly, 
climate change has had a growing, even constitutive, 
role on the Territorial Agenda, building pressure 
within the EU to develop territorially oriented, 
coordinated responses to the multiple and varying 
challenges of climate change. In 2007, under the 
German presidency of the EU, the agenda stipulated 
that joint trans-regional and integrated strategies 
should be further developed in order to face 
natural hazards, reduce and mitigate greenhouse 
gas emissions and adapt to climate change. It also 
established the link between territorial cohesion 
policy and territorially differentiated adaptation 
strategies (German EU presidency, 2007). 
The present EU Territorial Agenda 2020 (Hungarian 
EU presidency, 2011) notes that the impacts of 
climate change vary considerably across Europe 
with varying impacts and different degrees of 
vulnerability. It addresses the geographically diverse 
impacts by referring to regions' varying risk profiles 
and opportunities in relation to both adaptation and 
mitigation challenges. The agenda further notes that 
these challenges draw attention to the territorial 
coordination of policies especially climate, energy, 
water management, agriculture, housing, tourism 
and transport. 
In parallel, EU cohesion policy developed the 
concept of territorial cohesion in addition to social 
and economic cohesion. The concept, introduced 
with the EU Green paper on territorial cohesion 
(EC, 2008), aims to promote a balanced and 
harmonious development in particular by reducing 
social and economic disparities between regions. 
Addressing regional imbalances will be more 
relevant than ever in the future and of particular 
relevance for climate change adaptation. The 
implementation of the post-2013 MFF will show 
Region 
Country 
EU 
City 
Vegetated areas and open 
channels for fresh air for the city 
Identification of 
hotspots and 
specific 
adaptation 
needs 
Tailored 
support 
Communication 
of needs 
Feedback on 
effectiveness 
Id 
h 
Green urban infrastructure 
(parks, trees, roofs) to buffer 
heat and floods 
Protection of vegetated 
areas and wetlands for 
flood retention and 
infiltration
Multi-level governance — enabling urban adaptation 
Urban adaptation to climate change in Europe 117 
how the concept of territorial cohesion including a 
territorial approach to climate change adaptation is 
put in practice. 
Despite the growing acceptance of EU territorial 
governance, the process is still informal and depends 
on political priorities. Multi-level implementation 
is still at an early stage. Only a few Member States 
have adopted the territorial agenda and territorial 
governance approaches in their national level 
practices (Faludi, 2009). Regarding territorial 
cohesion and the consideration of the urban 
dimension as well as climate change adaptation, 
the process of designing the next programming 
period 2014–2020 will show how far the principles 
of territorial governance are accepted and climate 
change is considered as a central thematic area. 
4.3.3 Developing institutional capacities across 
levels 
Climate change is a multi-level challenge which 
cannot be tackled at one administrative level only. 
Besides intergovernmental institutional linkages, 
Box 4.9 Towards a Baltic Sea regional adaptation strategy — an EU territorial approach 
The EU Strategy for the Baltic Sea Region (EUSBSR) 
is a pilot case of new location-based policymaking in 
the European Union and acknowledges that the Baltic 
countries have major environmental problems to address 
together. This transnational regional initiative embodies 
the idea of territorial governance, focusing on the 
horizontal integration of policy goals in a given territorial 
context. 
As part of a common Baltic action plan, the EUSBSR calls 
for the development of a 'regional adaptation strategy at 
the level of the Baltic Sea Region' which would provide 
a useful framework for strengthening co-operation and 
sharing information across the region on this issue. 
The strategy would also ensure complementarities 
with the White paper on adaptation (EC, 2009b) and 
other EU initiatives, focusing on cross-border issues, 
developing more robust evidence on the impacts of 
climate change and raising awareness on the issue in the 
region (EC, 2009c). Building on a longer term process 
of regional research cooperation in the region, the on-going BaltAdapt project seeks to answer the call for the 
macro‑regional adaptation strategy. The project seeks to identify commonalities in the adaptation strategies at 
different levels in the Baltic Sea Region, and to develop a common policy platform for the development of a Baltic 
Sea Region Climate Change Adaptation Strategy. 
The macro-regional strategy attempts to link regional and local activities with European and global measures. The 
strategy has led to concrete action, with a more streamlined use of resources. New working methods and networks 
have been established and a number of initiatives developed. The strategy is a pioneer case also aiming to better 
streamline all funding instruments (EC, 2011f). 
Source: http://www.interact-eu.net/baltic_sea_strategy/eusbsr/284/3949. 
Photo: © Romtomtom-Flickr 
there is a clear need for functioning communication 
channels between government authorities and 
private and public actors which is crucial for 
coordination of climate adaptation. The organisation 
of effective participation and communication is 
therefore an important prerequisite for climate 
adaptation. This communication between 
individuals, public and private actors gives rise 
to 'network power', which emerges as diverse 
participants in a network focus on a common 
task and develop shared meanings and common 
heuristics that guide their action (Booher and Innes, 
2002). 
Comprehensive participation and communication 
can sometimes pose a challenge as it can conflict 
with the existing capacities of governmental 
organisations. Departments with a highly technical 
character, such as water management, can lack 
the capacity to organise dialogue. They may even 
express an aversion ('all talking and no action'). This 
may necessitate awareness raising, training, hiring 
communication specialists and establishing a new 
culture towards a more open attitude.
Multi-level governance — enabling urban adaptation 
118 Urban adaptation to climate change in Europe 
The channels through which local authorities gain 
access to the EU policy process are an important 
aspect of institutional capacity building in Europe. 
So far, local authorities have no direct access, 
but the process of 'Europeanization' implies that 
cities can play a new role in shaping EU policy. 
Access to the European level becomes possible and 
traditional structures of domestic policymaking 
can be partially bypassed. Important initiatives in 
the past included the Sustainable Cities and Towns 
Campaign and the Covenant of Mayors where the 
European Commission interacted directly with 
local authorities. Experience gained there can 
serve to shape the multi-level approach around the 
EU adaptation strategy. 
Networks and associations such as the Council of 
European Municipalities and Regions (CEMR), 
and EUROCITIES make use of the opportunities 
to engage with the European Union. Cities gain 
access to the EU policy cycle through these 
intermediary bodies that have a status as accredited 
participants in the so called 'structured dialogue' 
with the Commission. The declaration 'Governing 
in Partnership' (2011) from the presidents of CEMR, 
AER, CPMR and EUROCITIES aims to prepare a 
code of conduct that the European Commission 
would adopt to ensure the involvement of the 
partners in the preparation, implementation, 
monitoring and evaluation of key policy documents. 
The European Parliament is also an important access 
point. Cities and their representative organisations 
can join political coalitions strengthening the 
Parliament's bargaining power and independence 
towards national actors. Organisations such as 
CEMR and EUROCITIES seek to establish a more 
formal role with the European Parliament and its 
MEPs (Heinelt and Niederhafner, 2008). 
In addition to CEMR and EUROCITIES, many 
environmentally minded municipalities participate 
in transnational municipal environmental 
networks such as ICLEI or the Climate Alliance. 
These non‑governmental networks are efficient in 
building knowledge and capacities in cities through 
peer‑to‑peer networking. These networks are clearly 
networks of pioneering cities, which means they 
can also process unique, innovative knowledge 
capacities as 'forerunners' (Kern and Bulkeley, 2009). 
Furthermore, these networks enable the European 
Commission and national governments to interact 
efficiently with a wide range of local authorities. The 
EU can play a role to foster multi-level governance 
by emphasising the importance of effective 
partnership in regional, national and European 
documents and settings. 
From the Commission perspective, cities are not 
only the places where adaptation takes place. They 
can provide feedback on the effectiveness of the 
Commission's proposals. After all, cities are unique 
observers of how different policies feed in to the 
local level. Cities may adopt a role of monitoring 
and carrying out compliance checks with a view to 
delivering feedback. 
Alongside these positive developments such 
informal ways of governance also bear risks. In the 
absence of formal procedures, participation depends 
on political will, lobbying and the local capacity. 
The ability of cities to benefit from EU structural 
funds depends, for example, on existing national 
procedures in place to develop and implement the 
various operational programmes. Participation 
possibilities for cities differ between countries. 
Developing clearer institutional frameworks 
which describe the specific roles of the different 
stakeholders and the interlinking forms can be 
crucial for successful multi-level approaches. 
Dividing responsibilities between levels of 
government in systematic and explicit ways 
provides benefits for both national and local 
authorities. For instance, the Dutch national 
adaptation strategy in 2007 included an explicit 
statement about the division of responsibilities 
between central government and other levels of 
government (see Box 4.10). Such delineations need 
adjustments over time as climate change adaptation 
is a relatively novel field and part of an on-going 
learning process. 
Cooperating with a diverse range of partners 
and finding joint solutions also has implications 
for senior management structures. Not every 
stakeholder feels confident with this situation 
as personal attitudes and different political 
cultures can create barriers to the policy process. 
Sufficient investment of time and resources with 
strong leadership can lead to these barriers being 
overcome. 
Lack of information is a potential barrier for 
multi‑level approaches to climate change adaptation. 
Multiple studies demonstrate that it is not the 
information as such that makes a difference rather, 
it is the context within which it is placed that can 
make it relevant for specific stakeholders (see more 
in Section 4.3.5).
Multi-level governance — enabling urban adaptation 
Urban adaptation to climate change in Europe 119 
National government Local and regional governments 
Assess the vulnerability of the national spatial development 
plan; 
Assess the impacts of climate change in the context of water; 
Finance knowledge development; 
Develop risk assessment, early warning systems, and methods 
to increase social awareness; 
Actively monitor the adaptation process; 
If needed, adjust policy-instruments (law, regulations) and 
strategic frameworks. 
Integrate climate change in provincial spatial strategies; 
Integrate climate change in new and existing research 
programmes at a provincial level; 
Revise regional adaptation funds to finance adaptation 
measures; 
Conduct small to medium sized case study projects. 
Table 4.7 The distribution of responsibilities between central and decentralised governments 
in the Dutch national adaptation strategy, 2007 
Sources: PBL, 2011; Swart et al., 2009. 
Box 4.10 Distribution of responsibilities between national and local governments in the 
Netherlands 
A PBL study (2011) in the Netherlands shows that for (cost) effective adaptation a division is needed of 
responsibilities between national government and other parties within a comprehensive multi-level approach. 
The national government has the responsibility of providing a legal framework, a customised decision-making 
mechanism as well as financing mechanisms. In addition, the central government has the overall responsibility for 
tasks such as spatial planning, freshwater supplies and flood protection. In decentralising these responsibilities, 
the central government must create preconditions for adaptation to climate change for municipal authorities, water 
boards and city developers. This means that central government must indicate where the limits of its responsibility 
of care lie and what investments it expects. Regional and local authorities must steer adaptation strategies 
through multi-stakeholder alliances. If this multi-level coordination system works, the study expects that urban 
regions can be climate-proof within 60–80 years. In addition, the principle of negotiating responsibilities between 
levels of government has been adopted as part of the Dutch national adaptation strategy. Table 4.7 shows the 
delineations between the governments which need to fit together. 
4.3.4 Securing access to funding for adaptation 
measures 
National and European funding can support 
and accelerate urban adaptation. As with other 
climate proofing efforts, funding options should 
be developed jointly between the local and higher 
levels of governance. Thus, funding climate change 
adaptation can rely on local or regional funds, 
national government and EU funding instruments. 
The multiple facets of budgeting and public 
finance allow for a variety of instruments to be 
used. These may include climate-focused taxes 
and charges, subsidies and budget allocations, 
removal of subsidies or taxes with harmful impacts 
and rules stipulating the ways public funds can 
be used and monitored (Mickwitz, 2009) (see also 
Section 3.3.7). These instruments should be used 
innovatively to promote climate change adaptation 
while securing policy coherence — i.e. funding 
adaptation measures needs to go hand in hand with 
the removal of incentives leading to maladaptation 
(see also the French example in Box 4.3). 
Although there have been regular concerns raised 
related to the level of funding for adaptation 
(e.g. Mechler et al., 2010 on refinancing losses 
from extreme events, and the European Solidarity 
Fund), many types of funding have already been 
available for adaptation. Whether it is urban renewal 
or making infrastructure climate proof by using 
EU structural funds, supporting regional adaptation 
strategies and measures by INTERREG projects, 
or national risk and disaster funds, a broad range 
of funds are available which can also provide 
support for local and regional climate change 
adaptation. The proposed increase towards 20 % of 
the EU budget earmarked for climate change in the 
financial period of 2014–2020 will further improve 
the situation (EC, 2011b).
Multi-level governance — enabling urban adaptation 
120 Urban adaptation to climate change in Europe 
Since funding instruments in the EU do not exclude 
the possibility of using them for funding adaptation 
measures, the accessibility and mobilisation of those 
funds, rather than their actual size, is a crucial factor 
for promoting adaptation. Even if convincingly 
designed, funding for climate change adaptation 
can fail if corresponding implementing structures 
are not in place or the respective political conditions 
and the opportunities presented are not taken 
into account. Indeed, the problem faced by cities 
and regions is that they may never gain access to 
EU funding instruments due to 'bottlenecks' at the 
national level, such as problems with operating 
procedures within the structural funds, information 
gaps and technical competence, lack of guidance 
and good practice examples (Baltzar et al., 2009) 
(Box 4.11). 
Baltzar et al. (2009) point to important gaps in the 
funding chain from EU to local level. Although the 
gaps relate mainly to climate change mitigation 
targets, they can also be highly relevant for 
adaptation goals (Table 4.8). He argues that 
the two principal ways in which operational 
programmes can improve the integration of climate 
change considerations into project development 
and preparation are through project application 
documents and assistance and guidance to project 
applicants (Box 4.11). 
Box 4.11 Access limitations to European funds — a Romanian local authority perspective 
Many Romanian local authorities fail to absorb EU funding because 
they are inappropriately informed, have poorly trained staff, are run 
on small budgets or are unable to partner with other institutions or 
associations. 
The Soros Foundation Romania (SFR) commissioned a study on local 
authorities' access to European funding in 2008. Four of Romania's 
eight development regions were surveyed (north-east, south-east, 
west and south-west) which accounted for 1 579 town halls. This 
was complemented by 16 in-depth case studies. The purpose was to 
reveal the factors which preclude certain towns or areas from tapping 
into development funding (particularly into the EU's post‑accession 
funding). The specific problems that local actors report they face in 
implementing EU‑funded projects were also investigated. 
The conclusions contrast the positive official reporting by the 
authorities currently coordinating the distribution of EU funding. 
According to the study, and for the period between 2005 and 2008, out of the total number of administrative units 
surveyed, one quarter did not submit even one project requesting governmental or European Union financing. 
Meanwhile an additional quarter submitted only one single project. For those who did apply, the average rate was 
2.5 projects per town hall submitted with a 50 % success rate. 
The authorities best equipped were most successful in raising EU project funding potentially leading to widening 
gaps in capacity, skills and well-being. 
Source: Soros Foundation Romania: Local Authorities Access to European Funds. http://www.soros.ro/en/program_articol. 
php?articol=150. 
The 'Financing the Resilient City' report (ICLEI, 
2011) suggests local strategies for capacity building 
to enable the financing and implementation 
of resilient urban development projects. The 
key challenge is to match local demand for 
resilience with the right financial options (see also 
Section 3.3.7). The ICLEI report highlights the 
fact that there are challenges to the supply of 
finance. Such a financial market for resilience 
needs to respond to varying circumstances across 
localities and institutional settings. When financial 
instruments are flexible, funded projects can be 
locally responsive. This is in marked contrast to 
a setting where markets require standardised 
investment propositions along with predictability 
about the preparation and subsequent performance 
of the propositions. 
To foster such innovative financial products enabling 
resilience measures, the ICLEI report proposes that 
international adaptation funds, or similar national 
level funds or programmes, need to focus on three 
areas: 
• funding for local, national, and international 
initiatives to mainstream new resilience 
standards into conventional urban development 
projects;
Multi-level governance — enabling urban adaptation 
Urban adaptation to climate change in Europe 121 
Budget cycle phase Gaps identified Possible responses in a multi-level framework 
Call for proposals 
(announcement) 
Insufficient knowledge among project 
applicants about the opportunities 
offered by projects related to climate 
change. 
Limited experience of the possible 
types of activities and outputs. 
Organising thematic calls for proposals and by providing technical 
assistance to project applicants by EU and national governments. 
Climate related questions in the application documents. 
Improved guidance documents to raise quality and climate 
awareness for the applications. 
Technical assistance (designated personnel) to provide support 
for applicants. 
Consultation with environmental authorities or broader dialogue 
within environmental networks. 
Project appraisal process Climate change related impacts not 
clearly identified. 
Lack of expertise of project evaluators 
in environmental assessments. 
Use of innovative mechanisms such as environmental (EIA) 
panels to bring expertise and knowledge into the assessment. 
Use checklists and guides for the impact assessments. 
Project monitoring and 
evaluation 
Difficulties in monitoring projects and 
programmes, relevant for all Member 
States and the EC. 
Lack of monitoring systems and 
impacts inventories. 
Strengthen evaluation systems in EU funding programmes that 
focus on climate trends, impacts, challenges and opportunities. 
Evaluate prior, during and after EU funded programmes are 
carried out. 
Perform a rigorous evaluation of the 2007–2013 period to 
identify investment needs for mitigation and adaptation from EU 
funds in European regions. 
Use evaluations as a basis for post 2013 programming. 
Table 4.8 General gaps in programming and funding cycles with related responses 
Source: Based on Baltzar et al., 2009. 
• special funding for local projects in highly 
vulnerable urban areas and systems; 
• financial product innovation (e.g. 'value capture 
mechanisms' from development) for the purpose 
of creating private investment flows into the 
upgrading of infrastructure resilience (ICLEI, 
2011). 
In addition, adaptation measures can be led by 
private actors. Funding options need to include 
private investments of various kinds. The role of 
the private insurance industry will continue to 
remain critically focused. Their ability to assess 
and to communicate risk, to spread the economic 
impact through a variety of insurance products, to 
encourage behaviour change through price‑based 
devices and their ability to survive high cost 
years by accessing global financial markets will 
be important support mechanisms for adaptation 
(McEvoy, 2009). However, adaptation-related 
market mechanisms remain clearly underdeveloped 
(Corfee-Morlot et al., 2009). This implies that 
governance arrangements in adaptation cannot 
rely on market actors as heavily as in the field of 
mitigation and, consequently, public actors have a 
decisive role to play in the field. 
The economics of climate change adaptation are 
of key importance for any given case — whether 
operating with public or private funds or a 
top‑down/bottom-up approach. The fact that the 
economy — and especially an economy in crisis — 
and employment nearly always take priority over 
climate change on the political agenda highlights 
the need to focus on the economics of adaptation. 
It also underlines the importance of adaptation 
measures with multiple benefits and potential 
funding sources. Making this case is relevant for all 
levels of governance from the local to the European 
including international climate negotiations. With 
respect to EU cohesion policy funding, there is a 
need to explicitly include climate change measures 
in the national programming documents (the 
NSRFs) and to demonstrate the potential of those 
measures for economic growth and job creation. 
Displaying such synergies helps to integrate 
climate change into cohesion policy (Baltzar et al., 
2009). Similarly, the synergies between climate 
change adaptation and cohesion policy could be 
improved if adaptation were more visibly included 
in the European green economy discourse which 
predominantly emphasises mitigation through 
resource and energy efficiency. Within this context 
it is important to highlight examples such the Dutch 
'delta programme' which aimed to build long-term 
safety against flooding. Nations such as Vietnam 
and Bangladesh have shown an interest in the 
procedure with assistance from Dutch consultancy 
firms (Knowledge for Climate, 2012a).
Multi-level governance — enabling urban adaptation 
122 Urban adaptation to climate change in Europe 
4.3.5 Multi-level knowledge base 
The preceding chapter highlighted the fact that 
knowledge is crucial in developing adaptation 
strategies and measures. This is also applicable 
regarding local climate change impacts, adaptive 
capacities as well as the governance of adaptation at 
and between the different levels and stakeholders. 
Demeritt and Langdon (2004) found in their 
study that over three quarters of responding local 
authority officers in the United Kingdom felt that 
they did not have access to the best information 
about the impacts of climate change on their 
regions. It seems that despite the free availability 
of governmental information sources these were 
not used regularly. Also, during the Resilient Cities 
conference in Bonn in 2011, participants confirmed 
that while knowledge regarding climate change 
and adaptation was available, problems to do with 
access and understanding were prevalent (Georgi 
et al., 2012). 
In essence, locally specific information on climate 
change impacts is acutely needed in many localities, 
but this availability is no guarantee that it will be 
adopted and used in practical adaptation efforts 
(Demeritt and Langdon, 2004). Only an active 
dialogue with authorities at different levels as 
well as scientific institutions can help to overcome 
this barrier. Georgi et al. (2012) suggests various 
proposals. 
• A strong collaboration between key stakeholders 
— policymakers, knowledge providers, business 
owners, citizens and communities. In particular, 
active collaboration between decision‑makers 
and knowledge providers ensures that the 
scientific community can respond to the 
information needs of cities. 
• Developing a shared language on climate change 
adaptation thus overcoming the specialised 
vocabularies and the interpretation of terms 
used by the different stakeholder groups 
through on-going conversations and debates 
with stakeholders from various backgrounds. 
• Continuous social and institutional learning in 
collaborative adaptation processes. Centralised 
information portals can substantially support 
this process of knowledge sharing and learning. 
Through direct contact with scientists, 
municipalities can access climate and adaptation 
science. Stuttgart in Germany is one such example 
where the municipality has established a special 
Section called 'Urban Climatology' within the Office 
for Environmental Protection (Box 3.10). Local 
and regional governments can engage with their 
educational institutes and universities and establish 
regional climate change partnerships (see also 
Box 3.12). 
National and European governments and 
knowledge institutions have an important role 
to play in supporting local knowledge use. 
They can provide funding for basic adaptation 
research, including climate modelling (e.g. NOAA, 
UK Hadley Centre), but also support regionally 
tailored research, such as INTERREG projects. 
The Dutch 'Knowledge for Climate' program 
(Knowledge for Climate, 2012b), for example, 
supports eight regional consortia ('hotspots') to 
develop regional and local adaptation strategies. 
The EU will continue to support climate change 
related research under its framework programmes 
(Box 4.12). 
Chapter 2 demonstrated that there is a strong 
link between climate change vulnerabilities and 
vulnerabilities arising from socio-economic trends. 
There is a clear need for research linking climate 
change with societal and spatial patterns and future 
scenarios, besides the on-going work to reduce 
uncertainties via downscaling climate scenarios. 
There is also a need to understand adaptation as 
well as governance processes themselves, including 
the need to establish procedures for eliciting data on 
adaptive measures in Europe's cities and regions. 
Science and policy interface organisations, 
also called boundary organisations, can make 
information on climate and adaptation available. 
Boundary organisations are institutions that 
specialise in facilitating the transfer of useful 
knowledge between science and policy (Guston 
et al., 2000). Examples are environmental agencies 
and consultancies which translate scientific 
results into policy relevant guidance and which 
communicate policy needs and shape research 
agendas (Box 4.13; see also Box 3.12). 
An important action at EU level is the European 
Climate Adaptation Platform CLIMATE-ADAPT.
Multi-level governance — enabling urban adaptation 
Urban adaptation to climate change in Europe 123 
Box 4.12 Adaptation Strategies for European cities — building local capacities across countries 
The European Commission's Directorate General for Climate Action (DG CLIMA) 
recently launched a project to support the development of urban adaptation 
strategies and to enable cities to actively participate in developing and 
implementing a European adaptation strategy for 2013. A core task of the project 
is to develop capacity for, and with, local authorities. The project shall evaluate 
best practice across Europe, provide guidance and tools for adaptation strategies 
and design and organise training. The latter shall use web based tools, workshops 
and coaching. 
Source: http://eucities-adapt.eu. 
Box 4.13 The UKCIP as key boundary organisation in adaptive governance 
UKCIP operates as a public-private partnership, and mediates between climate scientists, technology experts, 
policymakers and stakeholders. The UKCIP has been operating since 1997 to support decision-makers' 
assessments of their vulnerability to climate change so that they can plan how to adapt. The programme was 
developed incrementally, taking advantage of collaborative funding and facilitating long-standing partnerships. 
Whilst the core framework of scenarios and tools has been developed centrally, most studies have been 
stakeholder-funded and led. Stakeholders usually are positioned in a consultative role in research. In contrast, the 
UKCIP aims to bridge the gap between research and policy in a way that decision-makers can take control. The 
programme's results suggest that if decision-makers are supported, capacity is built for assessments, and research 
outputs are directly applicable to their on-going work and strategic planning. This capacity-building has worked 
across scales and sectors and is an effective route to mainstreaming climate change adaptation. 
The implication, therefore, is that more support should be given by funding agencies to develop institutional 
capacity to support adaptation to climate change in both the private and public sectors (McKenzie Hedger et al., 
2006). Internationally, the UKCIP constituted an important inspiration for other countries (Keskitalo, 2010c) in the 
way it has provided concrete information on scenarios, impacts and risk assessment for both local and regional 
level. 
Source: http://www.ukcip.org.uk. 
Building on various national and sub-national 
initiatives its main functions are: 
• enhancing information structuring and sharing 
and acting as a facilitator for collecting and 
disseminating scientific information, data and 
case studies about climate change impacts and 
vulnerability, to build a consistent and updated 
knowledge base; 
• assisting an effective uptake of this knowledge 
by international, EU, national, regional, 
local or sectoral decision makers, by offering 
guidance, tools, best practices for assessments 
of vulnerability to climate change at different 
geographical levels and of adaptation plans and 
measures; 
• contributing to a greater level of coordination 
among the relevant sectoral policies, and among 
different institutional levels. 
The development of national, regional, local 
adaptation strategies and now finally one focused on 
the EU will demonstrate the usefulness of this tool.
Multi-level governance — enabling urban adaptation 
124 Urban adaptation to climate change in Europe 
CLIMATE-ADAPT and other similar intermediaries 
between knowledge and action are needed since 
science can only play a limited role in social 
learning. Intermediaries, formal networks and other 
'translators' have a crucial role in learning processes 
where not only individuals but the institutional 
system itself must learn to adapt. Learning proceeds 
through expanding 'loops' — from evaluating a 
fixed norm and taking corrective actions (single 
loop) to evaluating and changing the norms (double 
loop) or completely reframing them (triple loop) 
(Georges et al. 1999). It becomes evident that 
multi‑level governance can help in a European effort 
to shift from the all-too-typical norm-following 
corrections (see Pahl-Wostl, 2009) towards higher 
orders of learning and innovative ways of changing 
and re-framing relevant norms. 
Figure 4.5 Homepage of the European 
Climate Adaptation Platform 
CLIMATE‑ADAPT 
Source: http://climate-adapt.eea.europa.eu. 
Further reading 
• Keskitalo, E. C. H., 2010, Developing adaptation policy and practice in Europe: multi-level governance of 
climate change, Springer, Dordrecht; New York. 
• Baltzar, E., Varbova, V. and Zhechkov, R., 2009, Improving the Climate Resilience of Cohesion Policy Funding 
Programmes: An overview of member states' measures and tools for climate proofing Cohesion Policy funds, 
European Network of Enrivonmental Authorities (ENEA)  Regional Environment Centre (REC), Szentendre 
(http://ec.europa.eu/environment/integration/pdf/enea/climate_resiliance_cfr_pr.pdf). 
• CoR, 2011a, Adaptation to Climate Change: Policy instruments for adaptation to climate change in 
big European cities and metropolitan areas, European Union, Committee of the Regions, Brussels 
(http://80.92.67.120/en/documentation/studies/Documents/Adaptation%20to%20Climate%20Change/ 
EN.pdf). 
• Medarova-Bergstrom, K., Volkery, A., Schiellerup, P., Withana, S. and Baldock, D., 2011, Strategies and 
Instruments for Climate Proofing the EU Budget, IEEP, Brussels (http://www.ieep.eu/assets/782/Climate_ 
proofing_EU_budget.pdf). 
• ICLEI, 2011, Financing the Resilient City: A demand driven approach to development, disaster risk reduction 
and climate adaptation — An ICLEI White Paper, ICLEI Global Report, ICLEI, Bonn (http://iclei.org/fileadmin/ 
user_upload/documents/Global/Publications/Report-Financing_Resilient_City-Final.pdf).
125 
Glossary 
Urban adaptation to climate change in Europe 
Glossary 
Adaptation to climate change —Adjustment in 
natural or human systems (e.g. urban areas) in 
response to actual or expected climatic stimuli 
or their effects. It moderates harm or exploits 
beneficial opportunities of climate change. Various 
types of adaptation can be distinguished, including 
anticipatory, autonomous and planned adaptation. 
Adaptive capacity (in relation to climate change 
impacts) — The ability of a system to adjust to 
climate change (including climate variability and 
extremes) to moderate potential damages, to take 
advantage of opportunities, or to cope with the 
consequences. 
Apparent temperature — is a measure of relative 
discomfort due to combined heat and high humidity. 
It is used as an index to describe thermal comfort. 
Climate — Climate in a narrow sense is usually 
defined as the 'average weather', or more rigorously, 
as the statistical description in terms of the mean 
and variability of relevant quantities over a period of 
time ranging from months to thousands or millions 
of years. These quantities are most often surface 
variables such as temperature, precipitation, and 
wind. Climate in a wider sense is the state, including 
a statistical description, of the climate system. The 
classical period of time is 30 years, as defined by the 
World Meteorological Organization (WMO). 
Climate change — Climate change refers to any 
change in climate over time, whether due to natural 
variability or as a result of human activity. This 
usage differs from that in the United Nations 
Framework Convention on Climate Change 
(UNFCCC), which defines climate change as: 
'a change of climate which is attributed directly 
or indirectly to human activity that alters the 
composition of the global atmosphere and which is 
in addition to natural climate variability observed 
over comparable time periods'. 
Climate (change) scenario — A plausible and often 
simplified representation of the future climate, based 
on an internally consistent set of climatological 
relationships and assumptions of radiative forcing, 
typically constructed for explicit use as input to 
climate change impact models. A 'climate change 
scenario' is the difference between a climate scenario 
and the current climate. 
Climate variability — Climate variability refers to 
variations in the mean state and other statistics (such 
as standard deviations, the occurrence of extremes, 
etc.) of the climate on all spatial and temporal scales 
beyond that of individual weather events. Variability 
may be due to natural internal processes within the 
climate system (internal variability), or to variations 
in natural or anthropogenic external forcing 
(external variability). 
Erosion — The process of removal and transport 
of soil and rock by weathering, mass wasting and 
the action of streams, glaciers, waves, winds and 
underground water. 
Extreme weather event — An extreme weather 
event is an event that is rare at a particular place 
and time of year. Definitions of rare vary, but an 
extreme weather event would normally be as rare 
as or rarer than the 10th or 90th percentile of the 
observed probability density function. By definition, 
the characteristics of what is called extreme weather 
may vary from place to place in an absolute sense. 
Single extreme events cannot be simply and directly 
attributed to anthropogenic climate change, as 
there is always a finite chance the event in question 
might have occurred naturally. When a pattern of 
extreme weather persists for some time, such as 
a season, it may be classed as an extreme climate 
event, especially if it yields an average or total that 
is itself extreme (e.g. drought or heavy rainfall over 
a season). 
Forecast — Projected outcome from established 
physical, technological, economic, social, 
behavioural, etc. patterns. 
Global warming — Global warming refers to the 
gradual increase, observed or projected, in global 
surface temperature, as one of the consequences 
of radiative forcing caused by anthropogenic 
emissions.
Glossary 
126 Urban adaptation to climate change in Europe 
Governance — Modern governance is not based on 
centralised 'command and control' but is dispersed 
across multiple centres of authority (Hooghe and 
Marks, 2003). There are many self‑organising, 
inter‑organisational networks which complement 
markets and government hierarchies as governing 
structures for allocating resources and exercising 
control and coordination (Rhodes, 1996). Two 
dimensions of governance exist — vertical 
and horizontal coordination — which work in 
combination. 
Green and blue areas refer in this report to 
the Urban Atlas classes. These are green urban 
areas, sports and leisure facilities, agricultural 
areas, semi‑natural areas and wetlands, forests, 
discontinuous low density urban fabric as a proxy 
for private gardens and water bodies. 
Green infrastructure –is seen in this report as 
an interconnected network of natural and green 
man-made features, such as forests, extensive 
grasslands, wetlands, but in urban areas also 
parks, gardens, cemeteries, trees at streets, green 
walls and roofs. Such green infrastructure enables 
ecosystem services, like flood protection, regulating 
temperature, filtering of air, recreation areas among 
others. 
Grey infrastructure — construction measures such 
as buildings, technical and transport infrastructure, 
dikes and other technical protection constructions 
using engineering services. 
Mal-adaptation is an adaptation action or process 
that actually increases vulnerability to climate. 
Mitigation (climate change) — An anthropogenic 
intervention to reduce the anthropogenic forcing 
of the climate system. It includes strategies to 
reduce greenhouse gas sources and emissions and 
enhancing greenhouse gas sinks. 
Multi-level governance — In this report the 
term is understood as non-hierarchical forms of 
policymaking, involving public authorities as well 
as private actors, who operate at different territorial 
levels, and who acknowledge their interdependence. 
Projection — The potential evolution of a quality 
or set of quantities, often computed with the 
aid of a model. Projections are distinguished 
from predictions in order to emphasise that 
projections involve assumptions, concerning, for 
example, future socio-economic and technological 
developments, that may or may not be realised, and 
are therefore subject to substantial uncertainty. 
Resilience — The ability of a social or ecological 
system to absorb disturbances while retaining the 
same basic structure and ways of functioning, the 
capacity for self-organisation and the capacity to 
adapt to stress and change. 
River discharge — Water flow within a river 
channel, for example expressed in m3/s. 
Run-off — That part of precipitation, snow melt or 
irrigation water that appears in uncontrolled surface 
streams, rivers, drains or sewers. 
Soft measures — non-physical measures such as 
policies, plans, programmes, procedures 
Soil sealing — is the covering of the soil surface 
with materials such as concrete and stone as a 
result of new buildings, roads, parking places but 
also other public and private space. Depending 
on its degree, soil sealing reduces or most likely 
completely prevents natural soil functions and 
ecosystem services within the area concerned. 
SRES scenarios — refers to the scenarios described 
in the IPCC Special Report on Emissions Scenarios 
(2000). The scenarios are grouped into four families 
(A1, A2, B1 and B2) that explore alternative 
development pathways. 
A1: A world of very rapid economic growth, a 
global population that peaks in mid-century and 
rapid introduction of new and more efficient 
technologies. 
A2: A very heterogeneous world with high 
population growth, slow economic development 
and slow technological change. 
B1: A convergent world, with the same global 
population as A1, but with more rapid changes 
in economic structures toward a service and 
information economy. 
B2: A world with intermediate population and 
economic growth, emphasising local solutions 
to economic, social, and environmental 
sustainability. 
Uncertainty — An expression of the degree to 
which a value (e.g. the future state of the climate 
system) is unknown. Uncertainty can result from 
lack of information or from disagreement about 
what is known or even knowable. It may have 
many types of sources, from quantifiable errors 
in the data to ambiguously defined concepts or 
terminology, or uncertain projections of human
Glossary 
Urban adaptation to climate change in Europe 127 
behaviour. Uncertainty can therefore be represented 
by quantitative measures, for example, a range 
of values calculated by various models, or by 
qualitative statements, for example, reflecting the 
judgement of a team of experts. 
Urban — In this report, 'urban' is used as a collective 
term to fit with the different country specific 
definitions of cities and towns. 
Urban Heat Island (UHI) effect — It describes the 
increased temperature of the urban air compared to 
its rural surroundings. The temperature difference 
can be up to 10 °C or more (Oke, 1982). The 
difference is particularly stark at night. 
Urban Morphological Zone (UMZ) — is defined 
as built-up areas lying less than 200 m apart. They 
are primarily made up of four Corine Land Cover 
classes and include continuous urban fabric, 
discontinuous urban fabric, industrial or commercial 
units, green urban areas, port areas, airports and 
sport and leisure facilities. 
Vulnerability — A variety of definitions exist 
according to the specific context. The United Nations 
International Strategy for Disaster Reduction 
(UNISDR, 2009), for example, defines vulnerability 
as the characteristics and circumstances of 
a community, system or asset that make it 
susceptible to the damaging effects of a hazard. The 
Intergovernmental Panel on Climate Change defines 
vulnerability to climate change as the degree to 
which a system is susceptible to, and unable to cope 
with, adverse effects of climate change, including 
climate variability and extremes. Vulnerability is 
a function of the character, magnitude, and rate of 
climate change and variation to which a system is 
exposed, its sensitivity, and its adaptive capacity 
(IPCC, 2007). While being aware of the different 
definitions and concepts of vulnerability, we do not 
use a specific definition or concept stringently in this 
report but rather use the term in a more generic way.
128 
References 
Urban adaptation to climate change in Europe 
References 
Adaptation Sub-Committee, 2011, Analysis of how 
land use planning decisions affect vulnerability to climate 
risks, UK Committee on Climate Change (CCC), 
London. 
Adger, W. N., 2001, Social capital and climate change, 
Tyndall Centre Working Paper No 8, Tyndall 
Centre for Climate Change Research and CSERGE, 
Norwich. 
Adger, W. N., Arnell, N. W. and Tompkins, E. L., 
2005, 'Successful adaptation to climate change across 
scales', Global Environmental Change, 15(2) 77–86. 
Adger, W. N., Dessai, S., Goulden, M., Hulme, M., 
Lorenzoni, I., Nelson, D. R., Naess, L. O., Wolf, J. 
and Wreford, A., 2008, 'Are there social limits to 
adaptation to climate change?', Climatic Change, 
93(3‑4) 335–354. 
Agrawala, S., Matus Kramer, A., Prudent-Richard, 
G. and Sainsbury, M., 2010, Incorporating climate 
change impacts and adaptation in environmental impact 
assessments. Opportunities and challenges OECD 
Environmental Working Paper No 24, OECD 
Publishing, Paris. 
Altvater, S., van de Sandt, K., Marinova, N., de 
Block, D., Klostermann, J., McCallum, S., Dworak, 
T. and Osberghaus, D., 2011, Recommendations on 
priority measures for EU policy mainstreaming on 
adaptation — Task 3 report, Ecologic, Berlin. 
Altvater, S., van de Sandt, K., Marinova, N., de 
Block, D., Klostermann, J., Swart, R., Bouwma, I., 
McCallum, S., Dworak, T. and Osberghaus, D., 
2011a, Assessment of the most significant threats to the 
EU posed by the changing climate in the short, medium 
and long term — Task 1 report, Ecologic, Berlin. 
Altvater, S., van de Sandt, K., Marinova, N., de 
Block, D., Klostermann, J., Swart, R., Bouwma, I., 
McCallum, S., Dworak, T. and Osberghaus, D., 
2011b, Recommendations on priority measures for EU 
policy mainstreaming on adaptation — Task 2 report, 
Ecologic, Berlin. 
AMICA, 2012, Adaptation and mitigation — an 
integrated climate policy approach (http://www.amica-climate. 
net/) accessed 29 March 2012. Arnfield, A. 
J., 2003, 'Two decades of urban climate research: a 
review of turbulence, exchanges of energy and water 
and the urban heat island', International Journal of 
Climatology, (23) 1–26. 
Baccini, M., Biggeri, A., Accetta, G., Kosatsky, Tom, 
Katsouyanni, Klea, Analitis, A., Anderson, H Ross, 
Bisanti, L., D'Ippoliti, D., Danova, J., Forsberg, B., 
Medina, S., Paldy, A., Rabczenko, D., Schindler, C. 
and Michelozzi, P., 2008, 'Heat effects on mortality in 
15 European cities', Epidemiology, (19) 711–719. 
Baltzar, E., Varbova, V. and Zhechkov, R., 2009, 
Improving the climate resilience of cohesion policy 
funding programmes: An overview of member states' 
measures and tools for climate proofing cohesion 
policy funds, European Network of Environmental 
Authorities (ENEA) and Regional Environment 
Centre (REC), Szentendre. 
Barredo, J. I., 2006, 'Major flood disasters in Europe: 
1950–2005', Natural Hazards, 42(1) 125–148. 
Barredo, J. I., 2009, 'Normalised flood losses in 
Europe: 1970–2006', Natural Hazards and Earth System 
Science 2009-02-09, 9(1) 97–104. 
Barriopedro, D., Fischer, E. M., Luterbacher, J., Trigo, 
R. M. and Garcia-Herrera, R., 2011, 'The hot summer 
of 2010: Redrawing the temperature record map of 
Europe', Science, 332(6026) 220–224. 
Baumüller, J. and Verband Region Stuttgart, 
2008, Klimaatlas Region Stuttgart, Verband Region 
Stuttgart, Stuttgart. 
Bell, M. L., Dominici, F. and Samet, J. M., 2005, 
'A meta-analysis of time-series studies of ozone and 
mortality with comparison to the national morbidity, 
mortality, and air pollution study', Epidemiology, (16) 
436–445.
References 
Urban adaptation to climate change in Europe 129 
Berkhout, F., 2005, 'Rationales for adaptation in EU 
climate change policies', Climate Policy, (5) 377–391. 
Birkmann, J. and Fleischhauer, M., 2009, 
'Anpassungsstrategien der Raumentwicklung an 
den Klimawandel: „Climate Proofing' — Konturen 
eines neuen Instruments', Raumforschung and 
Raumordnung, 67(2) 114–127. 
Bolund, P. and Hunhammar, S., 1999, Ecosystem 
services in urban areas, Ecological Economics, 29(2) 
293–301. 
Booher, D. E. and Innes, J. E., 2002, 'Network power 
in collaborative planning', Journal of Planning 
Education and Research, 21(3) 221–236. 
Brücker, G., 2005, 'Vulnerable populations: lessons 
learnt from the summer 2003 heat waves in Europe', 
Euro Surveillance, 10(147). 
Bulkeley, H, Schroeder, H., Janda, K., Zhao, J., 
Armstrong, A., Yi Chu, S. and Ghosh, S., 2009, Cities 
and Climate Change: The role of institutions, governance 
and urban planning. Report prepared for the World 
Bank Urban Symposium on Climate Change, Durham, 
Oxford. 
Caballero, D., 2008,'Wildland-urban interface fire 
risk management: WARM project.', in: Proceedings of 
the second international symposium on fire economics, 
planning, and policy: A global view, General Technical 
Report PSW-GTR-208, U.S. Department of 
Agriculture, Forest Service — Pacific Southwest 
Research Station, Albany. 
CAG, 2009, Adapting to climate change: Local areas' 
action, CAG consultants, London. 
CAP, 2007, Cities preparing for climate change: 
A study of six urban regions: May 2007, The Clean Air 
Partnership, Toronto. 
Casimiro, E., Gomes, A. and Almeida, S., 
2010,'Saúde', in: Santos, F. D. and Cruz, M. D. (eds.) 
Plano estratégico de Cascais face às alterações climáticas, 
Câmara Municipal de Cascais, Portugal. 
CBT, 2009, Factsheet planning for climate change, 
Columbia Basin Trust (http://www.cbt.org/uploads/ 
pdf/FactSheetPlanningforClimateChangeFINALweb. 
pdf) accessed 29 March 2012. 
Ceylan, A., 2009, Drought management plan for 
Ankara, Turkey, WMO's Newsletter: MeteoWorld, 
(June 2009). 
Chouli, E., Aftias, E. and Deutsch, J.-C., 2007, 
'Applying storm water management in Greek cities: 
learning from the European experience', Desalination, 
210(1–3) 61–68. 
Christensen, J.H., Solomon, S., Manning, M. and 
Miller, H. L., 2007, 'Regional Climate Projections', 
in: Climate Change 2007.The physical science basis. 
Contribution of working group I to the fourth assessment 
report of the Intergovernmental Panel on Climate Change, 
Cambridge University Press, Cambridge. 
Christensen, J. Hesselbjerg and Christensen, O. 
B., 2007, 'A summary of the PRUDENCE model 
projections of changes in European climate by the 
end of this century', Climatic Change 2007-3-17, 81(S1) 
7–30. 
Ciscar, J.C., et al., 2009, Climate change impacts in 
Europe. Final report of the PESETA research project, 
JRC/IPTS, Sevilla. 
Ciscar, J. C., Iglesias, A., Feyen, L., Szabo, L., Van 
Regemorter, D., Amelung, B., Nicholls, R., Watkiss, 
P., Christensen, O. B., Dankers, R., Garrote, L., 
Goodess, C. M., Hunt, A., Moreno, A., Richards, 
J. and Soria, A., 2011, 'Physical and economic 
consequences of climate change in Europe', 
Proceedings of the National Academy of Sciences, 108(7) 
2 678–2 683. 
CoR, 2011a, Adaptation to Climate Change: Policy 
instruments for adaptation to climate change in big 
European cities and metropolitan areas, European 
Union. Committee of the Regions, Brussels. 
CoR, 2011b, Second CoR Monitoring Report on Europe 
2020, European Union. Committee of the Regions, 
Brussels. 
Corfee-Morlot, J., Cochran, I., Hallegatte, S. and 
Teasdale, P.-J., 2010, 'Multilevel risk governance 
and urban adaptation policy', Climatic Change, 104 
169–197. 
Corfee-Morlot, J., Kamal-Chaoui, L, Donovan, M., 
Cochran, I, Robert, A. and Teasdale, P. J., 2009, 
Cities, climate change and multilevel governance, OECD 
Environmental Working Papers N° 14, OECD 
Publishing, Paris.
References 
130 Urban adaptation to climate change in Europe 
D'Ippoliti, D., Michelozzi, P., Marino, C., de' Donato, 
F., Menne, B., Katsouyanni, Klea, Kirchmayer, U., 
Analitis, A., Medina-Ramón, M., Paldy, A., Atkinson, 
R., Kovats, S., Bisanti, L., Schneider, A., Lefranc, 
Agnès, Iñiguez, C. and Perucci, C. A., 2010, The 
impact of heat waves on mortality in 9 European 
cities: results from the EuroHEAT project, 
Environmental Health: A Global Access Science Source, 
(9) 37. 
Dalman, E., Western Harbour — sustainable urban 
development in Malmö, (www.udss.org.uk/editpics/ 
File/Malmo-Eva_Dalman_comprssed.ppt) accessed 
29 March 2012. 
Dankers, R. and Feyen, L., 2008, 'Climate change 
impact on flood hazard in Europe: An assessment 
based on high-resolution climate simulations', 
Journal of Geophysical Research, 113(D19), D19105. 
Demeritt, D. and Langdon, D., 2004, 'The UK 
Climate Change Programme and communication 
with local authorities', Global Environmental Change, 
(14) 325–336. 
Dessai, S., 2003, Heat stress and mortality in 
Lisbon Part II. 'An assessment of the potential 
impacts of climate change, International Journal of 
Biometeorology', 48(1) 37–44. 
Dessai, S., Hulme, M., Lempert, R. and Pielke, R., 
2009,'Climate prediction: a limit to adaptation?', 
in: Adger, W. N. Lorenzoni, I. and O'Brien, K. 
L. (eds.) Adapting to Climate Change: Thresholds, 
Values, Governance, Cambridge University Press, 
Cambridge. 
Donat, M. G., Leckebusch, G. C., Wild, S. and 
Ulbrich, U., 2011, 'Future changes in European 
winter storm losses and extreme wind speeds 
inferred from GCM and RCM multi-model 
simulations', Nat. Hazards Earth Syst. Sci., 11(5) 
1 351–1 370. 
Dousset, B., Gourmelon, F., Laaidi, K., Zeghnoun, A., 
Giraudet, E., Bretin, P., Mauri, E. and Vandentorren, 
S., 2011, 'Satellite monitoring of summer heat waves 
in the Paris metropolitan area', International Journal of 
Climatology, 31(2) 313–323. 
Ebi, K., Teisberg, T. J., Kalkstein, L. S., Robinson, 
L. and Weiher, R. F., 2004, 'Heat watch/warning 
systems save lives', Bulletin American Meteorological 
Society, 2004 (85) 1 067–1 073. 
EC, 1992, Council Directive 92/43/EEC of 21 May 
1992 on the conservation of natural habitats and of 
wild fauna and flora. 
EC, 2000a, Regulation (EC) No 1980/2000 of the 
European Parliament and of the Council of 17 July 
2000 on a revised Community eco-label award 
scheme. 
EC, 2000b, Directive 2000/60/EC of the European 
Parliament and of the Council of 23 October 2000 
establishing a framework for Community action in 
the field of water policy. 
EC, 2001, Directive 2001/42/EC of the European 
Parliament and of the Council of 27 June 2001 on 
the assessment of the effects of certain plans and 
programmes on the environment. 
EC, 2004, Communication from the Commission to 
the European Parliament, the Council, the European 
Economic and Social Committee and the Committee 
of the Regions on flood risk management — flood 
prevention, protection and mitigation (COM(2004) 
472 final of 12 July 2004). 
EC, 2007a, Directive 2007/60/EC of the European 
Parliament and of the Council of 23 October 2007 on 
the assessment and management of flood risks. 
EC, 2007b, Water scarcity and droughts — In-depth 
assessment — Second interim report. 
EC, 2007c, Communication from the Commission 
to the European Parliament and the Council 
'Addressing the challenge of water scarcity and 
droughts in the European Union' COM(2007) 414 
final, 18 July 2007. 
EC, 2008, Green Paper on Territorial Cohesion 
— Turning territorial diversity into strength 
COM(2008) 616 final, 6 October 2008. 
EC, 2009a, Promoting sustainable urban development 
in Europe: achievements and opportunities, European 
Commission, Brussels. 
EC, 2009b, White Paper — Adapting to climate 
change: Towards a European framework for action 
COM(2009) 147/4, 1 April 2009.
References 
Urban adaptation to climate change in Europe 131 
EC, 2009c, Communication from the Commission to 
the European Parliament, the Council, the European 
Economic and Social Committee and the Committee 
of the Regions concerning the European Union 
Strategy for the Baltic Sea Region COM(2009) 248 
final, 10 June 2009. 
EC, 2009d, Common implementation strategy for the 
Water Framework Directive (2000/60/EC) — River 
basin management in a changing climate. Guidance 
document No. 24, Technical Report No 2009-040, 
European Commission. 
EC, 2010a, Communication from the Commission to 
the European Parliament, the Council, the European 
Economic and Social Committee and the Committee 
of the Regions — European Union Strategy for 
Danube Region COM(2010) 715 final, 8 December 
2010. 
EC, 2010b, Directive 2010/31/EU of the European 
Parliament and of the Council of 19 May 2010 on the 
energy performance of buildings. 
EC, 2010c, The European Union strategy for the Baltic 
Sea Region: background and analysis (http://ec.europa. 
eu/regional_policy/cooperate/baltic/pdf/2010_baltic. 
pdf) accessed 29 March 2012. 
EC, 2011a, Directive 2011/92/EU of the European 
Parliament and of the Council of 13 December 2011 
on the assessment of the effects of certain public and 
private projects on the environment (codification). 
EC, 2011b, A budget for Europe 2020. Part I and 
II. Communication from the Commission to the 
European Parliament, the Council, the European 
Economic and Social Committee of the Regions 
COM(2011) 500 final, 29 June 2011. 
EC, 2011c, EUROPA — Press Releases — Multiannual 
Financial Framework (MFF): Questions and answers 
(http://europa.eu/rapid/pressReleasesAction.do?re 
ference=MEMO/11/468format=HTMLaged=1l 
anguage=ENguiLanguage=en) accessed 29 March 
2012. 
EC, 2011d, Proposal for a regulation of the European 
Parliament and of the Council on specific provision 
concerning the European Regional Development 
Fund and the investment for growth and jobs goal 
and repealing regulation (EC) No 1080/2006. 
EC, 2011e, Proposal for a regulation of the European 
parliament and of the Council of 6 October 2011 
laying down common provisions on the European 
Regional Development Fund, the European 
Social Fund, the Cohesion Fund, the European 
Agricultural Fund for Rural Development and the 
European Maritime and Fisheries Fund covered 
by the Common Strategic Framework and laying 
down general provisions on the European Regional 
Development Fund, the European Social Fund and 
the Cohesion Fund and repealing Regulation (EC) 
No 1 083/2006. 
EC, 2011f, Report from the Commission to the 
European parliament, the Council, the European 
Economic and Social Committee and the Committee 
of the Regions on the implementation of the EU 
Strategy for the Baltic Sea Region (EUSBSR). 
EC, 2012a, Green infrastructure (http://ec.europa. 
eu/environment/nature/ecosystems/index_en.htm) 
accessed 29 March 2012. 
EC, 2012b, Water Scarcity  Droughts in the European 
Union (http://ec.europa.eu/environment/water/ 
quantity/water_efficiency.htm) accessed 29 March 
2012. 
ECOTEC, 2008, The economic benefits of Green 
Infrastructure: Developing key tests for evaluating the 
benefits of green infrastructure, Natural Economy 
Northwest (http://www.naturaleconomynorthwest. 
co.uk/download.php?The %20Economic %20 
Value %20of %20Green %20Infrastructure.pdf) 
accessed 29 March 2012. 
EEA, 2006, Urban sprawl in Europe: the ignored 
challenge, EEA Report No 10/2006, European 
Environment Agency. 
EEA, 2007, Climate change: the cost of inaction and the 
cost of adaptation, EEA Technical report No 13/2007, 
European Environment Agency. 
EEA, 2009, Water resources across Europe: confronting 
water scarcity and drought, EEA Report No 2/2009, 
European Environment Agency. 
EEA, 2010a, The European environment — state and 
outlook 2010: Thematic assessment — Adapting to 
climate change, European Environment Agency. 
EEA, 2010b, The European environment — state 
and outlook 2010: Thematic assessment — Urban 
Environment, European Environment Agency.
References 
132 Urban adaptation to climate change in Europe 
EEA, 2010c, Mapping the impacts of natural hazards 
and technological accidents in Europe — An overview 
of the last decade, EEA Technical report No 13/2010, 
European Environment Agency. 
EEA, 2010d, The European environment — state and 
outlook 2010: Thematic assessment — Air pollution, 
European Environment Agency. 
EEA, 2010e, The European environment — state and 
outlook 2010: Thematic assessment — Water scarcity 
and droughts, floods and hydromorphology, European 
Environment Agency. 
EEA, 2011a, Air pollution by ozone across Europe 
during summer 2010, EEA Technical report No 6/2011, 
European Environment Agency. 
EEA, 2011b, Air quality in Europe — 2011 report, 
EEA Technical report No 12/2011, European 
Environment Agency. 
EEA and EC, 2012, Climate-adapt (http://climate-adapt. 
eea.europa.eu/) accessed 29 March 2012. 
EEA, JRC and WHO, 2008, Impacts of Europe's 
changing climate: 2008 indicator-based assessment, EEA 
Report No 4/2008, European Environment Agency. 
Ellison, D., 2010,'Addressing adaptation in the 
EU policy Framework', in: Developing adaptation 
policy and practice in Europe: Multi-Level governance of 
climate change, Springer, Dordrecht. 
Van Engelen, A., Klein Tank, A., Van Der Schrier, G. 
and Klok, L., 2008, European Climate Assessment  
Dataset (ECAD), Report 2008 'Towards an operational 
system for assessing observed changes in climate 
extremes', KNMI, De Bilt, Netherlands. 
Engle, N. L. and Lemos, M. C., 2010, 'Unpacking 
governance: Building adaptive capacity to climate 
change of river basins in Brazil', Global Environmental 
Change, 20(1) 4–13. 
Ennos, R., 2011, Quantifying the cooling and anti-flooding 
benefits of green infrastructure, presentation at 
Green infrastructure workshop, 1 November 2011 at 
the University of Manchester, United Kingdom. 
Eurostat, 2008, 'Population projections 2008–2060 — 
from 2015, deaths projected to outnumber births in 
the EU-27', Eurostat, Luxembourg. 
Eurostat, 2012, Urban Audit (http://epp.eurostat. 
ec.europa.eu/portal/page/portal/region_cities/city_ 
urban) accessed 29 March 2012. 
Faludi, A., 2009, 'A turning point in the development 
of European spatial planning? The Territorial 
Agenda of the European Union and the First Action 
Programme', Progress in Planning (71) 1–42. 
Filleul, L., Cassadou, S., Médina, S., Fabres, P., 
Lefranc, Agnés, Eilstein, D., Le Tertre, A., Pascal, 
L., Chardon, B., Blanchard, M., Declercq, C., Jusot, 
J.-F., Prouvost, H. and Ledrans, M., 2006, 'The 
relation between temperature, ozone, and mortality 
in nine French cities during the heat wave of 2003', 
Environmental Health Perspectives, 114(9) 1 344–1 347. 
Fischer, E. M. and Schär, C., 2010, 'Consistent 
geographical patterns of changes in high-impact 
European heatwaves', Nature Geoscience, 3(6) 
398–403. 
Flörke, M., Wimmer, F., Dworak, Th., Laaser, C., 
Vidaurre, R., Tröltzsch, J., Marinova, N., Jaspers, F., 
Ludwig, F., Giupponi, C., Bosello, F. and Mysiak, 
J., 2011, 'Draft final report for the project Climate 
adaptation — modelling water scenarios and 
sectoral impacts', CESR, Centre for Environmental 
Systems Research, Kassel, Germany. 
Ford, J. D., Berrang-Ford, L. and Paterson, J., 2011, 
'A systematic review of observed climate change 
adaptation in developed nations', Climatic Change, 
106(2) 327–336. 
Forsberg, B., Orru, H., Åström, C., Andersson, 
C., Ebi, K. and Langner, J., 2011, Impact of climate 
change on ozone induced mortality in Europe, European 
Respiratory Society. Annual Congress 2011, 
Amsterdam. 
FRC, 2012, FloodResilienCity (http://www. 
floodresiliencity.eu/en/home/index. 
php?mod=loginsel=setcookie) accessed 29 March 
2012. 
Füssel, H.-M., 2007, 'Adaptation planning for climate 
change: concepts, assessment approaches and key 
lessons', Sustainability Science, (2) 265–275. 
Füssel, H.-M., Klein, R. J. T. and Ebi, K. L., 2006, 
'Adaptation assessment for public health', in: Menne 
B. and Ebi, K. L. (eds.) Climate Change and Adaptation 
Strategies for Human Health, Steinkopf Verlag, 
Darmstadt, Germany. 
Gábor, P., Jombach, S. and Ongjerth, R., 2008,'The 
relation between the biological activity and the land 
surface temperature in Budapest', in: URBIO 2008 
proceedings, 21–24 May 2008, Erfurt.
References 
Urban adaptation to climate change in Europe 133 
Genovese, E., 2006, A methodological approach to 
land use-based flood damage assessment in urban areas: 
Prague case study, European Commission, Joint 
Research Centre, Ispra. 
Georgi, B., Kazmierczak, A. and Fünfgeld, H., 2012, 
'Knowledge and information for resilient cities', in: 
Otto‑Zimmermann, K. (ed.), Resilient cities 2: Cities 
and adaptation to climate change proceedings of the 
global forum 2011, Local Sustainability 2, Springer 
Science+Business Media B.V. 2012 forthcoming. 
German Presidency of the Council of the European 
Union, 2007, Territorial Agenda of the European Union. 
Towards a more competitive and sustainable Europe of 
diverse regions, Leipzig. 
Gill, S. E., Handley, J. F., Ennos, A. R. and Pauleit, S., 
2007, 'Adapting Cities for Climate Change: The Role 
of the Green Infrastructure', Built Environment, (33) 
115–133. 
Giorgi, F., Im, E.-S., Coppola, E., Diffenbaugh, N. 
S., Gao, X. J., Mariotti, L. and Shi, Y., 2011, 'Higher 
hydroclimatic intensity with global warming', 
Journal of Climate, 24(20) 5 309–5 324. 
Goldberg, V., Eichelmann, V., Prasse, H. and 
Bernhofer, C., 2003, The flash flood event in the 
catchment of the river Weißeritz (eastern Erzgebirge, 
Saxony) from 12–14 August 2002: Meteorological and 
hydrological reasons, damage assessment and disaster 
management. Technical University Dresden, Institute 
for Hydrology and Meteorology, Department of 
Meteorology, in: EGS-AGU-EUG-Joint Assembly 
6–11 April 2003, Nice, France. 
Greater London Authority, 2010, The draft climate 
change adaptation strategy for London: Public 
Consultation Draft, Mayor of London, Greater 
London Authority, London. 
Greiving, S. et al., 2011, ESPON Climate. Climate 
change and territorial effects on regions and local 
economies, Dortmund. 
Grislain-Letremy, C. and Peinturier, E., 2010, Le 
régime d'assurance des catastrophes naturelles en 
France métropolitaine entre 1995 et 2006, Études  
documents, MEEDAT / Commissariat Général au 
Développement Durable, Paris. 
Grize, L., Huss, A., Thommen, O., Schindler, C. 
and Braun-Fahrländer, C., 2005, 'Heat wave 2003 
and mortality in Switzerland', Swiss Medical Weekly, 
135(13–14) 200–205. 
Gupta, J., Termeer, C. J., Klostermann, J. E., 
Meijerink, S., Brink van den, M. A. and Jong, P., 2010, 
'The adaptive capacity wheel: a method to assess the 
inherent characteristics of institutions to enable the 
adaptive capacity of society', Environmental Science  
Policy, 13(6) 459–471. 
Guston, D. H., Clark, W., Keating, T., Cash, 
D., Moser, S., Miller, C. and Powers, C., 
2000, Report of the workshop on boundary 
organizations in environmental policy and 
science, 9–10 December 1999, Belfer Center for 
Science and International Affairs, Harvard 
University, Cambridge, MA (http://www.hks. 
harvard.edu/gea/pubs/huru1.pdf) accessed 10 April 
2012. 
GWI, 2007, Between a rock and a hard place 
— Ankara's water future in crisis, Global Water 
Intelligence, 8(8). 
Haddad, B. M., 2005, 'Ranking the adaptive capacity 
of nations to climate change when socio-political 
goals are explicit', Global Environmental Change 
Part A, 15(2) 165–176. 
Haines, A., Kovats, R., Campbell-Lendrum, D. and 
Corvalan, C., 2006, 'Climate change and human 
health: impacts, vulnerability, and mitigation', The 
Lancet, 367(9 528) 2 101–2 109. 
Hajat, S. and Kosatky, T., 2009, 'Heat-related 
mortality: a review and exploration of 
heterogeneity', Journal of Epidemiology  Community 
Health, 64(9) 753–760. 
Hajat, S., O'Connor, M. and Kosatsky, T., 2010, 
'Health effects of hot weather: from awareness of 
risk factors to effective health protection', Lancet, 
375(9717) 856–863. 
Hallegatte, Stéphane, 2009, 'Strategies to adapt to 
an uncertain climate change', Global Environmental 
Change, 19(2) 240–247. 
Harlan, S. L., Brazel, A. J., Prashad, L., Stefanov, 
W. L. and Larsen, L., 2006, 'Neighborhood 
microclimates and vulnerability to heat stress', Social 
Science  Medicine, 63(11) 2 847–2 863. 
Harris, G. R., Collins, M., Sexton, D. M. H., Murphy, 
J. M. and Booth, B. B. B., 2010, 'Probabilistic 
projections for 21st century European climate', 
Natural Hazards and Earth System Science, 10(9) 
2 009–2 020.
References 
134 Urban adaptation to climate change in Europe 
Haug, C., Rayner, T., Jordan, A., Hildingsson, R., 
Stripple, J., Monni, S., Huitema, D., Massey, Eric, 
Asselt, H. and Berkhout, F., 2009, 'Navigating the 
dilemmas of climate policy in Europe: evidence from 
policy evaluation studies', Climatic Change, 
(101)427–445. 
Heinelt, H. and Niederhafner, S., 2008, 'Cities and 
organized interest intermediation in the EU multi-level 
system', European Urban and Regional Studies, (8) 
173–187. 
Hémon, D. and Jougla, E., 2004, Surmortalité liée à la 
canicule d'août 2003: suivi de la mortalité post-canicule, 
causes médicales de décès observées au cours de la vague 
de chaleur, INSERM, Paris. 
Heusinkveld, B. G., van Hove, L. W. A., Jacobs, C. 
M. J., Steeneveld, G. J., Elbers, J. A., Moors, E. J. and 
Holtslag, A. A. M., 2010,'Use of a mobile platform 
for assessing urban heat stress in Rotterdam', in: 
Proceedings of the 7th Conference on Biometeorology. 
— Berichte des Meteorologischen Instituts der Albert- 
Ludwigs-Universität 12-14 April 2010, Freiburg, 
Germany (http://library.wur.nl/WebQuery/ 
wurpubs/391825) accessed 29 March 2012. 
Hilpert, K., Mannke, F. and Schmidt-Thomé, P., 
2007, Towards Climate Change Adaptation Strategies in 
the Baltic Sea Region., Geological Survey of Finland, 
Espoo. 
Hirabayashi, Y., Kanae, S., Emori, S., Oki, T. and 
Kimoto, M., 2008, 'Global projections of changing 
risks of floods and droughts in a changing climate', 
Hydrological Sciences Journal, 53(4) 754–772. 
Hoerling, M., Eischeid, J., Perlwitz, J., Quan, X., 
Zhang, T. and Pegion, P., 2012, On the increased 
frequency of Mediterranean drought, Journal of 
Climate, 25(6) 2 146–2 161. 
Hooghe, L. and Marks, G., 2003, Unraveling 
the central state, but how? Types of multi-level 
governance, American Political Science Review, 97(02) 
233–243. 
Hudeková, Z. and Tvrdoň, M., 2011, Adaptation 
action plan Bratislava — Executive summary, GraBS 
project (http://www.grabs-eu.org/downloads/AAP_ 
Executive_summary_Bratislava.pdf). 
Hungarian Presidency of the Council of the 
European Union, 2011, Territorial Agenda of the 
European Union 2020: Towards an inclusive, smart and 
sustainable Europe of diverse regions, Gödöllő. 
Hunt, Alistair and Watkiss, Paul, 2010, 'Climate 
change impacts and adaptation in cities: a review of 
the literature', Climatic Change, (104) 13–49. 
Hutter, G., McFadden, L., Penning-Rowsell, E., 
Tapsell, S. and Borga, M., 2007, Strategies for pre-flood 
risk management: case studies and recommendations: 
Integrated flood risk analysis (http://www.floodsite. 
net/html/partner_area/project_docs/T13_07_04_pre_ 
flood_RM_strategies_D13_1_v1_0_p04.pdf) accessed 
29 March 2012. 
ICLEI, 2011, Financing the resilient city: A demand 
driven approach to development, disaster risk reduction 
and climate adaptation, ICLEI Global Report, ICLEI, 
Bonn. 
IPCC, 2001, Climate change 2001: Impacts, adaptation, 
and vulnerability — Contribution of Working Group II 
to the third assessment report of the Intergovernmental 
Panel on Climate Change, Cambridge University 
Press, Cambridge. 
IPCC, 2007, Climate change 2007: Synthesis report. 
Contribution of Working Groups I, II and III to the 
fourth assessment report of the Intergovernmental Panel 
on Climate Change, Cambridge University Press, 
Cambridge, United Kingdom. 
IPCC, 2000, IPCC Special report on emissions Scenarios, 
Intergovernmental Panel Climate Change. 
IPCC, 2012,'Summary for Policymakers.Managing 
the Risks of Extreme Events and Disasters to 
Advance Climate Change Adaptation', in: Field, 
C.B., Barros, V., Stocker, T.F., Qin, D., Dokken, D.J., 
Ebi, K.L., Mastrandrea, M.D., Mach, K.J., Plattner, 
G.-K., Allen, S.K., Tignor, M., and Midgley, P.M. 
(eds), A Special Report of Working Groups I and II 
of the Intergovernmental Panel on Climate Change, 
Cambridge University Press, Cambridge, United 
Kingdom and New York, NY, USA. 
Johansson, M., Kahma, K., Boman, H. and 
Launiainen, J., 2004, 'Scenarios for the sea level on 
the Finnish coast', Boreal Environ Research, (9) 
153–166. 
Juhola, S., 2010,'Mainstreaming Climate Change 
Adaptation: The Case of Multi-level Governance 
in Finland', in: Keskitalo, E. C. H. (ed.) Developing 
adaptation policy and practice in Europe: Multi-level 
governance of climate change, Springer, Dordrecht.
References 
Urban adaptation to climate change in Europe 135 
Kamal-Chaoui, L. and Robert, A. (eds), 2009, 
Competitive cities and climate change, OECD Regional 
Development Working Papers No 2/2009, OECD 
publishing, Paris. 
Katsouyanni, K., 1995, 'Health-effects of air pollution 
in Southern Europe — Are there interacting factors?', 
Environmental health perspectives, (103, supplement 2) 
23–27. 
Kazmierczak, A. and Carter, J., 2010, Adaptation 
to climate change using green and blue infrastructure. 
A database of case studies. GraBS project, University of 
Manchester, United Kingdom (http://www.grabs-eu. 
org/membersArea/files/Database_Final_no_ 
hyperlinks.pdf) accessed 29 March 2012. 
Keatinge, W. R., Donaldson, G. C., Cordioli, E., 
Martinelli, M., Kunst, A. E., Mackenbach, J. P., 
Nayha, S. and Vuori, I., 2000, 'Heat related mortality 
in warm and cold regions of Europe: observational 
study', BMJ (Clinical Research Ed.), 321(7262) 670–673. 
Kern, K. and Alber, G., 2008, 'Governing climate 
change in cities: Modes of urban climate governance 
in multi-level systems', in: Multi-level Systems. OECD 
International Conference: Competitive Cities and Climate 
Change 9-10 October 2008, Milan, Italy (http://www. 
oecd.org/dataoecd/12/38/42554913.pdf) accessed 
29 March 2012. 
Kern, K. and Bulkeley, H., 2009, 'Cities, 
Europeanization and multi-level governance: 
Governing climate change through transnational 
municipal networks', JCMS: Journal of Common 
Market Studies, 47 309–332. 
Keskitalo, E. C. H., 2010a, 'Introduction: Adaptation 
to climate change in Europe — Theoretical 
ramework and study design', in: Developing of 
adaptation policy and practice in Europe: Multi-level 
governance of climate change, Springer, Dordrecht. 
Keskitalo, E. C. H., 2010b, 'Climate change 
adaptation in the United Kingdom: England and 
South-East England', in: Developing of adaptation 
policy and practice in Europe: Multi-level governance of 
climate change, Springer, Dordrecht. 
Keskitalo, E. C. H., 2010c, 'Conclusion: The 
Development of Adaptive Capacity and Adaptation 
Measures in European Countries', in: Developing of 
adaptation policy and practice in Europe: Multi-level 
governance of climate change, Springer Netherlands, 
Dordrecht. 
Keskitalo, E. C. H., 2010d, 'Adapting to climate 
change in Sweden: National policy development 
and adaptation measures in Västra Götaland', in: 
Developing of adaptation policy and practice in Europe: 
Multi-level governance of climate change, Springer, 
Dordrecht. 
Keskitalo, E. C. H. (ed.), 2010e, Developing adaptation 
policy and practice in Europe: multi-level governance of 
climate change, Springer, Dordrecht, New York. 
Kirshen, P., Ruth, M. and Anderson, W., 2007, 
'Interdependencies of urban climate change 
impacts and adaptation strategies: a case study of 
Metropolitan Boston USA', Climatic Change, (86) 
105–122. 
Klein Tank, A. M. G. and Können, G. P., 2003, 'Trends 
in indices of daily temperature and precipitation 
extremes in Europe, 1946–99', Journal of Climate, 
16(22) 3 665–3 680. 
Knight, S., Smith, C. and Roberts, M., 2010, 
'Mapping Manchester's urban heat island', Weather, 
65(7) 188–193. 
Knowledge for Climate, 2012a, Netherlands National 
Climate Change Research Programme — Home (http:// 
www.climateresearchnetherlands.nl/) accessed 
29 March 2012. 
Knowledge for Climate, 2012b, Rotterdam 
region (http://knowledgeforclimate. 
climateresearchnetherlands.nl/hotspots/rotterdam-region) 
accessed 29 March 2012. 
Kohler-Koch, B. and Rittberger, B., 2006, Review 
Article: 'The 'Governance Turn' in EU Studies', 
JCMS: Journal of Common Market Studies, 44(s1) 27–49. 
Kooiman, J., 1993,'Governance and governability: 
Using complexity, dynamics and diversity', in: 
Modern Governance, Sage, London. 
Koppe, C., Kovats, S., Jendritzky, G., Menne, 
B. and Breuer, D. J., 2004, Heat waves: risks and 
responses, Regional Office for Europe, World Health 
Organization, Copenhagen. 
Kovats, R. S. and Hajat, Shakoor, 2008, 'Heat stress 
and public health: A critical review', Annual Review 
of Public Health, 29(1) 41–55. 
Kruuse, A., 2010, The green space factor and green 
points system, Expert Paper No 6, GraBS project 
(http://www.grabs-eu.org/downloads/EP6 %20 
FINAL.pdf) accessed 29 March 2012.
References 
136 Urban adaptation to climate change in Europe 
Kuttler, W., 2008, 'The Urban Climate — Basic and 
Applied Aspects', in: Marzluff, J. M. Shulenberger, 
E. Endlicher, W. Alberti, M. Bradley, G. Ryan, C. 
Simon, U. and ZumBrunnen, C. (eds.) Urban Ecology, 
Springer US, Boston. 
Landeshauptstadt Dresden, 2011, Stadtentwicklung 
and Umwelt: Hochwasser. (http://www.dresden.de/ 
de/08/03/c_054.php) accessed 29 March 2012. 
Lautenschlager, M., Keuler, K., Wunram, C., 
Keup‑Thiel, E., Schubert, M., Will, A., Rockel, B. 
and Boehm, U., 2009, Climate Simulation with CLM, 
Climate of the 20th Century (run no.1, 2 and 3) and 
Scenarios A1B and B1 (run no.1 and 2), Data Stream 3: 
European region MPI-M/MaD. World Data Center for 
Climate. 
Lehner, B., Döll, P., Alcamo, J., Henrichs, T. and 
Kaspar, F., 2006, 'Estimating the impact of global 
change on flood and drought risks in Europe: A 
continental, integrated analysis', Climatic Change, 
75(3) 273–299. 
Letremy, C. and Grislain, N., 2009, Assurance des 
risques naturels en France: sous quelles conditions 
les assureurs peuvent-ils inciter à la prévention des 
catastrophes naturelles?, Études  documents, 
MEEDDAT / Commissariat Général au 
Développement Durable, Paris. 
Van der Linden, P. and Mitchell, J. F. B., 2009, Climate 
change and its impacts: Summary of research and results 
from the ENSEMBLES project, Met Office Hadley 
Centre, Exeter. 
Loftus, A.-C., 2011, Łódź, Poland — River restoration as 
a catalyst for sustainable urban development. case study 
of the SWITCH project, ICLEI European Secretariat, 
Freiburg. 
London Climate Change Partnership, 2002, 
London's warming: The impact of climate change on 
London: Summary report, London Climate Change 
Partnership, London. 
Luber, G. and McGeehin, M., 2008, 'Climate change 
and extreme heat events', American Journal of 
Preventive Medicine, 35(5) 429–435. 
Lugeri, N., Kundzewicz, Z. W., Genovese, E., 
Hochrainer, S. and Radziejewski, M., 2010, 'River 
flood risk and adaptation in Europe—assessment of 
the present status', Mitigation and adaptation strategies 
for global change, 15(7) 621–639. 
MailOnline, 2009, 'Imbeciles': Hundreds evacuated 
from their homes as bushfire caused by French military 
threatens Marseille (http://www.dailymail.co.uk/ 
news/article-1201562/Imbeciles-Hundreds-evacuated- 
homes-bushfire-caused-French-military-threatens- 
Marseille.html) accessed 23 April 2012. 
Mairie de Paris, 2011, Prévenir les effets d'une canicule 
(http://www.paris.fr/pratique/Portal.lut?page_ 
id=6687document_type_id=4document_ 
id=54173portlet_id=15402multileveldocument_ 
sheet_id=10003) accessed 29 March 2012. 
Marchi, L., Borga, M., Preciso, E. and Gaume, E., 
2010, 'Characterisation of selected extreme flash 
floods in Europe and implications for flood risk 
management', Journal of Hydrology, 394(1–2), 
118–133. 
Martens, W. J. M., 1998, 'Climate change, thermal 
stress and mortality changes', Social Science  
Medicine, 46(3) 331–344. 
Martiello, M. A. and Giacchi, M. V., 2010, 'Review 
Article: High temperatures and health outcomes: 
A review of the literature', Scandinavian Journal of 
Public Health, 38(8) 826–837. 
Martins, R. D. and Ferreira, L. D. C., 2011, 
'Opportunities and constraints for local and 
subnational climate change policy in urban areas: 
insights from diverse contexts', International Journal 
of Global Environmental Issues, 11(1) 37–53. 
Matthies, F., Bickler, G., Cardenosa Marin, N. and 
Hales, S., 2008, Heat-health action plans — Guidance, 
WHO Regional Office for Europe, Copenhagen, 
Denmark. 
McEvoy, D., 2009, Insurance industry. Entry in the 
adaptation and mitigation strategies supporting European 
climate policy, (ADAM) project digital compendium 
(http://adam-digital-compendium.pik-potsdam.de/) 
accessed 29 March 2012McGranahan, G., Balk, D. 
and Anderson, B., 2007, 'The rising tide: assessing 
the risks of climate change and human settlements 
in low elevation coastal zones', Environment and 
Urbanization, 19(1) 17–37. 
McKenzie Hedger, M., Connell, Richenda and 
Bramwell, P., 2006, 'Bridging the gap: empowering 
decision-making for adaptation through the UK 
Climate Impacts Programme', Climate Policy, 6(2) 
201–215.
References 
Urban adaptation to climate change in Europe 137 
Mechler, R., Dlugolecki, A., Linnerooth-Bayer, J. 
and Hochrainer, S., 2011, Insurance instruments 
for adaptation to climate change, presentation at 
prevention and insurance of natural catastrophes, 
18 October 2011, Brussels, Belgium. 
Mechler, R., Hochraine, S., Aaheim, A., 
Kundezewicz, Z. K., Lugeri, N. and Moriondo, M., 
2010,'A risk management approach for assessing 
adaptation to changing flood and drought risks 
in Europe', in: Making Climate Change Work for Us: 
European Perspectives on Adaptation and Mitigation 
Strategies, Cambridge University Press, Cambrigde. 
Medarova-Bergstrom, K., Volkery, A., Schiellerup, 
P., Withana, S. and Baldock, D., 2011, Strategies and 
instruments for climate proofing the EU budget, IEEP, 
Brussels. 
Medina-Ramón, M., Zanobetti, A., Cavanagh, D. P. 
and Schwartz, J., 2006, 'Extreme temperatures and 
mortality: Assessing effect modification by personal 
characteristics and specific cause of death in a 
multi-city case-only analysis', Environmental Health 
Perspectives, 114(9) 1 331–1 336. 
Meier, H. E. M., 2006, 'Baltic Sea climate in the late 
twenty-first century: a dynamical downscaling 
approach using two global models and two emission 
scenarios', Climate Dynamics, 27(1) 39–68. 
Mickwitz, P., 2009, Climate policy integration, 
coherence and governance, Partnership for European 
Environmental Research, Helsinki. 
de Moel, H., van Alphen, J. and Aerts, J. C. J. H., 
2009, 'Flood maps in Europe — methods, availability 
and use', Natural Hazards and Earth System Science, 
9(2) 289–301. 
Municipality of Kalamaria, 2011, Adaptation 
Action Plan and Political Statement (http://www. 
grabs-eu.org/downloads/Municipality %20of %20 
Kalamaria %20CAAP.pdf) accessed 29 March 2012. 
Næss, L. O., Bang, G., Eriksen, S. and Vevatne, J., 
2005, 'Institutional adaptation to climate change: 
Flood responses at the municipal level in Norway', 
Global Environmental Change, 15(2) 125–138. 
Natural Economy North West, 2012, Natural Economy 
North West (http://www.naturaleconomynorthwest. 
co.uk/about.php) accessed 29 March 2012. 
Nawrot, T. S., Nackaerts, K., Hoet, P. H. M. and 
Nemery, B., 2007, 'Lung cancer mortality and fine 
particulate air pollution in Europe', International 
Journal of Cancer, 120(8) 1 825–1 826. 
NCVO, 2012, Climate change | National Council for 
Voluntary Organisations (http://www.ncvo-vol.org.uk/ 
climatechange) accessed 29 March 2012. 
Nicholls, R. J., 2004, 'Coastal flooding and wetland 
loss in the 21st century: changes under the SRES 
climate and socio-economic scenarios', Global 
Environmental Change, 14(1) 69–86. 
Nicholls, R. J., Hanson, S., Herweijer, C., Patmore, 
N., Hallegatte, S., Corfee-Morlot, J., Chateau, J. 
and Muir-Wood, R., 2007, Ranking port cities with 
high exposure and vulnerability to climate extremes 
— exposure estimates, Environment working paper 
No 1, Organization for Economic Cooperation and 
Development, OECD, Paris. 
Oke, T. R., 1987, Boundary layer climates, 2nd ed., 
Methuen, London, New York. 
Oke, T. R., 1982, 'The energetic basis of the 
urban heat island', Quarterly Journal of the Royal 
Meteorological Society, 108(455) 1–24. 
Oliveira, R., Ribeiro, L., Mendes, M. P. and 
Nascimento, J., 2010,'Recursos Hídricos', in: Santos, 
F.D. and Cruz, M.J. (eds.) Plano Estratégico de Cascais 
face às Alterações Climáticas, Câmara Municipal de 
Cascais, Portugal. 
ONERC, 2010, Cities and adapting to climate change: 
Report to the Prime Minister and Parliament, La 
Documentation Francais, Observatoire National sur 
les Effets du Réchauffement Climatique, Paris. 
Ongjerth, R., Gábor, P. and Jombach, S., 2007, 
A városi hősziget és a zöldfelületi intenzitás kapcsolata, 
Studio Metropolitana, Budapest. 
Pahl-Wostl, C., 2009, 'A conceptual framework for 
analysing adaptive capacity and multi-level learning 
processes in resource governance regimes', Global 
Environmental Change, 19(3) 354–365. 
Paldy, A. and Bobvos, J., 2010,'Health impacts of 
heat waves of 2007 in Hungary — Background and 
experiences', in: Dincer, I. Hepbasli, A. Midilli, A. 
and Karakoc, T. H. (eds.) Global Warming, Springer 
US, Boston, MA.
References 
138 Urban adaptation to climate change in Europe 
Pauleit, S., Liu, L., Ahern, J. and Kazmierczak, A., 
2011,'Multifunctional green infrastructure planning 
to promote ecological services in the city', in: Urban 
Ecology. Patterns, Processes, and Applications, Oxford 
University Press, Oxford. 
PB, 2009, Climate change risk assessment and adaptation 
action plan: Volume 1 — risk assessment report, Parsons 
Brinckerhoff Australia Pty Limited; Penrith City 
Council, Sydney. 
PBL, 2011, Climate Adaptation in the Dutch Delta. 
Strategic options for a climate-proof development of 
the Netherlands, PBL Netherlands Environmental 
Assessment, Den Haag, the Netherlands. 
Philip, R., 2011, Zaragoza, Spain — Reducing water 
demand and establishing a water saving culture 
in the city of Zaragoza. case study in the SWITCH 
project, ICLEI European Secretariat, Freiburg. 
Piorr, A., Ravetz, J. and Tosics, I., 2011, 
Peri‑urbanisation in Europe, PLUREL, Berlin. 
PLUREL, 2011, Peri-urbanisation in Europe — Towards 
European policies to sustain urban-rural futures. 
Synthesis Report, Forest  Landscape, University of 
Copenhagen, Copenhagen. 
Provincia di Genova, 2011, Climate change adaptation 
action plan. Executive summary (http://www.grabs-eu. 
org/downloads/Province %20of %20Genoa %20 
AAP_Executive %20summary.pdf) accessed 
29 March 2012. 
Prutsch, A., Grothmann, T., Schauser, I., Otto, S. and 
McCallum, S., 2010, Guiding principles for adaptation 
to climate change in Europe, ETC/ACC Technical 
Paper, The European Topic Centre on Air and 
Climate Change, Bilthoven. 
Rauhala, J. and Schultz, D. M., 2009, 'Severe 
thunderstorm and tornado warnings in Europe', 
Atmospheric Research, 93(1–3) 369–380. 
Reid, C., O'Neill, M., Gronlund, C., Brines, S., 
Brown, D., Diez-Roux, A. and Schwartz, J., 2009, 
Mapping community determinants of heat 
vulnerability, Environmental Health Perspectives, 
117(11) 1 730–1 736. 
Rhodes, R. A. W., 1996, 'The new governance: 
Governing without government', Political Studies, 
44(4) 652–667. 
Ribeiro, M., Losenno, C., Dworak, T, Massey, E, 
Swart, R, Benzie, M. and Laaser, C., 2009, Design of 
guidelines for the elaboration of regional climate 
change adaptations strategies. Study for European 
Commission, Ecologic institute, Berlin. van Riel, W., 
2011, Exploratory study of pluvial flood impacts in Dutch 
urban areas, Deltares, Delft. 
Robine, J., Cheung, S., Leroy, S., Vanoyen, H., 
Griffiths, C., Michel, J. and Herrmann, F., 2008, 
'Death toll exceeded 70,000 in Europe during the 
summer of 2003', Comptes Rendus Biologies, 331(2) 
171–178. 
Royal Academy of Engineering, 2011, Infrastructure, 
engineering and climate change adaptation — ensuring 
services in an uncertain future, Royal Academy of 
Engineering, London. 
Salford City Council, 2008, Planning Guidance: Flood 
Risk and Development (http://www.salford.gov.uk/ 
floodrisk-planguidance.htm) accessed 29 March 
2012. 
Sardon, J.-P., 2007, 'The 2003 heat wave', Euro 
Surveillance, 12(3) 226. 
Scarlett, L., 2011,'Climate Adaptation', in: 
Linkov, I. and Bridges, T. S. (eds.) Climate, Springer 
Netherlands, Dordrecht. 
Schär, C., Vidale, P. L., Lüthi, D., Frei, C., Häberli, C., 
Liniger, M. A. and Appenzeller, C., 2004, The role 
of increasing temperature variability in European 
summer heatwaves, Nature, 427(6972) 332–336. 
Schauser, I., Otto, S., Schneiderbauer, S., Harvey, A., 
Hodgson, N., Robrecht, H., Morchain, D., Schrander, 
J.-J., Khovanskaia, M., Celikyilmaz-Aydemir, G., 
Prutsch, A. and McCallum, S., 2010, Urban regions: 
vulnerabilities, vulnerability assessments by indicators 
and adaptation options for climate change impacts — 
Scoping study, ETC/ACC Technical Paper, European 
Topic Centre on Air and Climate Change, Bilthoven. 
Schmidt-Thomé, P. and Pelton, L., 2006,'Sea level 
change assessment in the Baltic Sea Region and 
spatial planning responses', in: Sea Level Change 
Affecting the Spatial Development of the Baltic Sea 
Region, Special paper 41, Geological Survey of 
Finland, Espoo, 7–16.
References 
Urban adaptation to climate change in Europe 139 
Schröter, D. et al., 2004, ATEAM Final report. Section 
5 and 6 and Annex 1 to 6. Detailed report, related to 
overall project duration. Reporting period: 01.01.2001- 
30.06.2004, Potsdam Institute for Climate Impact 
Research (PIK), Potsdam. 
Schumacher, U., 2005, Historic maps promote recent 
flood risk research — the case of the upper Elbe river, 
Leibnitz Institute of Ecological and Regional 
Development, Dresden. 
Scott, F., 2011, Is localism delivering for climate 
change? Emerging responses from local authorities, local 
enterprise partnerships and neighbourhood plans, Green 
Alliance, London. 
Scott, J. and Weston, C., 2011, 'The pitfalls 
and promises of climate adaptation planning', 
Australasian Journal of Environmental Management, 
18(2) 73–87. 
Sedee, A.G.J. and Pijnappels, M.H.J., 2010, Klimaat 
als kans. Adaptatie aan klimaatverandering in de 
ruimtelijke ordening, Kennis voor Klimaat, Utrecht. 
Shaw, R., Colley, M. and Connell, R., 2007, Climate 
change adaptation by design: a guide for sustainable 
communities, TCPA, London. 
Smargiassi, A., Goldberg, M. S., Plante, C., Fournier, 
M., Baudouin, Y. and Kosatsky, T, 2009, 'Variation 
of daily warm season mortality as a function of 
micro-urban heat islands', Journal of Epidemiology  
Community Health, 63(8) 659–664. 
Smit, B., Burton, I., Klein, R. J. T. and Wandel, J., 
2000, 'An anatomy of adaptation to climate change 
and variability', Climatic Change, (45) 223–251. 
Smit, B. and Pilifosova, O., 2001, Adaptation to 
climate change in the context of sustainable development 
and equity. Contribution of the Working Group to the 
third assessment report of the Intergovernmental Panel 
on Climate Change, Cambridge University Press, 
Cambridge. 
Sousa, P. M., Trigo, R. M., Aizpurua, P., Nieto, R., 
Gimeno, L. and Garcia-Herrera, R., 2011, 'Trends and 
extremes of drought indices throughout the 20th 
century in the Mediterranean', Natural Hazards and 
Earth System Science, 11(1) 33–51. 
Southampton City Council, 2011, Low Carbon City 
2011-2020. Part 2: The Strategy (http://www.grabs-eu. 
org/downloads/Part %202 %20 %20The %20 
Low %20Carbon %20City %20Strategy.pdf) accessed 
29 March 2012. 
Stalenberg, B. and Vrijling, H., 2009,'The concept 
of adaptable flood defenses as a synergic and 
sustainable solution for the flood issues in the city 
of Nijmegen (NL)' (http://www.waterbouw.tudelft. 
nl/fileadmin/Faculteit/CiTG/Over_de_faculteit/ 
Afdelingen/Afdeling_Waterbouwkunde/sectie_ 
waterbouwkunde/people/personal/stalenberg/ 
Publications/doc/SASBE2009_NT4380.pdf) accessed 
29 March 2012. 
Stedman, J. R., 2004, 'The predicted number of 
air pollution related deaths in the UK during the 
August 2003 heatwave', Atmospheric Environment, 
38(8) 1 087–1 090. 
Stedman, J. R., Anderson, H. R., Atkinson, R. W. 
and Maynard, R. L., 1997, 'Emergency hospital 
admissions for respiratory disorders attributable 
to summer time ozone episodes in Great Britain', 
Thorax, 52(11) 958–963. 
Steeneveld, G. J., Koopmans, S., Heusinkveld, B. 
G., van Hove, L. W. A. and Holtslag, A. A. M., 
2011, Quantifying urban heat island effects and 
human comfort for cities of variable size and 
urban morphology in the Netherlands, Journal of 
Geophysical Research, 116(D20). 
Sterl, A., Severijns, C., Dijkstra, H., Hazeleger, 
W., Jan van Oldenborgh, G., van den Broeke, M., 
Burgers, G., van den Hurk, B., Jan van Leeuwen, P. 
and van Velthoven, P., 2008, 'When can we expect 
extremely high surface temperatures?', Geophysical 
Research Letters, 35(14) L14703. 
Stocker, T., Dahe, Q., Plattner, G.-K., Tignor, M., 
Allen, S. and Midgley, P., 2010, IPCC workshop on 
sea level rise and ice sheet instabilities — Workshop 
report, Kuala Lumpur, Malaysia, 21–25 June 2010, IPCC 
Working Group I Technical Support Unit, Bern, 
Switzerland. 
Stone, C., 1986,'Power and Social Complexity', in: 
Waste, R. J. (ed.) Community Power. Directions for 
future research, SAGE, Beverly Hills. 
Storbjörk, S., 2007, 'Governing climate adaptation 
in the local arena: Challenges of risk management 
and planning in Sweden', Local Environment, 12(5) 
457–469.
References 
140 Urban adaptation to climate change in Europe 
Swart, R., Biesbroek, R., Binnerup, S, Carter, T.R., 
Cowan, C, Henrichs, T, Loquen, S., Mela, H., 
Morecroft, M., Reese, M. and Rey, D., 2009, Europe 
adapts to climate change comparing national adaptation 
strategies, PEER, Helsinki. 
Tanner, T., Mitchell, T., Polack, V. and Guenther, B., 
2009, Urban governance for adaptation: assessing climate 
change resilience in ten Asian cities, Working paper 
No 315, Volume 2009, Institute of Development 
Studies, Brighton, United Kingdom. 
Tigrek, S. and Kibaroglu, A., 2011,'Strategic Role 
of Water Resources for Turkey', in: Kramer, A. 
Kibaroglu, A. and Scheumann, W. (eds.), Turkey's 
Water Policy, Springer Berlin Heidelberg, Berlin, 
Heidelberg. 
Uejio, C. K., Wilhelmi, O. V., Golden, J. S., Mills, 
D. M., Gulino, S. P. and Samenow, J. P., 2011, 
'Intra‑urban societal vulnerability to extreme heat: 
the role of heat exposure and the built environment, 
socioeconomics, and neighborhood stability', Health 
 Place, 17(2) 498–507. 
UKCIP, 2009, A local climate impacts profile: how to 
do an LCLIP. UK Climate Impacts Programme, Oxford 
(http://www.ukcip.org.uk/wordpress/wp-content/ 
PDFs/LCLIP_guidance2009.pdf) accessed 29 March 
2012. 
UN, 2010, World urbanization prospects, the 2009 
revision. Highlights, United Nations, New York. 
UNECE, 2009, Guidance on water and adaptation to 
climate change, United Nations, New York, Geneva. 
UNISDR, 2009, 2009 UNISDR terminology on disaster 
risk reduction, United Nations International Strategy 
for Disaster Reduction, Geneva. 
VÁTI, 2011, Climate-friendly cities: A handbook on the 
tracks and possibilities of European cities in relation to 
climate change, Ministry of Interior Hungary — VÁTI, 
Budapest. 
Vermeer, M. and Rahmstorf, S., 2009, 'From 
the Cover: Global sea level linked to global 
temperature', Proceedings of the National Academy of 
Sciences, 106(51) 21 527–21 532. 
Wardekker, J. A., 2011, Climate change impact 
assessment and adaptation under uncertainty, Utrecht 
University, Utrecht. (http://www.nusap.net/ 
downloads/Wardekker_PhDdissertation_2011.pdf) 
accessed 29 March 2012. 
Watkiss, P., 2011, The ClimateCost project. Final report, 
Volume 1: Europe, Stockholm Environment Institute, 
Stockholm, Sweden. 
Westerhoff, L., Keskitalo, E. C. H. and Juhola, S., 
2011, Capacities across scales: local to national 
adaptation policy in four European countries, 
Climate Policy, 11(4) 1 071–1 085. 
Wilby, R. L., 2008, Constructing climate change 
scenarios of urban heat island intensity and air 
quality, Environment and Planning B: Planning and 
Design, 35(5) 902–919. 
Wilhelmi, O. V. and Hayden, M. H., 2010, 
Connecting people and place: a new framework 
for reducing urban vulnerability to extreme heat, 
Environmental Research Letters, 5(1) 014021. 
Wilhelmi, O. V., Purvis, K. L. and Harriss, R. 
C., 2004, Designing a geospatial information 
infrastructure for mitigation of heat wave hazards in 
urban areas, Natural Hazards Review, 5(3) 147. 
World Bank, 2012, The worldwide governance indicators 
(WGI) project (http://info.worldbank.org/governance/ 
wgi/index.asp) accessed 29 March 2012. 
Yohe, G. and Tol, R. S. J., 2002, Indicators for social 
and economic coping capacity—moving toward 
a working definition of adaptive capacity, Global 
Environmental Change, (12) 25–40. 
Young, O.R., 2002, The institutional dimensions of 
environmental change. Fit, interplay, and scale, MIT 
Press, Cambridge and London.
141 
Annex I 
Urban adaptation to climate change in Europe 
Annex I Key information 
The European Climate Adaptation Platform 
CLIMATE-ADAPT (Figure A.1) provides a huge 
variety of information on climate change adaptation 
at European, national, regional level and for cities 
including case studies, tools, reports and documents. 
This collection will be continuously updated. In 
addition national information portals provide 
information for urban adaptation. 
Figure A.1 Homepage of the European 
Climate Adaptation Platform 
CLIMATE‑ADAPT 
Source: http://climate-adapt.eea.europa.eu. 
The following list highlights selected key sources. 
a) Selection of key literature and studies 
VÁTI, 2011, Climate-Friendly Cities: A Handbook 
on the Tracks and Possibilities of European Cities in 
Relation to Climate Change, Ministry of Interior 
Hungary — VÁTI, Budapest (http://www.eukn.org/ 
dsresource?objectid=224489). 
CoR, 2011a, Adaptation to Climate Change: Policy 
instruments for adaptation to climate change in big 
European cities and metropolitan areas, European 
Union. Committee of the Regions, Brussels 
(http://80.92.67.120/en/documentation/studies/ 
Documents/Adaptation%20to%20Climate%20 
Change/EN.pdf). 
Schauser et al., 2010, Urban Regions: Vulnerabilities, 
Vulnerability Assessments by Indicators and Adaptation 
Options for Climate Change Impacts — Scoping Study, 
European Topic Centre on Air and Climate Change, 
Bilthoven (http://acm.eionet.europa.eu/reports/docs/ 
ETCACC_TP_2010_12_Urban_CC_Vuln_Adapt. 
pdf). 
IPCC, 2007, Climate change 2007: Synthesis report. 
Contribution of Working Groups I, II and III to the 
Fourth Assessment Report of the Intergovernmental 
Panel on Climate Change, Cambridge University 
Press, Cambridge, United Kingdom (http://www. 
ipcc.ch/pdf/assessment-report/ar4/syr/ar4_syr.pdf). 
EEA, JRC and WHO, 2008, Impacts of Europe's 
changing climate: 2008 indicator-based assessment, 
EEA Report No 4/2008, European Environment 
Agency (http://www.eea.europa.eu/publications/ 
eea_report_2008_4). 
EEA, 2010a, The European environment — state and 
outlook 2010: Thematic assessment — Adapting to 
climate change. European Environment Agency 
(http://www.eea.europa.eu/soer/europe/adapting-to-climate- 
change).
Annex I 
142 Urban adaptation to climate change in Europe 
Greiving, S. et al., 2011, ESPON Climate. Climate 
Change and Territorial Effects on Regions and Local 
Economies, ESPON (http://www.espon.eu/export/ 
sites/default/Documents/Projects/AppliedResearch/ 
CLIMATE/inceptionreport_final.pdf). 
OECD, 2010, Cities and Climate Change, OECD 
Publishing (http://www.oecd.org/document/34/0 
,3746,en_2649_37465_46573474_1_1_1_37465,00. 
html#how_to_obtain_this_book) 
Corfee-Morlot, J., Kamal-Chaoui, L., Donovan, M., 
Cochran, I., Robert, A. and Teasdale, P., 2009, Cities, 
Climate Change and Multilevel Governance OECD 
Environmental Working Papers N° 14., OECD 
Publishing. 
Kamal-Chaoui, L. and Robert, A. (eds), 
2009, Competitive Cities and Climate Change, 
OECD publishing (http://www.oecd.org/ 
dataoecd/30/36/44232251.pdf). 
Kazmierczak, A. and Carter, J., 2010, Adaptation 
to climate change using green and blue infrastructure. 
A database of case studies (http://www.grabs-eu.org/ 
membersArea/files/Database_Final_no_hyperlinks. 
pdf). 
Keskitalo, E. C. H., 2010, Developing adaptation policy 
and practice in Europe: multi-level governance of climate 
change, Springer, Dordrecht; New York. 
b) Selection of tools and guidance for 
adaptation 
Shaw, R., Colley, M. and Connell, R., 2007, Climate 
change adaptation by design: a guide for sustainable 
communities, TCPA, London (www.preventionweb. 
net/files/7780_20070523CCAlowres1.pdf). 
Matthies, F., Bickler, G., Cardenosa Marin, N. and 
Hales, S., 2008, Heat-health action plans — Guidance, 
WHO Regional Office for Europe, Copenhagen, 
Denmark (http://www.euro.who.int/__data/assets/ 
pdf_file/0006/95919/E91347.pdf). 
SWITCH Managing Water for the City of the Future 
— Trainings Desk (http://www.switchtraining.eu/ 
home). 
UKCIP Adaptation Wizard (http://www.ukcip.org. 
uk/wizard). 
Snover, A. K., Whitely Binder, L., Lopez, J., 
Willmott, E., Kay, J., Howell, D. and Simmonds, J., 
2007, Preparing for Climate Change: A Guidebook for 
Local, Regional, and State Governments, ICLEI- Local 
Governments for Sustainability, Oakland, CA, USA 
(http://www.icleiusa.org/action-center/planning/ 
adaptation-guidebook). 
Ribeiro, M., Losenno, C., Dworak, T., Massey, E., 
Swart, R., Benzie, M. and Laaser, C., 2009, Design 
of guidelines for the elaboration of Regional Climate 
Change Adaptations Strategies. Study for European 
Commission.
143 
Annex II 
Urban adaptation to climate change in Europe 
Data types Primary data source Link 
Share of green and blue urban areas per city 
area 
Urban Atlas http://www.eea.europa.eu/data-and-maps/data/ 
urban-atlas 
Percentage of the city that would be flooded in 
case of water in rivers rises 1m 
Urban Atlas; Projected 
change in 100-year return 
level of river discharge 
between 2071–2100 and the 
reference period 1961–1990 
http://www.eea.europa.eu/data-and-maps/data/ 
urban-atlas 
http://ec.europa.eu/dgs/jrc/index.cfm 
Mean soil sealing degree EEA FTSP on Land Monitoring 
— Degree of soil sealing 
100 m 
http://www.eea.europa.eu/data-and-maps/ 
data/eea-fast-track-service-precursor-on-land-monitoring- 
degree-of-soil-sealing-100m-1 
Change in the potential inundation exposure 
for urban areas due to sea level rise 
Urban Atlas; 
ESPON CLIMATE 
http://www.eea.europa.eu/data-and-maps/data/ 
urban-atlas 
Total population Urban Audit http://epp.eurostat.ec.europa.eu/portal/page/ 
portal/region_cities/introduction 
Population density Urban Audit http://epp.eurostat.ec.europa.eu/portal/page/ 
portal/region_cities/introduction 
Share of people  65 years Urban Audit http://epp.eurostat.ec.europa.eu/portal/page/ 
portal/region_cities/introduction 
Percentage of higher educated population aged 
15–64 (qualified at tertiary level) 
Urban Audit http://epp.eurostat.ec.europa.eu/portal/page/ 
portal/region_cities/introduction 
percentage of women among elected city 
representatives 
Urban Audit http://epp.eurostat.ec.europa.eu/portal/page/ 
portal/region_cities/introduction 
GDP per capita Urban Audit http://epp.eurostat.ec.europa.eu/portal/page/ 
portal/region_cities/introduction 
Age dependency index Urban Audit http://epp.eurostat.ec.europa.eu/portal/page/ 
portal/region_cities/introduction 
Perceptions that the city is committed to fight 
against climate change 
Urban perception survey http://epp.eurostat.ec.europa.eu/portal/page/ 
portal/region_cities/introduction 
Perceptions on 'most people can be trusted' Urban perception survey http://epp.eurostat.ec.europa.eu/portal/page/ 
portal/region_cities/introduction 
Annex II City data 
The selection of cities considered in the maps and 
diagrams of this report is based on the Urban 
Audit database(Eurostat, 2012). This database 
includes 321 European cities in the 27 countries 
of the European Union along with 36 additional 
cities in Norway, Switzerland and Turkey. The 
administrative unit of the city is here defined as the 
'core city'. 
Table A1 below lists the data types collected for the 
report. They were retrieved from the Urban Audit 
database as well as other public available data 
sources. It should be noted that not all data were 
available for each of the Urban Audit cities. 
Table A.1 List of data types collected for the report 
Available at: http://www.eea.europa.eu/publications/urban-adaptation-to-climate-change. 
The following information can be downloaded at: 
http://www.eea.europa.eu/publications/urban-adaptation- 
to-climate-change 
• Interactive maps and Excel data table with the 
collected and produced city data; 
• Description of the methodology used to define 
the city area; 
• Description of specifically developed indicators: 
- Share of green and blue urban areas; 
- Coastal flooding; 
- River flooding.
European Environment Agency 
Urban adaptation to climate change in Europe 
Challenges and opportunities for cities 
together with supportive national and European policies 
2012 — 143 pp. — 21 x 29.7 cm 
ISBN 978-92-9213-308-5 
doi:10.2800/41895 
HOW TO OBTAIN EU PUBLICATIONS 
Free publications: 
• via EU Bookshop (http://bookshop.europa.eu); 
• at the European Union's representations or delegations. You can obtain their contact details on the Internet (http://ec.europa.eu) or by sending a fax to 
+352 2929-42758. 
Priced publications: 
• via EU Bookshop (http://bookshop.europa.eu). 
Priced subscriptions (e.g. annual series of the Official Journal of the European Union and reports of cases before the Court of Justice of the European Union): 
• via one of the sales agents of the Publications Office of the European Union 
(http://publications.europa.eu/others/agents/index_en.htm).
TH-AL-12-002-EN-C 
doi:10.2800/41895 
European Environment Agency 
Kongens Nytorv 6 
1050 Copenhagen K 
Denmark 
Tel.: +45 33 36 71 00 
Fax: +45 33 36 71 99 
Web: eea.europa.eu 
Enquiries: eea.europa.eu/enquiries

Eea report-2-2012 urban-adaptation_to_climate_change[1]

  • 1.
    EEA Report No2/2012 ISSN 1725-9177 Urban adaptation to climate change in Europe Challenges and opportunities for cities together with supportive national and European policies
  • 3.
    EEA Report No2/2012 Urban adaptation to climate change in Europe Challenges and opportunities for cities together with supportive national and European policies
  • 4.
    Cover design: EEA Layout: EEA/Henriette Nilsson Cover photo © sxc/Xpgomes Left photo © Ricciardi Right photo © sxc/abcd200 European Environment Agency Kongens Nytorv 6 1050 Copenhagen K Denmark Tel.: +45 33 36 71 00 Fax: +45 33 36 71 99 Web: eea.europa.eu Enquiries: eea.europa.eu/enquiries Legal notice The contents of this publication do not necessarily reflect the official opinions of the European Commission or other institutions of the European Union. Neither the European Environment Agency nor any person or company acting on behalf of the Agency is responsible for the use that may be made of the information contained in this report. All rights reserved No part of this publication may be reproduced in any form or by any means electronic or mechanical, including photocopying, recording or by any information storage retrieval system, without a prior permission in writing. For permission, translation or reproduction rights please contact EEA (address information below). Information about the European Union is available on the Internet. It can be accessed through the Europa server (www.europa.eu). Luxembourg: Office for Official Publications of the European Union, 2012 ISBN 978-92-9213-308-5 ISSN 1725-9177 doi:10.2800/41895 © EEA, Copenhagen, 2012 Environmental production This publication is printed according to high environmental standards. Printed by Rosendahls-Schultz Grafisk — Environmental Management Certificate: DS/EN ISO 14001: 2004 — Quality Certificate: DS/EN ISO 9001: 2008 — EMAS Registration. Licence no. DK — 000235 — Ecolabelling with the Nordic Swan, licence no. 541 176 — FSC Certificate — licence code FSC C0688122 Paper RePrint — FSC Certified 90 gsm. CyclusOffset 250 gsm. Both paper qualities are recycled paper and have obtained the ecolabel Nordic Swan. Printed in Denmark REG.NO.DK-000244 ESPON disclaimer: Texts and maps stemming from research projects under the ESPON programme presented in this report do not necessarily reflect the opinion of the ESPON Monitoring Committee.
  • 5.
    3 Contents Urbanadaptation to climate change in Europe Contents Acknowledgements ....................................................................................................5 Key messages............................................................................................................. 6 1 What is this report about and who should read it? ...............................................10 2 Climate change challenges and response options ................................................13 2.1 Heat ..............................................................................................................18 2.1.1 Why are heatwaves an important urban challenge? �18 2.1.2 What are the potential impacts of heat on Europe's cities? �24 2.1.3 How can cities adapt to heat stress?..........................................................31 2.2 Flooding .........................................................................................................35 2.2.1 What are the challenges for cities regarding flooding? �35 2.2.2 What are the potential flooding impacts on Europe's cities? ..........................37 2.2.3 How can cities adapt to flooding?...............................................................48 2.3 Water scarcity and droughts...............................................................................53 2.3.1 Why are water scarcity and drought challenges for cities? �53 2.3.2 What are the potential impacts of water scarcity and droughts on Europe's cities?...................................................................................55 2.3.3 How can cities adapt to water scarcity and droughts? �59 3 Planning urban adaptation .................................................................................. 62 3.1 Capacity to adapt in Europe's cities.....................................................................62 3.1.1 Awareness: knowledge and equity.............................................................63 3.1.2 Ability: access to technology and infrastructure �66 3.1.3 Action: economy, resources and institutions �69 3.1.4 Summarising the adaptive capacity of cities �72 3.2 Planning steps to urban adaptation.....................................................................74 3.2.1 Get started: initiate adaptation, ensure commitment and management...........74 3.2.2 Assess potential climate change risks and vulnerabilities �75 3.2.3 Identify a wide range of adaptation options �75 3.2.4 Assess and prioritise adaptation options.....................................................77 3.2.5 Implement adaptation actions...................................................................77 3.2.6 Monitor and evaluate adaptation action......................................................78 3.3 Success factors ...............................................................................................79 3.3.1 Raising awareness of climate change and the need to adapt..........................79 3.3.2 Cutting across different sectors and levels �80 3.3.3 Utilising the co-benefits of adaptive actions �84 3.3.4 Dealing with uncertainty and long time frames �86 3.3.5 Working with nature — not against............................................................91 3.3.6 Securing resources for adaptation .............................................................93
  • 6.
    Contents 4 Urbanadaptation to climate change in Europe 4 Multi-level governance — enabling urban adaptation �95 4.1 Governing adaptation at different spatial levels ....................................................95 4.1.1 The local level ........................................................................................96 4.1.2 The regional level ...................................................................................98 4.1.3 The national level....................................................................................98 4.1.4 The European level................................................................................101 4.2 Bridging the levels — multi-level governance......................................................106 4.2.1 The needs and benefits of multi-level governance �106 4.2.2 Challenges ...........................................................................................108 4.2.3 Success factors ....................................................................................111 4.3 Pillars for multi-level governance .....................................................................112 4.3.1 Policy coherence through multi-level climate proofing �112 4.3.2 Territorial governance ...........................................................................115 4.3.3 Developing institutional capacities across levels �117 4.3.4 Securing access to funding for adaptation measures �119 4.3.5 Multi-level knowledge base.....................................................................122 Glossary.................................................................................................................. 125 References.............................................................................................................. 128 Annex I Key information....................................................................................... 141 a) Selection of key literature and studies.......................................................141 b) Selection of tools and guidance for adaptation �142 Annex II City data.................................................................................................. 143
  • 7.
    5 Acknowledgements Urbanadaptation to climate change in Europe Acknowledgements This report was written and compiled by: • European Environment Agency (EEA): Birgit Georgi with the support of Stéphane Isoard, Blaz Kurnik, Valentin Leonard Foltescu under the guidance of Ronan Uhel and André Jol; • European Topic Centre Climate Change Adaptation (ETC/CCA): Rob Swart, Natasha Marinova, Bert van Hove, Cor Jacobs, Judith Klostermann, Aleksandra Kazmierczak, Lasse Peltonen, Leena Kopperoinen, Kari Oinonen, Miroslav Havránek, Maria João Cruz; • European Topic Centre Spatial Information and Analysis (ETC/SIA): Mirko Gregor, Jaume Fons‑Esteve; • Umeå University: Carina Keskitalo; • Aalto University: Sirkku Juhola; • Umweltforschungszentrum Leipzig (UFZ): Kerstin Krellenberg; and • The Netherlands Environmental Assessment Agency (PBL): Leendert van Bree. Further contributions were received from: Stefan Greiving, Christian Lindner and Johannes Lückenkötter (IRPUD, TU Dortmund); Lykke Leonardsen (city of Copenhagen); Ingrid Molander (Botkyrka municipality); Tanja Wolf (WHO Europe); Holger Robrecht and Daniel Morchain (ICLEI Europe); Cédric Peinturier (Ministère de l'Écologie, du Développement Durable, des Transports et du Logement, France); Kathy Belpaeme (ICZM — Belgium); and Stefaan Gysens. The report team also wishes to thank the many further experts providing support throughout the development of this report, in particular: Corinne Hermant-de Callataÿ, Matthieu Fichter and Zoé Buyle-Bodin (European Commission); Alex Harvey (AEA); Johan Bogaert (Flemish government, Belgium); Peter Bosch (TNO); Zoltán Kohán and Péti Márton (VATI); Sandy Taylor (Birmingham City Council); Michael Klinkenberg (EUROCITIES); Inke Schauser (UBA, Germany); Stefan Schneiderbauer (EURAC); Stephanie Broadley and Michael Chang (TCPA); Anne Holsten, Tabea Lissner and Jürgen P. Kropp (PIK); Vincent Viguié (CIRED); Pierre Laconte (Foundation for the Urban Environment); Rita Jacinto, Pedro Garrett and Ana Gomes (FFCUL); Tiago Capela Lourenço (Lisbon University); Christofer Åström and Joacim Rocklöv (Umeå University); Anna Paldy (National Institute of Environmental Health (NIEH, Hungary); Bertrand Reysset (Ministère de l'Écologie, du Développement Durable, des Transports et du Logement, France); Buket Akay (Ministry of Environment and Urban, Turkey); Celine Magnier (Ministère de l'Écologie, du Développement Durable, des Transports et du Logement, France); Else Lobersli (Direktoratet for naturforvaltning, Norway); Francesca Giordano (ISPRA, Italy); Pavel Stastny (SHMI, Slovakia); Simona Losmanova (CENIA, Czech Republic); Vita Slanke (LVGMC, Latvia); Martin Füssel, Andrus Meiner, Bo Jacobsen and Peter Kristensen (EEA).
  • 8.
    6 Key messages Urban adaptation to climate change in Europe Key messages Climate change — the risk to cities and Europe Climate change is happening, projected to continue and poses serious challenges for cities. Extreme weather events resulting in hazards such as heatwaves, floods and droughts are expected to happen more frequently in many parts of Europe. The impacts are stark: flooding can damage or wash away homes, businesses and infrastructure. Jobs and vital services will be lost. Heatwaves can compromise public health, reduce productivity and constrain the functionality of infrastructure. Water scarcity will place cities in competition for water with a wide variety of other sectors, including agriculture, energy generation and tourism. Cities drive Europe's economy and generate substantial wealth. If important economic hubs such as London, Paris or Rotterdam experience climate related problems Europe's economy and quality of life will be under threat. Urbanisation, population ageing and other socio-economic trends interact with climate change Climate change is strongly intertwined with other socio-economic changes. Demographic trends such as on-going urbanisation and competing demand for water from the public and sectors such as industry and agriculture leads to regional water scarcity. An ageing population increases the share of people vulnerable to heatwaves. Urbanisation also reduces the area available for natural flood management or increases the number of homes and businesses actually in flood-prone areas. These socio-economic changes increase the vulnerability of people, property and ecosystems under current climate conditions as long as no adaptation measures are taken. Climate change is projected to exacerbate these problems. Cities face specific climate change challenges … Three quarters of the population of Europe live in urban areas and this is where climate change will be most apparent in everyday life. While urban areas will generally experience the same exposures to climate change as surrounding regions, the urban setting can alter this as well as any potential local impacts. The replacement of natural vegetation with artificial surfaces and buildings creates unique microclimates altering temperature, moisture, wind direction and rainfall patterns. Differences in urban design and management make cities vulnerable in different ways, even those situated in the same geographic region. Excessive amounts of rain water cannot drain into the ground where a high share of the city's area is imperviously sealed and thus generate or worsen floods. A high amount of artificial surfaces stores heat and cause raised temperatures in cities compared to the surrounding region. Photo: © ESA
  • 9.
    Key messages Urbanadaptation to climate change in Europe 7 … and depend highly on other regions in Europe and beyond Cities depend heavily on other cities and regions to provide them with indispensable services such as food, water and energy and the infrastructure to deliver them. Ecosystem services from surrounding regions provide fresh air, store or drain flood water as well as drinking water. Climate change challenges: from risk management to opportunity seizing The challenges of climate change force drastic changes in city and regional management so innovative solutions are required alongside traditional measures. Establishing strong spatial planning which stops placing homes, businesses and infrastructure into current but also future risk-prone areas or providing more room for rivers can be an effective and sustainable way to deal with risks complementary to building higher dikes. Keeping public space and buildings cool by using green roofs or walls and providing more shade, rather than air conditioning, saves energy and can make cities even more attractive. Adaptation to climate change offers the opportunity for developing new jobs and promoting innovation and, at the same time, for implementing the profound changes needed in managing Europe's cities and regions. This will lead the way towards a more sustainable and resilient future for people, the economy and nature. Acting now ensures adaptation in time and at lower cost Cities cannot profess being unaware about climate change. Now is the time to act. Delaying adaptation action will most probably increase costs at a later stage or measures will come too late. Infrastructure, such as buildings, roads, railways, energy grids and sewage systems, lasts for decades and is expensive to replace. Building infrastructure ready for future climate conditions and not in risk prone areas (such as floodplains) will result in lower costs and increased effectiveness. Long-term planning is crucial but has often been lacking. Some positive examples can, however, be found in other areas such as insurance and pension planning. The Norwegian Government Pension Fund is one such example as it intends to ensure pensions in the future via a long-term strategy, despite the trend of an ageing population. Thereby it increasingly considers the climate change‑related risks of its investments. A similar long-term approach is needed for infrastructure investments. Maintaining the functioning of urban infrastructure requires massive investments Existing and future buildings and infrastructure need huge investments, alongside those for climate‑proofing, over the coming decades in order to keep them functioning and delivering their services. It means incorporating climate change adaptation concerns into building standards and retrofitting activities, such as ensuring that sewage systems can cope with heavier precipitation, reviewing building designs to better insulate against heat and adapting the energy and transport systems to cope with higher temperatures, low water availability or flooding. Large financial resources are needed irrespective of financial constraints. The Multi-annual Financial Framework (MFF), in particular the cohesion funds, is a key European Union instrument which supports local and regional adaptation. The MMF proposal for the period 2014–2020 foresees using a much higher share of the budget for climate change (20 %) than in the current period. However, the proposed 20 % will support both climate change mitigation and adaptation. Current political discussions seem very much focused on mitigation rather than adaptation. Investment goes beyond 'grey' infrastructure Adaptation also relates strongly to using and expanding green infrastructure such as parks, forests, wetlands, green walls and roofs, wherever feasible and sustainable. Such infrastructure serves to provide a cooling effect on cities as well as playing a role in managing floods. Measures which combine grey and green infrastructures (1) have the potential to deliver robust and flexible solutions over a long period. In addition they can deliver (1) Grey infrastructure: construction measures using engineering services. Green infrastructure: vegetated areas and elements such parks, gardens, wetlands, natural areas, green roofs and walls, trees etc. contributing to the increase of ecosystems resilience and delivery of ecosystem services.
  • 10.
    Key messages 8Urban adaptation to climate change in Europe benefits such as higher energy efficiency due to lower cooling needs, or attractive areas for nature, wildlife and recreation. 'Soft' measures (2) are another option and can often be implemented at less cost. Such measures include behavioural changes, emergency systems and the adequate provision of information to vulnerable groups. They can reduce health impacts in the event of heatwaves or flooding. While such systems are generally well-established in disaster risk management programmes they often do not include additional risks related to climate change. Investments in capacity building and planning processes are required to fully develop the potential of these soft measures. This would involve: • sharing information and building knowledge for citizens, administrations, politicians and business; • enabling and promoting innovation; • enabling a broad participation in planning and implementation thereby taking up local knowledge and educating people and decision‑makers; • changing long-term planning and implementation approaches across sectors and governmental levels; • providing the appropriate institutional structures and capacities for mainstreaming and cooperation across sectors and levels. Urban adaptation relies on action beyond cities' borders Events outside of cities can have major effects on urban areas. Certain cities, for example, face flooding due to inappropriate land use and flood management in upstream regions. In water scarce regions cities compete for water with agriculture and other users. Urban adaptation to climate change therefore requires regional, national and European approaches. Support from a national and European framework is crucial in assisting cities to adapt Cities and regional administrations need to establish grey and green infrastructures and soft local measures themselves. National and European policy frameworks can enable or speed up local adaptation thus making it more efficient. Supportive frameworks could comprise of: • sufficient and tailored funding of local action; • mainstreaming adaptation and local concerns into different policy areas to ensure coherence; • making the legal framework and budgets climate-proof; • setting an institutional framework to facilitate cooperation between stakeholders across sectors and levels; • providing suitable knowledge and capacities for local action. Few European regulations refer to adaptation, but a higher potential exists. One proposal linked to the European Union's structural funds for the period 2014–2020 states that project spending requires the existence of disaster risk assessments taking into account climate change adaptation as conditionality. It will ensure that expensive and long-lasting infrastructures are able to cope with future climate changes. In addition the proposal for the MFF 2014–2020 requests that the budget for climate change is sourced from different policy sectors forcing policy mainstreaming and coherence. Europe's future depends on strong and resilient cities — towards a joint, multi‑level approach to cope with climate change Europe needs to build climate change resilience in its cities. Cities and regions are connected on multiple levels with cities being key for the economy (2) Soft measures: policies, plans, programmes, procedures.
  • 11.
    Key messages Urbanadaptation to climate change in Europe 9 and wealth generation for Europe. This requires a joint and comprehensive approach combining dialogue and partnerships which crosses sectors and governmental levels. The development and implementation of the European climate change adaptation strategy for 2013 offers a unique opportunity to create this joint approach and reflects efforts cities have made in recent years to be part of related EU policy. Prominent examples, in which the European Commission directly works with cities and city networks, are the Sustainable Cities and Towns Campaign and the Covenant of Mayors initiative. The latter initiative sees more than 3 000 municipalities committing themselves to reduce their greenhouse gas emissions. An extension of this model towards the inclusion of adaptation is in discussion. Moreover, the European Commission started a project in 2011 to support urban adaptation strategies. This report … … provides information to facilitate this multi-level European process and the effective participation of local governments. It complements a range of other studies and information sources, such as the European Climate Adaptation Information Platform CLIMATE-ADAPT, the forthcoming EEA reports on climate change impacts and on adaptation (due in autumn 2012), the handbook on Climate-Friendly Cities (2011), published under the Hungarian EU presidency, among others listed later in the report.
  • 12.
    10 What isthis report about and who should read it? Urban adaptation to climate change in Europe Box 1.1 Key terms used in this report Urban areas, cities and towns: Due to a lack of European definitions these terms are used in the report depending on the particular context. The indicators in this report generally consider cities with more than 100 000 inhabitants. Results and guidance from this report are nevertheless relevant for cities and towns below that population threshold. The report uses 'urban areas' as a collective term to fit with the different country specific definitions of cities and towns. Adaptation to climate change is the adjustment in natural or human systems (e.g. urban areas) in response to actual or expected climatic stimuli or their effects. It moderates harm or exploits beneficial opportunities of climate change. Adaptive capacity is the ability of a system, such as urban areas, to adjust to climate change to moderate potential damages, to take advantage of opportunities or to cope with the consequences. Vulnerability: Many definitions exist according to the context. For example, the United Nations International Strategy for Disaster Reduction (UNISDR, 2009) defines vulnerability as the characteristics and circumstances of a community, system or asset that make it susceptible to the damaging effects of a hazard. The Intergovernmental Panel on Climate Change defines vulnerability to climate change as the degree to which a system is susceptible to, and unable to cope with, adverse effects of climate change, including climate variability and extremes. Vulnerability is a function of the character, magnitude and rate of climate change and variation to which a system is exposed, its sensitivity, and its adaptive capacity (CoR, 2011a; IPCC, 2007). While being aware of the different definitions and concepts of vulnerability, we do not use a specific definition or concept stringently in this report but rather use the term in a more generic way. Mitigation of climate change is an anthropogenic intervention to reduce the anthropogenic forcing of the climate system. It includes strategies to reduce greenhouse gas sources and emissions and enhancing greenhouse gas sinks. More terms can be found in the glossary at the end of this report. 1 What is this report about and who should read it? The need for an urban focus on climate change adaptation in Europe Climate change leading to higher temperatures, changing precipitation patterns and sea level rise, is a reality in Europe. Climate change mitigation measures will limit the magnitude and rate of related events in the future, but they will not prevent them. Pro-active adaptation to climate change is therefore imperative (EEA, 2010a). Around three quarters of Europe's population live in urban areas (EEA, 2006; EEA, 2010b). Urban areas are the places in Europe where most people will be vulnerable to the effects of climate change. At the same time cities are Europe's economic centres. Innovation and major economic assets are concentrated here (EC, 2009a). Urban areas adapted to climate change are key for Europe's future. The large and growing size of the urban population, cities' economic assets and the complexity of city systems to provide and manage energy, water, waste, food and other services make urban areas highly vulnerable to both current climate variability and future climate change. Urban areas need focused attention across Europe and a specific approach. While urban adaptation to climate change at a first glance may seem to be purely a local governance issue, the strong connections between European cities and their surrounding regions, or countries, warrant a broader perspective.
  • 13.
    What is thisreport about and who should read it? Urban adaptation to climate change in Europe 11 Figure 1.1 Framework of the report Climate change exposure – Temperature – Precipitation – Sea level Sensitivity of cities to – Heat – Flooding – Water scarcity Potential climate change impacts on cities Possible adaptation measures reducing the sensitivity Chapter 2 — Climate change challenges Chapter 3 — Planning urban adaptation Chapter 4 — Multi-level governance Adaptive capacity of cities to cope with the impacts and reduce the vulnerability Planning urban adaptation and success factors Multi-level governance action to facilitate and implement adaptation Focus and target audience of this report From a European perspective, this report informs about the key challenges that climate change poses to cities and the need for urban adaptation. It positions the urban challenges in the larger policy frameworks provided by regional, national and European institutions and it gives a summary overview of opportunities for solutions. As such, the report addresses stakeholders involved in urban development at local and city level as well as at regional, national and European level. It aims to support policy development and decision-making across all these levels. This report takes key policy questions for specific climate-related problems, which are common for groups of cities, as the starting point of the assessment. It presents: • the most important potential impacts of climate change on cities in Europe: it characterises cities interms of their vulnerability or adaptive capacity to climate change due to factors such as geographic position, urban design, size, wealth or governance system; • a range of adaptation responses for different spatial levels; • the challenges and opportunities for multi-level governance in the relevant policy frameworks. Because of its question-guided approach, the report does not provide a comprehensive scientific assessment of all possible potential climate change impacts and associated adaptation options across all European urban areas. It synthesises existing data and research results around selected key climate challenges for cities and focuses at providing the information needed by European and national and to some extent by regional and local decision-makers to decrease the vulnerability of cities across Europe in a multi-level policy framework (Figure 1.1).
  • 14.
    What is thisreport about and who should read it? 12 Urban adaptation to climate change in Europe Box 1.2 Examples of what stakeholders can expect from the report Stakeholders in all governments, communities and networks, the private sector and research: • support towards a better understanding of their own position and role in the overall European context in enabling urban adaptation to climate change, such as developing coherent policies towards adaptation, implementing effective adaptation or closing research and information gaps; • an overview of the differences and similarities between cities and regions encouraging mutual learning; • a cross-sectoral and multi-level perspective that encourages 'out‑of‑the‑box' thinking, challenges creativity and reveals the many cross‑benefits of good adaptation. European and national level stakeholders: • information to create awareness about urban vulnerability to climate change and the awareness that several types of impacts as well as solutions depend on action at national and European level; • information on the opportunities to mainstream urban adaptation into the different European and national policy areas in order to identify potentially adverse impacts and opportunities, overcome barriers and thus enable effective local adaptation; • information on European patterns of urban vulnerability as input into the development of more targeted funding programmes, such as the EU's structural funds and for research. City and regional governments: • in a European context, provide information to raise awareness of future climate change challenges for urban areas and their related regions and potential options for adaptation action; • the ability to start comparing one's vulnerability and response options with other cities, exploring the reasons behind and ways to reduce this vulnerability; • an understandable methodological framework, facilitating the transition between awareness of cities' climate challenges and the development of targeted adaptation actions; • a suggestion about the potential and benefits of active participation of local governments in a multi-level governance approach and in the development and implementation of the 2013 EU adaptation strategy and national strategies; • the report does not provide guidance for detailed local adaptation planning due to the high number and diversity of local situations and the report's focus on the European perspective of the urban challenges. Building on earlier efforts in support of the 2013 EU adaptation strategy This report builds on a number of other reports such as the Committee of the Regions' study Adaptation to Climate Change (CoR, 2011a), the handbook Climate-friendly Cities (VÁTI, 2011), the scoping study Urban Regions — Vulnerabilities, Vulnerability Assessments by Indicators and Adaptation Options for Climate Change Impacts (Schauser et al., 2010), a variety of local studies and initiatives such as the Resilient Cities conferences. It provides a European overview of the challenges and opportunities of urban adaptation to climate change and links them with these other initiatives that provide more detailed information on local climate change impacts, and good practice guidance. As such it facilitates the debate on European and national support for urban adaptation, feeds into the European Climate Adaptation Platform Climate‑ADAPT, and supports an effective participation of local governments in the development and implementation of the 2013 EU adaptation strategy (EC, 2009b) by providing supportive information.
  • 15.
    13 Climate changechallenges and response options Urban adaptation to climate change in Europe 2 Climate change challenges and response options Weather and climate strongly influence human life in cities. While exposure to weather and climate is important in the present climate, climate change may exacerbate or ameliorate any potential exposure and subsequent impacts. Cities and towns, just as the rest of Europe, will be affected by the impacts of climate change. Current observations of change are well in line with projections of the average climate change (Van Engelen et al., 2008), which suggest: • an increase of the annual mean temperature across Europe between 2 and 5 °C by the end of this century, relative to the present-day climate; • a change of precipitation patterns with drier summer conditions in the Mediterranean area and wetter winter conditions in Northern Europe; • a rise of the sea level (Christensen et al., 2007; Van der Linden and Mitchell, 2009; Greiving et al., 2011). Apart from the changes in average climate, the number, intensity and duration of heatwaves, extreme precipitation events and drought is expected to increase (Barriopedro et al., 2011; Giorgi et al., 2011; Hoerling et al., 2012). Climate change and its impacts will not appear uniformly in Europe. Different regions will experience varying intensities of change. Map 2.1 identifies five European regions facing similar climate change issues. It is based on a cluster analysis of eight climate change variables which were calculated on the basis of a comparison of 1961–1990 and 2071–2100 climate projections from the IPCC SRES scenario A1B (3) scenario (Greiving et al., 2011). The map illustrates that (3) SRES refers to the scenarios described in the IPCC Special Report on Emissions Scenarios (IPCC, 2000). The SRES scenarios are grouped into four scenario families (A1, A2, B1 and B2) that explore alternative development pathways (see further explanation in the glossary). different regions can have similar climate change characteristics, and that in one EU Member State, its regions can have very different climate characteristics. Those working on climate change adaptation in some regions may find regions with similar climate challenges in other countries rather than within their own. While urban areas will generally experience the same exposures to climate as their surrounding region, the urban setting — its form and socio‑economic activity — can alter exposures as well as impacts at the local scale. Built-up areas in the cities create unique microclimates due to the replacement of natural vegetation with artificial surfaces. This affects air temperature, wind direction and precipitation patterns, amongst others. Climate change will affect all of these components, exacerbating some of them and lessening others. Beyond direct climate change impacts, such as health problems due to heat or damages to buildings and infrastructure due to flooding, the indirect impacts on cities can be much broader. In a world where every city and every region is connected in a multitude of ways to other cities and regions, the failure of one strand of this complex web will create a knock-on effect. Floods can destroy homes, business sites and infrastructure as well as contributing indirectly to loss of jobs and income sources, for example. People and businesses will be cut off from vital services such as energy, transport and clean water. Heatwaves can compromise public health, reduce the ability to work and result in lower productivity thus shortening or delaying the delivery of products and services to clients in the city and elsewhere. They can reduce the use of public spaces and thus constrain social life. High temperatures can put infrastructure at risk — deformed roads and rail tracks can hamper the supply of goods and commuters or, in particular in
  • 16.
    Climate change challengesand response options 14 Urban adaptation to climate change in Europe Cluster/stimuli Northern-central Europe Northern– western Europe Northern Europe Southern– central Europe Mediterranean Europe Change in annual mean temperature + + ++ ++ ++ Decrease in number of frost days –– – –– –– – Change in annual mean number of summer days + + 0 ++ ++ Relative change in annual mean precipitation in winter months + + ++ 0 – Relative change in annual mean precipitation in summer months – – 0 –– –– Change in annual mean number of days with heavy rainfall 0 + + 0 – Relative change in annual mean evaporation + 0 + 0 – Change in annual mean number of days with snow cover CDSC – 0 –– 0 0 Map 2.1 European regions clustered according to projected climate changes Note: Key: ++ Strong increase; + Increase; 0 Insignificant stimulus for the characterisation of the cluster; – Decrease; –– Strong decrease. The map is based on a cluster analysis and represents aggregated data. Therefore in some areas a specific climate factor might point in a different or even opposite direction than indicated in the cluster. Source: Greiving et al., 2011; © ESPON, 2013. EUROPEAN UNION Origin of data: own calculation based on Lautenschlager et al. 2009 Part-financed by the european Regional Development fund INVESTING IN YOUR FUTURE European climate change regions This map does not necessarily reflect the opinion of the ESPON Monitoring Committee Canarias Guadeloupe Martinique Réunion Guyane Madeira Acores
  • 17.
    Climate change challengesand response options Urban adaptation to climate change in Europe 15 Box 2.1 Reducing cities' dependency on external services Cities are highly dependent on vulnerable external services but can strategically plan to ensure service provision under future climate conditions. Firstly, they can take action to reduce supply system vulnerability e.g. by locating power and communication lines underground or creating multiple supply lines. This approach involves measures going beyond city boundaries requiring cooperation, coordination, lobbying and policy agreements on a regional, national and sometimes European level (see Section 3.2) (OECD, 2010). Secondly, cities can take measures to become more independent of external services and can prepare for something as extreme as a system failure (CAP, 2007). This requires action at all levels. It can include measures to reduce energy demand or to generate energy locally, e.g. building of passive houses (ultra-low energy houses), solar panels on roofs and promotion of district cooling and heating systems. Municipalities can relocate vulnerable urban transport infrastructure and make it climate-proof, improve water use efficiency, reduce losses from the water supply systems and build local water storage facilities and other back-up systems (CAP, 2007). Green infrastructure approaches can consider the capture and use of rainwater as well as recharging groundwater through rain and grey water infiltration. Interconnection between regional water and energy supply systems can serve as a back-up, reducing the likelihood of a failure. Measures towards greater independence may well be considered on a metropolitan or regional scale instead of at a uniquely city level (VÁTI, 2011; CoR, 2011a; CAP, 2007; Greater London Authority, 2010). combination with droughts, power stations might not get sufficient cooling water and thus fail to deliver energy. Potential drops in the production of food, goods and services outside the cities will constrain services in the cities. Water scarcity places cities into a water competition with other sectors such as agriculture and tourism and poses higher economic pressures on the city or individuals to access sufficient water thereby challenging social equity. These indirect impacts challenge in a much broader way the economy and quality of life in cities and in Europe as a whole (response options in Box 2.1). While these indirect impacts are extremely important their analysis is complex and requires different data as well as analysis above and beyond that usually used for climate change vulnerability assessments. This goes beyond the scope of this report which concentrates, as an initial step, on more direct climate change impacts and vulnerabilities in cities. Sections 2.1–2.3 focus on a selection of climate challenges which are of particular relevance for urban areas: • heat; • flooding; • water scarcity and droughts. Although a large number of subjects with an urban component, such as storms, forest fires, landslides and erosion, can be defined, this selection is intended to illustrate why and how the specific urban context comes into play when considering climate change issues in cities and towns. The assessment of these direct impacts can then serve as the input to future broader assessments of the secondary and tertiary effects on the economy, social equity and quality of life in cities and in Europe as a whole. In this report, the assessment builds on European climate change projections and relates them to several key indicators of cities' sensitivity related to urban design and socio-economic structure. The assessment follows, in general, the scheme in Figure 2.1. However, quantitative, Europe-wide data for cities are scarce and do not allow for a fully-fledged assessment. The report considers up to 576 cities with more than 100 000 inhabitants and in a few cases below that population number. For these larger cities, data were available in the urban audit database (Eurostat, 2012) although this is not complete for every indicator. The analysis of potential climate change impacts is therefore rather descriptive as it uses additional qualitative information and illustrative examples. Photo: © Ian Britton
  • 18.
    Climate change challengesand response options 16 Urban adaptation to climate change in Europe Climate change exposure – Temperature – Precipitation – Sea level Sensitivity of cities to – Heat – Flooding – Water scarcity Potential climate change impacts on cities Possible adaptation measures reducing the sensitivity Chapter 2 — Climate change challenges Chapter 3 — Planning urban adaptation Chapter 4 — Multi-level governance Adaptive capacity of cities to cope with the impacts and reduce the vulnerability Planning urban adaptation and success factors Multi-level governance action to facilitate and implement adaptation Figure 2.1 Placing Chapter 2 within the framework of the report Box 2.2 Classification of adaptation options as applied in the report Adaptation options can be categorised in different ways. This report builds on the classifications used in the EU's White Paper on adapting to climate change (EC, 2009b): • 'Grey' infrastructure approaches correspond to 'physical interventions or construction measures and using engineering services to make buildings and infrastructure essential for the social and economic well-being of society more capable of withstanding extreme events.' • 'Green' infrastructure approaches contribute to the increase of ecosystems resilience and can halt biodiversity loss, degradation of ecosystem and restore water cycles. At the same time, green infrastructure uses the functions and services provided by the ecosystems to achieve a more cost effective and sometimes more feasible adaptation solution than grey infrastructure. • 'Soft' approaches correspond to 'design and application of policies and procedures and employing, inter alia, land-use controls, information dissemination and economic incentives to reduce vulnerability, encourage adaptive behaviour or avoid maladaptations. They require careful management of the underlying human systems'. Some of these measures can facilitate the implementation of grey or green measures (e.g. funding, integration of climate change into regulations). Many types of soft measures are particularly relevant when uncertainties about the expected changes are large, since they enhance the adaptive capacity (UNECE, 2009). Measures in general can be of a preventive character and improve resilience yet they can also offer preparative support when dealing with the anticipated effects of climate change and extreme events. They can also provide responses to direct effects or aim to assist in the recovery of economic, societal and natural systems following an extreme event (UNECE, 2009).
  • 19.
    Climate change challengesand response options Urban adaptation to climate change in Europe 17 Further reading • EEA, JRC and WHO, 2008, Impacts of Europe's changing climate: 2008 indicator-based assessment, EEA Report No 4/2008, European Environment Agency (http://www.eea.europa.eu/publications/eea_ report_2008_4). • IPCC, 2007, Climate change 2007: Synthesis report. Contribution of Working Groups I, II and III to the Fourth Assessment Report of the Intergovernmental Panel on Climate Change, Cambridge University Press, Cambridge, United Kingdom (http://www.ipcc.ch/pdf/assessment-report/ar4/syr/ar4_syr.pdf). Finally, Chapter 2 lists a range of possible adaptation measures per climate challenge. The options presented do not pretend to be comprehensive since the most appropriate solutions are tailor-made to account for local urban characteristics, which are very different for different regions in Europe. Chapter 3 provides, in addition, an overview of generic ways to increase resilience to climate change. There are a number of ways to adapt to climate variability and change and various methods to then classify them. This report follows the EU's White Paper 'Adapting to climate change' classification, distinguishing between 'grey' and 'green' infrastructure and 'soft' approaches (see Box 2.2). Other classifications relate to the options for response in terms of their timing in view of prevention, preparation and response choices (EC, 2009b; UNECE, 2009).
  • 20.
    Climate change challengesand response options 18 Urban adaptation to climate change in Europe Key messages • In Europe, of those natural disasters occurring in recent decades, heatwaves have caused the most human fatalities. During the summer of 2003 the heatwave in Central and Western Europe was estimated to have caused up to 70 000 excess deaths over a four-month period. • It is highly likely that the length, frequency and/or intensity of heatwaves will increase. • Present day design of many cities with few green urban areas but many artificial surfaces aggravates the impact of heatwaves within cities, in particular by increasing night-time temperatures. • Based on the indicators used in this chapter, there are larger numbers of sensitive cities across Europe, with the exception of northern Europe and parts of eastern Europe. A large build-up of heat in Southern and Eastern Europe and its northward shift in the future will have a huge impact on many cities in Europe. • Local city characteristics tend to be highly important in terms of sensitivity to heat. The results suggest that cities designed in such a way that makes them susceptible to heat are not unique to one particular region. There are sensitive cities in high heat regions which need specific consideration but there are also northern European cities which need consideration. • City governments have a range of options at their disposal to be better prepared for future heat conditions, including 'grey', 'green' and variety of 'soft' solutions. Box 2.3 Recent major heatwaves in Europe The summer 2003 European heatwave caused up to 70 000 excess deaths over four months in Central and Western Europe (Brücker, 2005; Robine et al., 2008; Sardon, 2007). It struck the elderly disproportionately hard: the daily mortality rate of the population over 65 years old rose by 36 % in Barcelona, 44 % in London and 105 % in Paris. Moreover the impact of heat on the daily mortality rate clearly increased with age (D'Ippoliti et al., 2010). Note that on specific days and for specific age and gender groups the daily mortality rates may rise far beyond these numbers, with excess mortality rates up to a factor of three and more (see, e.g. Hémon and Jougla, 2004). The intense heatwave in Eastern Europe in the year 2010 led to an estimated death toll of 55 000 (Barriopedro et al., 2011). The EuroHeat project analysed the cities of Athens, Barcelona, Budapest, London, Milan, Munich, Paris, Rome and Valencia. The study estimated that during the consecutive summer months of June to August for the period 1990–2004 mortality rates increased when heatwaves occurred. The increase ranged from 7.6 % to 33.6 % depending on the city in question (D'Ippoliti et al., 2010). (4) There is no generally accepted definition of 'heatwave' with the definition differing per country (WHO, 2004) and even per sector. In general, a heatwave is a prolonged period of unusually hot weather. 'Unusually hot' obviously depends on the background climate. 2.1 Heat 2.1.1 Why are heatwaves an important urban challenge? In Europe, of those natural disasters occurring in recent decades, heatwaves (4) have caused the most human fatalities (EEA, 2010c). The European heatwave during the summer of 2003 was estimated to have caused up to 70 000 excess deaths during a four month period in Central and Western Europe (Brücker, 2005; Robine et al., 2008; Sardon, 2007) (see also Box 2.3). This heatwave demonstrated that this issue was not unique to southern Europe. Cities Photo: © iStockphoto
  • 21.
    Climate change challengesand response options Urban adaptation to climate change in Europe 19 Box 2.4 Heatwaves a problem for the south… While preparing their local adaptation strategy the town of Cascais in Portugal studied the potential adverse health impacts of climate change in the municipality. The results show that an increase of 1 °C above the threshold of 30 °C led to a 4.7 % increase of the risk of mortality. Since all future climate scenarios for Cascais indicate significant increases in days with temperatures above this threshold, the risk of dying from heat stress will rise. Cascais is now implementing a number of adaptation measures. One project, called the 'Local Green Structure', restructures and links several ecological corridors, such as gardens, valleys and streams, both in natural and urban areas. This structure shall, at the same time, protect and restore local biodiversity and reduce vulnerability to floods. A special contingency plan uses socio-demographic variables to map sensitive groups in the municipality, e.g. elderly people, people with chronic diseases, children. In the event of an alert for a heatwave, local hospitals, health centres and civil protection services will be called out to support those identified as vulnerable. Source: Casimiro et al., 2010; http://www.siam.fc.ul.pt/PECAC. … as well as the north One would be surprised to learn that heatwaves are considered to be one of the biggest threats to public health connected to climate change in Sweden. Researchers at the University of Umeå in Sweden have found that death rates rose significantly when the average temperature stayed over 22–23 °C for more than two consecutive days. During July 2010, the mean temperature stayed above 22 °C for nearly two weeks in most parts of Sweden including in Botkyrka in the Stockholm region. Botkyrka was the only Swedish municipality that was prepared for heatwaves. Researchers, in conjunction with the municipality, had been collaborating on mapping risks and the vulnerable. With the help of Geographic Information Systems (GIS) and using national registers and local information, levels of risk and preparedness emerged during the project period of 2008–2010. One fourth of the population was deemed to be vulnerable. In March 2010, a workshop on heatwaves and health was arranged for all middle management working in the social care department of Botkyrka and those involved with responding to emergencies and representatives from central office. The social care department then distributed advice and instructions on dealing with heatwaves for all relevant municipal services. As a result people that were assisted by the municipal care sector were better prepared in Botkyrka during the 2010 heatwave. Advice is now published on the municipality's homepage and was personally communicated to people in care homes (see Box 2.8). Nevertheless, awareness still needs to be raised for the general public. Furthermore, a map marking public 'cool spaces' is in production. The project concluded that municipalities have to be more aware and take precautions within the administration as a whole. City planning, risk management, the care sector and city leaders will have to take the threat of heatwaves into consideration on a more active basis in the future. Source: Ingrid Molander, Botkyrka municipality, Christofer Åström and Joacim Rocklöv, Umeå University, personal communication, 2011; http://www.botkyrka.se/Nyheter/Sidor/Värmebölja-.aspx. Photo: © Stelosa worse affected were those where heatwave episodes had traditionally been rare or where temperatures strongly exceeded the usual seasonal conditions (D'Ippoliti et al., 2010) such as in Belgium, Germany, the Netherlands, Switzerland and, the United Kingdom. The example of Botkyrka, Sweden shows the combination of a low heatwave threshold for northern European countries and how the sensitivity can be reduced by raising awareness, changing behaviour and appropriate building design (Box 2.4).
  • 22.
    Climate change challengesand response options 20 Urban adaptation to climate change in Europe (5) Whether or not citizens feel comfortable with the urban micro climate they encounter depends on a complex interaction between physical, physiological, behavioural and psychological factors. Apart from the physical and biological factors perception plays an important role. Athens 32.7 Ljubljana 21.5 Rome 30.3 Barcelona 22.4 London 23.9 Stockholm 21.7 Budapest 22.8 Milan 31.8 Turin 27.0 Dublin 23.9 Paris 24.1 Valencia 28.2 Helsinki 23.6 Prague 22.0 Zurich 21.8 Note: An increase in mortality rates was reported when temperatures passed this threshold. City-specific estimates of the relevant parameters were obtained from the period 1990–2004. Source: Baccini et al., 2008. Table 2.1 City specific temperature threshold (°C) — index describing the relative discomfort due to combined heat and high humidity Heatwaves and human health An increase in the mortality rate is the most dramatic impact of heatwaves. Exposure to hot weather can also have other negative impacts on human health and well-being. Humans depend on the body's capability to maintain internal temperature at around 37 °C. The principle mechanisms to prevent thermal stress are sweat production, increased cardiac output and redirection of blood flow to the skin (Hajat et al., 2010). Diminished or delayed physiological responses cause people to be extra sensitive to heat exposure. In particular the elderly, young children and those using certain medication are sensitive to heat (Kovats and Shakoor Hajat, 2008) as well as pregnant women. In addition, socio-economic and behavioural factors enhance sensitivity to heat at the community level. Such factors include gender, social isolation, homelessness, lack of mobility, alcohol use, being dressed inappropriately, intensive outdoor labour and low income or poverty (Kovats and Hajat, 2008; Hajat et al., 2010; Wilhelmi and Hayden, 2010). In many cases, in particular in cities, a number of these factors act together. For example in low income groups people are more likely to be obese and have inadequate housing (Kovats and Hajat, 2008; Reid et al., 2009). Elderly people are more likely to be socially isolated, to be less mobile and to suffer from chronic disease while also having reduced physiological responses (Luber and McGeehin, 2008; Martens, 1998; Hajat and Kosatky, 2009). People can, nevertheless, acclimatise to heat to a certain extent. Initial physiological acclimatisation is fairly fast and may occur after several days through increased sweating (Martens, 1998; Haines et al., 2006). However, even with more comprehensive and long term acclimatisation and change of habits, temperature and humidity above certain local and individual thresholds can place stress on people with health implications. Since geographic location and average temperature are closely linked, mortality related to heat seems to be linked with geographic position (Keatinge et al., 2000; Baccini et al., 2008; Martiello and Giacchi, 2010). The comfort temperature (5) or heat thresholds at which the mortality rate is minimal, is associated with the average temperature that communities experience (Martens, 1998) and is indeed higher in areas closer to the equator (Baccini et al., 2008; Hajat and Kosatky, 2009). This is also generally shown in Table 2.1, where the comfort temperatures of a number of European cities are compared. However, there is no clear relation between geographic location and the rate of increase of mortality once the comfort temperature is exceeded. Reasons could include the proportion of elderly residents, the gross domestic product, population density and behaviour. High temperatures during the night play a decisive role for the serious health effects during heatwaves. Hot days without the relief of cool nights and subsequent exhaustion increase the effects (Grize et al., 2005; Kovats and Hajat, 2008; Dousset et al., 2011).
  • 23.
    Climate change challengesand response options Urban adaptation to climate change in Europe 21 Meteorological factors Morphological factors Human factors aggravating heat impacts Radiation Temperature Wind speed Geographical location and topography Vegetation and water areas High building mass Presence of impervious cover Structure that hinders ventilation Urbanisation with a high share of built-up land and impervious areas Population density Little shadowing Insufficient building insulation Additional heat production due to production processes, transport, heating etc. Table 2.2 Factors determining the strength of the urban heat island effect (UHI) and its impacts Beyond the direct health impacts of thermal stress, other potential effects of heat on health, socio‑economic and environmental impacts include: • impacts on well-being (psychological impacts, increased violence and social unrest); • impacts on water resources (water pollution caused by a combination of low water flow and heat; water shortages; changes in patterns of vector-borne diseases); • impacts on economy and infrastructure (reduced productivity of workers in conditions of extreme heat; increased hospital admissions and pressure on care services in summer; increased failure of transport networks in summer, but less in winter; increased demand for cooling in summer, but decreased demand for heating in winter; Failure of power supplies (Wilby, 2008; Schauser et al., 2010; EEA et al., 2008; Oke, 1982); • changes in patterns of vector-borne diseases. The Urban Heat Island effect The impact of heatwaves is particularly strong in cities and towns. The so-called 'Urban Heat Island' (UHI) describes the increased temperature of the urban air compared to its rural surroundings. The temperature difference can be up to 10 °C or more (Oke, 1982). The difference is particularly stark at night. Even relatively small towns can experience a considerable UHI (Steeneveld et al., 2011). Factors determining the strength of the UHI are summarised in Table 2.2. Urbanisation and human activities essentially alter the balance between the energy from the sun absorbed by the surface, then stored in the building mass and later released to the surrounding air. Most notably, the cooling effect of vegetated surfaces is replaced by the storage of heat in surfaces such as concrete, asphalt and stone. The effect of this alteration is clearly visible in Map 2.2, which reveals much higher surface temperatures in areas of Budapest with a higher degree of soil sealing. Thus, the intensity of heatwaves in towns and cities is influenced by the urban fabric and design (Oke, 1982; Arnfield, 2003; Wilhelmi et al., 2004). Since the urban fabric shows large amounts of variation the intensity of the UHI would reflect this. This can cause spatial variations of heat effects within cities as well as between cities (Smargiassi et al., 2009; Heusinkveld et al., 2010; Dousset et al., 2011; Knight et al., 2010). The hottest parts in cities and towns are generally those with numerous tall buildings, without green spaces and including areas generating large amounts of anthropogenic heat (EEA et al., 2008). Wind plays a special role in the interaction between the urban fabric and weather, not only because reduced wind speed generally increases UHI strength (Oke, 1987; Wilby, 2008), but also because so-called 'wind-paths' may offer opportunities to ventilate cities. Streets, oriented in the same direction as wind flow, tend to channel the air into
  • 24.
    Climate change challengesand response options 22 Urban adaptation to climate change in Europe jets called urban wind canyons. During calm and clear nights associated with a strong UHI level, air rises over the city and induces a horizontal flow of air from the rural environment into the city (Oke, 1987; Kuttler, 2008) (see the Stuttgart example in Box 2.5). Map 2.2 Degree of soil sealing (left) and observed surface temperature (right) in Budapest, Hungary 0 30 50 80 100 Degree of soil sealing (%) Degree of soil sealing (impermeability) of Budapest 15 16 19 22 25 28 31 34 35 36 37 40 43 45 Temperature (°C) Surface temperature of Budapest, 1 August 2005, 9:30 CET 0 5 10 Km Note: The lower surface temperature in areas with urban green and water can clearly be seen. Although surface temperature does not equal air temperature, surface temperature is often used to detect the UHI, in the form of the so-called surface UHI. Source: EEA, 2010b; Ongjerth et al., 2007; Gábor et al., 2008. Climate change essentially increases the number of hot days by a similar amount for both urban and rural situations. However, the number of additional hot nights is larger in cities than in the countryside. Urban areas store more heat during the day than greener rural areas and release this heat during the night.
  • 25.
    Climate change challengesand response options Urban adaptation to climate change in Europe 23 Box 2.5 Stuttgart managing urban heat island effects Stuttgart's climate planning strategy is an excellent example of urban heat island management. The city of Stuttgart has been designed to not only respect and protect nature, but to exploit how natural wind patterns and dense vegetation can actively help the city to reduce its problems of overheating and air pollution. At night cool air sweeps down from the surrounding hills and runs through a series of 'ventilation-corridors' which have been kept open as wide, tree-flanked arteries within the city's street infrastructure. Map 2.3 Climate analysis map for the Stuttgart region, also showing so-called ventilation paths along with other climate related features Areas of cold air Areas of production of cold air Areas of collection of cold air Barrier for the flow of cold air Air exchange Mountain/valley wind system Downhill flow of cool air Clean air ventilation corridor Polluted air ventilation corridor Source: Baumüller and Verband Region Stuttgart, 2008; Klimaatlas Region Stuttgart; http://www.stadtklima-stuttgart.de/ index.php?klima_klimaatlas_region.
  • 26.
    Climate change challengesand response options 24 Urban adaptation to climate change in Europe 2.1.2 What are the potential impacts of heat on Europe's cities? Future exposure to heat in European cities Europe has seen an increase in temperature of 0.3 °C per decade since the 1970s and has experienced an increase in the number of heat incidents in the past two decades (Klein Tank and Können, 2003). At least two summers in the last decade (2003 and 2010) have in all likelihood been the warmest of the last 500 years in Europe (Barriopedro et al., 2011). Climate change scenarios indicate that there will be an increasing probability of mega heatwaves (prolonged heatwaves over large areas such as those observed in 2003 and 2010) over highly populated areas of Europe (Barriopedro et al., 2011). It is very likely that the length, frequency and/or intensity of warm spells, or heatwaves, will increase (Fischer and Schär, 2010; IPCC, 2012). Southern Europe in particular is affected by hot summer days and tropical nights. Projections in Map 2.4 indicate an increase in the number of combined tropical nights and hot days in the future and also a clear northward expansion of the affected regions (Fischer and Schär, 2010). Temperature extremes as well as the duration of heatwaves Increase in the number of combined tropical nights (minimum temperature exceeding 20 °C) and hot days (maximum temperature exceeding 35 °C) under present and future climate conditions 2 6 10 14 18 22 26 30 34 38 42 46 50 ENS MEAN 1961–1990 ENS MEAN 2021–2050 ENS MEAN 2071–2100 °C Map 2.4 Increase in the number of combined tropical nights (minimum temperature exceeding 20 °C) and hot days (maximum temperature exceeding 35 °C) under present and future climate conditions Source: Fischer and Schär, 2010. are expected to increase further (Sterl et al., 2008; Barriopedro et al., 2011). The exceptional summer of 2003 may be viewed as normal in the mid-21st century (Fischer and Schär, 2010; Schär et al., 2004). Cities' sensitivity to heat The scenario above notes the increase in regional heatwave days. However, it does not take into account the impact on the urban fabric and the resulting exacerbated heatwave effect in cities. The scenario underestimates in particular the number of tropical nights in cities, which are decisive for health impacts. Map 2.5 provides a first assessment of the possible future heat impacts on European cities. Here the scenario map for the period 2071–2100 is overlaid with population density and the percentage share of green and blue areas in major European cities. Both provide a proxy to the urban heat island effect. Population density is associated with variables such as building density, green/blue area share and anthropogenic heat production (Steeneveld et al., 2011). The influence of green and blue urban areas has been explained in Section 2.1.1.
  • 27.
    Climate change challengesand response options Urban adaptation to climate change in Europe 25 The map indicates a large number of cities with large UHI potential in the north-west due to low shares of green and blue urban areas and in particular south-eastern of Europe where, in addition, population densities are higher. In the western part of the Mediterranean area, the UHI potential seems to be quite variable, with a mix of cities with both strong and weak UHI potential. Comparing expected heat exposure changes with the UHI potential reveals that a large share of cities in eastern and southern Europe will experience relatively strong increases in heat load in the future. If the heatwave intensity expands more to the north‑west than expected from the results shown 40° 50° 60° 30° 30° 20° 20° 10° 10° 0° -30° -20° -10° 0° 60° 60° 50° 50° 40° 40° 0 500 1000 1500 km Heat waves — both a low share of green and blue urban areas and high population densities contribute potentially to the urban heat island in cities 20 20–29 30–39 40 Green/blue areas per city (UMZ), 2006 (%) Population density per city (UMZ), 2004 (inh./km2) 3 000 3 000–4 000 4 000–5 000 5 000–10 000 10 000 Number of combined tropical nights ( 20 °C) and hot days ( 35 °C), 2070–2100 2 10 18 26 34 38 42 50 Map 2.5 Heatwaves — both a low share of green and blue urban areas and high population densities can contribute to the urban heat island effect in cities Note: The background map presents the projection for the period 2071-2100. Values for the earlier periods are presented in Map 2.4. City data for Bulgaria and Ireland are from 2001; the concept of city is defined uniquely by the urban land-use areas within its administrative boundary. Source: Eurostat, Urban Audit database, 2004; EEA Urban Atlas, 2006. here (see other indicators used by Fischer and Schär, 2010), cities in the Benelux countries and the United Kingdom would also be more affected. These results suggest that those cities physically sensitive to heat impacts do not cluster in one region only. There are indeed highly sensitive cities in regions with an expected high heat load which need specific consideration but northern cities are also sensitive and deserve consideration. At the same time some cities in southern Europe seem to be less physically sensitive than others. Local city characteristics tend to be more important than similar regional characteristics. The share of cities in a country which has relatively little green and blue
  • 28.
    Climate change challengesand response options 26 Urban adaptation to climate change in Europe areas is particularly high in Hungary and Greece as well as Cyprus, Estonia, Ireland, Luxemburg and Slovakia (Figure 2.2). Population density and the share of green/blue urban areas provide a reasonable initial estimate for UHI at the city level and can also serve as a European overview on potential hotspots. For more complex city planning it is clearly too simplistic. Additional factors and variations with the city need to be taken into account. Regarding the cities' 0 20 40 60 80 100 Hungary Greece Cyprus Estonia Ireland Luxembourg Slovakia France United Kingdom Germany Italy Czech Republic Spain Bulgaria Romania Netherlands Denmark Austria Belgium Malta Slovenia Poland Lithuania Portugal Finland Latvia Sweden Percentage of cities in the country per class Share of green and blue areas of the city area 20 % 20–29 % 30–39 % = 40 % % Figure 2.2 Percentage of green and blue urban areas — share of cities per class per country (based on Map 2.5) Note: Generally, only cities with more than 100 000 inhabitants are considered. sensitivity to heat not only is the share of green and blue areas important, but also their distribution, green facades and roofs as well as shadowing and ventilation. Climate analysis of the city of Arnhem in the Netherlands shows such an example (Map 2.6). The map clearly shows the variability of the risk related to heat in the city with red areas indicating the warmest city parts. The potential for ventilation (marked in black) is related to natural air flow along rivers and on downwards trajectories.
  • 29.
    Climate change challengesand response options Urban adaptation to climate change in Europe 27 Map 2.6 Urban climate analysis map for the city of Arnhem, the Netherlands Source: www.future-cities.eu. Social sensitivity The majority of people in Europe live in urban areas and high population densities are already present in European cities. The number of urban dwellers will further increase in the near future (UN, 2010). As explained previously, some population groups are more sensitive to heat than others. Of special importance in terms of sensitivity to heat are senior citizens aged 65 years and over. This population group currently constitutes about 17.1 % of the total population of Europe, but this share is expected to rise to 30 % by the year 2060. The share of people aged 80 years or older (4.4 % in 2008) will nearly triple by 2060 (Schauser et al., 2010; Eurostat, 2008). This demographic trend will naturally bring increased heat-related mortality rates even without climate change if no adaptation measures are taken. However, demographic development in cities does not necessarily follow regional trends. There are at present no European wide demographic projections available at the city level. Bearing in mind the many uncertainties sketched above, Map 2.7 and Figure 2.3 provide a first impression of European wide differences regarding the social sensitivity of cities to heat. The map shows the total population in 2004 and the share of elderly people as a proportion of population within the major European cities in Europe. The proportion of elderly people in cities is higher in countries in the area of Europe stretching from Italy to Germany and in northern Spain. In Belgium and Germany this proportion usually follows the country average. Cities in northern Italy, meanwhile, tend to have values above the country average. For other countries such as Bulgaria, France, Romania, southern Spain and the United Kingdom the share of elderly people in most cities is lower than in rural areas. The composition regarding age is not the only factor that determines social sensitivity. Those on low incomes, the disabled and sick, young children and ethnic minorities are classified as vulnerable Urban climatic analysis map of Arnhem city Fresh air area Cool air area Mixed climate Overheating Overheating 2 Overheating 3 UMC classification Ventilation High potential Low potential Background winds Thermal induced circulations Turbulances abcd Subclassifications Administrative border Mainroads Railways d d d b c b b b a b a
  • 30.
    Climate change challengesand response options 28 Urban adaptation to climate change in Europe Map 2.7 Vulnerable people — the elderly are considered to be a group more sensitive to various climatic stress factors than people of a working age Note: Total population in cities; proportion of population aged ≥ 65. Data for Bulgaria, Cyprus, Czech Republic, Finland, France, Ireland and Latvia are from 2001. Source: Eurostat, Urban Audit database, 2004. 50° 60° 70° 40° 40° 30° 30° 20° 20° 10° 10° 0° -30° -20° -10° 0° 60° 50° 50° 40° 40° 0 500 1000 1500 km Vulnerable people — the elderly are considered to be a group more sensitive to various climatic stress factors than people of a working age Proportion of aged population 65 in cities/countries, 2004 Total population in cities, 2004 100 000 100 000–250 000 250 000–500 000 500 000–1 000 000 1 000 000 No data 14 14–15 15–17 20 17–20 Outside data coverage (Schauser et al., 2010). Further influences include such varied socio-economic characteristics as the quality of the health care system, availability of heat-health warning systems as well as cultural and behavioural aspects. Such factors are also intertwined with physical factors such as the quality of the buildings (thickness of walls, isolation, or availability of air‑conditioning), application of green structures in roofs and facades and accessibility of public green and blue spaces (Harlan et al., 2006; Uejio et al., 2011). Potential future impacts Climate change projections indicate a rise in the number of heat-related deaths. The PESETA study projected almost 86 000 additional deaths per year in 2071–2100 in the EU-27 Member States compared to the 1961–1990 EU-25 average — albeit under a much more severe climate change scenario (EEA et al., 2008). Koppe et al., 2004 project a rise by up to 20 % until the year 2050 in Germany and Dessai (2003) by 35 % to six fold in Lisbon, Portugal. These
  • 31.
    Climate change challengesand response options Urban adaptation to climate change in Europe 29 Figure 2.3 Percentage of population aged ≥ 65 — share of cities per class per country (based on Map 2.7) Note: Generally, only cities with more than 100 000 inhabitants are considered. 0 20 40 60 80 100 Germany Belgium Italy Slovenia Austria Estonia Sweden Spain Czech Republic Portugal Latvia United Kingdom Greece Hungary France Finland Netherlands Bulgaria Poland Cyprus Denmark Ireland Lithuania Luxembourg Romania Slovakia Percentage of cities in the country per class Share of population age 65 of total city population 20 % 18–20 % 16–17 % 14–15 % 14 % % deaths can be mainly expected in urban areas where the effects culminate. There are several intertwined trends — climatic and non-climatic — which make population in cities more vulnerable to climate change: global warming, increased urbanisation and population ageing. Besides the impacts on health, a number of socio‑economic and environmental impacts resulting from higher temperatures and heatwaves, such as problems in energy supply and maintaining transport services or water supply, will occur (Schauser et al., 2010). These can trigger additional socio-economic challenges in the form of lower productivity, failure of services, higher energy demand for cooling etc. There is currently not enough information available to assess these future impacts in cities across Europe. In addition, higher temperatures trigger certain air quality problems in cities. Part of the health effects and increased rate of mortality resulting from heatwaves may be caused by decreased air quality in the urban environment (Box 2.6).
  • 32.
    Climate change challengesand response options 30 Urban adaptation to climate change in Europe Box 2.6 Air quality problems due to higher temperatures Air pollution in urban areas not only places additional stress on humans, but some pollutants have synergies with heat (Nawrot et al., 2007). Hot weather exacerbates air pollution through increased formation of ground-level ozone and, because hot periods usually coincide with dry periods, more particulate matter remains in the air (EEA, 2010d). Evidence for a synergistic effect on the mortality rate due to high temperatures and ozone-levels is increasing (Bell et al., 2005; Medina-Ramón et al., 2006; Stedman et al., 1997). Hence, part of the health effects and increased mortality during heatwaves may therefore be caused by decreased air quality (Filleul et al., 2006). Previously, hot, dry summers with long-lasting periods of high air pressure over large parts of Europe led to elevated concentrations of ozone which exceeded the minimum threshold values for health risks. Analysis on a number of cities in the United Kingdom showed that between 21 to 38 % of those affected were not caused by heat, but by smog and particulate matter (Stedman, 2004). A study of a severe heatwave in Greece in 1987 showed that the effects in Athens were much stronger than in other, less polluted Greek cities (Katsouyanni, 1995)). Figure 2.4 shows a high percentage of the urban population affected by high ozone levels in 2003. This was a year when large parts of Europe were affected by a heatwave (EEA, 2011a; EEA, 2011b). Increasing temperatures and heatwaves in the future are expected to exacerbate the existing ozone problem. Forsberg et al., 2011 projects an increase of ozone-related deaths over the next 60 years in Europe, with 10 to 14 % increase being marked for Belgium, France, Portugal and Spain. Temperature is clearly not the only predictor of ground-level ozone concentrations. The main drivers are the concentrations of ozone precursors: NOX and volatile organic compounds (VOCs). NOX are emitted during fuel combustion for example by road transport and industrial facilities. VOC are emitted from a large number of sources including paint, road transport, refineries, dry-cleaning and other solvent uses. Biogenic VOC are emitted by vegetation, with amounts released dependent on temperature. Methane (CH4), also a VOC, is released from coal mining, natural gas extraction and distribution, landfills, wastewater, ruminants, rice cultivation and biomass burning (EEA, 2011b). Further reducing the emissions of ozone precursors is therefore an option to reducing periods with high ozone levels and adopting adaptation measures to more frequent heatwaves and warm weather periods in the future. NOX and VOC emissions also need to be reduced in order to protect the population against the resulting direct health impacts. Typical measures to improve air quality are therefore also supportive when coping with higher temperatures and heatwaves. These include the promotion of walking, cycling and the use of public transport; restrictions for road traffic; use of cleaner emission technology for transport, heating and cooling systems; creation of green areas, such as parks, can absorb and filter dust and other pollutants; and awareness raising and educating vulnerable groups to avoid certain activities during events of high air pollutant concentrations (CoR, 2011a; EEA, 2010b; VÁTI, 2011). 0 25 50 75 100 1997 1998 1999 2000 2001 2002 2003 2004 2005 2006 2007 2008 2009 % of urban population 0 days 0–25 days 25–50 days 50 days Figure 2.4 Percentage of the EU and EEA-32 urban population potentially exposed to ozone concentrations over the target value threshold set for protection of human health, 1997–2009 Source: EEA, 2011c (CSI 004).
  • 33.
    Climate change challengesand response options Urban adaptation to climate change in Europe 31 2.1.3 How can cities adapt to heat stress? The use of grey infrastructure — cooling for buildings and urban areas Due to the expected increase in the number of hot days and heatwaves, it is anticipated that demand for air conditioning will increase. However, an increase in the use of air conditioners produces additional heat outside buildings and generates more greenhouse gases. Therefore, passive measures to provide cool spaces should be considered first — building designs that keep rooms cool via insulation (thick and well-designed walls, small windows, double glazing and the correct choice of materials) or blinds and public space providing shade and natural ventilation. It is common that insulation measures are already considered as ways to reduce energy consumption and mitigate climate change. Integrating the adaptation concerns would provide even greater benefit to these measures. In the event that active cooling of buildings continues to be necessary, the most energy efficient air conditioning systems should be used and promoted through the Eco Labelling Directive (EC, 2000a) and awareness raising campaigns. District cooling is also an energy‑efficient way to prioritise absorption cooling (which allows the use of excess heat from other processes) over compression cooling (which mainly uses electric energy). In Vienna, as well as in Dresden, district and local cooling are combined together. Table 2.3 Overview on grey, green and soft adaptation measures to heatwaves following the structure of Box 2.2 Grey measures Green measures Soft measures • Building insulation to keep the inside cool • Blinds to provide shade • Passive cooling of buildings • Urban designs providing shade • Ventilation of urban space by intelligent urban design • Emission reduction of air pollutants • Boosting green infrastructure, such as green urban areas, trees, green walls and roofs where possible, but ensuring sustainable watering • Ensuring that fresh air from green areas outside the city can flow in • General awareness raising and ensuring broad participation • Mapping of urban heat island as well as cool places • Identification of vulnerable groups and their distribution as basis for targeted action • Warning systems • Heat action plans including appropriate institutional structures • Preparedness of health and social care system • Information on adapting behaviour during heatwaves in particular to the vulnerable • Adapting building codes to include insulation and shadowing to cope with heatwaves • Consider reducing heatwave impacts through urban renewal projects and urban planning • Transport management to reduce air pollutants The use of green infrastructure Conservation and improvement in existing green and blue areas in cities and the creation of new spaces to ameliorate the urban heat island effect is hugely important and can have a number of additional benefits such as creating areas for recreation, biodiversity, filtering air and draining and storing water. Vegetation provides cooling through shading and enhanced evapotranspiration. Parks and open water areas are essential. Green and blue roofs lower temperature in buildings during the summer through insulation and enhancing evapotranspiration. Vegetation areas have a significant effect on the local climate as they incite the production of fresh and cold air, particularly at night, and have a thermally balancing effect during the day due to a high percentage of trees (SustainableCities.dk). Box 2.7 provides an example from Manchester with the issue being further elaborated in Chapter 3. The European Commission encourages green solutions as well, considering green infrastructure as an essential tool for climate change mitigation and adaptation. Investing in and building up green infrastructure needs smart and integrated approaches to spatial planning to ensure that Europe's limited land is turned into areas capable of providing multiple functions for nature and society (EC, 2012a). Green infrastructure needs to be established in a careful way. The selection of plants needs to consider local water availability and potential scarcity.
  • 34.
    Climate change challengesand response options 32 Urban adaptation to climate change in Europe The introduction of invasive alien species or the replacement of natural areas by artificial green areas can have negative impacts on biodiversity. Soft measures Awareness and behaviour changes Awareness of the local population regarding effects of excessive heat on human health coupled with information on simple measures to prevent excessive heat stress enhances a city's preparedness. Such measures can reduce sensitivity to heat exposure at the individual and community level. Simple heat warning advices from 'avoid drinking alcohol' to 'wear a hat' can be very effective (see Box 2.8 for a Swedish example). Box 2.7 Manchester, United Kingdom — increasing green infrastructure helps to cool down The modelling of surface temperatures in the conurbation of Greater Manchester has shown that they closely followed the pattern of areas covered by vegetation in the urban area. In town centres and areas of retail or industry (20 % vegetative area) the surface temperatures reached 31.2 °C on a hot summer day. By contrast, in woodlands (98 % vegetative area) the surface temperature was only 18.4 °C. While climate change will lead to an increase of temperatures in every part of the city, green space will significantly buffer some of the predicted warming. By 2080, under a high CO2 emissions climate change scenario, surface temperatures would rise to 35.5 °C in the town centres (+ 4.3 °C), but just 21.6 °C in woodlands (+ 3.2 °C). If the amount of green space decreased by 10 % in town centres and other densely built-up areas, the surface temperature under the high emissions scenario could rise by as much as 8.2 °C by 2080 from the present 31.2 °C. On the other hand, an increase of green areas by 10 % would keep the maximum surface temperatures at nearly the same level as the 1961–1990 baseline conditions (Gill et al., 2007). Thus, the quantity of green spaces in the city is important for managing temperatures and other climate change impacts. The on-going project by Manchester City Council, 'City Centre Green Infrastructure Plan', recognises this factor and identifies where urban greening is the most needed. It also identifies actions needed for implementation. On a broader scale the Greater Manchester green infrastructure framework is currently being implemented addressing the areas of green space need and deficiency across the conurbation, with climate change adaptation as one of the guiding principles. Source: http://www.greeninfrastructurenw.co.uk/resources/1547.058_Final_Report_September_2008.pdf. Health warning systems and heat action plans Awareness raising is usually one of the components of so-called heat action or heat warning plans (Ebi et al., 2004; S. Hajat et al., 2010). The World Health Organisation Europe (WHO Europe) has published guidance on how to develop such plans (Barredo, 2009; Matthies et al., 2008)). The development of a Heat Health Watch Warning System (HHWWS) can be considered as a long term option to address heatwaves and other high temperature events. This usually comprises of a menu of individual options to respond to and prepare for extreme temperature events. Successful systems comprise of • An agreement of a leading body to coordinate a multipurpose, collaborative mechanism between bodies and institutions and to direct the channelling of information flows in the event of an emergency; Photo: © Bogna Kazmierczak
  • 35.
    Climate change challengesand response options Urban adaptation to climate change in Europe 33 Box 2.8 Botkyrka, Sweden: Tips on what to do in the event of a heatwave • Avoid unnecessary efforts. Assist with food shopping. Stop immediately what you are doing if you become dizzy or tired. Seek help if you feel unwell. • Avoid stressful and unnecessary travel plans. Remember that it is often cooler in the morning and hottest early in the afternoon. • Do not stay in the sun. Choose cool and shaded places when you are outdoors. • Stay, where possible, in air conditioned or cool rooms. Select the coolest room in the house and ventilate during the night. • Note that fans may cool down unless it is extremely hot in the room then they can cause dehydration. • Libraries, restaurants and shopping centres may be air conditioned. • Take a shower every day to stay cool. • Choose light clothes which 'breathe'. • Drink adequate amounts, preferably before you get thirsty. Water is fine, but avoid alcohol and very sweet drinks. Overly cold drinks can cause cramps. Request medical advice on fluid intake or if you use diuretics, ask your doctor about the appropriate action. • Avoid hot drinks or eating overly hot food as this raises the body temperature. • Replace salt and minerals in your body if you sweat heavily. Mineral water and sport drinks work well. • Keep in regular contact with relatives, friends or neighbours. If you are old or sick, ask someone to stay in touch with you. • Follow weather reports and bear in mind that health problems increase with an average daily temperature for more than two consecutive days over 22–23 °C. Source: Botkyrka kommun, 2011; http://www.botkyrka.se/Nyheter/Sidor/Värmebölja-.aspx. • Accurate and timely alert systems (systems trigger warnings, determine the threshold for action and communicate the risks); • Heat-related health information plan (what is communicated, to whom and when); • Reduction of indoor heat exposure (medium‑and short-term strategies; advice to the public on how to keep indoor temperatures low during heatwaves); • Particular care for vulnerable population groups; • Health and social care system preparedness (staff training and planning, appropriate health care and the physical environment); • Real-time surveillance and evaluation of measures (Matthies et al., 2008). After the heatwave of 2003 several countries such as France, Hungary, Portugal, and the United Kingdom established national HHWWS. In Spain a HHWWS was established at the regional level in the province of Catalonia. Such systems already exist in several German federal states and the Netherlands. A number of municipalities across Europe have established similar systems adopting those elements from those national plans relevant and feasible for them (e.g. Madrid, Barcelona, Paris, Lyon, Marseille, Rome, Milan, Verona, London and Budapest. The 'Heat Alert' system in Budapest is coupled with a smog alert system and an UV alert system. It showed success in 2007 when mortality rates due to the extreme event had been lower in comparison to a similar period in 2003 (Paldy and Bobvos, 2010). Photo: © Sekkha
  • 36.
    Climate change challengesand response options 34 Urban adaptation to climate change in Europe Stakeholder involvement All relevant municipal stakeholders (e.g. municipal departments, public health services, meteorological services, hospitals and other medical institutions, schools, kindergartens, transport companies, mass media, local environmental protection organisations and companies) have their own 'protocol of activities' and the mandate to carry out these actions in the event of a heatwave. In Paris the city council's climate plan encourages elderly and disabled citizens to be listed on a special extreme heat register (CHALEX) (Mairie de Paris, 2011). Through an emergency number these vulnerable groups can acquire information on heat stress prevention measures and request a home visit when necessary. Volunteers and charities can play a major role in risk situations. An example is the Big Response project in the United Kingdom. The National Council for Voluntary Organisations in the United Kingdom, together with the Green Alliance and Global Action Plan, have completed a pilot project with four Further reading • Shaw, R., Colley, M. and Connell, R., 2007, Climate change adaptation by design: a guide for sustainable communities, TCPA, London (www.preventionweb.net/files/7780_20070523CCAlowres1.pdf). • Matthies, F., Bickler, G., Cardenosa Marin, N. and Hales, S., 2008, Heat-health action plans — Guidance, WHO Regional Office for Europe, Copenhagen, Denmark (http://www.euro.who.int/__data/assets/pdf_ file/0006/95919/E91347.pdf). • CoR, 2011a, Adaptation to Climate Change: Policy instruments for adaptation to climate change in big European cities and metropolitan areas, European Union, Committee of the Regions, Brussels (http://80.92.67.120/en/documentation/studies/Documents/Adaptation%20to%20Climate%20Change/ EN.pdf). • Kazmierczak, A. and Carter, J., 2010, Adaptation to climate change using green and blue infrastructure. A database of case studies, University of Manchester, United Kingdom (http://www.grabs-eu.org/ membersArea/files/Database_Final_no_hyperlinks.pdf). major UK charities to assess how the changing climate could directly affect their constituents and to provide input on what is needed now to protect services and people in the future (NCVO, 2012). Mainstreaming into existing programmes, plans and policies Additional soft options include the integration of adaptation concerns into local, national and European building codes, namely the demand for insulation and the provision of shade. The early integration of climate change adaptation into urban planning, such as a network of green areas, offers a more cost effective and long term solution than retrofitting the city with less optimal measures (note the Stuttgart example mentioned previously). In Copenhagen planning law demands that all new buildings with flat roofs have to be greened (Københavns Kommune, 2012).
  • 37.
    Climate change challengesand response options Urban adaptation to climate change in Europe 35 2.2 Flooding Key messages • In Europe the natural hazards which have caused the greatest economic losses are flooding and storms. 2002 proved to be a record year with major flood events in six EU Member States and material damages rising to more than USD 21 billion Many European cities have to deal with flood risk management issues on a regular basis. • In a warmer climate projections show a further increase in: - the risk of river floods in many western European and central eastern European areas; - of urban drainage flooding in in particular western and northern Europe; - the risk of coastal floods in particular for cities along north-western European, northern Italian and Romanian coasts due to sea level rise in combination with storm surges. • Local city characteristics tend to be highly important along with regional characteristics in terms of impacts from projected increases in floods and intensive precipitation events. • Cities can carry out a number of actions to enhance their protection against flood damage. These are not limited to 'grey' flood protection and appropriate urban designs but also green solutions (space for rivers) and various 'soft' solutions. • Flood risks in a city can be strongly influenced by factors outside the city boundaries such as upstream river management. It requires a regional approach for solving the urban flood problems. 2.2.1 What are the challenges for cities regarding flooding? Cities and flooding Between 1950 and 2006, there have been 12 flood events in Europe (flash floods and river floods) with the number of fatalities exceeding 100 in each case (Barredo, 2006). The severe floods in Europe in the first part of this century were mostly caused by heavy rain events. The year 2002 proved to be a record year with major flood events in six EU Member States (Austria, Czech Republic, France Germany, Hungary and Romania). The total number of deaths was 78 with material damage rising to more than USD 21 billion (Genovese, 2006; Barredo, 2006 and 2009). Rivers have historically been and continue to be important transport routes. Therefore, most of Europe's large cities and conurbations are located along major rivers. For the same reasons of accessibility coastal areas have a concentration of major cities. Many European cities have to deal with flood risk management issues on a regular basis (Barredo, 2006; Lugeri et al., 2010). The high economic losses caused by floods include damage to infrastructure, public and private property due to the flooding itself, erosion or landslides, indirect losses in or beyond the flooded areas such as interrupted power generation and deteriorated groundwater quality caused by pollution or salinization in coastal areas. Socio-economic challenges in the form of lower productivity, failure of services, loss of jobs and income sources pose additional problems. In addition, floods cause loss of life and disease. The latter is due to the exposure to contaminated surface water (e.g. contaminated with sewage water or toxic heavy metals). People can also suffer from post-traumatic stress disorder (PTSD). Children, the elderly and people in poor health are also at risk. Table 2.4 shows four categories of flood impacts in urban areas.
  • 38.
    Climate change challengesand response options 36 Urban adaptation to climate change in Europe In Europe, different types of floods appear (Box 2.9). Floods in urban areas can be attributed to one or several of these types. In addition, extreme precipitation events can deplete the urban drainage Table 2.4 List of potential flood impacts in urban areas Material impacts Economic impacts Health impacts Emergency assistance impacts Damage to: • residential, commercial and public buildings, space and assets; • transport infrastructure; • public utility objects and networks (electricity, communication, gas, water); • other vulnerable objects, e.g. petrol stations. • Disruption of electricity network; • disruption of communication network; • disruption of traffic: Motor vehicles, public transport, bicycles, emergency services; • loss of business. • Death; • health impacts due to contact with contaminated flood water; • health impacts due to damp and associated fungi; • citizens' experience of all relevant impacts in a flood event — post traumatic stress disorder due to dislocation and loss. • Fire department services; • policy department services; • sewer management services; water board services. Source: Adapted from van Riel, 2011. Box 2.9 Types of flooding affecting urban areas River floods are triggered by heavy rainfall, melting snow in upstream areas or tidal related influences. Ground conditions such as soil, vegetation cover and land use have a direct bearing on the amount of run‑off generated. River floods occur when the river run-off volume exceeds local flow capacities due to intensive rainfalls. The river's level rises slowly and the subsequent period of rise and fall is particularly long, lasting several weeks or even months, particularly in areas with flat slopes and in deltaic areas. Those drainage or flood control works upstream failing or being poorly operated can also sometimes lead to riverine flooding. Flash floods occur as a result of the rapid accumulation and release of run-off waters from upstream mountainous areas, which can be caused by extreme rainfall, cloud bursts, landslides, the sudden break-up of a dike or failure of a flood control works. Over natural watersheds they typically occur in the instance of more than 200 mm of rain during less than six hours, while in built-up areas even rainfall of 50 mm within one hour can produce a local flash flood. They are characterised by a sharp rise followed by a relatively rapid decline causing high flow velocities. Discharges quickly reach a maximum level and diminish almost as rapidly. Coastal floods occur during storm surges when there are temporary increases in sea levels above the normal tidal range (EEA et al., 2008). An increase in storm surge height can cause severe urban coastal estuary, delta and embayment flooding and erosion. Coastal flooding may be exacerbated by river flooding when a river is unable to discharge into the sea due to sea level rise. Although the increase in sea level during a storm surge may be temporary, urban flooding episodes can last much longer depending on the ability of the urban area to drain the excess flood water. Accelerated coastal erosion, loss of property and land and the loss of human life are all indirect effects of storm surges. Where major urban areas are located on the coast disruption to transport and communications can affect the whole country for weeks afterwards. Urban drainage flooding during extreme precipitation events is caused by an insufficient capacity of the piped system or less effective drainage into an outfall because river levels are raised. The excess water travels down roads and other paths of least resistance and floods low lying areas. Urban flooding is exacerbated by saturated or impervious soils. As such, built environments with roads, infrastructure and substantial surface sealing prevent rainfall from infiltrating into the ground, thereby causing a higher surface run-off that may be in excess of local drainage capacity. Groundwater flooding, caused by extensive periods of precipitation (weeks or months), may lead to a slow move of groundwater to low-laying areas where the groundwater table breaks the groundwater. Depending on the local hydro‑geological situation, groundwater rising or subsurface flows can be other causes in the generation of urban floods. systems causing flooding in lower lying urban areas combined with sewer overflow (urban drainage flooding). Photo: © Katman1972
  • 39.
    Climate change challengesand response options Urban adaptation to climate change in Europe 37 Table 2.5 Factors contributing to flooding Meteorological factors Hydrological factors Human factors aggravating natural flood hazards • Rainfall • Storm surges • Temperature • Snowfall and snowmelt • Soil moisture level • Groundwater level • Presence of impervious cover • Channel cross-sectional shape and roughness • Topography, slope, basin geometry • Presence or absence of over bank flow, channel network • Synchronisation of run-offs from various parts of watershed • High tide and heavy swell impeding drainage • Presence of strong ice cover on rivers • Land-use changes (e.g. surface sealing due to urbanisation, deforestation) • Inefficiency or non-maintenance of sewage system; river margins clearing • Building in flood-prone areas • Reducing/cutting off retention areas In the main text of this section, we focus on the kinds of floods and flood impacts that are most relevant for urban areas. We do not elaborate in detail as to the effects of high winds (for additional information see Box 2.13) neither do we address the secondary effects of climate impacts, such as flooding, outside the city area. Flood determinants and their effects Floods result from a combination of meteorological and hydrological extremes. In most cases floods are additionally influenced by human factors. For example, human settlement into flood prone areas and lack of flood response plans increase the damage potential. Although human influences are very diverse, they generally tend to aggravate flood hazards by accentuating flood peaks. Thus, flood hazards in built-up environments have to be viewed as the consequence of natural as well as man-made factors. Table 2.5 lists meteorological, hydrological and human factors contributing to flooding. In order to manage urban floods, it is essential to understand the causes and impacts of each one of them. 2.2.2 What are the potential flooding impacts on Europe's cities? River floods Future projections made by multi-model simulations with global and regional climate models show a precipitation increase in northern Europe during all seasons, whereas a decrease for Southern Europe is found. In central Europe, precipitation is projected to rise in winter and decline in summer (Christensen and Christensen, 2007; Van der Linden and Mitchell, 2009; Harris et al., 2010). Besides extreme precipitation snowmelt can also cause floods in snow-affected river catchments. Due to increased temperatures, the snow pack decreases and leads to lower snow melt induced flood peaks. Snowmelt starts earlier within the year and leads to a temporal shift of the snowmelt peak. Projections of river flood hazard in Europe show that climate change leads to an increase in the likelihood and intensity of extreme high river flows for large parts of Europe (Lehner et al., 2006; Hirabayashi et al., 2008; Dankers and Feyen, 2008). In other regions the frequency and intensity of floods could decrease, yet even in regions that will become dryer on average, floods could occur on a more frequent basis. Map 2.8 shows the projected change in the river discharge for a flood which indicates an extreme flood event that statistically returns only once every 100 years. Other flood projections have recently been performed in the ClimWatAdapt project. It projects an increase of water level for 100 year flood events in northern United Kingdom and along the North Sea coast in the Netherlands and Belgium, the United Kingdom, Ireland, and Norway by 2025. In 2050 such a once every 100 years event could cause severe floods in more than 80 % of the area of the United Kingdom, Western France, Belgium, Netherlands, western Germany, Finland, as well as large areas in Portugal and Spain according to the upper end of projected ranges (Flörke et al., 2011).
  • 40.
    Climate change challengesand response options 38 Urban adaptation to climate change in Europe Map 2.8 Relative change in the river discharge for flood events that have a probability to occur once every hundred years between the scenario run (2071–2100) and the control run (1961–1990) Note: Simulations with LISFLOOD model driven by HIRHAM — HadAM3H/HadCM3 and IPCC SRES scenario A2. Only rivers with a catchment area of 1 000 km2 or more are shown. Map elaboration by EC JRC/IES. 50° 60° 70° 40° 40° 30° 30° 20° 20° 10° 10° 0° -30° -20° -10° 0° 60° 50° 50° 40° 40° 0 500 1000 1500 km Relative change in the river discharge for flood events that have a probability to occur once every hundred years between the scenario run (2071–2100) and the control run (1961–1990) + 40 + 20 + 10 + 5 – 5 – 10 – 40 Change in % – 20 More flood events Less flood events The sensitivity of cities depends on several factors. Urban areas situated on low-lying areas in the middle or lower reaches of river basins are particularly sensitive to extensive riverine floods. Increased urbanisation via land take and soil sealing combined with deforestation and the reduction of wetlands in the wider region diminish the natural water storage capacity. As a result run-off increases. In the event of intensive precipitation this leads to a growth in the flow amplitude and a shorter time before peaking. Parts of the city below the flood line and protected by artificial levees face devastating flooding through the breaching of the levees. Map 2.9 depicts the percentage of the urban area of a city that would be flooded in the event the water rises by one metre. The map indicates if a city has a large share of low-lying parts but one should expect that the potential damage increases with a larger flooded area. The map indicates the risk of considerable damage throughout Europe in particular deltas in the Netherlands (Rhine-Meuse) and North Italy (Po). However, the map should be interpreted with caution, since neither coastal floods nor flood protection measures are considered in the calculations.
  • 41.
    Climate change challengesand response options Urban adaptation to climate change in Europe 39 Note: The background (= Map 2.8) shows the relative change in 100-year return level of river discharge (red = decreased discharge, blue = increased discharge). Neither coastal floods nor flood protection measures are considered in the calculations. The potential flooded area is based on a 'volume model'. This model is based on water level and subsequent difference between modelled water level and the digital elevation model. The city is defined by its morphological form (Urban Morphological Zone) inside the core city boundaries derived Urban Audit (Eurostat, 2012). Source: EC JRC/IES; EEA. Map 2.9 Percentage of the city that would be flooded in case rivers rise one metre 50° 60° 70° 40° 40° 30° 30° 20° 20° 10° 10° 0° -30° -20° -10° 0° 60° 50° 50° 40° 40° 0 500 1000 1500 km Percentage of the city that would be flooded in case rivers rise 1 m 5 5–10 10–20 20–40 40 + 40 + 20 + 10 + 5 – 5 – 10 – 40 – 20 More flood events Less flood events Relative change in the river discharge for flood events that have a probability to occur once every hundred years between the scenario run (2071–2100) and the control run (1961–1990) (%) On a country level, Figure 2.5 reveals that roughly one fifth of European cities with over 100 000 inhabitants can be placed into the vulnerable category ( 40 % flooded). The share of these cities is in particular high in the Netherlands, Croatia, Slovenia, Greece and Finland. In some countries, such as Ireland, the risk is more uniformly distributed, with cities only in the lower categories. In other countries, such as the Netherlands and the United Kingdom, the differences amongst the cities are large. These results suggest that cities sensitive to river floods do not cluster in one region only. High sensitivities can be found in areas with a projected increase and decrease in flood events. Local city characteristics tend to be more important than similar regional characteristics. Different scenarios indicate that between 250 000 and 400 000 additional people per year in Europe by the 2080s will be affected by river flooding — most of them in cities (Ciscar et al., 2011). Socio-economic
  • 42.
    Climate change challengesand response options 40 Urban adaptation to climate change in Europe trends such as urbanisation can exacerbate the risk. The highest numbers of people affected by severe floods will be in areas with large population densities. Urbanisation and associated increases of impermeable land surface coupled with housing and business development of river floodplains exacerbate flood risk in urban areas. Building on floodplains and flood retention areas increases the risk as shown in the Dresden example. The comparison of three major flood events from the river Elbe in 1845, 1890 and 2002 shows that the built-up area increased dramatically over time. Although the total flooded area in 2002 was only slightly bigger than in 1890 and smaller than in 1845, the settlement area in flood plains had grown considerably over the past century (Schumacher, 2005; EEA, 2010b) (see Figure 2.6). Figure 2.5 Percentage of the urban area that would be flooded as displayed in Map 2.9 — share of cities per class per country Note: Generally, only cities with more than 100 000 inhabitants are considered. 0 500 1 000 1 500 2 000 2 500 3 000 3 500 31.03.1845 06.09.1890 17.08.2002 Flooded area in ha Total area flooded Settlement area flooded Figure 2.6 Flood events and flooded built-up areas in Dresden, Germany Source: Schumacher, 2005; EEA, 2010b. 0 20 40 60 80 100 Croatia Netherlands Greece Finland Slovenia Italy Hungaria Czech Republic Bulgaria Romania Austria Norway Spain Belgium France Slovakia Germany Poland United Kingdom Sweden Portugal Switzerland Denmark Latvia Ireland Lithuania Estonia Luxembourg Malta Percentage of cities in the country per class Percentage of city area flooded 40 % 20–40 % 10–20 % 5–10 % 5 % %
  • 43.
    Climate change challengesand response options Urban adaptation to climate change in Europe 41 Urban drainage floods In regions with an increase in average precipitation, the occurrence of intense precipitation events (frequency or proportion of total precipitation) is very likely to increase (IPCC, 2012). The reverse is true for regions with declining average precipitation. Map 2.10 shows the projected change in the annual number of days with heavy rainfall in 2071–2100 against the reference period (1961–1990). It shows an approximate north-south division with the imaginary division line being the Alps. Projections for regions south of the line show, in general, a decline in the number of days with extreme precipitation of up to five days and more. Most regions north of the line expect an increase, mostly of one to three days. Yet the coastline of Norway as well as Ireland and western United Kingdom and some parts off the Atlantic coast of France can expect an increase of between four and 13 days (Greiving et al., 2011). 50° 60° 70° 40° 40° 30° 30° 20° 20° 10° 10° 0° -30° -20° -10° 0° 60° 50° 50° 40° 40° 0 500 1000 1500 km Urban flooding – impervious surfaces reduce the drainage of rain water and increase the risk for urban flooding Mean percent soil sealing of the urbanised area (UMZ) of the core city 7–24 25–49 50–74 75–100 – 8.0 to – 5.0 – 4.9 to – 1.0 – 0.9 to 1.0 1.1 to 5.0 5.1 to 13.1 Change in annual mean number of days with extreme precipitation ( 20 mm/day) Increase Decrease No data Outside data coverage Map 2.10 Urban flooding — impervious surfaces reduce the drainage of rain water and increase the risk for urban flooding Note: Mean per cent soil sealing per city and change in annual mean number of days with extreme precipitation ( 20 mm/day) between the CCLM scenarios run (2071–2100) and the reference run (1961–1990) for IPCC scenario A1B. The city is defined by its morphological form (Urban Morphological Zone) inside the core city boundaries derived from Urban Audi (Eurostat, 2012). Source: EEA (soil sealing); Lautenschläger et al., 2009 (precipitation). In addition, Map 2.10 shows the degree of mean soil sealing per urbanised areas of cities. This indicates reduced natural drainage as the water is passed on to the sewage system. Cities with high soil sealing and an increasing number of intensive rainfall events — in particular in north-western and northern Europe — face a higher risk of urban drainage flooding. Nevertheless cities in areas with a decreasing number of such events but high soil sealing still face a flooding risk, just less often. Cities of high and low soil sealing can be found in all regions and do not cluster in a particular region with the exception of low sealing levels in cities in Finland, Norway, Slovenia and Sweden. Cyprus, Estonia, Greece and Luxembourg are countries with a high share of cities with elevated levels of soil sealing (Figure 2.7).
  • 44.
    Climate change challengesand response options 42 Urban adaptation to climate change in Europe Figure 2.7 Degree of mean soil sealing per city — share of cities per class per country (based on Map 2.10) A city's weakness does not depend solely on soil sealing but also on rain water management. For decades urban drainage systems have been optimised to drain a shower with a particular return period. Considering future climate and on-going urbanisation, this 'carrying capacity' has already turned out to be inadequate in a number of cities (see the Copenhagen example in Box 2.10). There are several factors that tend to increase the risk. • Old drainage infrastructure often does not keep pace with on-going urbanisation. The increase in the share of impervious surfaces overloads the capacity of the sewage system in the face of extreme events. • The conventional way of dealing with rainfall and waste water in urban areas has been to carry Note: Generally, only cities with more than 100 000 inhabitants are considered. 0 20 40 60 80 100 Cyprus Estonia Luxembourg Greece Hungary Romania Slovakia Croatia Poland Spain Bulgaria Czech Republic Germany Latvia Ireland Lithuania Italy Netherlands France Portugal Austria Belgium Switzerland Denmark United Kingdom Finland Malta Norway Sweden Slovenia Percentage of cities in the country per class Degree of mean soil sealing of the city area 75 % 50–74 % 25–49 % 25 % % it away as quickly as possible via underground pipes and sewers. Older areas normally have a combined sewer system, where rainfall drains into sewers carrying sewage and both are transferred to sewage treatment works. These systems are more vulnerable to excessive rainfall than a separate treatment. • The existence of inadequate maintenance of the drainage channels to monitor debris and solid waste within such systems. • Inadequate discharge of excess water to the regional water system. This is particularly apparent in delta areas in the Netherlands where surface level differences and hydraulic gradients are small and urban flooding occurs easily.
  • 45.
    Climate change challengesand response options Urban adaptation to climate change in Europe 43 Box 2.10 Flooding in Copenhagen, Denmark on 2 July 2011 After a substantially hot period Copenhagen was hit by a huge thunderstorm on 2 July 2011. During the afternoon clouds and thunder had been building up over the southern part of Sweden. During a two hour period over 150 mm of rain fell in the city centre. This constituted the biggest single rainfall in Copenhagen since measurements began in the mid-1800s. The city's sewers were unable to handle all of the water and as a result many streets were flooded and sewers overflowed into houses, basements and onto streets thereby flooding the city. The consequences were quite drastic as emergency services had to close roads and attend to people trapped in their cars. The emergency services were within minutes of having to evacuate the city's two biggest hospitals because of flooding and power cuts. Insurance damages alone were estimated at EUR 650–700 million. Damage to municipal infrastructure not covered by insurance, such as roads, amounted to EUR 65 million. That the city's sewers could not handle the huge amounts of rain water was no surprise — they are designed to handle much smaller amounts of precipitation. The city's sewage system combines rainwater and sewage together thereby making the city vulnerable if the amount and intensity of rainfall increases. The fact that Copenhagen over the last year has experienced a number of torrential rain falls has caused the city to really take notice. The city has prepared and approved a climate adaptation plan with the principle aim being to separate as much rain water from sewage water as possible. The city has estimated that it is currently not an option to expand the sewage system to handle the predicted larger amounts of rain water. The city is currently preparing a so-called 'cloudburst plan'. The plan has four steps: • Rescue services — the city is preparing a new rescue service plan to handle extreme rainfall. This includes warning systems and pumps to ensure quick relief. • Vulnerability — communication with citizens, businesses and public institutions to provide advice on taking appropriate measures to protect properties and vital systems (such as technical systems which are typically in basements). • Optimising the city's existing sewage system. The water utility company has prepared a number of initiatives to allow the sewage system to handle more rain water by having a 'cloudburst' control which can be activated in case of heavy rain and will enable the system to handle more water. • A long term plan has been suggested to process the majority of the surface rain water via a system of small canals that can divert the water either to streams, the harbour or areas where it can be stored until being processed into the sewage system. This plan will be implemented in cooperation with neighbouring municipalities that also process their sewage water through Copenhagen. Sources: Lykke Leonardsen, city of Copenhagen, personal communication, 2011. Copenhagen climate plan (short version): http://kk.sites.itera.dk/apps/kk_publikationer/pdf/794_kZEjcvbgJt.pdf; long version (Danish): http://www.kk.dk/sitecore/content/Subsites/Klima/SubsiteFrontpage/~/media/1366A5817180444D 88FD0DAE316229A0.ashx. Flash floods In Europe, 40 % of the flood-related casualties in the period 1950–2006 were due to flash floods (Marchi et al., 2010; Barredo, 2006). Most flash floods occurred in a geographical belt crossing Europe from western Mediterranean (Catalonia and south‑western France) to the Black Sea, covering northern Italy, Slovenia, Austria, Slovakia and Romania. In the Mediterranean and Alpine-Mediterranean regions, flash floods occur predominantly in the autumn, whereas in the inland continental region their occurrence is often during summertime, suggesting the impact of different climatic factors. In addition, flash floods in Mediterranean areas are generally more intense, and the spatial extent and duration of the events larger than in continental areas. Photo: © Risager
  • 46.
    Climate change challengesand response options 44 Urban adaptation to climate change in Europe Box 2.11 Flash flood in Dresden, Germany in August 2003 On the 12 and 13 of August 2002, the city of Dresden in Germany and surrounding settlements were hit by a flash flood from the river Weißeritz, a small tributary of the Elbe (Hutter et al., 2007). The low pressure system 'Ilse' caused continuous, intensive rainfall for 1.5 days over the eastern parts of the Federal State of Saxony. The situation around Dresden was exacerbated by its topography leading to heavy rainfall in the Ore Mountains. The area faced the highest precipitation in a two day period since records began. The total rainfall amounted to 180 mm in Dresden, 250 to 300 mm in the lower and middle ranges of the Ore Mountains, and more than 300 mm in the upper ranges (locally up to 400 mm). The water masses caused heavy flash floods in river catchments of four Elbe tributaries (Goldberg et al., 2003). The flash flood of the Weißeritz hit Dresden and was later classified as a flood event likely to take place only once every 500 years. The discharge at Freital, a town located at the edge of Dresden's city boundary, was 300 times higher than normal (Goldberg et al., 2003). In Dresden the river used its old riverbed as a second discharge channel. The riverbed had been replaced in the 19th century. The flood caused several casualties and large damage to buildings, bridges, railway tracks, streets and other infrastructure (Goldberg et al., 2003; Hutter et al., 2007). The material damage in the Weißeritz catchment amounted to EUR several hundred million (Goldberg et al., 2003), while for Dresden alone damage was estimated to be EUR 250 million (Hutter et al., 2007). Several days after the flash floods, a flood wave from the river Elbe arrived, caused by heavy rainfall in eastern Germany and the Czech Republic. The peak of this flood, with an unprecedented height of 9.40 metres, reached the city on 16 August (Landeshauptstadt Dresden, 2011). Several areas of the city were flooded for a second time. Photo: © Archiv BF Dresden Flash floods depend on a complex array of factors including rainfall intensity, rainfall duration, surface conditions and the topography and slope of the receiving basin. Therefore, it is difficult to predict future risk assessments, in particular at the European level. The projected increase in frequency of extreme precipitation events will increase the risk of flash floods. Also, the potential impact (casualties, economic damage) could well increase in a number of regions in flash-flood prone areas in Europe due to the increasing pressure on land use (Marchi et al., 2010). In densely populated areas flash floods are more destructive than other types of flooding because of their unpredictable nature and unusually strong currents carrying large concentrations of sediment and debris. Little time would be available for communities living in the flood's path to adequately prepare for its arrival leading to major destruction to infrastructure and humans. Coastal flooding Sea level rise projections for Europe indicate the greatest increases for the Baltic and Arctic coasts and northern Mediterranean coasts (Johansson et al., 2004; Meier, 2006; Nicholls, 2004). Wave height is likely to increase from North Sea storm surges predominantly affecting those coastal urban areas in north-west Europe where major cities and economic centres are located (EEA et al., 2008). The latest projections on sea level rise on the basis of a balanced scenario indicate values for the year 2100 that are between 0.97 and 1.56 meters above the 1990 annual mean sea level. This follows the SRES A1B scenario (Vermeer and Rahmstorf, 2009). These results should be viewed with caution due to the fact that the physical basis of the models for these estimates is lacking (Stocker et al., 2010).
  • 47.
    Climate change challengesand response options Urban adaptation to climate change in Europe 45 Future projections indicate a slight decrease in the number of storms, but an increase in the strength of the heaviest storms. Projections to the end of the 21st century show a significant increase in storm surge elevation for the continental North Sea and south‑east England (EEA et al., 2008). Map 2.11 shows how major cities are potentially affected by the change of inundation height given a 100 year coastal storm surge event that includes sea level rise. Primarily cities at the Dutch, German, Belgium and northern Italian coastlines would expect severe changes. Due to data constraints, coastal defence systems such as dikes could not be considered in these calculations so that the map only shows the potential effect on urban areas. The hotspots which emerge from this analysis appear, however, to be plausible and can serve as a basis for checking local and regional preparedness to climate change accelerated coastal storm surges. The city is defined by its morphological form (Urban Morphological Zone) inside the core city boundaries derived from Urban Audit database (Eurostat, 2012). Although the increase in sea level during a storm surge may be temporary, the flooding of urban areas can last much longer depending on the ability of the urban area to drain the excess flood-water. Accelerated coastal erosion, loss of property and land and the loss of human life are all indirect effects of storm surges. When major urban areas are located on the coast, disruption to transport and communications can affect the whole country for weeks afterwards. See Box 2.12 for an example in Belgium. Many coastal areas were preferred to establish large cities and urban agglomerations due to the importance of international maritime transport. They have seen rapid population increases and urbanisation (McGranahan et al., 2007; Nicholls Map 2.11 Potential inundation exposure for coastal cities due to projected sea level rise and storm surge events Note: This calculation includes the change of inundation height due to coastal storm surge events generated by the DIVA project. A potential sea level rise of one metre has been calculated. Source: Greiving et al., IRPUD 2011, © ESPON 2013 (inundation); EEA (Urban Atlas, UMZ). 50° 60° 70° 40° 40° 30° 30° 20° 20° 10° 10° 0° -30° -20° -10° 0° 60° 50° 50° 40° 40° 0 500 1000 1500 km Potential inundation exposure for coastal cities due to projected sea level rise and storm surge events Urbanised area per core city affected (%) 0–5 6–10 11–20 21–40 41–100 No data Outside data coverage
  • 48.
    Climate change challengesand response options 46 Urban adaptation to climate change in Europe Box 2.12 Coastal erosion and urban areas at the Flemish coast, Belgium Coastal erosion occurs naturally with or without climate change. It mostly affects natural and rural areas. However, where it happens in proximity to urban areas, local implications can be significant in terms of loss of buildings, infrastructure, and flood defence systems. An increasing urbanisation of coastal areas has interrupted or changed natural processes of erosion and accretion and exacerbated the problem. Further exacerbation from climate change could well follow. Along large parts of the Flemish coastline erosion forms an acute threat despite numerous protection measures taken. The existing almost linear coastline is man-made. The seawall is the main barrier to protect the coast, its inhabitants and the lower lying hinterland from storm tides and floods. Both the coast and the polders behind are densely populated and of high economic, social, recreational and ecological value. In the city of Oostende, for example, the old town centre with its seawards position compared to the rest of the coastline (see photo) and low-lying city centre at the mean high-water level, is protected against flooding by a seawall which was built some 140 years ago. The seawall has, over years, accelerated the erosion process of the beach in front. The remaining narrow beach and the seawall offered only limited protection against damages from storm surges and by consequence the city centre was until recently only protected against flooding for storm events statistically occurring once every 25 years. During regular yearly storms water was frequently washed over the sea wall. In 1953 a storm caused serious city centre flooding in which eight people died and extensive material damage took place. In 2004, emergency beach replenishment ('nourishment'), in anticipation of a more sustainable project, created a beach that increased the protective level against a storm the size of which would only occur once every one 100 hundred years. This is a temporary measure which requires continuous maintenance work. The measure was not sufficient to protect against a storm the size of which would occur once every 1 000 years, something which is required by the Flemish government's coastal protection plan released in 2011. The coastal protection plan for Oostende now foresees a new beach which will protect the city from flooding by a storm of that size. The most important stabilising element for this beach is a dam construction perpendicular to the coastline at the north-eastern side of the new beach. This dam reduces the movement of sand along the shore and stabilises the new beach. It will reduce the need for beach replenishment to once every ten years. The coastal protection plan for Oostende was combined with the harbour improvement plan and several additional projects such as the renovation of the promenade and the construction of an underground parking area forming part of the dike. These measures are part of the Flemish government's coastal protection plan of 2011. It requires a minimal protection level for a storm the size of which would only occur once every 1 000 years including the projected levels of sea level rise up to 2050 and a protection against higher storm surges in cases of significant residual risk of damage or casualties. Where possible, it opts for more natural options such as replenishing the beach and supplementing this with fixed constructions including sea dikes. Source: Coastal Atlas: http://www.coastalatlas.be/en/themes/coastal-defence-management. Coastal protection plan: http://zeeweringenkustbeheer.afdelingkust.be/level2.asp?TAAL_ID=1ITEM_L1_ID=12ITEM_L2_ ID=24. Photo: © Sillevl et al., 2007). Projections made by Ciscar et al., 2011 show that without adaptation the number of people affected annually in the 2080s would increase significantly in all scenarios. This could potentially affect between and 775 000 and 5.5 million people. The British Isles, central Europe, northern and southern Europe are the areas potentially most affected by coastal floods (Ciscar et al., 2011). However, when adaptation (dikes and beach replenishment) is taken into account, the number of people potentially exposed to floods is reduced significantly.
  • 49.
    Climate change challengesand response options Urban adaptation to climate change in Europe 47 Box 2.13 Risks of storms and high winds for cities — not only on the coast Storms are, together with other extreme events, the main threat of climate change for built-up areas. Casualties can occur, but their number is relatively low compared with other extreme events such as heatwaves or floods (Schauser et al., 2010). Wind-related insured losses in Europe are projected to increase by 5 % until 2080, considering only climate change factors (Hunt and Watkiss, 2010). Built-up areas (especially roofs and facades) and green areas are particularly vulnerable. Furthermore, transport and supply systems may be jeopardised, particularly by fallen trees and lampposts. Failures in these systems affect almost every field of contemporary life (Schauser et al., 2010; VÁTI, 2011). For Europe, the total number of storms is projected to decrease, while the strength of heavy storms might increase (EEA et al., 2008). However, in the entire Atlantic region of Europe (Benelux, north-western parts of France and Germany, Ireland and the United Kingdom) storms are projected to be more intensive and frequent. In southern Europe storm wind speeds of are projected to decrease (Schauser et al., 2010). Projections of intensity and frequency of storm events are very uncertain (Hunt and Watkiss, 2010; EEA et al., 2008). Storms appear often in combination with other extreme events such as storm surges, hail, thunder or heavy precipitation. Cities facing increasing risks of storm damage can respond in several ways. Grey infrastructure approaches can include the design of buildings in a more wind-resistant way and the reconstruction of vulnerable buildings, decentralisation of energy systems and placement of electricity and other cables underground. Soft measures can include the adjustment of building regulations, financial support for retro-fitting of buildings, insurances to finance repairs and replacements after storm events, preparation or adjustment of emergency response plans. This would include for public transport in the case of blocked roads, electricity supply back-up systems for health care and other emergency services and the strengthening of local disaster management (e.g. improve or expand equipment, develop tactics). Forecasting and early warning systems are fundamental for emergency responses. Cooperation with meteorological services can help to improve these arrangements (Schauser et al., 2010; VÁTI, 2011; ONERC, 2010; OECD, 2010; CoR, 2011a). In the Hungarian city of Tatabánya, the CLAVIER research project evaluated the vulnerability of buildings to storms. It categorised the buildings depending on their exposure (basic wind load), sensibility (height and roof construction of the building, building density of neighbourhood) and ability to adapt (age, design). The results were incorporated in a map, which can be used for urban planning and focused response policies (VÁTI, 2011). Map 2.12 Relative change of mean annual storm loss potential on nine GCM (upper row) and eight RCM (bottom row) simulations for 2071–2100 compared to 1961–2000 (SRES A1B scenario) Source: Donat et al., 2011. 50° 60° 70° 40° 40° 30° 30° 20° 20° 10° 10° 0° -30° -20° -10° 0° 60° 50° 50° 40° 40° 0 500 1000 1500 km UK and Ireland BE, NL and LU Poland Germany France Spain and Portugal 20 % 10–20 % 0–10 % – 10.1 (±10.0) + 17.4 (±32.3) + 18.5 (±18.6) + 17.6 (±21.2) + 8.0 (±11.4) + 37.7 (±31.0) + 15.1 (±17.1) + 12.1 (±18.3) + 6.1 (±9.9) + 9.0 (±13.2) + 5.8 (±7.4) 0 % – 4.2 (±5.6) Relative change of mean annual storm loss potential based on nine GCM (upper row) and eight RMC (buttom row) simulations for 2071–2100 compared to 1961–2000 Mean of 9 GCMs Mean of 8 RCMs
  • 50.
    Climate change challengesand response options 48 Urban adaptation to climate change in Europe Social sensitivity Factors determining sensitivity of people to floods are in principle similar to those influencing heat. Usually the elderly, young children and people with health problems are more vulnerable. It appears that in a large number of cities in Belgium, Germany and Italy the proportion of elderly people as a percentage of the population is relatively high (see Map 2.7 in Section 2.1.2). Furthermore, a number of other factors have to be taken into account including income, social status, housing type, type of households, number of social hot spots such as schools, hospitals, kindergartens and pensioners' homes (Schauser et al., 2010). Current and future flood impacts are the result of several intertwined trends — climatic and non‑climatic — which make population and economy more sensitive to flooding. Besides climate change, economic and demographic developments are very important drivers. Where development and economic growth continues the scale of potential losses will also rise. Economic growth tends to take place in cities which may lead to an increase in related climate change risks rather than in suburban and rural areas. 2.2.3 How can cities adapt to flooding? Strategic planning for flood risk management The cross-border nature of flooding requires a regional approach in which local measures are embedded. Flood risk management plans involve a region much larger than the city itself. Multi-level action is required involving decision makers at regional, national and sometimes even international levels. Table 2.6 Adaptation measures to flooding in cities and regions following the structure of Box 2.2 Grey measures Green measures Soft measures • Make new buildings and infrastructure flood proof by appropriate design and material use. • Maintenance/upgrade of drainage system. • Temporary water storage in basins or fascines. • Separate treatment of rain water, disconnected from sewage, improved ground drainage. • Innovative design of buildings and areas such as elevated entrances, building on poles, floating houses, temporary water storage, green roofs. • Dams, flood defences. • Avoid/remove impervious surfaces wherever possible. • Maintain and further increase green infrastructure in cities, parks and gardens, wetlands, water bodies but also green roofs. • Maintain and manage green areas outside and inside the cities for flood retention including the use of appropriate agricultural and forest practices. • 'Re-naturalisation' of rivers and wetlands. • Mapping of flood risks taking into account climate change scenarios and information distribution. • Forecasting and early warning systems. • Awareness raising, knowledge and capacity building for all groups to cope with floods and flood risks. • Strategic planning in river basins — ban building in flood prone areas, protect flood retention and other green areas. • Flood risk management plans. • Rain water management. • Guidance for behaviour changes such as not storing valuables in basements. • Adapting building and planning codes to include flood resistance. • Taxes or incentives, such as concerning the amount of sealed area per property, amount of waste water used (including rain water). • Insurance of damages. To support the transition from traditional flood defence strategies to a flood risk management approach at the scale of entire river basins in Europe, the European Union has adopted a floods Directive (EC, 2007a). This Directive requires Member States to develop and implement flood risk maps and management plans (de Moel et al., 2009; EEA, 2010e). These plans shall take into account the likely impact of climate change on the occurrence of floods. This will have consequences for land use practices taking place in a river basin and for floodplains and riverine cities. Member States are currently uploading their preliminary flood risk assessment to the European Commission and the EEA and will include these in the Water Information System for Europe (WISE). The European flood action programme emphasises the importance of damage prevention by appropriate spatial planning. Important aspects include: • avoiding construction of houses and industrial buildings in current and future flood-prone areas; • adapting future developments to the risk of flooding; • appropriate land use, agricultural and forestry practices (EC, 2004). At the regional or river basin level some trans national prevention programmes exist. Examples include the Rhine across, France, Germany, the Netherlands and Switzerland and the Meuse across Belgium, France and the Netherlands. Wider trans national cooperation is stimulated by macro-regional strategies of EU regional policy, for example, for the Baltic and the Danube (EC, 2009c; EC, 2010a; EC, 2010c).
  • 51.
    Climate change challengesand response options Urban adaptation to climate change in Europe 49 Grey infrastructure approaches Integrated water management at the river basin level Infrastructure beyond the urban fringe, such as temporary overflow areas or by-passes, can prevent flood waters from reaching the cities. Such measures need to be established through regional or national collaboration. The Dutch government initiated the program 'room for the river' in 2006. By providing more space for water around Dutch rivers, flood risks in downstream areas, including cities, will be reduced. One example of this project will take place in the town of Nijmegen. The Dutch government has targeted the building of a replacement inland dike alongside the river Waal in Nijmegen as the best solution to reduce flood risk (see also Box 2.14). A by-pass of the river IJssel is projected to reduce flood risk in the Dutch city of Kampen. Another example of the FloodResilienCity project is the Dijle River basin, the source of which is situated half in the Walloon and half in the Flemish regions of Belgium. Because of a high risk of flooding the authorities decided to designate and redevelop roughly 1 200 ha of natural area as an overflow and create an additional artificial temporary storage basin closer to the city to protect the medieval inner city of Leuven against rainfall levels that are only predicted to occur once every hundred years (FRC, 2012). Urban storm water disposal Options to prevent urban drainage floods focus on improvement of the local drainage and the sewerage system. Urban drainage floods, including adaptation options, are currently being studied in Copenhagen, London, Malmö and Rotterdam. The City of London Corporation, for example, has identified 'hot spots' vulnerable to flooding, where it plans to install new sustainable drainage systems and invest in maintenance to accommodate the expected rise in the volume of precipitation (PBL, 2011; Box 2.14 Urban and building design options to prevent flood damage Amsterdam and Almere in the Netherlands have built man-made islands with floating houses which 'naturally' adapt to water levels (http://www.deltasync. nl/deltasync; http://marquetteturner.com/2011/the-floating- houses-of-amsterdam). Malmö in Sweden manages rainwater flows with a new open storm-water-system. Here, green roofs and open water channels lead rainwater into collection points that form a temporary reservoir to collect surplus water (http://www.malmo.se/English/Sustainable-City- Development/Augustenborg-Eco-City/The-Green-City. html; http://www.malmo.se/English/Sustainable-City- Development/Bo01---Western-Harbour/Green-City.html). In Rotterdam, the Netherlands, open water channels in new neighbourhoods have been built to funnel water flow and increase storage and drainage capacity. The city plans so-called 'water squares', low-lying public spaces which can be used for temporary water storage during heavy precipitation or flooding events (http://www. rotterdamclimateinitiative.nl/en/english_2011_design/100_climate_proof/projecten/water_plazas_playgrounds_ doubling_as_water_storage?portfolio_id=59). In Vienna, Austria, the sewage system itself provides storage. The loading of the sewer system is monitored continuously in real time and interventions are possible through centrally controlled sluices and pump stations to optimise the full storage capacity of the 2300 km long system and prevent outflows during high precipitation events (http://www.wien.gv.at/umweltschutz/umweltbericht/pdf/abwasser.pdf). Nijmegen, the Netherlands, explores opportunities in which buildings are part of the flood defence. In the concept Adaptable Flood Defences (AFD), structures such as car parks, buildings, dwellings or roads are transformed and redesigned with protection of the hinterland against flooding in mind (Stalenberg and Vrijling, 2009). A new metro line is being built in Copenhagen, Denmark. Entrances will be elevated to avoid storm water flooding the tracks (http://www.cowi.com/menu/specialfeatures/climate/COWIsclimatestrategy/Documents/0212- 1900-001e-09b_COWIClimateChangeServices_low.pdf). Photo: © inhabitat.com
  • 52.
    Climate change challengesand response options 50 Urban adaptation to climate change in Europe Kamal‑Chaoui and Robert, 2009). The town of Cascais in Portugal has recognised the importance of drainage system maintenance and has put into practice by cleaning and restoring small streams to reduce flood risks (Oliveira et al., 2010). Source control techniques are particularly attractive for storm water treatment. They reduce the amount of storm water which needs to be taken up by the sewage system and thus reduce the necessity to extend and upgrade the existing sewage system. It includes a variety of techniques that aim to reduce the quantity and improve the quality of storm water at or near its source by using infrastructure or natural physical resources. Source control includes further soft measures to change behaviour or force the implementation of measures. The city of Stockholm, as well as several municipalities in Denmark, currently plan to implement source control techniques to all new sewage projects (Chouli et al., 2007). Temporary water storage in the city Integrating water storage in the design of new city areas or redesigning existing areas is another adaptation option which is often cheaper than extending the sewage system. It can also increase the attractiveness of public spaces. Innovative design of buildings and infrastructure Adaptation options are also available for individual buildings. This can range from minimal changes such as elevated entrances to highly innovative constructions. Short-term measures usually can be taken in existing buildings and infrastructure (green roofs, maintenance drainage system and specific usage of lower floors in flood-prone buildings), while medium to long term measures can focus on the climate-proof design of residential and commercial buildings and new urban developments. The fact that cities are continuously changing suggests that such measures would have minimal costs (PBL, 2011). Green infrastructure approaches The capacity of soils and vegetation to retain water is an important flood prevention feature as it reduces peak discharges across river basins. The way agricultural and forestry land is used is therefore relevant to flood risk management on a regional scale. The European Union's Common Agricultural Policy (CAP) reform of 2003 and on‑going policy development may contribute to flood prevention by promoting soil protection and the maintenance of permanent pastures and thereby improving the capacity of soils for water retention in areas upstream of flood-prone cities. Box 2.15 River restoration as urban flood protection in Łódź, Poland Łódź, meaning 'boat' in Polish, is a city whose history has been shaped by water. Many severe environmental problems have resulted from the industrial history of the city: loss of forests and green spaces, soil contamination, degradation of rivers and streams and poor water quality. During the periods of industrialisation and urbanisation most of the city's urban streams were converted to a mixed storm water drainage and sewage system. Łódź has been subject to frequent flooding due to the reduced water absorption capacity of its land area. As a solution to many of these problems, Łódź is focusing on ecohydrology and integrated water management including the restoration of the city's rivers, notably the river Sokolowka. Restoration has included the building of reservoirs, the invention of a storm water bio-filtration system and the development of a wider development plan for the river valley. This broader approach reflecting on the linkages between the water cycle and other aspects of urban development and beyond has proven a success. Stakeholder involvement through the city's Learning Alliance (which was established during the SWITCH project) has succeeded in changing mind-sets, so that up-scaling to the rest of the city's rivers is planned. Source: Loftus, 2011; http://www.switchtraining.eu/fileadmin/template/projects/switch_training/files/Case_studies/Case_study_ Lodz_preview.pdf. Photo: © Jorge Ueyonahara
  • 53.
    Climate change challengesand response options Urban adaptation to climate change in Europe 51 Sustainable land use practice in the context of river‑basin management preferably encompasses flood prevention measures in combination with agri environmental practices, territorial planning policies and nature development strategies, including river restoration. Green roofs, parks, natural depressions and wide river beds can all store storm water. River restoration can act as a catalyst for sustainable urban development that takes into account green infrastructure in combination with other solutions (Box 2.15). Soft measures Forecasting and early warning systems Mapping of flood risks, forecasting and early warning systems enhances flood preparedness. Warning the authorities and the public by forecasting severe weather events several days or hours ahead of approaching storm events is crucial for emergency actions. These can include evacuating vulnerable areas and buildings and the transportation of the population to storm shelters. Awareness raising, knowledge, capacity building and training Awareness raising, knowledge, capacity building and training are important tools to enable cities and citizens to cope with flooding. The city of Orléans, the Val de Loire conurbation, and the Loiret departmental council in France are working together on the project 'FloodResilienCity' (FRC). The aim of the project is to raise awareness of the potential impact of flooding by the River Loire to the public, among stakeholders and with government and decision-makers. The goal is to reduce the risk of wealth destruction and human health impact by increasing the resilience of buildings and infrastructures and by preparing evacuation and recovery plans preventively. The United Kingdom's Climate Impacts Programme (UKCIP) (7) provides climate scenarios, as well as an adaptation wizard to help users to work their way through potential vulnerabilities and methodologies to appraise options and make decisions. Flood-risk maps, such as those provided by the Environment Agency of England and Wales, are a valuable tool in developing strategic spatial plans. Box 2.16 Examples of forecasting and early warning systems The website www.meteoalarm.eu provides European weather warnings from EUMETNET countries and facilitates the exchange of warning information at the European scale. National meteorological services can submit and retrieve severe weather reports via the European Severe Weather Database (ESWD, http://essl.org/ESWD). The European Centre for Medium-Range Weather Forecasts (ECMWF) provides 3- to 15‑day weather forecasts to its Member States and cooperating states. National meteorological services tend to share information on their web pages whereas in some countries this is the responsibility of the emergency authorities. Denmark (photo), Germany, Hungary and the Netherlands provide text message alerts to mobile phones. Finnish media are obliged to immediately announce extreme weather events. In Portugal, the National Meteorological Institute provides meteorological warnings, while the National Authority for Civil Protection sets alert levels for risks linked to meteorological and other emergency situations on their official site. The Finnish Meteorological Institute (FMI) receives weather-related emergency reports directly from the emergency response centres which manage emergency calls. Hungary and Germany utilise spotter groups to support the meteorologist services with weather reports. A storm spotter actively maintains the development and progression of specific weather events while relaying important information to the local weather agency in a timely manner. More than one million people subscribe to the flood warning system of the Environment Agency of England and Wales. Source: Rauhala and Schultz, 2009. (7) http://www.ukcip.org.uk.
  • 54.
    Climate change challengesand response options 52 Urban adaptation to climate change in Europe Integrate climate change into building codes and spatial planning Inclusion of storm and flood resistance into all building codes can decrease the losses from wind storms and floods. However, climate change has not yet been included in the EUROCODES for the design of buildings and other civil engineering works and construction products (8). Spatial planning plays an important role in flood prevention by restricting building in flood plains, conserving flood retention areas and minimising impermeable surfaces. Malmö, Sweden uses a green scoring factor for new urban developments. The system ensures that a certain proportion of the development will consist of green space. Different solutions receive different scores depending on their efficiency (e.g. sealed surface = 0; green roof = 0.7; vegetation on the ground = 1), which allows the developer some flexibility but also ensures that the requirements for green space provision are met (Kruuse, 2010). For the development of the Western Harbour area, for example, developers had to ensure an allocation of 50 % share to green space. Regulations and fiscal incentives Different policy instruments such as taxes, specific regulations and controls and information campaigns can all be applied. In Germany the North Rhine‑Westphalia region obliges all new development projects to allow for storm water channelling and offers funding to municipalities. The water company in Dresden collects taxes based on the imperviousness level of properties (Mechler et al., 2011; Chouli et al., 2007). A policy in the Netherlands aimed to reduce by 50 % the combined sewer overflow by 2005. Municipalities and industries pay fees to the water authorities, depending on the level of pollution apparent (8) http://eurocodes.jrc.ec.europa.eu/home.php. in waste water. This policy has forced many municipalities to construct new waste water treatment plants with the capacity to treat both wastewater and storm water. A new national policy in the Netherlands aims to disconnect rain water drainage from the sewer network in 20 % of all urban areas in order to separate rain and waste water (Chouli et al., 2007). Municipalities organise public information campaigns, offer technical guidance and financial help to those who wish to disconnect. House owners in Nijmegen in the Netherlands receive EUR 5 per m2 disconnected area, meanwhile in the city of Dresden in Germany collects taxes based on the impervious surface of the property (Chouli et al., 2007). Insurance Insurance serves to finance the repair or replacement of structures that suffer irregular and unforeseeable losses. Several European insurance companies have already included climate change driven wind storms and flood events into their insurance portfolio such as Munich Re in Germany. Well-designed insurance contracts can provide incentives for risk reduction. However, insurance can also provide disincentives for people to prevent losses if, for example, those insured become less diligent in reducing losses due to their 'safety net'. Insurance providers can liaise with governments and communities to promote land use planning, emergency response and other types of risk-reducing behaviour (Mechler et al., 2011). Mainstreaming activities across Europe are not yet feasible because of different administrative and political conditions. Further reading • Shaw, R., Colley, M. and Connell, R., 2007, Climate change adaptation by design: a guide for sustainable communities, TCPA, London (http://www.preventionweb.net/files/7780_20070523CCAlowres1.pdf). • SWITCH Managing Water for the City of the Future — Trainings Desk (http://www.switchtraining.eu/home). • CoR, 2011a, Adaptation to Climate Change: Policy instruments for adaptation to climate change in big European cities and metropolitan areas, European Union, Committee of the Regions, Brussels (http://80.92.67.120/en/documentation/studies/Documents/Adaptation%20to%20Climate%20Change/ EN.pdf). • Kazmierczak, A. and Carter, J., 2010, Adaptation to climate change using green and blue infrastructure. A database of case studies, University of Manchester, United Kingdom (http://www.grabs-eu.org/ membersArea/files/Database_Final_no_hyperlinks.pdf).
  • 55.
    Climate change challengesand response options Urban adaptation to climate change in Europe 53 2.3 Water scarcity and droughts Key messages • Socio-economic factors such as population growth, increased consumption, and land use have a huge impact on water scarcity with climate change exacerbating the problem. • Water resources are expected to decrease in Europe as a result of increasing imbalance between water demand and water availability. • Many cities in southern and eastern Europe, as well as some in western Europe are already experiencing water stress during the summer. Future projections see an aggravation and also northwards extension of the problem. • Cities can overcome regional water scarcity through imported water yet they become more dependent on other regions and the price would then rise. 2.3.1 Why are water scarcity and drought challenges for cities? Water availability and cities Water scarcity and droughts pose serious problems with drastic measures often being required to solve them. The 2008 example of Cyprus can illustrate this point. The country had suffered its fourth consecutive year of low rainfall and drought and was obliged to ship in water from Greece by tanker and concurrently cut the domestic water supply by 30 %. Europe's larger cities generally rely on the surrounding region for their water resources. The availability of adequate clean and fresh water is crucial and is a basic requirement for sustainable development. Fresh water is used for drinking, by industry (production processes and cooling), energy production, recreation, transport and nature. Sufficient water of good quality is therefore indispensable to ensure human health and to fuel the economy. However, water scarcity and droughts are not exclusive to the drier areas in Europe but have become an issue in many other regions. During the drought of 2003, the affected area extended from Portugal and Spain to the Czech Republic, Romania and Bulgaria (EEA, 2010e). Water resources are expected to decrease in Europe as a result of the increasing imbalance between water demand and water availability. Cities compete with agriculture, energy generation and other sectors. Climate change will most likely exacerbate the adverse impacts, with the occurrence of more frequent and severe droughts in many parts of Europe. Determinants of water scarcity and droughts Water scarcity and droughts are two separate issues. Water scarcity refers to long-term water imbalances between water demand and available natural resources. This is when water demand exceeds the supply capacity of the natural resources. Such situations usually emerge in areas with low water availability or rainfall. However, they can also occur in regions with high water consumption due to high population density, or as result of intensive agriculture or industrial activities. Moreover, water imbalances can lead to problems with the water quality. This may exacerbate the water scarcity problem because, for example, the water available is unsuitable for consumption. Drought refers to a temporary decrease in water availability. A distinction can be made between meteorological drought (low rainfall), hydrological drought (low river flow and abnormal low groundwater levels), and agricultural drought (low soil moisture content). The primary cause of the emergence of drought is usually rainfall deficiency in a region. High air temperatures and evapotranspiration rates can exacerbate the acuteness and duration of droughts. Droughts can occur anywhere in Europe. In conclusion, droughts are mainly caused by climate conditions and soil properties, whereas water scarcity is to a large extent human driven depending on the balance between water availability (climate driven) and demand.
  • 56.
    Climate change challengesand response options 54 Urban adaptation to climate change in Europe Box 2.17 Water scarcity a problem in the south — Ankara, Turkey… From 2006 until 2008, Ankara suffered from severe droughts. In August 2007 the water supply had to be cut off because the capacity of eight major water reservoirs dropped to 5 % of normal levels. The situation was aggravated by the bursting of two main pipelines. From April 2007 to March 2008 an emergency plan came into action and the municipality constructed a system of pipelines from the Kizilirmak dam. Drought is not unusual in Turkey caused by the large variation in rainfall over the years. During the previous 80 years the situation in Ankara regarding water demand has changed dramatically. The population increased from 75 000 in 1927 to 3.2 million in 2000 and is expected to grow further to 7.7 million in 2025. This will put an enormous strain on the city's water supply that is already insufficient to meet current demands. Moreover, due to an increase in prosperity, water consumption per person has increased and is expected to increase further from 169 litres per day in 1995 to 203 litres in 2025. While Ankara's population is expected to increase further, precipitation and river flows are expected to decrease due to climate change. Hence, the frequency and intensity of drought periods will likely increase in the coming decades. Source: Ceylan, 2009; GWI, 2007; Tigrek and Kibaroglu, 2011; EEA, 2009; EEA, 2010e. … but also in the north, London, the United Kingdom The amount of water available per citizen in London is by far the lowest in the United Kingdom due to the relatively low annual average precipitation of 690 mm in the Thames catchment area and the large population. Even in comparison with much hotter and drier countries it is strikingly low and comparable to countries such as Israel. London has already experienced water shortages in 2003 and 2006. The probability of a drought event is currently low. However, changes in precipitation patterns will increase the likelihood of such an event to occur. The principle water sources for London — the rivers Thames and Lee and a chalk aquifer underneath the city — are rain fed. Climate change projections for the south-east of England show that rainfall will become more seasonal with wetter winters (10 to 20 % more precipitation by 2050, up to 30 % by 2080) and drier summers (20 to 40 % less precipitation by 2050, up to 50 % by 2080). Despite higher winter precipitation, groundwater recharge might be reduced due to increasing evaporation and public water demand. Hence, prolonged periods with water scarcity become more likely. Since the 1970s, water consumption has increased from 110 litres to 161 litres per person per day, which is above the UK average of 150 litres. At present, there are no incentives to reduce water spillage. Four-fifths of households pay a flat rate, based on the historic taxable value of the property. Only one-fifth of all households have a water meter. Furthermore, one quarter of the water distributed does not reach its destination due to network leakages. London's water network is in in many areas older than 100 or 150 years and often in poor working condition. To improve the situation of London's water supply a water management strategy has been proposed with the following priority: 1. Reduction of losses through better leakage management; 2. Improving water efficiency; 3. Grey water recycling and rain water harvesting for non-potable uses; 4. Develop the water resources with the least environmental impact. Source: Greater London Authority, 2010; London Climate Change Partnership, 2002. Photo: © Manyag
  • 57.
    Climate change challengesand response options Urban adaptation to climate change in Europe 55 Table 2.7 Factors contributing to water scarcity and droughts Meteorological factors Hydrological factors Human factors aggravating water scarcity and droughts Precipitation deficit High temperatures (large evaporation) Low soil moisture level and low soil water retention capacity Low groundwater level and limited quantity Low surface water availability Land cover (less vegetation and wetlands; impervious soil) Salt water intrusion into rivers and groundwater due to sea‑level rise Increase of population and economic activities Increasing water withdrawal for use in cities (citizens, business, industries) and in the surrounding area, e.g. by agriculture Land-use changes (e.g. surface sealing due to urbanisation, deforestation) altering run-off and groundwater level; occupation of areas important for groundwater generation; e.g. wetlands Melioration Water pollution Inefficient water supply infrastructure Lifestyle with high water consumption patterns Inefficient water management policies Table 2.7 presents a list with factors contributing to water scarcity and droughts. Even though freshwater resources are widely available in Europe, their spatial and temporal distribution leads to water scarce areas and periodic drought situations. However, additional non-climatic drivers need to be highlighted as they contribute significantly to increasing climate related impacts. Changing lifestyles, reduced water availability due to climate change and drinking water standards that prohibit using water in and around large cities (due to pollution) are all factors making cities vulnerable to water scarcity and droughts. The impacts of economic and social development on water resources may be of the same magnitude as that of climate change on water availability. Additional factors include: • Water pricing policies generally do not reflect the level of sensitivity of water resources at local level. The 'user pays' principle is rarely implemented and leads to mismanagement of water resources. • Spatial planning can be one of the main drivers of water use. Inadequate choice of city location results in imbalances between water needs and existing water resources. • Cities compete with other sectors for water — energy generation is the major user with 45 %, followed by agriculture with 22 % and public water supply with 21 % (EEA, 2010e). In addition, tourism puts strong seasonal pressure on water use in certain regions, particularly in southern Europe and in coastal areas. • European countries waste between 10 and 25 % of their water due to inefficiency, e.g. through losses in public water supply and irrigation networks, inadequate water appliances in households and inefficient water practices in industry and agriculture (EEA, 2010e). 2.3.2 What are the potential impacts of water scarcity and droughts on Europe's cities? European cities — present and future exposure to water scarcity and drought During the 20th century there has been a clear trend towards drier conditions, with decreases in rainfall and moisture availability in all Mediterranean regions with the exceptions of north-western Iberia and most of Turkey that reveal an increase of moisture availability (Sousa et al., 2011). As a result, severe drought episodes (in a meteorological and hydrological context) have become more frequent and persistent, namely in the Balkans and Iberia. The total area affected by water scarcity and droughts doubled — from 6 to 13 % — during the last 30 years. Peaks appeared in 1976, 1989–1991, 2003 and 2005 (EC, 2007b). The duration of each event, as well as the area affected, varies considerably. In Mediterranean countries droughts can last one or several years, while in central and northern countries droughts last several months. Droughts affect a large part of some countries, whereas in others they often only affect specific regions but with higher frequency. Map 2.13 shows how the precipitation deficit is projected to change in the future in summer and winter.
  • 58.
    Climate change challengesand response options 56 Urban adaptation to climate change in Europe Map 2.13 Precipitation deficit in summer (JJA) and winter (DJF) for the periods 2021–2040, 2041–2060 and 2061–2080 Note: Data are obtained from 8 RCMs (ENSEMBLES) and are bias corrected using distribution fitting method. The spatial resolution is 25 km. Source: EEA. Climate and socio-economic drivers are both drivers for water scarcity and need to be considered together. The water stress indicator (WEI) describes the ratio between total water withdrawals against water availability. It illustrates to which extent the total water demand puts pressure on the available water resources in a given territory and points out the territories that have high water demand compared to their resources. Map 2.14 shows the water stress related to the major river basins based on modelled estimates of water demand. The modelled results show that parts of southern and north-western Europe are already under severe water stress. Under an 'economy comes first' scenario the situation worsens and most parts of Europe will be under severe or medium water stress with the exception of northern Europe. The map refers to annual average conditions, while during drought periods it is likely that demand will be higher with availability lower. The impact on cities An increase in water related stress is expected in areas of high urbanisation and population density, in western Europe and coastal areas. 50° 60° 70° 40° 40° 30° 30° 20° 20° 0° 10° -30° -10° 0° 60° 50° 50° 40° 40° 0 500 1000 1500 km 50° 60° 70° 40° 40° 30° 30° 20° 20° 0° 10° -30° -10° 0° 60° 50° 50° 40° 40° 0 500 1000 1500 km 50° 60° 70° 40° 40° 30° 30° 20° 20° 0° 10° -30° -10° 0° 60° 50° 50° 40° 40° 0 500 1000 1500 km 50° 60° 70° 40° 40° 30° 30° 20° 20° 0° 10° -30° -10° 0° 60° 50° 50° 40° 40° 0 500 1000 1500 km 50° 60° 70° 40° 40° 30° 30° 20° 20° 0° 10° -30° -10° 0° 60° 50° 50° 40° 40° 0 500 1000 1500 km 50° 60° 70° 40° 40° 30° 30° 20° 20° 0° 10° -30° -10° 0° 60° 50° 50° 40° 40° 0 500 1000 1500 km Summer 2021–2040 Summer 2041–2060 Summer 2061–2080 Winter 2021–2040 Winter 2041–2060 Winter 2061–2080 Precipitation deficit in summer (JJA) and winter (DJF) for the periods 2021–2040, 2041–2060 and 2061–2080. Deficits are presented as probability for extreme dry situation using SPI-12 (according to the definition of SPI extreme dry is SPI below – 1.5 means having 1.5 standard deviation less precipitation as in the baseline period) No data Outside data coverage Probability for dry events Low High 0.1 0.2 0.3 0.4 0.0 0.5
  • 59.
    Climate change challengesand response options Urban adaptation to climate change in Europe 57 Map 2.14 Water stress indicator WEI for annual average on river basin level for the a) baseline, b) 2050 under the 'economy comes first' scenario, and c) compared with urban population numbers Source: Flörke et al., 2011. Cities have adapted to current water scarcity in their own way. Cities such as Athens, Istanbul and Paris have managed to obtain sufficient water from other regions via various transportation networks. This will increase dependency on far-off resources and increase the cost. Factors determining the sensitivity of people to water scarcity and droughts are in principle similar to those influencing sensitivity to heat and floods and affect similar groups — the elderly (see Map 2.7 in Section 2.1.2), young children and people with health problems. Regarding water scarcity, socio‑economic factors are, however, related to the ability to pay higher prices. Map 3.6 in Section 3.1 provides an overview regarding the general economic situation in north-western European cities with a much higher gross domestic product (GDP) than those in eastern European cities. Large income discrepancies will challenge social equity. Potential impacts Water scarcity situations encountered at river basin level have already had noticeable impacts on the economy, society and environment with subsequent effects on costs. Main sectors include: • public water supply and side-effects on tourism; • energy production: water shortage can have a huge impact on the energy sector because a lack of cooling water limits the production by thermal power plants, can cause incidents in nuclear power plants, and/or because low water levels in reservoirs limit hydropower production; • income losses; • social impacts can be created by the possible increase of water prices due to the implementation of compensating measures (e.g. desalination units); • impacts on groundwater (with possible aquifer depletion due to over-pumping and seawater intrusion), surface waters (with minimum water flows not always being ensured and increased water temperature and concentrations of pollutants due to less dilution) and wetlands, as well as impacts on soils through erosion and desertification; • health: water-borne infectious diseases associated with water scarcity and higher water temperatures, however no fatality could be attributed in past droughts in Europe; 50° 60° 70° 40° 40° 30° 30° 20° 20° 10° 10° 0° -30° -20° -10° 0° 60° 50° 50° 40° 40° 0 500 1000 1500 km 50° 60° 70° 40° 40° 30° 30° 20° 20° 10° 10° 0° -30° -20° -10° 0° 60° 50° 50° 40° 40° 0 500 1000 1500 km Water stress indicator WEI for annual average on river basin level for the a) baseline, b) 2050 under 'economy comes first' scenario, and c) compared with urban population numbers 0–0.2 (low water stress) 0.2–0.4 (mid water stress) 0.4 (high water stress) No data Outside data coverage 100 000 100 000–250 000 250 000–500 000 500 000–1 000 000 1 000 000 Withdrawals-to-availability ratio Total population in cities, 2004 50° 60° 70° 40° 40° 30° 30° 20° 20° 10° 10° 0° -30° -20° -10° 0° 60° 50° 50° 40° 40° 0 500 1000 1500 km a) b) c)
  • 60.
    Climate change challengesand response options 58 Urban adaptation to climate change in Europe EUROPEAN UNION Part-financed by the european Regional Development fund INVESTING IN YOUR FUTURE Regional level: NUTS 2 Source: ESPON 2013 Database 2010 Origin of data: Eurostat, NSIs, Estimations, 2009–2010 © EuroGeographics Association for administrative boundaries Change in regional populations in 2005–2050, in %, 'Status Quo' (STQ) scenario – 73.0 to – 40.0 (34) – 40.0 to – 30.0 (28) – 30.0 to – 20.0 (35) – 20.0 to – 10.0 (31) – 10.0 to 0.0 (40) 0.0 to 10.0 (45) 10.0 to 20.0 (32) 20.0 to 30.0 (24) 30.0 to 170.0 (14) No data Canarias Guadeloupe Martinique Réunion Guyane Madeira Acores This map does not necessarily reflect the opinion of the ESPON Monitoring Committee Change in regional populations in 2005–2050, in %, 'Status Quo' (STQ) scenario – 73.0 to – 40.0 (34) – 40.0 to – 30.0 (28) – 30.0 to – 20.0 (35) – 20.0 to – 10.0 (31) – 10.0 to 0.0 (40) 0.0 to 10.0 (45) 10.0 to 20.0 (32) 20.0 to 30.0 (24) 30.0 to 170.0 (14) No data Map 2.15 Change in population between 2005 and 2050 under a status quo scenario Source: ESPON DEMIFER, 2010; © ESPON, 2013.
  • 61.
    Climate change challengesand response options Urban adaptation to climate change in Europe 59 Box 2.18 Droughts and high temperatures increase the risk of forest fires and also threaten cities Higher temperatures during longer periods, reduced precipitation, and changing wind patterns increase the risk of forest fires in many European regions. These climatic changes can not only lead to a higher number of forest fires but also to fires of increased intensity and longer fire seasons. The threat is especially growing in the Mediterranean region and Central and Eastern Europe particularly in regions with warmer and drier climates and more conducive weather (EEA et al., 2008). Nevertheless, the risk of forest fire is growing in other regions such as the Alps (Schauser et al., 2010; EEA, 2010a; EEA et al., 2008). Forest fires inside and outside city boundaries can affect cities directly and indirectly such as with the demolition of houses, loss of life, pollution as well as the disruption to energy, water and food supplies. A forest fire on the outskirts of Marseille in July 2009 led to hundreds of homes being evacuated (MailOnline, 2009). Many city authorities seem unaware about the increasing threat (Caballero, 2008). Following analysis of European cities, only one city acknowledged forest fires as a challenge caused by the impact of climate change (CoR, 2011a). Fighting forest fires calls for a coordinated and cooperative approach between cities and the surrounding municipalities regarding adaptation measures. Cities have several adaptation options concerning the increase in risk of forest fires. Better urban and building design alongside forest management can contribute to the reduction of fire risks (Schauser et al., 2010; Caballero, 2008). The city of Tatabánya in Hungary has enhanced the capability of fire brigades to fight forest fires by providing specialist training and equipment which has led to a reduction in damage from forest fires and casualties among fire fighters (CoR, 2011a; VÁTI, 2011). Improving the road network in forest areas enhances accessibility to the fire for the emergency services. Watchtowers or camera systems as well as well-managed emergency response systems help to recognise forest fires at an early stage. The use of fire weather indices helps the fire brigade to prepare for and respond to such events (CoR, 2011a; Schauser et al., 2010). A strengthening of local and regional disaster management does not only help to deal with forest fires but with other natural hazards which are projected to occur more frequently because of climate change e.g. storm events, floods (VÁTI, 2011). Photo: © titdark • clay shrinking and swelling threatens the supporting structures in buildings and other infrastructures. The overall economic impacts of water scarcity and drought events in the past 30 years are estimated at EUR 100 billion at EU level (EC, 2007b). From 1976–1990 to the following 1991–2006 period the average annual impact doubled, rising to EUR 6.2 billion per year in the most recent years. The exceptional drought in 2003 was estimated to have cost EUR 8.7 billion (EEA, 2010e). Droughts in combination with heatwaves can acerbate the threat of serious forest fires. Forests in proximity to cities increase such risks (Box 2.18). 2.3.3 How can cities adapt to water scarcity and droughts? Generally cities have two options regarding reacting to water scarcity: decreasing water use or increasing supply. Water resource management can take place on three levels: the catchment area, the urban or neighbourhood scale and the buildings. The European Commission carries out an extensive programme on responding to water scarcity and droughts, covering four major areas: • increasing water efficiency in buildings; • efficiency of water-using products in households, commercial business, industry and agriculture;
  • 62.
    Climate change challengesand response options 60 Urban adaptation to climate change in Europe Table 2.8 Examples of adaptation measures related to water scarcity and droughts in urban areas and their regions following the structure of Box 2.2 Grey measures Green measures Soft measures • Water saving devices • Grey water recycling systems • Ground water recharge systems • Rain water harvesting systems • Supply from more remote areas (pipelines) • Desalination plants • Rain water storage in wetlands and water bodies for later use • Maintain and manage green areas outside and inside the cities to ensure water storage instead of high run offs • Use of plants which have adapted to drought conditions • Mapping of drought risks and water availability via climate change scenarios • Forecasting and early warning systems • Awareness raising knowledge and capacity building to save water • Spatial planning • Water pricing as incentive to use water more efficiently • Restriction of water use • Drought and water management plans • Organisation of emergency water supply • reducing leakages in water networks; • halting desertification through technologies and good practices (EC, 2012b). Grey infrastructure approaches Desalination and re-allocation of water resources from water-rich regions to water-stressed regions are options to increase the water supply. These solutions are, however, often expensive and need to be addressed at a national level rather than at a municipality level. Spain and Turkey are planning such infrastructure solutions. However, cities such as Ankara, Barcelona or Istanbul cannot afford such investment on their own. Such solutions run the risk of being poor adaptation measures due to increased energy demand and the fact that the projects themselves may be vulnerable to climate and other stresses. Local solutions include rainwater harvesting, ground water recharge and grey water recycling, e.g. for toilet flushing and irrigation. Such solutions can be simpler with additional benefits including increasing soil moisture levels for vegetation, sustaining evaporative cooling and reducing the risk of urban flooding (Shaw et al., 2007). Water saving technology and devices in households and industry as well as a proper maintenance of the supply system avoiding water loss will reduce overall demand. Green infrastructure approaches Vegetated areas slow down water run-off, store storm water and allow water infiltration in the soil keeping it available for vegetation or other uses. Natural depressions, rivers and wide shallow water‑ways can also store storm water. Green roofs can contribute rainwater harvesting. Green infrastructure approaches can offer occasional problems via the solutions offered. Although the shade provided by trees lowers the temperature and reduces evaporation and thus water loss, the trees themselves need water. A careful selection of plants for gardens and public areas, which are drought resistant but still attractive as a part of an urban green space, is necessary combined with watering them with grey water or harvested rainwater. Soft solutions While grey and green solutions generally focus on prevention, those soft solutions addressing water scarcity and droughts aim to enhance preparedness. Specifically coping with droughts requires the availability of timely and reliable climate information which aids decision-makers at all levels in making critical decisions. Central and local government and water authorities are the most important for managing water systems and enhancing the level of preparedness for drought situations. Through public awareness campaigns water conservation can be promoted to encourage individual action. Drought management plans reduce risk and economic, social and environmental impacts. They emphasise efficient use of existing water supplies and contain guidelines and drought contingency plans for public water suppliers, but also restrictions on water use, rationing schemes, special water tariffs or the reduction of low-value uses. Alternatively, or additionally, the price of water can be temporarily raised to suppress demand.
  • 63.
    Climate change challengesand response options Urban adaptation to climate change in Europe 61 Box 2.19 Zaragoza, Spain combines awareness raising and regulatory measures to enhance water efficiency Following water shortages in the mid-1990s, the municipality of Zaragoza increased water supply and managed demand by developing a 'water saving culture' targeting businesses, industries and the local population. The Zaragoza Water Saving City programme was initiated in 1996 by the NGO Fundación Ecologica y Desarollo (FED) with support from the municipality. It included awareness raising campaigns, the implementation of 50 examples of good practice and voluntary public commitments by citizens and businesses. The water tariffs were revised to ensure a full cost recovery through revenues as well as ensuring affordable access for low income households. They now provide a disincentive for water consumption and waste water and an incentive for savings in the form of a water bill for households that reduced their consumption by at least 10 %. Measures to control leakages led to further savings. After 15 years the city achieved a reduction of water consumption by almost 30 %, despite a 12 % population increase. The bulk of achievements were due to changes in water use behaviour. The results allowed one to conclude that combining changes in water use behaviour, water efficiency technology and reduced leakage can generate sufficient savings to make new and costly water supply infrastructure redundant. Factors behind this success included the active promotion of a 'water saving culture', the multi-stakeholder approach and the broad participation of the citizens themselves. The establishment of a central coordination unit, working directly with stakeholders and leading by example and political commitment were key factors of success. Sources: Philip, 2011; CoR, 2011a; http://www.switchtraining.eu/fileadmin/template/projects/switch_training/files/Case_studies/ Zaragoza_Case_study_preview.pdf. Photo: © D. Talukdar Further reading • Shaw, R., Colley, M. and Connell, R., 2007, Climate change adaptation by design: a guide for sustainable communities, TCPA, London (www.preventionweb.net/files/7780_20070523CCAlowres1.pdf). • SWITCH Managing Water for the City of the Future — Trainings Desk (http://www.switchtraining.eu/home). • CoR, 2011a, Adaptation to Climate Change: Policy instruments for adaptation to climate change in big European cities and metropolitan areas, European Union, Committee of the Regions, Brussels (http://80.92.67.120/en/documentation/studies/Documents/Adaptation%20to%20Climate%20Change/ EN.pdf) • Kazmierczak, A. and Carter, J., 2010, Adaptation to climate change using green and blue infrastructure. A database of case studies, University of Manchester, United Kingdom (http://www.grabs-eu.org/ membersArea/files/Database_Final_no_hyperlinks.pdf).
  • 64.
    62 Planning urbanadaptation Urban adaptation to climate change in Europe Figure 3.1 Placing Chapter 3 within the framework of the report Climate change exposure – Temperature – Precipitation – Sea level Sensitivity of cities to – Heat – Flooding – Water scarcity Potential climate change impacts on cities Possible adaptation measures reducing the sensitivity Chapter 2 — Climate change challenges Chapter 3 — Planning urban adaptation Chapter 4 — Multi-level governance Adaptive capacity of cities to cope with the impacts and reduce the vulnerability Planning urban adaptation and success factors Multi-level governance action to facilitate and implement adaptation 3 Planning urban adaptation In Chapter 2, specific adaptation options were discussed for different climate risks including heat stress, floods and water scarcity. Successful delivery of these relevant solutions needs to be supported by the improvement of the overall adaptive capacity of an urban area (Section 3.1) following a systematic adaptation planning process (Section 3.2) and taking into account a number of planning principles (Section 3.3). Key messages • Enhancing adaptive capacity can decrease vulnerability of cities to climate-related risks. Adaptive capacity includes several components such as knowledge and equity, access to technology and infrastructure, economic resources and effective institutions. • Adaptive capacities vary between European cities and both within and between countries. • Some indicators point to cities in north-western Europe being characterised by higher levels of equity, access to knowledge and technology and government effectiveness. The cities in the Benelux and Scandinavian countries score particularly high on indicators relating to education and social trust. Cities in eastern and southern Europe have a lower age dependency index meaning that currently they may cope better with the financial pressures of adaptation of climate change compared to north-western Europe which is burdened with the cost of the ageing population. 3.1 Capacity to adapt in Europe's cities
  • 65.
    Planning urban adaptation Urban adaptation to climate change in Europe 63 IPCC (2007) defines adaptive capacity as 'the ability of a system to adjust to climate change (including climate variability and extremes) to moderate potential damages, to take advantage of opportunities, or to cope with the consequences'. Adaptive capacity should thus be seen as a set of enabling conditions, conducive to adaptive action. Thus, two areas of similar geographic and socio‑economic characteristics, when exposed to the same climate threats, may demonstrate differing impacts depending on their respective adaptive capacities (Næss et al., 2005; Keskitalo, 2010e). Consequently, policy measures should be directed not only at short-term promotion of adaptive measures in response to risk (as discussed in Chapter 2), but also at long-term development and maintenance of structural conditions for adaptation (Keskitalo, 2010e). Adaptive capacity can be assessed at different spatial scales, from national (Yohe and Tol, 2002; Greiving et al., 2011; Haddad, 2005; Westerhoff et al., 2011) to local. However, as adaptation decisions are context-specific, and the adaptation decisions are often made at the local level, the local and regional scales are particularly relevant for assessment of adaptive capacity (Storbjörk, 2007; Engle and Lemos, 2010; Greiving et al., 2011). Elements that appear to support climate change policymaking at the local scale have been identified as, inter alia: • good governance; • presence of national programmes facilitating local action; • democratic and participatory nature of institutions; • cities' competences and authority to regulate climate-relevant issues; • the commitment of cities to take climate action, including the presence of a local champion; • availability of economic resources, knowledge and information, for example via the involvement of cities in national and transnational networks facilitating the exchange of experience (Martins and Ferreira, 2011; Kern and Alber, 2008). These elements are clearly interlinked. The determinants of adaptive capacity in this report are grouped under three dimensions (Schröter et al., 2004; Greiving et al., 2011; Smit and Pilifosova, 2001): • The awareness dimension highlights the role of knowledge in adaptive capacity. This includes not only education and the provision of and access to information about climate change, but also perception of risks and human and social capital. • The ability dimension reflects the potential of a society to design and implement adaptation measures, and is associated with access to technology and infrastructure • The action dimension, which relates to the potential of implementing the adaptation solutions, is associated with the economic resources available and the effectiveness of institutions. 3.1.1 Awareness: knowledge and equity The awareness of the need to adapt, the ability to develop available options and the aptitude to assess and implement them are crucial for adaptive capacity (IPCC, 2001). Firstly, there is a fundamental and persistent need to create understanding of the problem of climate change and to gain public support for climate change adaptation policy. Without this it is very difficult to promote adaptation activities. Creating understanding comes through awareness raising and communication to a wide audience (Rob Swart et al., 2009) including policymakers, planners, and the public. Support for climate change awareness can be promoted through national communication initiatives. Development of multi-level, virtual information hubs on adaptation is particularly helpful. Examples include the UK Climate Impacts Programme and the following websites: klimatilpasning.dk (Denmark), klimatilpasning.no (Norway), climate‑guide.fi (Finland) and KomPass (Germany). These initiatives can increase the support for certain measures that are taken by the government at different administrative levels, including cities.
  • 66.
    Planning urban adaptation 64 Urban adaptation to climate change in Europe It is important to note, however, that implementation of adaptive measures does not follow directly from providing more information on climate impacts. The availability of up-to-date information does not easily translate into adaptive action due to a number of constraints, including the lack of trust in the practical relevance of the information in local decision-making (Demeritt and Langdon, 2004). Thus, there is a clear requirement for the information relating to adaptation to be tailored to the local level. This also includes the access to downscaled climate change scenarios and their impacts. Skilled, informed and trained personnel enhance adaptive capacity of governmental organisations. One way to provide effective and efficient adaptation is to learn from knowledge on climate and climate change impacts elsewhere in the world. For example, the participants in the INTERREG IVc GRaBS project took part in an intensive programme of project meetings and mentoring visits, where the partners would perform the role of either the mentor or the mentee, which facilitated the exchange of knowledge and experience between the individuals working for different local and regional authorities across Europe. The distribution of adaptive capacity is the result of social and economic processes that affect not only the society as a whole, but also individuals based on, inter alia, their age, gender, health and social status (IPCC, 2012). Thus, equity in terms of even access to resources or decision-making processes is an important consideration in relation to resources and power in governing resources for adaptation Map 3.1 Education — percentage of population aged 15–64 having a level of education following secondary schooling (qualified at tertiary level), 2004 Note: Data for Finland, Italy, Poland, Portugal, Slovenia, Slovakia and Spain are from 2001. Source: Eurostat Urban Audit database, 2004. ! ! ! ! ! ! ! ! !! ! ! ! ! ! ! ! ! ! ! ! ! ! ! ! ! ! ! ! ! ! ! ! ! ! ! ! ! ! ! ! ! ! ! ! ! ! ! ! ! ! !!! ! ! ! ! ! ! ! ! ! ! ! ! ! ! ! ! ! ! ! ! ! ! ! ! ! ! ! ! ! ! ! ! ! ! ! ! ! ! ! ! ! ! ! ! ! ! ! ! ! ! ! ! ! ! ! ! ! ! ! ! ! ! ! ! ! ! ! ! ! ! ! ! ! ! ! ! ! ! !!! ! ! ! ! ! ! ! ! ! ! ! ! ! ! ! ! ! ! ! ! ! ! ! ! ! ! ! ! ! ! ! ! ! ! ! ! ! ! ! !! ! ! ! ! ! ! ! ! ! ! ! ! ! ! ! ! ! ! ! ! ! ! ! ! ! ! ! ! ! ! ! ! ! ! ! !! ! ! ! ! ! ! ! ! 50° 60° 70° 40° 40° 30° 30° 20° 20° 10° 10° 0° -30° -20° -10° 0° 60° 50° 50° 40° 40° 0 500 1000 1500 km 10 10–20 20–25 25–30 30 Education — percentage of population aged 15–64 having a level of education following secondary schooling (qualified at tertiary level), 2004 No data Outside data coverage
  • 67.
    Planning urban adaptation Urban adaptation to climate change in Europe 65 Map 3.2 Perceptions on 'city committed to fight against climate change' (synthetic index 0–100), 2009 Source: DG REGIO/Eurostat: Urban Perception survey 2010; data 2009. ! ! ! ! ! ! ! ! ! ! ! ! ! ! ! ! !! ! ! ! ! ! ! ! ! ! ! ! ! ! ! ! ! ! ! ! ! ! ! ! ! ! ! ! ! ! ! ! ! ! ! ! ! ! ! ! ! ! ! ! ! ! ! ! ! ! ! ! ! ! ! ! ! ! 50° 60° 70° 40° 40° 30° 30° 20° 20° 10° 10° 0° -30° -20° -10° 0° 60° 50° 50° 40° 40° 0 500 1000 1500 km Perceptions on 'city committed to fight against climate change' (synthetic index 0–100), 2009 More negative answers More positive answers Index 50 19–20 21–40 41–60 61–80 81–100 No data Outside data coverage (IPCC, 2001). Equity concerns also relate to the distribution of material and economic resources which are also often distributed unequally, resulting in a lower adaptive capacity in certain areas or with certain groups or individuals (Keskitalo, 2010e). All aspects of adaptive capacity, including the dimension of awareness, are difficult to assess. Maps 3.1–3.3 offer examples of indicators that give some indication of the current levels of local awareness, education and equity. These indicators can be considered as proxies for the awareness dimension of the adaptive capacity of Europe's cities. Cities with the highest percentage of people having a level of education following secondary schooling are present in Scandinavia, the Baltic States and the Benelux countries. Cities, where most citizens feel that their administration is committed to fighting climate change, are predominantly located in western and northern Europe. The percentage of women among elected members in the city, which can be seen as indicative of equity, is lower in eastern, south‑eastern and southern Europe (with the exception of Spain) compared to the higher percentage in north-western Europe (slightly lower in Ireland and the United Kingdom). These indicators suggest that European cities are divided in terms of adaptive capacity based on awareness. This division could potentially be bridged by further development of knowledge exchange programmes and strengthening equity and participatory processes.
  • 68.
    Planning urban adaptation 66 Urban adaptation to climate change in Europe Map 3.3 Equity — percentage of women among elected city representatives, 2004 Note: Data for Czech Republic, Greece, Hungary, Lithuania, the Netherlands, Slovenia and partially Belgium are from 2001. Source: Eurostat, Urban Audit database, 2004. 3.1.2 Ability: access to technology and infrastructure Technological resources can contribute to the design and utilisation of adaptation measures. Societies that lack access to technology and perform poorly in developing new technologies have lower adaptive capacity. This is because many of the strategies that can be identified in response to climate change involve technology (IPCC, 2001). Development of technologies can be undertaken by both the public and the private sector and innovation is considered an important factor in this. Thus, technological development may determine ways in which adaptation options can be developed, for instance, whether high-tech or low-tech solutions are possible. It is important to highlight the distinction between general technological capacity versus a particular technological response that can be developed for a specific climate change impact (IPCC, 2012). Chapter 2 provides information on a variety of technological or 'grey' adaptation options for specific climate risks. Map 3.4 presents a synthetic index prepared in the 'ESPON CLIMATE' project (Greiving et al., 2011) on technology as one determinant of adaptive capacity. The index is compiled of three distinct indicators: Research and development (RD) expenditure relative to GDP, personnel working in RD functions and the number of patent applications. The map highlights regions in central and northern Europe that are currently equipped with high technological capacities, and also active in innovation. These regions are more likely to develop technological responses to pressing climate change problems. ! ! ! ! ! ! ! ! ! ! ! ! ! ! ! ! ! ! ! ! ! ! ! ! ! ! ! ! ! ! ! ! ! ! ! ! ! ! ! ! ! ! ! ! ! ! ! ! ! ! ! ! ! ! ! 50° 60° 70° 40° 40° 30° 30° 20° 20° 10° 10° 0° -30° -20° -10° 0° 60° 50° 50° 40° 40° 0 500 1000 1500 km ! ! ! ! ! ! ! ! ! ! ! ! ! ! ! ! ! ! ! ! ! ! ! ! ! ! ! ! ! ! ! ! ! ! ! ! ! ! ! ! ! ! ! ! ! ! ! ! ! ! ! ! ! ! ! ! ! ! ! ! ! ! ! ! ! ! ! ! ! ! ! ! ! ! ! ! ! ! ! ! ! ! ! ! ! ! ! ! ! ! ! ! ! ! ! ! ! ! ! ! ! ! ! ! ! ! ! ! ! ! ! ! ! ! ! ! !! ! ! ! ! ! ! ! ! ! ! ! ! ! ! !! ! ! ! ! ! ! ! ! ! ! !! ! ! ! ! ! ! ! ! ! ! ! ! ! ! ! ! ! ! ! ! ! ! ! ! ! ! ! ! ! ! ! ! ! ! ! ! ! ! ! ! ! ! ! ! ! ! ! ! ! ! ! ! ! ! ! ! ! ! ! !! ! ! ! ! ! ! ! ! ! ! ! ! ! ! ! ! ! ! ! ! ! ! ! ! ! ! ! ! ! ! ! ! ! ! ! ! ! ! ! ! ! ! ! ! ! ! ! ! ! ! ! ! ! ! Equity — percentage of women among elected city representatives, 2004 0–10 11–20 21–30 31–40 41–60 No data Outside data coverage
  • 69.
    Planning urban adaptation Urban adaptation to climate change in Europe 67 EUROPEAN UNION Part-financed by the european Regional Development fund INVESTING IN YOUR FUTURE Regional level: NUTS 3 Origin of data: ESPON Database 2006, Eurostat 2010, NSIs 2010 © EuroGeographics Association for administrative boundaries Canarias Guadeloupe Martinique Réunion Guyane Acores Madeira This map does not necessarily reflect the opinion of the ESPON Monitoring Committee Adaptive capacity: Technology Highest capacity High capacity Medium capacity Low capacity Lowest capacity No data Technological capacity to adapt to climate change classified by quintiles. The technology dimension of adaptive capacity towards climate change combines indicators on research and development expenditure, research and development personnel and patent applications. Map 3.4 Technology as one determinant of adaptive capacity, based on the NUTS 3 level Source: Greiving et al., 2011; © ESPON, 2013. Adaptive capacity: Technology Highest capacity High capacity Medium capacity Low capacity Lowest capacity No data Technological capacity to adapt to climate change classified by quintiles. The technology dimension of adaptive capacity towards climate change combines indicators on research and development expenditure, research and development personnel and patent applications.
  • 70.
    Planning urban adaptation 68 Urban adaptation to climate change in Europe Map 3.5 Infrastructure as one determinant of adaptive capacity Source: Greiving et al., 2011; © ESPON, 2013. Madeira Adaptive capacity: Infrastructure Highest capacity High capacity Medium capacity Low capacity Lowest capacity No data EUROPEAN UNION Part-financed by the european Regional Development fund INVESTING IN YOUR FUTURE Origin of data: EEA 2006, Eurostat 2010, NSIs 2010 Infrastructural capacity to adapt to climate change classified by quintiles. The infrastructural dimension of adaptive capacity towards climate change combines indicators on the road network density, hospital beds and sustainable water use. Acores Madeira Guyane Guadeloupe Martinique Réunion Canarias This map does not necessarily reflect the opinion of the ESPON Monitoring Committee Adaptive capacity: Infrastructure Highest capacity High capacity Medium capacity Low capacity Lowest capacity No data Infrastructural capacity to adapt to climate change classified by quintiles. The infrastructural dimension of adaptive capacity towards climate change combines indicators on the road network density, hospital beds and sustainable water use.
  • 71.
    Planning urban adaptation Urban adaptation to climate change in Europe 69 Infrastructure often forms the basis for the development of adaptation options and measures, as it underlies the basic functions of societies. Different types of infrastructure are also vulnerable to particular impacts of climate change, and a greater variety can help to buffer the impacts of climate change in both the short and long term. Infrastructure is also important in the capacity of a system to cope with sudden impacts of climate change such as extreme weather events. Cities depend on their infrastructures for their safety and well-being. In terms of indicator development, especially at regional and city level, infrastructure poses a number of challenges. Constructing uniform indicators on urban infrastructure is constrained by data availability and quality issues. Urban audit data does not properly cover this thematic area. An attempt has been made in the 'ESPON CLIMATE' project (Greiving et al., 2011) to assess the level of adaptive capacity related to infrastructure. An index at regional level is used for three underlying indicators: the density of the road network, the number of hospital beds, and the water exploitation index. Map 3.5 shows this index, which seems to highlight certain countries and regions, with no evident patterns. It should be noted that data constraints and quality concerns persist here as well. 3.1.3 Action: economy, resources and institutions Economic resources, capital assets and financial means are important parts of adaptive capacity (Smit and Pilifosova, 2001). Wealthy societies are better placed to adapt as they are able to bear the costs of adaptation and plan and pay for measures to increase their capacity. However, high income per capita alone is neither a necessary nor a sufficient indicator of the capacity to adapt (IPCC, 2001). While it seems evident that rich cities are better positioned than poor cities to adapt, very little information on costs of adaptation is available, other than for a small number of options such as flood defences. 'Green' and 'soft' solutions (see Chapter 2) can often provide low-cost solutions and there is usually enough knowledge for their implementation. High-tech and new solutions usually require more resources, knowledge, experience and training. Map 3.6 shows the current GDP per capita figures for urban audit cities. It shows a marked divide in wealth between cities in eastern and western Europe, and a less marked one between northern and southern European cities. In some countries (notably Germany and the United Kingdom) the disparities between cities are greater than in others, which points to the importance of subnational, city‑level measures, often masked by national averages. Insurance can be seen as a consequence of the economic aspect of adaptive capacity since it is predominantly an instrument used by wealthier nations and individuals. Insurance can be very important in terms of coping capacity for example in the aftermath of extreme weather events. Depending on the use of insurance instruments, it can also guide long term development in adaptive capacity (i.e. the total withdrawing of insurance coverage from the riskiest locations). Figure 3.2 on insurance penetration shows the overall share of GDP used for insurance per country. The figures cover different types of insurance, including health and property, not only insurance instruments directly related to climate change impacts. The national figures demonstrate a rather clear east-west divide in Europe. The differences are further accentuated by the respective differences in GDP per country.
  • 72.
    Planning urban adaptation 70 Urban adaptation to climate change in Europe ! ! ! ! ! ! ! ! ! ! ! ! ! ! ! ! ! ! ! ! ! ! ! ! ! ! ! ! ! ! ! ! ! !! ! ! ! ! ! ! 50° 60° 70° 40° 40° 30° 30° 20° 20° 10° 10° 0° -30° -20° -10° 0° 60° 50° 50° 40° 40° 0 500 1000 1500 km ! ! ! ! ! ! ! ! ! ! ! ! ! ! ! ! ! ! ! ! ! ! ! ! ! ! ! ! ! ! ! ! ! ! ! ! ! ! ! ! ! ! ! ! ! ! ! ! ! ! ! ! ! ! ! ! ! ! ! ! ! ! ! ! ! ! ! ! ! ! ! ! ! ! ! ! ! ! ! ! ! ! ! ! ! ! ! ! ! ! ! ! ! ! !! ! ! ! ! ! ! ! ! ! ! ! ! ! ! ! ! ! ! ! ! ! ! ! ! ! ! ! ! ! ! ! ! ! ! ! ! ! ! ! ! ! ! ! ! ! ! ! ! ! ! ! ! ! ! ! ! ! ! ! ! ! ! ! ! ! ! ! ! ! ! ! ! ! ! ! ! ! ! ! ! ! ! ! ! ! ! ! ! ! ! ! ! ! ! ! ! ! !!! ! ! ! ! ! ! ! ! ! ! ! !! ! ! ! ! ! ! ! ! ! ! ! ! ! ! ! ! ! 5 000 5 000–10 000 10 000–20 000 20 000–30 000 30 000 Economic determinant — GDP per capita figures for European cities, 2004 (EUR) No data Outside data coverage Map 3.6 Economic determinant — GDP per capita figures for European cities, 2004 (EUR) Note: Data for Spain are from 2001 due to data-quality issues. Source: Eurostat, Urban Audit database, 2004. Source: CEA Statistics No 42, European Insurance in Figures. November 2010. Figure 3.2 Insurance penetration as proportion of GDP Cyprus Estonia Luxembourg Greece Hungary Romania Slovakia Croatia Poland Spain Bulgaria Czech Republic Germany Latvia Ireland Lithuania Italy Netherlands France Portugal Austria Belgium Switzerland Denmark United Kingdom Finland Malta Norway Sweden Slovenia 0 2 4 6 8 10 12 14 16 % Iceland Turkey Liechtenstein 165 %
  • 73.
    Planning urban adaptation Urban adaptation to climate change in Europe 71 Note: The number of people under 20 years old and over 65 years old is divided by the number of people 20–65 years old and multiplied by 100. Data for Bulgaria, Cyprus, Czech Republic, Finland, France, Ireland and Latvia are for 2001. Source: Eurostat Urban Audit database, 2004. Map 3.7 Human resources — age dependency index, 2004 ! ! ! ! ! ! ! ! ! ! ! ! ! ! ! ! ! ! !! ! ! ! ! ! ! ! !! ! ! ! ! ! 50° 60° 70° 40° 40° 30° 30° 20° 20° 10° 10° 0° -30° -20° -10° 0° 60° 50° 50° 40° 40° 0 500 1000 1500 km ! ! ! ! ! ! ! ! ! ! ! ! ! !! ! ! ! ! ! ! ! ! ! ! ! ! ! ! ! ! ! ! ! ! ! ! ! ! ! ! ! ! ! ! ! ! ! ! ! ! ! ! ! ! ! ! ! ! ! ! ! ! ! ! ! ! ! ! ! ! ! ! ! ! ! ! ! ! ! ! ! ! ! ! ! ! ! ! ! ! ! ! ! ! ! ! ! ! ! ! ! ! ! ! ! ! ! ! ! ! ! ! ! ! ! ! ! ! ! ! ! ! ! ! ! !! ! ! ! ! ! ! ! ! ! ! ! ! ! ! ! ! ! ! ! ! ! ! ! ! ! ! ! ! ! ! ! ! ! ! ! ! ! ! ! ! ! ! ! ! !! ! ! ! ! ! ! ! ! ! ! ! ! ! ! ! ! ! !! ! ! ! ! ! ! ! ! ! ! ! ! ! ! ! ! ! ! ! ! ! ! ! ! ! ! ! !! ! ! ! ! ! ! ! ! ! ! ! ! ! ! ! ! ! ! ! ! ! ! Human resources — age dependency index, 2004 42–52 53–56 57–59 60–65 66–81 ! ! ! No data Outside data coverage An indication of resources that include human actions and not uniquely economic activity is also relevant when considering adaptive capacity. Map 3.7 concentrates on the issue of human resources, as reflected by age dependency, i.e. the dependency level of young and old people on the economically more active part of the population. The age dependence indicator reflects demographic changes (ageing, fertility) and is relevant for the burden of support in economic and other terms between the active, working age population and everyone else. Contrary to the GDP indicator, cities in central, eastern and south-eastern Europe currently demonstrate higher adaptive capacity. This is due to a lower proportion of the young and the elderly in relation to the proportion of those more economically active. In the future this could well change due to projected demographic changes in Europe. There are, however, no projections at city level available. Having well-functioning and efficient institutions (defined as the formal and informal structures and practices that hold society together) can enable adaptation to take place and reduce the impacts of climate-related risks (IPCC, 2001). Countries that have well developed and functioning institutions are considered to have higher adaptive capacity in relation to developing or transition countries. Such institutions and governance structures not only have the capacity to deal with present day challenges but also enable planning for the future. In Chapter 4, the roles and responsibilities of institutions at different administrative levels are discussed in a multi-level governance perspective, taking into account that different European countries have different governance systems ranging from federal to centralised. Social capital has been seen as an elusive but important aspect of institutional adaptive capacity. It refers to norms and networks that enable people to act collectively. One aspect of
  • 74.
    Planning urban adaptation 72 Urban adaptation to climate change in Europe social capital is to trust both in other people and in institutions. Thus, it can be seen as an underlying factor of institutional adaptive capacity, relevant for predicting whether communities will act together facing future climate change adaptation challenges (Adger, 2001; Adger et al., 2008; Yohe and Tol, 2002). Maps 3.8 and 3.9 present indicators that can be used as proxies for the current strength of governance at the city level. They measure the effectiveness of the central government and levels of social capital (measured by trust in other people). They suggest that the adaptive capacity in north west Europe is likely to be higher than of those in south‑east Europe. 3.1.4 Summarising the adaptive capacity of cities Current adaptive capacity varies among European cities. As with the impact indicators described in Chapter 2, the adaptive capacity seems not uniquely dependent on the country and region but also 50° 60° 70° 40° 40° 30° 30° 20° 20° 10° 10° 0° -30° -20° -10° 0° 60° 50° 50° 40° 40° 0 500 1000 1500 km World Bank Government effectiveness index, 2010 – 0.9 to – 0.5 – 0.4 to 0.5 0.6 to 1.0 1.1 to 25.0 Outside data coverage Better relates to the cities themselves. This emphasises the importance of subnational and city-level approaches and indicators. Whilst it is difficult to distinguish clusters of cities of similar adaptive capacity, several geographical trends can be observed. In general, cities in north-western Europe are characterised by higher levels of equity, access to knowledge and technology and government effectiveness. Cities in the Benelux and Scandinavian countries score particularly high on indicators relating to the qualifications of the population and social trust. However, cities in eastern and southern Europe have a lower age dependency index. This means that currently they may cope better with the financial pressures of adaptation of climate change compared to north-west Europe which is burdened with the cost of providing for an ageing population. This spatial distribution suggests, firstly, that regional programmes relating to climate change adaptation can be tailored to different locations. For example, whilst south-eastern Europe would Source: World Bank, 2012. Map 3.8 World Bank Government effectiveness index, 2010
  • 75.
    Planning urban adaptation Urban adaptation to climate change in Europe 73 benefit from awareness raising and the increased commitment of local governments to climate change adaptation, in north-western Europe the economic, social and demographic conditions would be appropriate for promotion of bottom‑up, community-based approaches. Moreover, the differences between European cities present an excellent opportunity for exchange of experiences and learning. Cities in the north-west can relate their own experiences in developing adaptation strategies and using technological solutions. Valuable lessons can be learned from experiences of countries in the south as regards dealing with heat and water scarcity, for example in traditional urban design, and by evaluating current strategies and techniques. One must use the presented indicators with caution. Data on cities are not comprehensive across Europe, and the selection of indicators is constrained by ! ! ! ! ! ! ! ! 50° 60° 70° 40° 40° 30° 30° 20° 20° 10° 10° 0° -30° -20° -10° 0° 60° 50° 50° 40° 40° 0 500 1000 1500 km ! ! ! ! ! ! ! ! ! ! ! ! ! ! ! ! ! ! ! ! ! ! ! ! ! ! ! ! ! ! ! ! ! ! ! ! !! ! ! ! ! ! ! ! ! ! ! ! ! ! !! ! ! ! ! ! ! ! ! ! ! ! ! ! Social capital — trust in other people (synthetic index 0–100), 2009 More negative answers More positive answers Index 50 22–40 41–60 61–80 81–100 No data Outside data coverage Map 3.9 Social capital — trust in other people (synthetic index 0–100), 2009 Source: DG REGIO/Eurostat: Urban Perception survey 2010; data 2009. data availability and quality. The presented results can, therefore, only serve as a starting point for discussion and require further in-depth analysis. Additional research is needed to show which determinants are more predictive than others as to how they support actual adaptive measures. Moving from generic to more predictive indicators of adaptive capacity would require improved data on adaptive capacity indicators with broader coverage, better data on actual adaptive measures taken in cities and finally further research on the correlation of certain determinants and actual adaptive measures (to serve as basis for weighting the different determinants). Thus, there is a clear need for improved city-level indicators for coherent comparisons of adaptive capacity. It would be especially important in this respect to develop a coherent system of monitoring actual adaptive policies and measures).
  • 76.
    Planning urban adaptation 74 Urban adaptation to climate change in Europe 3.2 Planning steps to urban adaptation Key message Planning urban adaptation should be a systematic and cyclical process. This report proposes six basic steps: • Getting started; • Assessing risks and vulnerabilities to climate change; • Identification of adaptation options; • Assessment of adaptation options; • Implementation; • Monitoring and evaluation of adaptation actions. To be successful and effective, adaptation planning for urban areas should be systematic and follow a logical process. A number of approaches to adaptation planning have been developed (Smit et al., 2000; Ribeiro et al., 2009; CBT, 2009). This report follows the 'one step at a time' approach to adaptation planning which is derived from the United Kingdom Climate Impacts Programme's (UKCIP) adaptation wizard and used in the European climate adaptation platform CLIMATE‑ADAPT (EEA and EC, 2012). The steps are based on a policy cycle, highlighting that climate change adaptation is an iterative process (Figure 3.3). These six steps are summarised below. The European Climate Adaptation Platform CLIMATE‑ADAPT provides extensive information Figure 3.3 Adaptation planning steps 1. Getting started 3. Identify adaptation options 4. Assess adaptation options 5. Implement adaptation options 6. Monitor and evaluate adaptation action 2. Assess risk and vulnerability in relation to each of the steps, including data, documents, websites, tools and guidance materials. 3.2.1 Get started: initiate adaptation, ensure commitment and management Decision makers may ask why they should include adaptation to climate change on their agenda, given the other challenges facing Europe. In science it is well established that a certain amount of warming is unavoidable, due to greenhouse gases that are already present in the atmosphere. The effects of global warming have already been observed, and will continue to do so for decades to come. Adaptation is crucial to soften the impacts of the unavoidable changes in climate and to take advantage of the opportunities. However, not all decision makers may be convinced by scientific evidence alone. In some countries national adaptation plans and strategies provide a stimulus for the development of adaptation plans at the city level. However, where there is little or no policy pressure adaptation planning at the local level tends to be triggered by various influences. This can include recent extreme weather events, a presence of a motivated individual within the institution, a concerned NGO, an engaged private‑sector body or a research institution with an interest in climate impacts and adaptation, publication of a study concerning climate change impacts in the area or providing good practice examples from other cities. These triggers may be used to generate interest. If the interest is present, gaining political backing and managerial commitment is essential to progressing the adaptation agenda (M. Ribeiro et al., 2009) (see Box 3.1) followed by establishment of a clear mandate for the management of the adaptation process. This responsibility often rests with the local
  • 77.
    Planning urban adaptation Urban adaptation to climate change in Europe 75 municipal authority or particular NGO. The power and responsibilities of the managing unit should be well defined over a sufficiently long time-scale to cover the development, implementation and evaluation of the adaptation plan. 3.2.2 Assess potential climate change risks and vulnerabilities In this particular step, those responsible should assess any urban vulnerability (see Chapter 2) and elements such as the built environment, transport networks and critical infrastructure, including electricity and water supply. This should be done in relation to analysing all other climate impacts which can affect the functioning of the urban area and the well-being of its residents. Costs of climate change impacts can also be taken into consideration (see Box 3.2). A map with relevant locations to be viewed as priority areas for adaptation could be one suggested way of analysing data. The uncertainty of the scale of climate change impacts should be taken into consideration, alongside the uncertainty of future socio-economic scenarios. Developing contrasting scenarios for the city and exploring the need for adaptation under different climatic and socio-economic conditions could assist with this task. A number of pan-European and national projects have created Box 3.1 Gaining support and securing leadership from the local government in Southampton, United Kingdom The cities, provinces and regions participating in the 'GRaBS' project (Green and Blue Space Adaptation for Urban Areas and Eco Towns) went through a specific process when preparing their adaptation action plans. One important step was the development of a high level policy statement noting the aims and objectives of the adaptation plan, which could be then accepted and signed off by the elected members. The city of Southampton's low carbon strategy, is one example, which combines mitigation and adaptation goals. The foreword was provided by the cabinet member for Environment and Transport at the council, followed by eight key priorities for a city that can thrive in a low carbon economy and be competitive and prosperous despite the changing climate. Involving local politicians in adaptation planning ensures their support. In Southampton's case, the commitment of the politicians helped to move adaptation from a peripheral position on the city's agenda to the forefront, thus ensuring that adaptation planning was not affected by budget cuts. Source: Southampton City Council, 2011. Photo: © Ian Britton different socio-economic and climate scenarios across a variety of sectors (see the European Climate Adaptation Platform CLIMATE-ADAPT). As part of preparing for adaptation planning the city's adaptive capacity should also be evaluated. This step is crucial for cities to set priorities for public and private spending, as the optimal allocation of resources is part of good governance. It should be noted that the assessment of impacts and vulnerability should not be limited to an economic analysis but also include the impacts on goods not on the market, such as ecosystem services. 3.2.3 Identify a wide range of adaptation options After the priority areas, sectors and elements of the urban system have been decided, adaptation options able to reduce particular climate risks should be identified. Adaptation options aim to manage climate risk to an acceptable level and enable advantage to be taken of any positive opportunities that may arise. Chapter 2 describes a number of 'grey', or structural, 'green' and 'soft' adaptation options which can be considered. Alongside concrete actions, adaptation options include solutions that help to build general adaptive capacity. The latter is seen as an important response to cope with the inherent uncertainty in climate projections. Building adaptive capacity involves developing the ability
  • 78.
    Planning urban adaptation 76 Urban adaptation to climate change in Europe Box 3.2 Costs and benefits of adaptation Due to the relatively recent focus on adaptation, little is known about the cost of potential climate damage, the cost of inclusion of adaptation in urban policies and projects and the cost of actual adaptation measures. Preliminary estimates suggest that benefits often exceed costs. Taking advantage of opportunities related to urban renewal as well as designing multi-purpose solutions can result in adaptation benefits exceeding the costs. Two recent European projects (ClimateCost FP7 and PESETA) have looked at the costs in damage terms related to climate change for coastal systems, human health, agriculture tourism, and floods (Watkiss, 2011; Ciscar et al., 2009). In relation to health, the mortality rate related to heat exposure in Europe is likely to increase in all European regions, in particular southern Europe (Watkiss, 2011). The cost of heat-related deaths varies according to the method used. If the 'value of a statistical life' method is used estimated welfare costs will be EUR 30 billion average per year during the period 2011–2040, EUR 102 billion for 2041–2070 and EUR 146 billion for 2071–2100. However, if the 'value of a life year lost' method is used, these values decrease more than tenfold (Watkiss, 2011). This means that a careful consideration of costs is needed to guide the eventual choice of adaptation solution. Adaptation planning does not necessarily have to be a costly and time-consuming process when it is integrated as one of the drivers into the development of urban policies. The 'Climate as Opportunity' project assessed 100 large infrastructural investment projects in the Netherlands, mostly related to spatial planning and water management with several of them in cities. The findings demonstrated that integrating climate change in planned urban renewal and upgrading projects improved project sustainability thus reducing the future costs. This was achieved via the following: • lengthening the time scale; • widening the scope of projects; • exploring options for multi-functional land use; • placing the projects in a much wider spatial context; • involving a larger group of stakeholders; • offering opportunities for private sector initiatives; • improving the quality of projects generally without additional costs (Watkiss, 2011; Sedee and Pijnappels, 2010). Adaptation costing studies to date have predominantly focused on a limited set of easily monetised measures such as flood defences or other infrastructure. Costing of measures such as urban greening is more complex. A recent study (Altvater et al. 2011; 2011a; 2011b) estimated the costs of green space maintenance and the installation of green roofs in those European cities included in the Urban Audit database by extrapolating the findings of individual case studies to the European level. These amount to over EUR 5 billion for green spaces and EUR 100 billion for green roofs annually, following an initial investment of about EUR 7 billion. The estimates for green spaces are based on the loss of profits from potential development on the allocated land. The calculations are based around the adaptation needs related to current rather than projected climate issues and they do not consider the intangible benefits, such as human well-being. Similarly, the estimates for green roofs reflect private and public expenditure, and ignore the savings made, for example, by insulation. It is therefore important to take into account all costs as well as all benefits of the adaptation options available to estimate their real economic feasibility. The ClimateCost findings also show that adaptation is generally very effective at reducing the impacts of climate change at low cost. However, uncertainty in the climate models affects adaptation costs and benefits as well as costs resulting from inaction. This highlights the need for adaptation strategies which are effective within a framework of decision-making made with some levels of uncertainty (Watkiss, 2011) (see also Section 3.3.5). Co-benefits are, furthermore, decisive for getting adaptation action prioritised in the political process and subsequently implemented. Source: Altvater et al. 2011; 2011a; 2011b; Ciscar et al., 2009; Sedee and Pijnappels, 2010; P. Watkiss, 2011. Photo: © City of Malmö
  • 79.
    Planning urban adaptation Urban adaptation to climate change in Europe 77 of people and ecosystems to respond effectively to climate change and is discussed in detail in Section 3.1. 3.2.4 Assess and prioritise adaptation options The appraisal and prioritisation of adaptation options follows the initial exploratory exercise as described in the previous step. Once potential adaptation options have been identified, an assessment should be carried out in order to determine which of them suit the city's specific context. Possible adaptation options should be assessed based on their potential to meet the adaptation objectives and their feasibility. In addition they should be effective and efficient in order to be considered for implementation. Effective options are options that reduce certain vulnerabilities to a desired level. Efficient options are those options whose benefits (economic, social and environmental) exceed their costs and are more cost-effective than the alternatives (see Box 3.2 for costs and benefits of adaptation). Other typical key issues affecting the choice of adaptation options for cities are: national legislation, financial feasibility, spatial requirements, time scales, ecological concerns, cultural heritage protection and public acceptability. Thorough assessment of feasible options can help avoiding decisions that lead to maladaptation. Different sets of criteria or success factors have been used to assess adaptation options. The most important ones are discussed in Section 3.3. The selected adaptation options should preferably have elements of 'low-regret', which means that they are either reversible or can deliver a number of related co-benefits (see Section 3.3.3). Solutions that offer the opportunities to work with the forces of nature rather than against them are preferred (see Section 3.3.5), hence the focus on green infrastructure solutions in this report. An important criterion for the selection of adaptation measures should be that the measure is consistent, or even complementary to adaptation or mitigation efforts in other sectors (Smit and Pilifosova, 2001). Tools and guidance documents are provided in the European Climate Adaptation Platform CLIMATE-ADAPT to assist in selecting assessment procedures and feasible options. Many different approaches exist to evaluate, or prioritise adaptation policy options. This includes cost-benefit analysis, focusing narrowly on quantifiable economic costs and benefits, and multi-criteria analysis that uses more than one criterion to assess and rank various options. Examples of tools and guidance for inventorying and screening adaptation options include the Adaptation Wizard (UKCIP), the Adaptation Decision Explorer (weADAPT) and the Digital Adaptation Compendium (EU ADAM project). In addition see EEA (2007) for more details on the economy of adaptation in relation to the aggregate costs of adaptation and inaction. 3.2.5 Implement adaptation actions This next step relates to the development of an implementation plan which converts adaptation options into action by listing the objectives, assigning the responsibilities and setting the deadlines for completion. Implementation of the chosen adaptation options will be strongly influenced by existing policies and procedures. At present, the experience of implementing adaptation actions is limited. Many of the examples provided in this report actually relate to cases in which climate change adaptation was just one of many factors that determined how particular projects were implemented. Notwithstanding this paucity of practical experiences, the success factors discussed in Section 3.3 offers some guarantee that adaptation policies that take them into account can indeed be implemented effectively. The implementation of adaptation plans in European cities can be potentially threatened by their incompatibility with local, national or European policies. The adherence of the adaptation plan to the national and European policies in place should be ensured to avoid potential conflicts. EU regulations are also subject to change, which offers the potential for greater incorporation of climate change adaptation in a number of directives (Box 3.3). However, at the local level, amendment of the local policies (for example spatial development plans) could be considered in order to comply with adaptation principles. The adaptation plan can be developed as a separate document, but adaptation can also be streamlined by incorporation of its principles into the relevant policy documents. During policy analysis it is useful to link adaptation options to established policy programmes and funding programmes (e.g. structural and infrastructural development funds). Funding from additional sources will broaden the portfolio of available adaptation options for the cities and in many cases it makes many inaccessible options subsequently available. Chapter 4 elaborates the roles of the various actors at the relevant administrative levels.
  • 80.
    Planning urban adaptation 78 Urban adaptation to climate change in Europe 3.2.6 Monitor and evaluate adaptation action Our knowledge of climate change, its impacts and the effectiveness of adaptation solutions is developing rapidly and the adaptation planning process should be sufficiently flexible to allow for changes. A crucial step in the process is the establishment of a long-term monitoring system of the implemented actions, in order to ensure that the actions are focused on the priority areas and to evaluate the effectiveness and efficiency of adaptation. Monitoring enables the adjustment and refining of the adaptation options where necessary thus eliminating maladaptation. For example, this could mean testing the 'grey' adaptation options, such as flood defence systems, or 'soft' responses such as flood or heat warning systems. Furthermore, learning derived from monitoring and reviewing processes can enhance the adaptation process itself. It not only helps to assess the suitability of adaptation measures in a given location, but also offers a practical example for other cities, thus supporting the knowledge exchange. Good practice states that evaluation and monitoring is carried out by an organisation independent from stakeholders involved in adaptation implementation. Although experiences with monitoring and evaluation are as yet limited, some countries in Europe (Finland, Germany and the United Kingdom) are experimenting with the development of evaluation methods at a national level. The European Climate Adaptation Platform CLIMATE-ADAPT provides access to up-to-date information regarding these efforts. Box 3.3 Environmental impact assessments — a tool for integrating climate change adaptation into other policies A recent OECD report emphasises the importance of mainstreaming adaptation measures with pre-existing tools and mechanisms that are already being used in planning and implementing various development projects and programmes (Agrawala et al., 2010). Environmental impact assessments (EIAs) are seen as particularly relevant for the purpose of procedural integration at an international scale, due to the broad thematic and institutional reach of EIAs. The White Paper on Adaptation (EC, 2009b) sees the revision of the EU Directives on EIA and SEI (EC, 2011a; EC, 2001) as a way of ensuring that plans and projects which are the subject of environmental assessments also require climate proofing as a pre‑condition (Mickwitz, 2009; Agrawala et al., 2010; Birkmann and Fleischhauer, 2009). The obstacles for implementation include the limited availability of detailed information on the historical climate; the uncertainties associated with the future climate projections for specific locations and thus the risk of counterproductive investments in altering project design (Agrawala et al., 2010). Therefore, there is a need for a degree of flexibility when reflecting on new information on climatic changes in the EIA process. Further reading • UKCIP Adaptation Wizard (http://www.ukcip.org.uk/wizard). • Snover, A. K., Whitely Binder, L., Lopez, J., Willmott, E., Kay, J., Howell, D. and Simmonds, J., 2007, Preparing for Climate Change: A Guidebook for Local, Regional, and State Governments, ICLEI — Local Governments for Sustainability, Oakland, CA, USA (http://www.icleiusa.org/action-center/planning/adaptation-guidebook). • VÁTI, 2011, Climate-Friendly Cities: A Handbook on the Tracks and Possibilities of European Cities in Relation to Climate Change, Ministry of Interior Hungary — VÁTI, Budapest (http://www.eukn.org/ dsresource?objectid=224489). • CoR, 2011a, Adaptation to Climate Change: Policy instruments for adaptation to climate change in big European cities and metropolitan areas, European Union, Committee of the Regions, Brussels (http://80.92.67.120/en/documentation/studies/Documents/Adaptation%20to%20Climate%20Change/ EN.pdf).
  • 81.
    Planning urban adaptation Urban adaptation to climate change in Europe 79 3.3 Success factors Key messages The success of adaptation planning and implementation depends on several factors: • Awareness-raising actions should be targeted at stakeholders ranging from citizens to national and European governments and cover various aspects of climate change adaptation. • Successful adaptation cuts across sectors and scales. Planning and implementation needs to involve horizontal collaboration between different sectors or policy departments, as well as vertical coordination between different administrative levels. • Adaptation solutions that deliver additional benefits, such as green urban areas, increase the willingness to accept and implement them. • Working with nature, instead of working against natural processes, and using green infrastructure are sustainable solutions with multiple benefits. • Many climate change adaptation measures can be implemented at low-cost or contribute positively in other areas. However, a sufficient resource base in terms of financial, human and institutional resources needs to be developed and secured. The steps outlined in the previous Section offer a generic guidance on how to proceed in adaptation planning and implementation. As the adaptation agenda is relatively new (Kazmierczak and Carter, 2010; Ford et al., 2011), combined with the complex nature of both climate change and the urban areas, the planning process may be fairly complex. This Section aims to provide an overview where the processes have seen success as identified in previous research (Kazmierczak and Carter, 2010; CAP, 2007; CAG, 2009; PB, 2009; Bulkeley et al., 2009; Tanner et al., 2009). When considering the successful development and implementation of appropriate adaptation measures a number of factors can be considered. The EEA's European Topic Centre on Air and Climate Change, for example, introduces ten guiding principles for climate change adaptation in Europe (Prutsch et al., 2010). This report focuses on five interlinked success factors which combine principles such as raising awareness, working across sectors and scales, capturing co-benefits, dealing with uncertainties and long timeframes and working with nature, along with experiences in various cities in Europe. 3.3.1 Raising awareness of climate change and the need to adapt Climate change will affect all sectors of human activity. Thus, it is paramount that adequate awareness of climate change exists. Awareness raising is particularly important among the following groups (Füssel, 2007): Senior management within decision-making bodies. This could include: heads of government agencies at national and regional levels; city mayors and elected members and directors of municipal departments. They all need to be aware of the necessity of climate change adaptation. The presence of a strong leader or champion can, firstly, help to prioritise the adaptation within the organisation; secondly, they decide about implementation of any changes to policies; thirdly, they can ensure the availability of human and financial resources for development of adaptation strategies. Also, leaders (ministers and mayors) can raise the profile of adaptation planning in their area and secure support from key stakeholders (M. Ribeiro et al., 2009). The staff of organisations planning the adaptation strategy. The understanding of the problems associated with climate change and the solutions is needed for the officers working at local, regional and national levels in order to be able to formulate the policies and develop the delivery plans. Adaptation to climate change requires attention and action by people who have not explicitly considered climate in previous decisions. Managers of climate-sensitive resources (for example water managers, forest managers, urban and spatial planners, architects, tourism managers and health care providers) have usually assumed regional climate is essentially stationary. This assumption is no longer valid under global climate change, in particular when long-term decisions are concerned (Füssel, 2007). Practitioners and consultants. Natural resource managers who would actually implement the
  • 82.
    Planning urban adaptation 80 Urban adaptation to climate change in Europe recommended changes can provide key information about how processes are undertaken and why. This information is a crucial starting point for planning any changes. Non-governmental organisations can also participate actively in climate change-related actions. If they understand the risks associated with climate change, they can play an important role in the countries where there is little regulatory push for local authorities to develop adaptation action plans (see Box 3.4 for an example in Slovakia). Other external stakeholders, in particular those responsible for critical infrastructures or emergency services whose understanding of the need for adaptation is crucial to ensure that a given area can function under the changing climate and cope with extreme weather events. The general public. Informing and involving the local communities in climate change adaptation actions can ensure smoother implementation of the necessary measures. The development of knowledge-sharing should be targeted. Four important aspects can be identified: • Awareness of risks associated with climate change. For more details see Chapter 2. • Understanding what adaptation is. One of the main constraints in the development of adaptation strategies is the lack of Box 3.4 Community network in Bratislava, Slovakia While in some countries the main driving forces for the creation of an adaptation action plan are local authorities or local parliamentarians, in the Slovak case the network was instigated by the non‑governmental sector. The Regional Environmental Centre in Slovakia became a facilitator of discussion between the local authorities and the non‑governmental sector, and a moderator of a network of community and government representatives. Although there was no formal agreement with the city of Bratislava, the network became a full member of the task groups preparing the Bratislava Strategic Development Plan. The active participation of environmental organisations within the network has led to improvements to the Strategic Development Plan. Climate change challenges and mitigation and adaptation issues were fully incorporated as priorities under the objectives of improving the quality of the environment and urban spaces. Source: Hudeková and Tvrdoň, 2011. Photo: © HatM understanding among policymakers as to what adaptation actually is. It is often not understood that adaptation is as important as mitigation, regardless of the level of mitigation, since a certain level of climate change cannot be avoided. Awareness of adaptation costs and benefits. If stakeholders are aware of the risks and knowledgeable about effective response measures, the awareness-raising process should focus more on the expected costs and benefits of the specific options available (Füssel, 2007). 3.3.2 Cutting across different sectors and levels As the issue of climate change is cross-sectorial and multi-levelled, responses to climate vulnerabilities may be the remit of different sectors of the administration. Thus, climate risks need to be considered in all sectors, including urban planning, transport and health, in an integrated fashion. For example, in order to ensure an efficient response to heatwaves affecting human health, adaptive actions related directly to health protection (e.g. heat wave plans for health and social care practitioners) should be accompanied by, inter alia, adaptive building and urban design measures. In the Dutch 'Room for the River' project, there is a need to plan for higher river flows through improved drainage. Yet, sea level rise interferes with water drainage. Improved flood protection and water management, therefore, require considering both river flows and sea level.
  • 83.
    Planning urban adaptation Urban adaptation to climate change in Europe 81 One issue cannot be addressed independently of the other. Challenges can arise when responsibilities for issues are divided (Scarlett, 2011) thus emphasising the need for intra- and inter-organisational collaborations (see Section 3.3.3). In particular, different types of infrastructures, critical for the functioning of cities, are often mutually dependent, requiring coordination between the services responsible for them (see Box 3.5). Bridging the divide between different sectors can help to eliminate instances of maladaptation, i.e. where the adaptive actions in one sector have negative secondary effects on other sectors (see Box 3.6). Similarly, adaptation which can be successful at a specific temporal or spatial scale can become maladaptation at another level. In Chapter 4 the roles and responsibilities at different administrative levels are discussed in more detail, from local to European. Here, we focus on the linkages between different sectors and levels within a city (from building to neighbourhood to urban scale), capturing the various components of the governance systems relevant for climate change adaptation. One sector particularly important for cross-sectorial adaptation is land-use planning. Present and future land-use planning greatly affects the impacts of Box 3.5 Interdependencies between infrastructure types The report 'Infrastructure, engineering and climate change adaptation — ensuring services in an uncertain future' by the Royal Academy of Engineering (2011), examines vulnerabilities in different sectors of the United Kingdom to the effects of climate change and the modifications that would be needed to increase resilience. It also considers vulnerabilities that affect the infrastructure system as a whole and which arise as a result of interdependencies between different sectors. The functioning of cities depends on such viable systems. Extreme events in particular highlight the interdependencies in infrastructure as they are liable to lead to 'cascade failure' where the failure of one aspect of infrastructure, such as flood defences, can lead to other failures. One example of this could be flooded power stations leading to power cuts which thereby affect telecommunications networks, the pumping of drinking water and control systems. The interdependencies in infrastructure therefore need to be managed well. For example, a smart grid will mean energy systems rely more on information and communication technology, and the electrification of transport systems will mean transport is more reliant on the national grid. Source: Royal Academy of Engineering, 2011. Photo: © Genkaku climate change on cities and all infrastructure systems. This is because population distribution affects the location of infrastructure and hence the potential impacts. The way land is developed affects flood magnitudes and losses, water quality, water availability, and local heat island effects. Prohibition of new developments in flood zones is an example of land use regulation that can both decrease potential damages to property and improve hydrological conditions, thereby decreasing the severity of flooding. Transportation analysis further suggests that it can also be important to avoid commercial or residential development in areas that can often become inaccessible during extreme weather events. In general, good land-use planning will not increase vulnerability but will rather decrease it (Kirshen et al., 2007). If climate change adaptation is integrated with the regular plans for city renewal and expansion, costs of investments in infrastructure could be minimised. This also reinforces the importance of involving spatial planning departments in the development of adaptation strategies. Multi-scale land-use approaches to managing high temperatures and the risk of flooding are promoted by the United Kingdom's Town and Country Planning Association, focusing on three spatial scales in cities: the conurbation, the neighbourhood and the building (Figure 3.4) (Adger et al., 2005; Shaw et al., 2007).
  • 84.
    Planning urban adaptation 82 Urban adaptation to climate change in Europe Figure 3.4 Multi-scale approaches to managing high temperatures and flooding Note: From 'Climate Change Adaptation by Design'. Courtesy of the TCPA. Graphic by thomas.matthews (www.thomasmatthews.com). Source: Shaw et al., 2007. Box 3.6 Avoiding maladaptation Adaptation measures which can be successful at a specific temporal or spatial scale can also become maladaptation (Adger et al., 2005). For example, hotter summers will result in increased need for cooling buildings. However, provision of air-conditioning and fans would result in increased use of electricity, thus increased carbon emissions. Moreover, the hot air from the air conditioning units would increase street temperature, thus exacerbating the problem. Thus, provision of air conditioning can be seen as maladaptation and other solutions should be considered. For example, better insulation in houses can keep them cool in the summer and warm in winter. Meanwhile planting trees for shade not only provides cooling benefits in the summer but also allows for contact with nature for urban dwellers. In conclusion, adaptation measures need careful planning to avoid negative side effects and thus maladaptation. Photo: © A. Svensson
  • 85.
    Planning urban adaptation Urban adaptation to climate change in Europe 83 In order to ensure cross-sectorial planning and delivery of adaptive actions it is essential to coordinate actions between departments within the same level of government. Starting an adaptation planning process must involve setting up internal organisational structures and procedures across all relevant departments in order to institutionalise the adaptation 'motto' in various key sectors. Adaptation to climate change is very often led by an environment or sustainability department. Box 3.7 Cross-departmental collaboration and external stakeholder involvement in Kalamaria, Greece The Municipality of Kalamaria (Thessaloniki, Greece) has developed an adaptation action plan focusing on the use of green spaces as adaptation. Before starting the process, strategic co-operation between different directorates and departments in the municipality was lacking. The city started with an internal SWOT analysis (strengths, weaknesses, opportunities and threats). It involved interviews with personnel of the Department of the Land Registry Office and Municipal Property, the Department of Technical Works, Maintenance and Environment, the Planning Department; the Department of Greenery and the Office of Protection of the Environment. A cross-departmental climate change monitoring task force, involving representatives from the Department of Technical Works, Maintenance and Environment, Planning Department, Programming Department and Civil Protection, led to the development of an action plan with clear roles for all stakeholders. The task force will monitor and evaluate the implementation and then report to the mayor. The adaptation action plan was also developed in collaboration with a number of external stakeholders — the region of Central Macedonia, the Union of the Municipalities of Thessaloniki, Kalamaria and others, 'Anatoliki' a local government development company, the Aristotle University of Thessaloniki, various technical, transportation and planning bodies within Thessaloniki, the water company and the fire service. The meetings resulted in concrete proposals and their prioritisation. They were synthesised and included in the adaptation action plan. This cross-departmental and multi-stakeholder process brought different perspectives and types of experience to the adaptation action plan. They improved the understanding of climate change impacts across stakeholders and, as a co-benefit, helped to established long-term collaboration which otherwise would not have taken place. The participants felt committed to sustaining the network following completion of the adaptation action plan. ... and Genoa, Italy The adaptation action plan was developed by the local planning department in the province of Genoa, Liguria. The adaptation action plan concerns in particular two practical projects aiming to balance development in the province with environmental vulnerabilities that may be exacerbated by climate change. To ensure successful delivery of the projects, the province of Genoa set up a multidisciplinary working team. It included representatives from the Department of Land and Basin Planning (three geologists, four land planners and a hydraulic engineer); the Department of Natural and Protected Areas (an ecologist) and finally the Department of Energy and Environment (a physicist). Support was provided by two external experts in landscape planning and landscape design. This approach was intended to allow for differing viewpoints and to deliver projects addressing both environmental vulnerability and climate change adaptation in a sustainable manner. Source: Municipality of Kalamaria, 2011; Provincia di Genova, 2011; http://www.grabs-eu.org. Photo: © Ioannis Tsionas However, engagement from other departments may help to mainstream adaptive actions. In particular, engagement from the departments responsible for spatial planning and development control is important, especially when the adaptive actions are targeting land-use change or promoting restrictive development. Coordination mechanisms can be either formal or informal, depending on the political and legal tradition (M. Ribeiro et al., 2009). Box 3.7 provides two examples of cross-departmental collaboration in southern Europe.
  • 86.
    Planning urban adaptation 84 Urban adaptation to climate change in Europe The development and implementation of successful urban adaptation plans requires cooperation between a number of stakeholders. Stakeholders can be defined as those with an interest in climate change impacts on urban areas. Good management structures and a comprehensive goal where adaptation is concerned should motivate stakeholders to actively participate. Transparent decision-making processes and fair treatment of stakeholder interests should enhance cooperation and avoid potential conflicts. The example of the Municipality of Kalamaria, in Thessaloniki, Greece (Box 3.7), illustrates how different stakeholders can be involved in the process of development of an adaptation action plan. 3.3.3 Utilising the co-benefits of adaptive actions While the previous Section stressed the need for sectors to collaborate, it is also evident that this becomes easier when benefits can be identified for more than one sector. Wherever relevant, adaptation Box 3.8 Natural Economy North West, United Kingdom: estimating the economic benefits of green infrastructure Natural Economy Northwest was a partnership led by Natural England, the Northwest Regional Development Agency and SITA Trust between 2006 and 2009. The partnership worked with a wide range of partners and stakeholders to help in placing ecosystem services and natural environment at the heart of thinking about sustainable economic development, quality of life and quality of place. It recognised that ecosystem services underpin the social, cultural and economic prosperity of the region. The environmental economy (public and private sector activities related to ecosystem services) in the north west of England already generates GBP 2.6 billion within the regional economy every year and employs 109 000 people. The recognised eleven major economic benefits are: • Economic growth and investment: business attract and retain more motivated staff in greener settings; • Land and property values: views of natural landscapes can add up to 18 % to property values; • Labour productivity: green spaces near workplaces reduce sickness absence, increasing productivity; • Tourism: rural tourism supports 37 500 jobs in the north west; • Health and wellbeing: green infrastructure reduces pollution which leads to asthma and heart disease; • Recreation and leisure: footpaths, cycle paths and bridleways enable healthy, low-cost recreation; • Quality of place: community-owned green spaces can create jobs and local pride; • Land and biodiversity: green infrastructure provides vital habitats and jobs managing the land; • Flood alleviation and management; urban green spaces reduce pressure on drainage and flood defences; • Climate change adaptation and mitigation: green infrastructure can counter soaring summer temperatures in cities. The approach helped to reaffirm that green infrastructure is necessary for a region's prosperity. It emphasised that green infrastructure is crucial for the functioning of the region. Strong leadership by the regional public bodies was the principal reason for success. Source: Natural Economy North West, 2012; Natural Economy North West, 2012; ECOTEC, 2008; http://www.naturaleconomynorthwest.co.uk/about.php. measures have to be examined in relation to other policy areas, such as those of nature conservation, agriculture, urban development, transport, climate change mitigation or energy supply and demand. Presenting the benefits of a given adaptation option in an economic manner can be particularly important in order to persuade decision-makers that adaptation measures are feasible and desirable. As highlighted in Box 3.8, green infrastructure solutions (see Section 3.3.5 for more detail) have the potential to deliver a number of benefits. Possibly the most important driver for climate change adaptation is the improvement in quality of life in cities. This could lead to increased investment leading to greater prosperity. The Augustenborg neighbourhood in Malmö, Sweden illustrates how solutions aimed at reducing the risk of flooding have also contributed to social regeneration (Box 3.9). The synergies between adaptation to climate change and mitigation action are of particular interest (see also Box 3.6). In some instances the two
  • 87.
    Planning urban adaptation Urban adaptation to climate change in Europe 85 Box 3.9 Sustainable urban drainage systems as a driver for urban social regeneration in the Augustenborg area of Malmö, Sweden The neighbourhood of Augustenborg has experienced periods of socio-economic decline in recent decades, and at the same time frequently suffered from floods caused by overflowing drainage systems. Augustenborg underwent significant regeneration between 1998 and 2002. The main drivers for this initiative were the difficult social and economic situation in the neighbourhood, flood risk management, waste management and biodiversity improvement. Significant physical changes in infrastructure took place as a result, focusing on the creation of sustainable urban drainage systems, including ditches, retention ponds, green roofs and green spaces. The project was carried out collaboratively by the city council and a social housing company with extensive residents' participation. The project was deemed successful as the rainwater runoff rates have decreased by half and the increase in green space has improved the area's image. Source: Kazmierczak and Carter, 2010; http://www.grabs-eu. org/membersArea/files/malmo.pdf. Photo: © Town and Country Planning Association (TCPA) can be in direct opposition as it may be difficult, for example, to combine green roofs and solar panels on one building. However, in many cases adaptation and mitigation are compatible. Building insulation allows energy-saving for heating but also maintains lower temperatures in hot periods. Green infrastructure solutions in particular can address both the root cause and the impacts of climate change. Vegetation provides a carbon sink whilst at the same time lowering temperatures in the city. The INTERREG IIIc project AMICA specifically focused on integration adaptation and mitigation in the areas of energy, construction, and spatial planning, i.e. those sectors where 'common ground' between adaptation and mitigation policies is expected. AMICA developed a tool for city planners (AMICA, 2012). In some cases adaptation is the principle driver for action. In others it can be but one consideration amongst many. Examples include: • The floating houses development situated on the new island neighbourhood of IJburg in Amsterdam, the Netherlands respond to the existing demand for houses built near to water. Such developments also cope well with sea level rise or high storm surges. This example demonstrates the potential of climate change adaptation to act as a stimulus for innovation (see Box 2.14). • The 'Warm Front' (9) scheme in England provides heating and insulation improvements to households on certain income-related benefits living in properties that are poorly insulated and/or do not have a working central heating system. Qualifying households can qualify for improvements worth up to GBP 3 500. Grants are available for improvements such as loft insulation, draught proofing or cavity wall insulation. These improvements have also been efficient in reducing the risk of overheating to properties, thus reducing related risks to the vulnerable. • Smart homes, known as 'telecare technology', refers to equipping residences with a set of advanced electronics and automated devices. These are designed to enhance health care delivery (and remote physiological monitoring of residents) to enable early identification of possible problems and emergency situations and to maximize residents' safety and overall well‑being. Smart homes aim to assist the elderly in remaining independent at home by (9) http://www.direct.gov.uk/en/Environmentandgreenerliving/Energyandwatersaving/Energygrants/DG_10018661.
  • 88.
    Planning urban adaptation 86 Urban adaptation to climate change in Europe proactively addressing their needs. Inclusion of temperature and flood sensors in smart home technology can be important aspects of adaptation reducing mortality rates among the infirm and the elderly and improving their quality of life. In general, climate adaptation can be considered as not just a reactive or defensive response but as a proactive implementation of a long-term economic and sustainable development strategy. 3.3.4 Dealing with uncertainty and long time frames Uncertainty is one of the key constraints when developing adaptation strategies (Ribeiro et al., 2009). It gives decision-makers latitude to ignore the problems associated with climate change or delay development of adaptation strategies. Decision‑makers should aim to assess how they can improve the decision-making process leading to development and implementation of adaptation strategies regardless of uncertainties. This is certainly no easy task as uncertainties abound. The IPCC Special Report on Emissions Scenarios (SRES) (IPCC, 2000) defined six different future emissions pathways based on potential storylines for the future, and thus six scenarios for the associated increase in global average surface temperatures. Fortunately, the climate projections for the different emissions scenarios only start to diverge after 2050. Therefore, considering the full range of climate projections is important only for adaptation investments with a very long life time such as flood protection measures. At the same time, in the medium term the main uncertainty is related to differences between the outputs of different climate models. In the scientific community, there is a trend towards development of increasingly complex climate models and downscaling the projections to more and more local levels. However, creating more complex models may not necessarily provide greater accuracy of predictions. There may also be a conflict between providing spatially precise projections, and making these projections accurate (Dessai et al., 2009). The predictive power of the climate models is uncertain and different strategies are adopted to address this limitation. Focusing on either the upper or the lower bounds of scenarios can lead to, respectively, scaremongering or neglecting the issue. Good practice when handling uncertainties in climate impact scenarios is to provide a plausible description of any future impacts. Figure 3.5 Simplified cause/effect pathway regarding climate impacts on human health (in blue), along with sources of uncertainty (in grey) and target points for societal response options (in green) Source: Füssel et al., 2006. Decision uncertainty Scientific uncertainty Natural variability Non-climatic stressors Environmental factors Socioeconomic and other factors Individual behaviour Scientific uncertainty Greenhouse gas emissions Change in regional climate Regional weather Regional health effects Mitigation of climate change Adaptation to climate change Information collection
  • 89.
    Planning urban adaptation Urban adaptation to climate change in Europe 87 Box 3.10 Developing in-house knowledge of the local climate in Stuttgart, Germany Stuttgart is located in a valley basin. Due to its industrial activity the city has been susceptible to poor air quality since the 1970s. Development on the valley slopes has made the situation worse by preventing air from moving through the city which in turn has contributed to the urban heat island effect (see Box 2.5). The importance of climatic conditions for human comfort in health has been recognised in Stuttgart since 1938 when the city council employed a meteorologist whose job was to analyse the climatic conditions in Stuttgart to understand the connection between climate and urban development. Since then meteorological conditions have been recorded continuously. Based on this information a 'climate atlas' was developed illustrating how landforms and structures affect the movement of air through the city. It identifies the surrounding slopes, forests and agricultural areas as major sources of fresh air for the city. These findings had a significant impact on city planning. The city established an environmental office with the task of assessing proposed developments and their effect on the local climate. The climate atlas was updated in 2008. The aim was to preserve those areas key to improving local climate through development control measures and to improve the presence of vegetation across the city. The city has accumulated a significant amount of location-specific weather and climate knowledge which is easy to access. This has enabled a comprehensive understanding of the weather-related problems in the city. As a result, green areas cover more than 60 % of the city and over 39 % of Stuttgart's surface area receives protection through conservation laws — a record for the whole of Germany. Other cities, such as Berlin in Germany and Kobe in Japan have adapted this successful approach. Source: Kazmierczak and Carter, 2010. Climate atlas region Stuttgart: http://www.stadtklima-stuttgart.de/index.php?klima_klimaatlas_region. In addition, it is important to recognise that when considering adaptation, climate is only one of many processes that influence outcomes. Many of the other processes (for example, socio-economic and political issues that determine vulnerability such as globalisation, economic priorities, regulation and cultural preferences) cannot be adequately predicted either. The on-going economic crisis; the uncertainty faced by the Euro zone or the 2011 political developments in north African and middle-eastern countries are examples of the unpredictable turn of events. Figure 3.5 presents how the uncertainties add up in relation to the risks of climate change to human health. Information about climate change for specific locations can be difficult to obtain. In this context, basing future adaptation strategy on past extreme weather events can be effective, in particular when current climate related risks can be considered large and needing action (Füssel, 2007). However, it may be difficult for local government to predict local climate risks owing to the low probability of extreme events occurring. Translating global and national information into information relevant at the more local level may be challenging. Thereby gathering local information is crucial for the formulation of adaptation strategies at local or regional levels (Ribeiro et al., 2009). In Stuttgart, Germany long‑term meteorological observations provided a thorough understanding of the weather-related problems in the city (see Box 3.10). For the majority of cities and regions the possibilities of developing in-house expertise are limited, which emphasises the importance of collaboration with research institutes and other stakeholders. Box 3.11 provides an example of a simple framework, used in the United Kingdom, for considering current weather patterns and their impacts. Historical records describing the impact and costs of locally relevant extreme events are rare and often inadequately record key information for modelling future adaptation plans (Scott and Weston, 2011). Caution is recommended when future adaptation responses are based on past events. Predicting climate events based on previous incidents is not usually reliable and such risks should be acknowledged by city governments.
  • 90.
    Planning urban adaptation 88 Urban adaptation to climate change in Europe Box 3.11 Local Climate Impacts Profile (LCLIP) — A simple framework for considering current weather patterns and their impacts in order to cope with future uncertainties Understanding current vulnerability is an appropriate starting point for the preparation of an adaptation strategy. In 2006, The UK Climate Impacts Programme (UKCIP) developed a Local Climate Impacts Profile (LCLIP) as a simple framework for considering current weather patterns and their impacts. The purpose of preparing a LCLIP at municipality level is to raise awareness of current vulnerability to weather events in a particular area. A LCLIP should aim to provide a straightforward list of the main consequences of weather events to which a locality is exposed and some understanding of local preparedness. The logical source from which to gather at least some of this information is the local authority — particularly from emergency services' records. Such records are not always available therefore local media can be a good source for gathering information. Between 2006 and 2009, over one hundred LCLIPs were carried out by local authorities in the United Kingdom and significantly raised awareness of climate change impacts and vulnerability. One example is Manchester, where the LCLIP raised the profile of adaptation within the city council and brought to light areas of current and future vulnerability. For instance, the council's green spaces team became aware that increases in the frequency and intensity of future extreme weather events could substantially impact their budget. Source: UKCIP, 2009; http://www.ukcip.org.uk/lclip/; http://www.ukcip.org.uk/ case-studies. Science has provided enormous benefits to decision‑makers. Collaboration can involve minimal engagement via reporting roles to more active engagement such as the interpretation of scientific information. Scientists can also report, interpret and then integrate their scientific information and analysis into policy or management options. Indeed, some scientists may actually advocate particular Birmingham’s Local Climate Impacts Profile (LCLIP) FINAL DRAFT (source: Photos taken from BBC West Midlands, Tornado 2005, Heatwave 2006 and Flooding 2007) By Reena Kotecha Professor John Thornes and Dr Lee Chapman August 2008 School of Geography, Earth and Environmental Sciences, University of Birmingham. Keith Budden BeBirmingham and David Ward Birmingham City Council policy or management options. At the far end of the spectrum are circumstances in which scientists participate in making policy choices (Scarlett, 2011). An advanced model of collaboration between a city government and a research institute is the Institute for Sustainable Urban Development in Malmö, Sweden (Box 3.12). Box 3.12 Translating scientific results into policy relevant information in Malmö, Sweden The Institute for Sustainable Urban Development (ISU) is a joint venture between the city of Malmö and Malmö University. ISU was established in recognition of the fact that to fully develop post-industrial Malmö, innovative solutions based on an increase in economic, ecological and social sustainability factors were needed. ISU was founded to develop new ways to cooperate in order to facilitate the development of practically oriented research and to collect, provide and exchange knowledge and experience. ISU evolved from an earlier cooperation between the University of Malmö and the city of Malmö and is run by a board with two members from each. The base funding for ISU comes from the city of Malmö and the University of Malmö. The Institute deals with sustainability in its broad sense, which includes ecological, economic, social and cultural issues. ISU aims to initiate, empower and study processes of change aimed to create sustainable urban development. The work comprises taking part in urban redevelopment projects in Malmö, and includes the transfer of knowledge and experiences between researchers and practitioners. Source: http://www.isumalmo.se/isumedia/ISU_ENG_WEB.pdf. Photo: © Sundstrom
  • 91.
    Planning urban adaptation Urban adaptation to climate change in Europe 89 The uncertainty of future climate and socio‑economic characteristics requires careful consideration of adaptation options. Even in the absence of accurate knowledge about future changes approaches can be chosen to take action with low risks of maladaptation or overinvestment. These can be categorised as 'no regrets' or 'low regrets' with safety margins built in, and 'flexible' measures. Hallegatte, 2009 and Wardekker, 2011 explain further: • Low-regret. Low regret options are options that yield benefits even in the absence of climate change, such as implementing early warning systems for floods and heat waves or extending the green and blue spaces in the cities to improve living conditions. This is discussed in more detail in Section 3.3.3 on co-utilising benefits of the adaptation solutions. Low-regret options can also be seen as those whose costs are small or even negative under all plausible climate scenarios. Assessment and selection of these options does not necessarily depend on reliable climate impact projections (Füssel, 2007). One example of a 'low-regret' adaptation option is restrictive land use, i.e. banning development in certain areas which may be lifted if the area is no longer at risk. Box 3.13 Safety margins provide more security in uncertain situations — Salford, United Kingdom Figure 3.6 Building with safety margins Large areas of the city of Salford in the United Kingdom risk being flooded. Concurrently the municipality is under pressure to provide new residential and non-residential developments. In order to resolve the conflict between development and flood risk a document entitled 'Planning Guidance on Flood Risk and Development' was adopted in July 2008. The guidance specifies that new residential development proposed in high flood risk zone should be designed and built in a way that floor levels for habitable rooms and kitchens would be no more than 600 mm below the flood level predicted for a one in one thousand year extreme flood event, and not below the flood level predicted for a one in one hundred year event. Thus, the design ensures that no structural damage is done to the property even as a result of an extremely unlikely event and that the damage is minimised for more probable flood events. Source: Salford City Council, 2008. Groundlevel Raised groundlevel Kitchen/dining Living room Bedroom 1:1000 year flood level 1:100 year flood level • Safety margins. Urban projects can be designed with additional a capacity to cope with climate variability via a built-in safety margin (see Box 3.13). Other examples of safety margin would include low-elevation spaces with non‑essential functions that can store excess water in case of flooding. These would include squares, parks and parking garages all offering buffer capacity. Examples of redundancy measures include the creation of multiple transport routes for access and evacuation or designing power and water supply networks in such a way which secures system connectivity even if parts are affected by climate events. • Flexibility. Climate projections generally span 50 to 100 years, while most urban planning strategies choose a time frame somewhere between 20 and 40 years (Füssel, 2007). Infrastructure in and around cities needs to be built to last. Buildings, roads and open spaces all need to be adequately designed for present as well as for future conditions including climatic conditions. Taking explicit account of a changing climate to ensure the sustainability of investments over their entire lifetime is often referred to as 'climate proofing'. In this process adaptation efforts have to incorporate sufficient
  • 92.
    Planning urban adaptation 90 Urban adaptation to climate change in Europe flexibility to deal with changing climate risks and uncertainties. In addition, the adaptation process itself needs to be flexible and allow room for on-going reviews, monitoring of results and potential adjustment (Box 3.14). Flexibility can also be incorporated in urban and transport design and other infrastructure. Expectant urban design can, through combining the best practice in sustainable architecture (e.g. storm water treatment guidelines) with creative, open, multi‑purpose solutions, provide convenience for multiple users under different climate change and urban development scenarios. Box 3.14 Flexibility in the Thames Estuary 2100 project, United Kingdom The 'real options' approach adopted in the Thames Estuary 2100 (TE2100) project is a well-known example of long-term adaptation planning. The project identified a set of decision pathways for flood defences during the next 100 years and mapped out available options. For each option thresholds for responses were calculated together with the required lead times necessary for implementation. These thresholds are related to different sea levels rather than to different time horizons, making them scenario-neutral and thus allowing flexible planning despite large uncertainty in the current climate projections. Source: Decision pathways for the Thames Estuary 2100 project, © UK Climate Projections 2009. Figure 3.7 The Thames Estuary 2100 project Photo: © Ian Britton
  • 93.
    Planning urban adaptation Urban adaptation to climate change in Europe 91 • Appropriate timing and windows of opportunity. Climate change is a relatively slow process, but because of the long-term effects of urban restructuring, spatial choices and the relative irreversibility of initiated developments, the current policy agenda requires choices to be made now in the light of future climate resilience. Different time-scales can be considered for various adaptation options for example, improvement to the drainage system can be seen as a short term solution, whilst additional provision of trees in city centres is a mid- to long-term solution. Furthermore, there are multiple windows of opportunity, in the short term, for combining climate change adaptation with other objectives. In urban areas in particular there are significant on-going projects focusing on urban densification, renewal and development. This provides opportunities for incorporating climate change adaptation solutions with other measures considered for these developments, such as those aiming at improved quality in the living environment or reduced energy consumption. 3.3.5 Working with nature — not against Traditionally risks from natural processes have been managed with engineered or technical measures. These have been proven to work to a certain extent but when they fail the effects can be disastrous. For example, whilst dikes can protect against coastal flooding, they still require additional 'soft' protection measures such as emergency plans or insurance schemes in the event the dikes do not hold. Thus, they may not be the most effective or the most financially viable solutions. Consequently, a broader set of options should be considered. One approach is to provide adequate space allowing the natural processes in urban areas to take place (Box 3.15). Box 3.15 Working with nature, not against it: the Netherlands live with water For centuries, spatial planning in the low-lying Netherlands has been a matter of separating and maintaining the division between land and water. However, in 1999 the Ministry of Transport, Public Works and Water Management and the Association of Water Boards formed an independent committee to assess whether current water management policies were adequate to deal with the effects of climate change and to maintain a safe, liveable and attractive environment. The committee in its 'Water Management Policy in the 21st Century' report stated that a change in water management policy was required, involving relinquishing space to water rather than winning space from it. This was to be achieved by lowering and widening the flood plains and constructing water retention and storage areas. In the case of Nijmegen, this involves moving the Lent dike further back from the river Waal and constructing an ancillary channel in the flood plains. This will create an island in the middle of the Waal river resulting in a unique urban park in the heart of Nijmegen with room for living, recreation, culture, water and nature. Sources: Kazmierczak and Carter, 2010; http://www.ruimtevoorderivier.nl/meta-navigatie/english. Photo: © Martin van Lokven The present situation with the existing dike. The dike is to be moved 350 metres inland. An ancillary channel is to be dug in order to give the river more room. This will create an elongated island. 3 Lent Nijmegen Waalbrug de Oversteek 2 Lent Nijmegen Waalbrug de Oversteek 1 Lent Nijmegen Waalbrug The measure at Lent shown in phases
  • 94.
    Planning urban adaptation 92 Urban adaptation to climate change in Europe Working with nature can provide benefits from the natural systems themselves (Scarlett, 2011; Bolund and Hunhammar, 1999). Natural ecosystem services have often been replaced by artificial equivalents in cities and urban areas such as drainage, shading or slope stabilisation measures. A move towards greater use of natural ecosystem services and away from technical and engineered approaches has been observed. This is particularly relevant in relation to flooding. For example, in the United Kingdom there is declining support for flood defence systems to reduce the impact of flooding in favour of land use planning (Ford et al., 2011). In the case of coastal protection, traditional flood and storm surge protection has relied on 'grey' infrastructure such as dikes and levees. This infrastructure may perform well under certain conditions. Yet increasing the performance of this grey infrastructure to withstand more frequent and more intense storms may be exorbitantly expensive in many cases relative to solutions that supplement existing grey infrastructure with natural solutions like beach nourishment, wetlands restoration and sea marsh protections. The latter mix of options may provide greater functionality and more resilience across a broader range of conditions than traditional infrastructure (Scarlett, 2011). The concept of green infrastructure (a network of green and blues spaces in and around urban areas) emphasises that green space planning, delivery and maintenance should be equally important to that of other types of infrastructure (transport, communications, water supply etc.), and is thus considered as an integrative Box 3.16 Sustainable urban drainage in Western Harbour, Malmö, Sweden Västra Hamnen in Malmö functioned as a shipyard until it closed several few decades ago leaving 6 000 people unemployed. This problematic area was turned into a sustainable district. The mixed-use development covers 24 ha, includes, to date, 1 300 apartments and approximately 2 000 inhabitants. One of its distinct features is the large open storm water system, managing storm water within the area and consisting of narrow concrete canals and ponds. The system can function due to the fact that every courtyard in the development lies above the storm water system. Each courtyard has its own storm water pond. The courtyard and roof run-off flows into the narrow canals integrated into streets, alleys and squares. There is a ridge along the centre. The storm water to one side of the ridge is led through vegetated ponds to the larger salt water canal. The water to the other side of the ridge goes to the sea. The system is not regarded as crucial for managing the storm water at the site — pipes taking the water directly to the sea and salt water canal would have been sufficient. However, the main purpose of including the open storm water system was its high aesthetic value, as well as to pilot a system of this character within a dense housing district. As a result, similar approaches are now being used in other new developments in the city. Source: Dalman; Kruuse, 2010; http://www.grabs-eu.org/downloads/Climate_Adaptation_Strategy_Malm__webb.pdf. Photo: © Birgit Georgi part of the city indispensable to its functioning (Pauleit et al., 2011). Green infrastructure consists of natural or semi-natural areas in cities, including forest areas, parks, playing fields and other open spaces; vegetated road-sides and tree-lined roads; private gardens; rivers, canals, lakes, wetlands, wades and seashores; green roofs and green walls. Perhaps the most important role of green infrastructure in climate change adaptation in cities is reducing temperatures in urban areas. In particular, tree shading reduces the surface temperatures thus significantly improving human comfort (Ennos, 2011). Whilst replacing sealed surfaces such as concrete with grass also brings some cooling benefits, tree planting is the preferred adaptation option for cooling with green walls and roofs being used for building insulation. Green spaces also contribute to flood prevention. A study in the Greater Manchester area, United Kingdom, indicated that green infrastructure led to a significant reduction in surface run-off following rainfall. For example, on sandy soils, for an 18 mm precipitation event in the Greater Manchester conurbation, low-density residential areas (66 % vegetated area) were characterised by 32 % runoff, compared with 74 % runoff in town centres (20 % vegetated area) (Gill et al., 2007). Green and blue infrastructure (a combination of vegetated areas and water bodies) is being used in management of surface water runoff for example in Malmö, Sweden (Box 3.16) and Łódź, Poland (Box 2.15).
  • 95.
    Planning urban adaptation Urban adaptation to climate change in Europe 93 Green spaces in cities can both promote and hinder climate change adaptation (Kazmierczak and Carter, 2010). While the current emphasis on sustainability and contribution of green spaces to the attractiveness of cities could be used as additional leverage for adaptation responses, the need for the financial gains from urban development and regeneration, often associated with the administrative and socio‑economic situation of the area, can be a conflicting issue. In addition, short term investments in grey infrastructure provide greater returns and long term benefits of green infrastructure are often considered in terms of indirect or non-monetary value. Thus, in the case of green infrastructure trade-offs are necessary. However, as highlighted in Box 3.8, green infrastructure provides a number of additional benefits. It is also important to acknowledge that green infrastructure in many cases can perform its functions only when well-maintained and adapted to current and future climate conditions. It is essential to incorporate green infrastructure in the early stages in the development of new urban areas (see Box 3.16) to ensure it is not considered as an afterthought. For example, parks lacking in lush vegetation have a limited potential to provide cooling. As the European summers are likely to become drier and hotter it is important to consider green infrastructure in conjunction with other adaptation solutions, such as using drought resistant plants, stored flood water, harvested rain water or recycled grey water for watering the vegetation. 3.3.6 Securing resources for adaptation Many climate change adaptation measures can be implemented at low-cost. Some measures, such as infrastructural measures that would not have to be taken without climate change, could require major investments. For both low-cost and high-cost measures, a sufficient resource base in terms of financial, human and institutional resources needs to be developed and secured. The 'Financing the Resilient City' report (ICLEI, 2011) offers a bottom-up strategy for building capacity to finance and implement resilient urban development. The idea of this strategy is not merely to raise funds for adaptation projects, but more comprehensively to build local capacities to plan, finance and implement resilience upgrades. The report thus calls for a shift in both adaptation and disaster risk reduction, from a singular and specific focus on affected locations towards a more integrated focus on overall risks, development conditions and local area performance. The integrated strategy foresees that local capacity needs to be built in order to prepare, structure and manage large scale redevelopment and to leverage the right finance for this purpose. Capacity is also needed at the local level to organise effective demand for resilience as one of the key conditions for comprehensive upgrading of vulnerable urban areas. This would allow locally driven, large and complex projects to advance as quickly as conventional top-down projects. The key challenge is to match local demand for resilience with the right supply of enabling finance. This requires preconditions to be met at the local level. Stages include: • bottom-up planning processes need to be in place for identifying vulnerabilities and risks, and linking the related risk mitigation solutions with priority performance enhancements in relevant areas or systems; • technical and institutional capacity needs to be enhanced for designing comprehensive resilience upgrading projects, for managing and staging complex project execution, and for preparing the related investment propositions; • support for bottom-up procurement of investment through managed, competitive sourcing mechanisms and processes. When it comes to mobilising financial resources a number of approaches are generally available such as using local budgets, tapping into private sources and obtaining supportive funding from national governments and at the European level. These include climate-based taxes and charges, subsidies and budget allocations, removal of subsidies or taxes with harmful impacts, rules stipulating the ways public funds can be used and monitored (Mickwitz et al., 2009). Examples of such local revenues are given in Section 2.2.3. As with other climate proofing efforts, funding options should be developed jointly between local and higher levels of governance. Additional funding from the national and European level, such as the EU Structural Funds, can make a decisive contribution. Funds aimed at disaster risk reduction, such as INTERREG and LIFE+, would also be valid. For the period 2014–2020, the European Commission
  • 96.
    Planning urban adaptation 94 Urban adaptation to climate change in Europe has proposed allocating at least 20 % of the overall Multiannual Financial Framework for both climate change mitigation and adaptation measures. This 20 % will be sourced from the budgets of a wide variety of policy sectors (EC, 2011b). This is further discussed in Section 4.3.4. Private investments of different kinds, including the insurance sector, are another funding source. Although governance in adaptation cannot rely on market actors as heavily as in the field of mitigation, and, consequently, the overall weight for some measures, such as flood defences, has to be carried by public actors. There are exceptions, such as green roofing for which the burden falls on private actors, unless local governments decide to subsidise such practices. Challenges of using market-based instruments and private funding in the context of adaptation are that market failure may also hinder effective adaptation, as incentives for change are not diffused effectively through market mechanisms. Climate change is dealt with in a narrow way through a subset of policies targeting a limited range of actors or investments. Compared to mitigation‑related market signals, adaptation‑related market mechanisms remain clearly underdeveloped. This may slow change and limit the cost‑effectiveness of climate policy initiatives across levels of government. This also implies that the promotion of win-win measures addressing climate change mitigation and adaptation concurrently could be a method for obtaining private funding in this area. Further reading • Shaw, R., Colley, M. and Connell, R., 2007, Climate change adaptation by design: a guide for sustainable communities, TCPA, London (www.preventionweb.net/files/7780_20070523CCAlowres1.pdf). • AMICA tools (http://www.amica-climate.net/materials.html). • ICLEI, 2011, Financing the Resilient City: A demand driven approach to development, disaster risk reduction and climate adaptation — an ICLEI White Paper, ICLEI Global Report, ICLEI, Bonn (http://iclei.org/fileadmin/ user_upload/documents/Global/Publications/Report-Financing_Resilient_City-Final.pdf). • VÁTI, 2011, Climate-Friendly Cities: A Handbook on the Tracks and Possibilities of European Cities in Relation to Climate Change, Ministry of Interior Hungary — VÁTI, Budapest (http://www.eukn.org/ dsresource?objectid=224489). • CoR, 2011a, Adaptation to Climate Change: Policy instruments for adaptation to climate change in big European cities and metropolitan areas, European Union, Committee of the Regions, Brussels (http://80.92.67.120/en/documentation/studies/Documents/Adaptation%20to%20Climate%20Change/ EN.pdf). • Ribeiro, M., Losenno, C., Dworak, T., Massey, E., Swart, R., Benzie, M. and Laaser, C., 2009, Design of guidelines for the elaboration of Regional Climate Change Adaptations Strategies. Study for European Commission.
  • 97.
    95 Multi-level governance— enabling urban adaptation Urban adaptation to climate change in Europe Climate change exposure – Temperature – Precipitation – Sea level Sensitivity of cities to – Heat – Flooding – Water scarcity Potential climate change impacts on cities Possible adaptation measures reducing the sensitivity Chapter 2 — Climate change challenges Chapter 3 — Planning urban adaptation Chapter 4 — Multi-level governance Adaptive capacity of cities to cope with the impacts and reduce the vulnerability Planning urban adaptation and success factors Multi-level governance action to facilitate and implement adaptation 4 Multi-level governance — enabling urban adaptation 4.1 Governing adaptation at different spatial levels Figure 4.1 Placing Chapter 4 within in the framework of the report Key message • Urban adaptation to climate change in Europe is a task that concerns all governmental levels — from local to European. While municipalities and regions focus on the implementation of place-based adaptation measures, national and European governments should have a supporting role. Taking a place-based approach to adaptation policies is a way to further policy integration and coherence. The key question here is how different policy sectors and levels of government interact to support the implementation of local adaptation measures. Looking at adaptation through an urban lens, different ways can be identified for varying levels of government to contribute to successful adaptation. Berkhout (2005) has identified five key challenges facing climate adaptation and uses these as a basis for proposing rationales for policy action on climate adaptation. These relate to: • information provision and research; • early warning and disaster relief; • facilitating adaptation options in a bottom up way, for example, by farmers, harbours or municipalities; • regulating the distributional impacts of adaptation, for example, the allocation of water resources;
  • 98.
    Multi-level governance —enabling urban adaptation 96 Urban adaptation to climate change in Europe • developing, funding and regulating the maintenance of infrastructures such as dikes. Table 4.1 summarises the roles of local, regional, national and European action in the field of climate change adaptation on the local level. Action at the local level contributes to the implementation of adaptation programmes and strategies at higher policy levels. 4.1.1 The local level Role and options As adaptation is place-based local level decision‑making is important. Local conditions determine vulnerability and adaptive capacity. The local level can best implement adaptation activities. Local stakeholders know the specific conditions well and can devise flexible solutions using their knowledge (Corfee-Morlot et al., 2009). Some cities are already very ambitious in working on climate policies and many adaptive actions have emerged without guidance or support from higher levels of government (Mickwitz, 2009; Kern and Bulkeley, 2009; Keskitalo, 2010e). In new urban developments and restructuring projects, cities can implement structural measures Table 4.1 Actions at different governmental levels towards urban adaptation Local action Regional action National action European action Implementing action • Planning and implementation of local adaptation strategies • Mainstreaming of adaptation concerns into other policy areas • Spatial integration of adaptation needs through urban planning • Local emergency plans • Allocation of municipal resources and raising of other funds • Upgrading local infrastructure to make it resilient to climate change • Engaging civil society and private actors • Providing incentives, funding and authorisation to enable local action • Addressing inter-municipal and urban-rural relations of climate change impacts and vulnerabilities • Developing and implementing with cities regional approaches, e.g. in river basins • Ensuring regional coherence of local /municipal plans and measures • Providing a supportive national legal framework, e.g. appropriate building standards • Mainstreaming of urban adaptation into the different national policy areas and the national adaptation strategy • Funding of local adaptation measures • Providing national information related to climate change and regionally downscaled information • Funding of research and knowledge development for urban adaptation • Supporting boundary organisations who link science and policy to local adaptation needs • Adjusting the degree of decentralisation of competences and authorities • Providing a supportive European legal framework • Mainstreaming of urban adaptation needs into the different European policy areas, e.g. cohesion policy • Funding of local adaptation measures as well as knowledge development for urban adaptation; • Providing European and global information related to climate change • Enabling and coordinating exchange of knowledge and experience across national borders • Addressing and coordinating cross-border adaptation issues Supporting action such as the construction of parks, canals, ponds, thermal energy storage and modified sewerage systems. The key players at neighbourhood or city scales are municipal councils and real estate developers. In existing urban areas the most appropriate measures involve adaptation at the scale of individual buildings or streets such as insulation, green roofs and modifying street paving for water retention. The key actors at this scale are housing corporations, companies and private property owners. Urban areas are constantly changing and if municipal authorities, developers, housing corporations and private owners consistently incorporate climate resilience into their investments in the urban environment they can minimise the additional costs of climate adaptation (PBL, 2011). There are many opportunities for combining these tasks with other objectives, such as improving the quality of life, reducing energy consumption and cutting emissions of greenhouse gases. Municipal authorities are the best suited to play a leading role in coordinating and managing these adaptation efforts. Local governments can use different methods of governance to foster adaptation as described in Table 4.2.(Kern and Alber, 2008).
  • 99.
    Multi-level governance —enabling urban adaptation Urban adaptation to climate change in Europe 97 Mode of local governance Explanation Instruments Adaptation action Examples Self-governing The capacity of local governments to govern their own activities. Internal reorganisation, institutional innovation, strategic investment. Adapting local assets such as public buildings and infrastructure to climate change. With adaptation measures such as flood protection and cooling, the municipality sets an example for other local actors. Storm water systems in Malmö, Sweden (see Box 3.16). Water squares in Rotterdam, the Netherlands (see Box 2.15). Enabling Coordinating and facilitating partnerships with private actors and promoting community engagement. Persuasion, positive incentives, participatory mechanisms. Raising awareness; engaging interest groups and encouraging private actors in participatory planning; identify vulnerable groups and motivate. Extreme weather events can be used as 'focusing events' for communication efforts, as they boost stakeholders' motivation and provide media attention for adaptation. Comprehensive approach with the participation of many stakeholders to cope with urban flooding in Copenhagen, Denmark. The devastative flood in 2011 has given the activities a higher profile (see Box 2.10). Provision Delivery of particular forms of services and resources. Infrastructure, financial policy. Service provision such as the creation of local warning systems and emergency planning. Municipalities provide various services (e.g. health care and social services), which can be used to promote adaptation. Botkyrka, Sweden has mapped out where inhabitants vulnerable to high temperatures live, which enables the municipal services to formulate plans to assist them (see Box 2.2). Regulation Use of traditional forms of authority. Legislation, control and sanction mechanisms. Urban planning regulations, local building codes, regulations for watering of gardens etc. Town planning regulation provides extra building capacity available to developers in return for green space in Faenza, Italy (see Box 4.1). Table 4.2 Modes of local governance and available instruments Source: Adapted from Kern and Alber, 2008. Box 4.1 Local regulation in Faenza, Italy, encourages developers to create green space The Municipality of Faenza implemented a bio‑neighbourhood incentive programme for developers. This was included in their town planning regulations. The incentive programme aims to achieve energy savings, promote aesthetic qualities of neighbourhoods, and also to create better microclimate conditions to prepare for future rising temperatures associated with climate change. The incentive programme allows developers to extend the size of buildings in bio‑neighbourhoods in excess of approved standards if the buildings meet certain criteria of environmental sustainability. These include green roofs, green walls and water retention systems as well as the creation of continuous public green spaces by developers. These regulations do not include a set of standards. Agreements are negotiated on a case-by-case basis. The negotiations between town authorities and developers or housing associations means that the wait for building permits to be obtained is shortened, thereby providing an incentive to developers to engage in the scheme. Sources: 'Faenza: Extra cubature for developers in return for green space'. In: Kazmierczak and Carter, 2010; GRaBS project: http://www.grabs-eu. org/membersArea/files/faenza.pdf. Photo: © Julie70-Flickr
  • 100.
    Multi-level governance —enabling urban adaptation 98 Urban adaptation to climate change in Europe Limitations of local governance Local authorities face different obstacles in their efforts to design and implement adaptation policies. Factors affecting local policy design can be of a variety of natures including jurisdictional and institutional and economic and budgetary. They can stem from local sources such as local legislation and policy but also from other levels including national and European legislative frameworks. A summary of typical constraints and possible multi-level governance responses are further listed and discussed in Section 4.2.2 and Table 4.5. Important limitations relate to the scale of intervention. Although boosting green urban infrastructure can contribute effectively to the reduction of heat island effects, municipalities cannot solve the problems of river flooding on their own. This requires up-stream interventions and often a regional or even national approach and proper inter-municipal coordination. The municipalities' efforts need to encompass both horizontal co-operation with other municipalities and vertical cooperation with regional and state authorities. Moreover, depending on the Member State, municipalities do not have the same regulatory competences and financial capacities which can lead to problems in the design and implementation of cross-border adaptation action. 4.1.2 The regional level Role and options As mentioned under the limitations for local action in the example of flood management (Section 4.1.1), regional governments play an important role when adaptation issues exceed municipal boundaries. Municipalities often need to cooperate with their neighbours to address the problem of institutional fit, i.e. the match between the spatial dimensions of the adaptation challenge and municipal jurisdiction (Young, 2002). Hence a key area of collaboration is spatial planning across municipal borders. Such regional approaches can not only ensure success but provide further benefits in the form of higher efficiency. Some measures supported beyond city borders can come at a lower cost and are more sustainable than building flood barriers within the city. In addition, shared costs for regional vulnerability and impact assessments can reduce the burden for each stakeholder. The specific role that regional governments can take depends on the dynamics of national structures. While an elected regional government can play a significant role in developing regional adaptation policies, administrative regional bodies may only play a role in implementing state policy. In a federal state a large part of decision-making rights will be based in the regions, resulting in relatively large differences between regions in how they act on adaptation (Keskitalo, 2010a). Limitations of regional governance The regional scale is an emerging level of adaptation strategy development with significant potential and room for improvement. Regional strategies focus more on letters of intent than concrete action plans. In countries where the regional level is weak and has no constitutional backing, the regional level may suffer from limited influence, lack of resources and institutional instability such as in the case of the United Kingdom (Box 4.2). As with other levels of government, the key determinants are institutional fit, scale and interplay between the actors (Young, 2002). Regional governance can be limited when an administrative region does not match the scale of the adaptation problem. This can be seen in the example of river systems which stretch across borders or when dealing with large scale water scarcity which require a national or cross-border approach. 4.1.3 The national level Roles and options Despite the recent emphasis on governance through non-hierarchical networks, where cities and city networks can bypass administrative levels and collaborate directly with the European Commission, national governments provide the crucial link between EU priorities and local adaptation action. National institutional structures may even be the most important element determining how to integrate adaptation as a policy aim (Keskitalo, 2010e). Firstly, national governments can provide a strategic framework. National adaptation strategies have become a key instrument. These strategies can embed local action into the national context and
  • 101.
    Multi-level governance —enabling urban adaptation Urban adaptation to climate change in Europe 99 Box 4.2 Consequences of the abolishment of the regional planning level for adaptation in the United Kingdom Until May 2010 the governance structure in England consisted of national, regional and local tiers. At the national level detailed planning policy guidance was issued, including documents directly pertaining to adaptation to climate change and associated problems, such as flooding. The government's regional body, alongside the Regional Development Agencies (RDA), was producing spatial, housing and economic strategies which in many cases also related to climate change adaptation. In addition, there are examples of climate change action plans being developed by partnerships at the regional level, for example in the north west of England, where the RDA developed a robust region-wide green infrastructure framework for adaptation (Kazmierczak and Carter, 2010). The current government brought a substantial change. It includes the simplification of the detailed national policy guidance to overall principles of sustainable development; removal of the National Performance Framework; and abolition of the regional tier. Instead, duties for local authorities to coordinate their actions have been introduced, and a bottom-up system of spatial planning has been proposed. The Localism Bill proposes the introduction of a new neighbourhood scale system of spatial planning, where the communities set out specific policies and land use designations for the local area. These neighbourhood plans will be adopted as part of the official local development plan (subject to compliance with its overall vision) which would give them significant weight in the determination of planning applications (Adaptation Sub-Committee, 2011). Whilst these changes are expected to give more freedom to local authorities and engage the local communities, there are concerns about the consistency of such bottom-up planning between different areas due to different priorities of those involved in the development of the plans. In addition, certain adaptation measures such as flood management require regional approaches rather than those uniquely local. This, combined with the absence of direction from higher tiers, may jeopardise the possibility to deliver strategic objectives and implement large‑scale solutions. Moreover, adaptation planning requires considerable expertise which may not exist within the local communities. The local authorities face significant budget cuts and without national indicators adaptation is unlikely to be viewed as a priority (Scott, 2011). link cities and regions. They can set the framework by developing national legislation and creating a variety of standards and incentives (Swart et al., 2009). Secondly, national governments can climate-proof national legislation and policy and mainstream adaptation into different areas whilst ensuring that national policies are also coherent and supportive for local adaptation (Corfee-Morlot et al., 2009). A further task is to remove barriers to urban governance as in the example in Box 4.3. National governments also can play a key role in greening urban finance by re-designing sub-national taxes and grants at local government level (OECD, 2010). In terms of regional development, national governments need to pay attention to equity issues and create climate change policies that address differences in vulnerability across different sectors and spatial divisions. National governments can also support the legal and institutional conditions for inter-municipal cooperation. Thirdly, national governments play a crucial role as supporters and enablers of local and regional strategies and action. They provide the necessary background information and regional climate data, scenarios and assessments. This is addition to providing tools, guidance and funding for local government action. Box 4.4 provides one example. Supporting local adaptation measures provides national governments the opportunity for policy learning. Neighbourhoods can be seen as testing grounds for policy providing valuable lessons on the performance of policy measures in different local contexts. National governments can observe and carefully study local implementation of national adaptation strategies, flood risk management procedures and other measures since they reveal the strengths and weaknesses of national approaches and measures. It also allows for the identification of related interests, incentives and trade-offs which can help or obstruct implementation and serve to provide input into the national framework. Local adaptation measures also allow for observation of direct costs and benefits. Such observations can prove to be useful especially within a national
  • 102.
    Multi-level governance —enabling urban adaptation 100 Urban adaptation to climate change in Europe Box 4.3 Better incentives for local risk management in France — getting the national framework right In France property, which is insured against damage such as fire, burglary and storms, is automatically insured against damages by natural disasters. In this case, the insurers and reinsurers use money from an additional 12 % premium to provide compensation. This additional premium is a legal requirement. If the main reinsurer, the Caisse Centrale de Reassurance (CCR), goes bankrupt the state grants additional money to insure 100 % coverage. This system has been in place since 1982. The advantage of this system is its security. Everybody who has a basic insurance is insured against damage in the case of a natural disaster. In addition those settling in risk areas who do not have the resources to move to another place to settle are supported. The system can, however, work against risk management at a local level. As the state will pay in the case of a natural disaster, people may still choose to settle in potentially risk prone areas. This can make it difficult to restrict development in such areas. Since 1995 the state has taken action to minimise any disadvantages arising from the CCR and to provide local governments with a better legislative framework. The state has agreed to develop and implement Natural Risk Prevention Plans in the various municipalities. The plans aim to limit urban growth in risk areas and minimise damage. Source: Grislain-Letremy and Peinturier, 2010; Letremy and Grislain, 2009. Photo: © Piotr Box 4.4 Stadtklimalotse — a guidance tool provided to local governments The German Federal Ministry of Transport, Building and Urban Development supported the development of the 'Stadtklimalotse' (urban climate pilot). Local governments can use this guidance tool when developing urban adaptation plans and measures. The database provides around 140 adaptation measures, relevant policy documents and international examples. The core element — the 'pilot' — guides the planners through: • Identification of the specific adaptation context; • Selection of the relevant thematic areas; • Vulnerability assessment; • Selection of appropriate measures; • Own list of action for climate change adaptation. The Stadtklimalotse enables not only adaptation pioneers but also other cities to make use of shared adaptation knowledge and experiences and to develop their own adaptation plans. Source: http://www.stadtklimalotse.net/stadtklimalotse. Stadt-klimalotse Aktionsset zur Entwicklung einer kommunalen Anpassungsstrategie Ein ExWoSt-Forschungsfeld Experimenteller Wohnungs- und Städtebau (ExWoSt) ist ein For-schungsprogramm des Bundesministeriums für Verkehr, Bau und Stadtentwicklung (BMVBS), betreut vom Bundesinstitut für Bau-, Stadt und Raumforschung (BBSR) im Bundesamt für Bauwesen und Raumordnung (BBR) Wissenschaftliche Begleitung Bundesinstitut für Bau-, Stadt-und Raumforschung (BBSR) im Bundesamt für Bauwesen und Raumordnung (BBR) Deichmanns Aue 31-37 53179 Bonn Dr. Fabian Dosch Tel.: 0228 99401 2307 fabian.dosch@bbr.bund.de Das Bundesinstitut für Bau-, Stadt-und Raumforschung (BBSR) im Bundesamt für Bauwesen und Raumordnung (BBR) ist eine Ressortforschungseinrichtung im Geschäftsbereich des Bundes-ministeriums für Verkehr, Bau und Stadtentwicklung (BMVBS). Forschungsassistenz: TU Dortmund Institut für Raumplanung (IRPUD) Prof. Dr. Stefan Greiving Tel.: 0231 755 2213 stefan.greiving@tu-dortmund.de Dr. Christian Lindner Tel.: 0231 755 2475 christian.lindner@tu-dortmund.de Weitere Informationen: www.bbsr.bund.de Herausgeber Bundesministerium für Verkehr, Bau und Stadtentwicklung (BMVBS) Invalidenstraße 44 10115 Berlin Gestaltung und Satz Nadine Mägdefrau Druck flyeralarm GmbH Bildnachweis (nach Reihenfolge der Abbildungen) www.fotolia.com: Ron Hudson, www.fotolia.com: Franz Pfluegl, www.fotolia.com: Lars K. Christensen, www.flickr.com, CC-Lizenzen (http://creativecommons.org): Joachim S. Müller, www.flickr.com, CC-Lizenzen (http://creativecommons.org): Ed Yourdon, www.flickr.com, CC-Lizenzen (http://creativecommons.org): Steamtalks, Uwe Grützner, www.stadtklimalotse.net Stand September 2011 Stadtklimalotse Kontakt Impressum Eine klimagerechte Stadtent-wicklung fordert stärker als bisher die Integration vielfälti-ger sozialer, ökologischer und ökonomischer Aspekte. Aufbauend auf der Vorstudie zum Klima ExWoSt wurde ein akteursspezifisches Aktions-set mit Maßnahmen, guten Beispielen und weiterführender Literatur zusammengetragen, welches über den Stadtklima-lotsen gezielt abgefragt werden kann. Der Stadtklimalotse ist ein eigenständig anwendbares Beratungsinstrument zur Auswahl von geeigneten Klima-anpassungsmaßnahmen für die kommunale Stadtentwicklung. Er soll Städten und Gemeinden ermöglichen lokalspezifisch und allgemein den Ursachen und Folgen des Klimawandels durch urbane Konzepte begeg-nen zu können. Der Lotse greift auf eine Daten-bank mit rund 140 Maßnahmen zurück und hilft durch verschie-dene Abfragemöglichkeiten die potenziell interessanten Maßnahmen für den lokalen Kontext auszuwählen. Wichtig ist dabei die Identifikation von Synergien und Konflikten zwi-schen einzelnen Maßnahmen. Der Stadtklimalotse wird im Forschungsfeld StadtKlima ExWoSt sukzessive weiterent-wickelt.
  • 103.
    Multi-level governance —enabling urban adaptation Urban adaptation to climate change in Europe 101 context where direct results are put in an overall national context (Corfee-Morlot et al., 2009). Limitations of national governance Observations point to a gap between local, bottom‑up adaptation and national adaptation strategies. The Finnish example shows that local and regional adaptation strategies and measures may develop independently with very little linkages to national adaptation strategies (NAS). In the case of the Finnish NAS, the national focus undermined regional and local perspectives, making the strategy less interesting for local actors (Juhola, 2010). Sweden and several other countries face similar limitations. Although this deficiency has been recognised, it provides a stark reminder that even well prepared national adaptation strategies do not automatically lead to local action. Another limitation for implementation at the national level relates to the barriers between policy sectors. Without flexible and cross-sectoral coordinated measures, adaptation efforts may be hampered by sectoral thinking. Financial constraints are present also at the national level, especially in austere times. In such instances local government funding lines are unlikely to stretch to climate action which becomes less of a political priority. 4.1.4 The European level Role and options As at national level, the EU can support local and regional adaptation and assist with speeding up implementation. In particular, EU cohesion policy shall ensure that the most disadvantaged regions are supported. The European Commission's White Paper on Adaptation (EC, 2009b) complements national adaptation initiatives. It aims to coordinate adaptation at the European level and facilitate important trans-national connections thereby providing a common strategic approach and a supportive policy framework. The goals of the White Paper up until 2012 are to: • build a solid knowledge base on the impact and consequences of climate change for the EU; • integrate adaptation into EU key policy areas; • employ a combination of policy instruments (market-based instruments, guidelines, public‑private partnerships) to ensure effective delivery of adaptation; • step up international cooperation on adaptation. These activities will lay the ground for preparing a comprehensive EU adaptation strategy to be implemented as from 2013. All these actions support directly and indirectly urban adaptation. The newly launched European Climate Adaptation Platform CLIMATE-ADAPT provides a comprehensive knowledge platform including information on urban related issues. The platform will be updated continuously and has also the potential to support exchange between cities and other stakeholders. Furthermore, the Seventh Framework Programme (FP7), INTERREG, LIFE, ESPON and other EU programmes generate knowledge relevant for urban adaptation. DG CLIMA recently launched a project to support adaptation strategies for European cities (see Box 4.12). Mainstreaming of adaptation into relevant EU policies is an important opportunity to create the necessary supportive framework for effective climate change adaptation at local level. The European Commission has started concrete initiatives to integrate adaptation into EU sectoral policies, in particular with water and flood risk management, agriculture and rural development, health, and nature protection and biodiversity. The proposal for the Multiannual Financial Framework (MFF) for the period 2014–2020 draws explicitly on the concept that financing for climate change receives contribution from different policy areas such as cohesion, environment, agriculture, research and external cooperation (EC, 2011b) (Table 4.3). The current direct spending on climate change mitigation and adaptation under the EU budget does not reflect the importance of climate change for Europe's future. In 2007–2013 a total of only EUR 9 billion, or 3 % of the total budget, has been directly allocated to mitigation goals in energy efficiency and renewable energy. An additional 10 % of the budget (EUR 32 billion) links to indirect spending on transport including clean public
  • 104.
    Multi-level governance —enabling urban adaptation 102 Urban adaptation to climate change in Europe Policy sector Integration of climate change adaptation Importance for urban adaptation Regional and cohesion policy High potential of structural funds and related cooperation taking place in the framework of INTERREG, URBACT for regional and local adaptation projects. Currently little or no input by Member States, but important changes towards better inclusion of climate change in the 2014-2020 are proposed. The budget share for adaptation in relation to mitigation still needs clarification. Relevant for integrated urban renewal projects, brownfield redevelopment, building insulation, green infrastructure projects etc. Exchange and generation of knowledge and awareness in INTERREG and URBACT. Support for local adaptation projects varies depending on Member States' priorities and operational programmes. At present regional policy may also be a source of maladaptation when large sums of money are spent on non-climate proof measures. Environment Water framework and Floods Directives (EC, 2000b; EC, 2007a) provide a good basis for integration of adaptation to floods. Droughts and Water Scarcity strategy (EC, 2007c) relates also to future climate changes. Nature directives do not address climate change yet. Natura 2000 network can be a solution for migrating species; the new green infrastructure strategy can also serve climate change adaptation. 20 % of the future LIFE programme 2014–2020 shall be dedicated to climate change. The directives on Environmental Impact Assessment (EIA) and Strategic Environmental Assessment (SEA) (EC, 2011a; EC, 2001) do not sufficiently consider climate change impacts. The review of the EIA directive offers the opportunity for change. Flood directive (EC, 2007c) relevant for urban adaptation: urban areas are often water bottlenecks that require upstream adaptation of rivers. Combating water scarcity and drought also a priority for many cities. Green infrastructure in and around cities delivers important services for urban adaptation such as cooling under heat waves and water management. The national implementation of EIA makes it also relevant for local projects Agriculture and rural development CAP allows for spending on adaptation-related measures. Better cross-compliance with climate change through the CAP reform (pillar 2). Relevant for urban areas in regional approaches, e.g. upstream flood prevention measures or water management in water scarce regions. Transport and energy Mitigation-oriented sectors with limited progress in adaptation measures. EU Energy Performance of Buildings Directive (EC, 2010b) focuses only on mitigation, but insulation could also be a contribution to adapt to heat waves. Eurocodes for construction works and structural construction products, C(2003) 4639), (2003/887/EC) can be a suitable tool for designing construction works, checking the mechanical resistance of components, or checking the stability of structures to climate change impacts. High relevance for urban adaptation; critical infrastructures to be build climate-proof involving long time scales and far-reaching repercussions. Synergies between mitigation and adaptation measures. Industrial/ enterprise No integration of adaptation, but the business community is clearly interested in climate impacts. Positive responses can be expected from local businesses and their interest in coping with climate change impacts. Employment/ social No integration of adaptation; emphasis on green growth and jobs. Importance of addressing social equity issues and distributional impacts of climate change. Health and consumer protection Ample research under way; policy focus shifting to include climate impacts. EU Health Strategy 2008–2013 acknowledges the need for action to tackle climate impacts on health. Highly relevant for urban adaptation as the majority of European population lives in cities and many health impacts related to climate change concentrate here. Research Considerable research efforts; new information and monitoring systems (e.g. early warning systems). Clearly beneficial for local adaptation, but the uptake of many research outcomes remains limited. International development (UNFCCC) Focus on climate change mitigation and adaptation. The 'Copenhagen Accord' (2009) included a pledge by developed countries to raise USD 100 billion per year by 2020 to help poor countries fight climate change and adapt to its inevitable consequences. Establishment of a Green Climate Fund. Durban conference (2011) agreed on a roadmap for drawing up a legal framework by 2015 for climate action by all countries. Durban Adaptation Charter for Local Governments. So far potential for adaptive action in urban areas in developing countries, but little impact on European cities yet. Table 4.3 EU policy sectors, adaptation, and impacts at the urban level Source: Adapted from Ellison, 2010.
  • 105.
    Multi-level governance —enabling urban adaptation Urban adaptation to climate change in Europe 103 transport and investment in rail infrastructure. On the adaptation side the figures are clearly lower. Climate change adaptation financing can be linked to the provision of approximately EUR 6 billion stemming from risk prevention expenditures and other categories of expenditure where adaptation is integrated (Medarova-Bergstrom et al., 2011). The EU budget proposal for 2014–2020 promises a substantial increase — at least 20 % — around EUR 200 billion — shall be used for climate change and come from different policy fields (EC, 2011b). For example, the LIFE+ programme supports integrated projects focusing, among others, on themes relevant for climate change adaptation such as river basin management plans, cross-border flood prevention strategies and climate adaptation plans in the EU Member States. The total budget of LIFE+ over 2014–2020 is EUR 3.2 billion, out of which EUR 0.8 billion are destined for climate change (EC, 2011c). However, the proposed 20 % shall support both climate change mitigation and adaptation. Following the current discussion and under the perspective of the Europe 2020 strategy, the focus seems to be on mitigation rather than adaptation. For example, in Cohesion policy the proposal of ring-fencing of funding currently concerns only energy efficiency and renewable energies while the use of funding for climate change adaptation is not mandatory (EC, 2011d). The EU seeks to guarantee the effectiveness of climate related spending through mechanisms such as: • (ex ante) impact assessments to determine climatic and environmental impacts of proposed measures; • streamlining proposed measures under specific objectives and checking deliveries against result indicators; • tracking expenditure across different funding instruments to secure synergies. In addition, the cohesion policy foresees mechanisms for climate and environmental investment proofing (EC, 2011d; Medarova‑Bergstrom et al., 2011) and promotes a broader approach to sustainable urban development. Perhaps the most relevant for urban areas is the EU's cohesion policy with its related structural funds which comprise a substantial part of the EU budget. This is in addition to the INTERREG and URBACT programmes. The funds hold the potential to support specific adaptation projects in cities and regions. For example, urban renewal projects can actively consider climate change by providing sufficient green infrastructure. Furthermore, the funds and the INTERREG programme (Box 4.5) support knowledge development, testing and validation of knowledge development, developing and implementing regional adaptation strategies and projects and generation of awareness amongst relevant stakeholders and the general public (Ribeiro et al., 2009). However, cohesion policy can potentially also hinder adaptation when, for example, large infrastructure projects are not climate proofed. Systematically integrating adaptation requirements in projects, programmes and policy evaluation would help to avoid such maladaptation. Furthermore, EU cohesion policy, targeting economic growth, education, technological Box 4.5 INTERREG projects highly supportive for local and regional adaptation A series of INTERREG projects in the Baltic sea region has addressed climate change adaptation since 2002. Three consecutive projects: SEAREG (Sea Level Change Affecting the Spatial Development in the Baltic Sea Region, 2002–2005), ASTRA (Developing Policies Adaptation Strategies to Climate Change in the Baltic Sea Region, 2005–2007) and BaltCICA (Climate Change: Impacts, Costs and Adaptation in the Baltic Sea Region, 2009–2012) have been important platforms for several local, regional and state agencies. This is with respect to raising awareness about regional and local climate impacts and the relevance of adaptation in their respective jurisdictions as well as devising adaptation options for particular local and regional challenges in fields such as tourism, urban planning, and water management. A number of INTERREG projects directly targeting urban or regional climate change adaptation in different regions of the EU have since been initiated. Source: Schmidt-Thomé and Peltonen, 2006; Hilpert et al., 2007. Project websites: SEAREG: http://www.gsf.fi/projects/seareg; ASTRA: http://www.gsf.fi/projects/astra; BaltCICA: http://www.baltcica.org.
  • 106.
    Multi-level governance —enabling urban adaptation 104 Urban adaptation to climate change in Europe development and infrastructure provision, can increase the adaptive capacity of cities by promoting learning and broad participatory action. A systematic mainstreaming of adaptation into policies and programmes would increase the chance that adaptive capacity is raised. Important pieces of legislation for mainstreaming adaptation in the EU include the Water Framework Directive, the Floods Directive and the Water Scarcity and Droughts strategy (EC, 2000b, 2007a, 2007c). The Environmental Impact Assessment Box 4.6 Mainstreaming Adaptation — the Water Framework and the Floods Directive The Water Framework Directive (EC, 2000b) establishes a legal framework to protect and restore clean water across Europe by 2015 and ensure the longterm sustainable use of water. It required that river basin management plans for the period 2009–2015 were developed by December 2009 in all river basin districts across the EU. These were due to take climate change impacts into account. In addition, climate change must also be properly integrated in the implementation of the Floods Directive (EC, 2007a). Water directors of EU Member States issued a Common Implementation Strategy (CIS) guidance document (EC, 2009d) that addressed the integration of climate change impacts and adaptation in the implementation of the Water Framework Directive, the Floods Directive and the Strategy on Water Scarcity and Droughts (EC, 2007c). This was particularly in view of Member States' second (2015) and third (2021) river basin management plans. Under the 2012 Water Blueprint, the European Commission will also review the Water Framework and Floods Directives, and the Strategy on Water Scarcity and Droughts. The Flood Directive provides the background to updating national water laws and can accelerate activities as regards reducing the impact from flooding. In countries such as Poland, where little awareness exists on the impacts of climate change and adaptation needs, EU legislation such as the Floods Directive can trigger and support some local and regional adaptation work. Its implementation led to the assessment of flood risks in Poland. On this basis many cities in Poland were able to prepare adaptation plans for flood risks including: • the identification of vulnerable regions and cities; • flood impact assessment; • flood risk management; • monitoring and information system; • guidelines and procedures; • information on rescue services, resources, and regulations. See also: http://www.kzgw.gov.pl/pl/Wstepna-ocena-ryzyka-powodziowego.html. Photo: © Zoli Directive (EC, 2011a) can be an important tool for procedural integration of adaptation (see discussion later in Section 4.3.1). Currently it does not consider climate change adaptation sufficiently. The on-going review offers the opportunity to correct this. The European Commission is developing a strategy for an EU‑wide green infrastructure as part of its post‑2010 biodiversity policy. This would include not only areas falling under the remit of Natura 2000 (EC, 1992) but also urban green areas, green roofs and walls supporting biodiversity as well as climate change adaptation.
  • 107.
    Multi-level governance —enabling urban adaptation Urban adaptation to climate change in Europe 105 Limitations of European governance The level of involvement of the European Union in local and regional adaptation, vis-a-vis the subsidiarity principle, still remains an open issue. The subsidiarity principle delegates regulations to the lowest relevant level of government. Interpreting this literally can lead to problems with providing effective climate change adaptation due to the fact that this involves cooperative actions at various levels. The extent of control that the EU will have over various levels of planning within the Union still remains to be debated (Swart et al., 2009). For example, Member States decide with their Operational Programmes which projects it will include and where exactly EU funds will support. It is in their power to ensure adaptation is sufficiently considered in EU spending. A governing in partnership model was discussed in respect to the Europe 2020 strategy and future cohesion policy. Yet a partnership gap still hinders the strategy as local and regional authorities have only been consulted, but not involved, in the conception and implementation of national reform programmes (CoR, 2011b). The process of developing the European Adaptation Strategy 2013 can be a cornerstone for a better partnership approach. Further reading • VÁTI, 2011, Climate-Friendly Cities: A Handbook on the Tracks and Possibilities of European Cities in Relation to Climate Change, Ministry of Interior Hungary — VÁTI, Budapest (http://www.eukn.org/ dsresource?objectid=224489). • CoR, 2011a, Adaptation to Climate Change: Policy instruments for adaptation to climate change in big European cities and metropolitan areas, European Union. Committee of the Regions, Brussels (http://80.92.67.120/en/documentation/studies/Documents/Adaptation%20to%20Climate%20Change/ EN.pdf). • Ribeiro, M., Losenno, C., Dworak, T., Massey, E., Swart, R., Benzie, M. and Laaser, C., 2009, Design of guidelines for the elaboration of Regional Climate Change Adaptations Strategies. Study for European Commission. Policies for economic and social cohesion have traditionally targeted the economy and living conditions across Europe. Climate change adaptation requires place specific approaches. The identification of adaptation hotspots and a cohesion policy which targets climate change adaptation needs with territorial selectivity would break new ground whilst acknowledging that challenges remain. (see discussion in Section 4.3.2). Achievements in the integration of adaptation in sectoral policies remain a challenge for the EU. Next to the water and nature directives, adaptation policy must also be embedded in sectoral policies such as agriculture, transport and energy (see examples in Table 4.3). Even if the EU's principle spending programmes (CAP, structural funds, INTERREG, LIFE) already allow for spending on adaptation-related measures there is ample room for improvement (Ellison, 2010). For example the URBACT programme targeting the exchange of experiences between cities regarding urban development has not one single project for climate change adaptation.
  • 108.
    Multi-level governance —enabling urban adaptation 106 Urban adaptation to climate change in Europe 4.2 Bridging the levels — multi-level governance 4.2.1 The needs and benefits of multi-level governance Cities within one nation can differ significantly, for instance, with regard to the degree of inclusion of non-governmental partners in local development. Cities are in a unique position to develop tailored responses to the impacts of climate change. They have first-hand knowledge of local conditions and can develop proactive strategies in response to climate change, experimenting with local solutions and committing to ambitious targets. Local authorities can work together with voluntary efforts such as city networks, the private sector and community organisations to develop new institutional models for local adaptation (Piorr et al., 2011). Cities do not act in a vacuum. They are embedded in a legal and institutional context set by national governments, the EU and global developments — conditions which can be supportive or constraining. Ambitious local governments can complement national and European priorities through linkages with similar-minded municipalities. This can be viewed via initiatives such as the Durban Adaptation Charter for Local Governments (2011) and efforts from various pioneering cities. Another example was the 'Nottingham Declaration' in the United Kingdom which supported the national government in developing adaptation requirements for the local level (Keskitalo, 2010b). In this context, a multi-level governance approach can build bridges between disconnected levels Key messages • Ambitious municipalities can certainly carry out truly innovative projects in urban adaptation. Doing this effectively and efficiently is, however, only possible if support comes from regional, national and European levels. • Mainstreaming of adaptation in other policy areas and legislation such as the Water Framework, and the Floods directives, and EU cohesion policy is key. It must be stated, however, that a number of regulations and funding mechanisms do not mention adaptation. The proposal for the EU's next Multi-annual Financial Framework will require that 20 % funding for climate change mitigation and adaptation is sourced from different policy sectors. • A holistic multi-level governance approach can bridge the gaps between the different levels of governance and provide a coherent and effective framework for urban adaptation. • Since 'adaptation' is a relative newcomer in policy development, multi-level governance in the form of dialogue between government levels, private actors and citizens is of particular importance. of government, issue-specific jurisdictions and stakeholders to support concerted action. The benefits of multi-level governance are: • coordination can lead to implementation that is more than the sum of individual measures; • joint work between stakeholders at all levels avoids processes becoming locked in conflict; • it allows for measures which cannot be developed or implemented by one actor due to limits of jurisdiction or responsibility; • multi-level governance promises effectiveness and efficiency gains. The concept of multi-level governance Modern governance is not based on a centralised 'command and control' system but is dispersed across multiple centres of authority (Hooghe and Marks, 2003). There are many self-organising, inter-organisational networks which complement existing hierarchies in terms of allocating resources and exercising control and coordination (Rhodes, 1996). Two dimensions of governance exist: vertical and horizontal. As Section 3.3 has already dealt with the horizontal dimension, subsequent sections will focus on the vertical dimension i.e. multi-level governance. Different types of multi-level governance exist. Type 1 refers to a clear division of jurisdiction
  • 109.
    Multi-level governance —enabling urban adaptation Urban adaptation to climate change in Europe 107 between hierarchical levels of government. It relates to the division of tasks in federal states and is about power sharing among a limited number of governments operating at just a few levels. Type 2 refers to flexible networking activities related to a specific task. Functional jurisdictions are continuously shifting and have no clear borders (Table 4.4) (Hooghe and Marks, 2003). Urban adaptation policy is at an embryonic phase and a lack of fluidity should be accepted by policymakers. In this instance type 2 multi-level governance is of particular relevance for urban adaptation, although in practice a combination of both types is needed. This report uses the following definition for multi-level governance: non-hierarchical forms of policymaking, involving public authorities as well as private actors, who operate at different territorial levels, and who realise their interdependence (based on Kohler-Koch and Rittberger, 2006). The overall governance context Developing multi-level governance approaches for urban adaptation in Europe needs to consider the diversity of formal governmental systems within Europe. Government structures vary in Europe as well as the extent to which a centralised or decentralised approach is used. These systems can determine the ways in which local, regional and national authorities can act (Keskitalo, 2010a). In a more decentralised state, or a state with strong regional and local authorities, the local level usually has stronger decision-making rights and more responsibilities and options for managing adaptation rather than being dependent on funding from the state level. In federal states — such as Germany — regional governments usually have strong decision-making rights. Unitary states, where the central government determines the powers and competences, can also have strong local and regional Type 1 Type 2 Tasks General-purpose jurisdictions: multiple functions, and in many cases, a court system and representative institutions Task-specific jurisdictions, for example, solving a particular common resource problem Members Non-intersecting memberships Intersecting memberships Levels Jurisdictions organised at a limited number of levels No limit to the number of jurisdictional levels Design System-wide architecture Flexible design, no great rigidity Table 4.4 Two types of multi-level governance Source: Based on Hooghe and Marks, 2003. governments. Sweden, for instance, although an unitary state, has strong municipal governments holding so called 'local planning monopolies' (Keskitalo, 2010a; PLUREL, 2011). If cities have the capacity to make more decisions then this will place them in the position to decide, relatively independently, on issues related to adaptation. However, if a city has not prioritised adaptation itself little pressure will be forthcoming. Large differences between the cities can develop as it is the case in Sweden. Adaptation as a priority does not always develop in vulnerable cities even if the administrative power to do so exists. Other factors, such as political leadership and the economic situation, can also be driving forces (Keskitalo, 2010a; 2010b). In a more centralised state or administration, the local level is in general guided by the central or regional administrations. If adaptation is high on the national or regional agenda, legislation can ensure a minimum level of relevant action at the local level. In the United Kingdom the previous government developed relatively strong central steering on adaptation. This included an indicator on adaptation within the system for local government evaluation (Box 4.7) (Keskitalo, 2010b). However, a centralised state or administration that is not focused on adaptation may restrict possibilities for local governments. Understanding of the different governmental contexts in Europe is decisive when developing appropriate multi-level governance approaches. As well as interacting at the state level, local governments can also operate within a European level. This allows for cooperation between territories of the European Union, like the European macro‑regional strategies of the Baltic Sea or the Danube (Piorr et al., 2011). Such programmes can encourage cooperation between local governments with EU funding assisting to finance
  • 110.
    Multi-level governance —enabling urban adaptation 108 Urban adaptation to climate change in Europe adaptation‑related development (Keskitalo, 2010d; Juhola, 2010; Westerhoff, 2010). The EU also holds a large number of policies that impact local and regional land use, including the Habitats and Water Framework Directives (Ellison, 2010). The complex collective-action problems related to climate change mitigation and adaptation lead to a situation where no actor can resolve these problems single-handedly (Kooiman, 1993; Stone, 1986). In Europe, each level of government has a role to play in supporting climate change adaptation in cities and towns. 4.2.2 Challenges Multi-level governance also faces barriers that cause ruptures in the policy cycle of adaptation. Preliminary results of a survey among the EU Member States presented in the European Climate Adaptation Platform CLIMATE-ADAPT lead to the conclusion that multi-level governance on climate change is not yet fully established. In a range of countries, urban adaptation still happens in an ad hoc fashion and in isolation. Different barriers lead to problems in policy formulation, knowledge integration for decision support, decision-making, implementation and, finally, in monitoring and evaluation. Box 4.7 UKCIP — an example of support for coordinating adaptation across governmental levels The United Kingdom Climate Impacts Programme (UKCIP) has often been hailed as a success story in providing support for coordination of climate change action across levels. A comprehensive approach, facilitating local and regional, public and private actors to devise and implement adaptation measures contributed to its success. The UKCIP provides a uniform platform for local authorities and for coordination on adaptation in the English regions. It supports bringing local authorities to certain minimum levels of adaptation. It also provides a uniform knowledge base of climate scenarios and an important channel of communication between different levels of government and the scientific community. Sources: Keskitalo, 2010b and 2010d; McKenzie Hedger et al., 2006. Barriers can have structural, institutional or more operational characters: • Structural challenges to governing climate change adaptation include: - Unclear authority and responsibilities, linked with financial constraints to urban adaptation. The current structures and budgets for strategy development and decision-making at local, regional, national and European level are often not appropriate for multi-level governance. - A narrow interpretation of the subsidiarity principle restricts interaction with other governmental levels. Once the responsibility of certain adaptation-related duties is relegated to one authority, others are less inclined to facilitate and coordinate. - Adaptation is a long-term process while political structures and persons at all levels are changing over shorter periods. Long-term decisions prove difficult to achieve (ICLEI, 2010). • Operational challenges include: - A lack of communication and transparency between different spatial scales and sectors. A lack of understanding of each other's language and culture can lead to unnecessary conflict; it takes time to build trust and understanding.
  • 111.
    Multi-level governance —enabling urban adaptation Urban adaptation to climate change in Europe 109 - Inadequate organisation of the science-policy interface leads to a lack of capacity to raise awareness on adaptation challenges and responses, to sustain attention on adaptation, and to provide a sound knowledge base for adaptive action. - Financial constraints are evident barriers to operational multi-level governance, because multi-level governance requires additional resources. This includes costs which are typically subsumed as working hours. - The complexity of the adaptation challenge may well prove a problem for politicians who wish to demonstrate the direct impact of their work (ICLEI 2010). Table 4.5 lists typical structural and operational barriers governing urban adaptation at local/ regional and national/European level and adds possible responses from a multi-level approach. Table 4.5 Key barriers to local adaptation and possible multi-level governance responses Barrier type Barriers at local and regional level Possible support from a multi-level governance approach Barriers at national and European level Jurisdictional and institutional Lack of mandate at the subnational level to address adaptation issues and problems of regional coordination between municipalities. Clear mandates for local authorities, clarity of responsibilities between local, regional, national and European actors; Acceptance of the territorial cohesion approach and the Territorial Agenda. Narrow interpretations of subsidiarity leaves little room for flexibility. Maladapted institutional designs which hinder coordination across relevant issues (vertical/horizontal). Ensuring policy coherence, establishing mechanisms and incentives for horizontal and vertical coordination, addressing issues of scale and the problems of institutional fit and interplay; Development of the EU adaptation strategy as an opportunity. Novelty and instability of the adaptation agenda, the EU's role still being developed. National or regional laws, rules and regulations lead to maladaptation and increase vulnerability. Climate proofing/mainstreaming of local adaptation needs into national and European legislation and budgeting; Policy coherence through procedural integration of adaptation, e.g. in SIA, SEA and policy evaluation. Sectoral policies with vested interests. Political Local authorities influenced by particular special interests. Enforce the applications of the principles of good and democratic governance; Ensure broad public participation. Authorities influenced by particular special interests. Pressure to maintain 'business as usual' development pathways. Clear signals, including incentives, from national and European to local policy levels, that change is necessary; Articulate, to national and European level, local demand for change based on local adaptation experiences; Using the momentum of extreme weather events and other crises to forward the adaptation agenda. Pressure groups and political interests emphasise 'business as usual' development pathways. Pressures of short-term electoral cycles on effective risk management and long time-lag to reap full adaptation benefits. Raising awareness for the challenge and urgent need for adaptation — use local pressure where climate change impacts are felt first; At the local level, use integration into long-term national and European processes; Sustained attention on procedural integration of adaptation in monitoring and evaluation efforts. Adaptation not a priority at national or European level, rather on mitigation, eco-efficiency, innovation and green growth. Lack of willingness to accept costs and behavioural change. Build clear evidence on costs and benefits of adaptation; Communication about early-adapters and best practice; Exchange European-wide knowledge; good practice and dialogue with stakeholders across all levels; Use local pressure to act. Lack of willingness to accept costs.
  • 112.
    Multi-level governance —enabling urban adaptation 110 Urban adaptation to climate change in Europe Source: Adapted and expanded from Corfee-Morlot et al., 2009; Corfee-Morlot et al., 2010. Table 4.5 Key barriers to local adaptation and possible multi-level governance responses (cont.) Barrier type Barriers at local and regional level Possible support from a multi-level governance approach Barriers at national and European level Economic and budgetary Lack of resources or funding to address problems identified. Climate proofing the budgets at different levels; Provide guidance and support for applicants to EU and national funds; Support the creation of market demand for adaptation; Establish support for local adaptation policies and measures, e.g. through public-private partnerships. Lack of resources, including immediate challenges of financial austerity. Differences between perceived and real costs and benefits. Improve, exchange and coordinate knowledge across Europe; Grasp the chance for structural improvements in the context of the financial crisis; Search for solutions across levels. Uncertainty about the costs of climate change; Problems in determining sufficient level of intervention. Difficulties mainstreaming adaptation into different budget lines. Awareness raising and education of stakeholders in other sectors than adaptation; Exchange knowledge and experience with other regions and other level governments; Establish clear guidelines for systematic mainstreaming. Difficulties mainstreaming adaptation in different budget lines. Inter-sectoral competition over budgeting in view of no increase expected. Need to make an economic case on adaptation — show economic benefits of multi-purpose adaptation measures; Use good practice from elsewhere. Inter-sectoral competition over the national/European budgeting — no increase expected. Technical and scientific Lack of local scale relevant scientific or technical information. Collect and summarise knowledge and information via central platforms such as the European platform CLIMATE-ADAPT; National and European research aimed at local vulnerability and adaptation, also with high emphasis on practice-oriented results and tools; Exchanges with regional and local knowledge holders; Establish science-policy organisations (boundary organisations) and networks such as regional climate partnerships; Support European climate research through EU instruments (Framework programmes) and national instruments, including joint programming between Member States; Establish and develop monitoring tools for following progress in adaptation strategies and measures (e.g. national reporting comparable to climate policy in mitigation). Lack of coherent, comparable, up-to date knowledge on national regional and local vulnerabilities and adaptation. Inadequate understanding or ignorance of climate risks. Develop climate change communications programmes and training tools; Make use of communication efforts at other levels; Use of information and training tools provided at internet portals at national and European level like the European platform CLIMATE_ADAPT. Challenges in communicating climate change effectively. Scientific uncertainty; Lack of technical capacity or access to expertise. Establish across levels common guidelines for vulnerability assessments; Provide support tools and training from national and European levels; Support practice-relevant and academic research and support by boundary organisations.
  • 113.
    Multi-level governance —enabling urban adaptation Urban adaptation to climate change in Europe 111 4.2.3 Success factors Making multi-level governance for climate change adaptation a success depends on certain factors including: • broad acceptance of the complexity of adaptation challenges and necessary action together with a strong commitment from concerned stakeholders to cope with the challenges by integrated and multi-level governance while respecting Europe's principle of subsidiarity and responsibilities; • adequate distribution of authority and responsibility, correct processes and good relationships and coordination between spatial scales and actors; • multi-level institutional and decision-making structures that reflect the complexity of adaptation challenges and the interlinkages between the different governmental levels; • stable structures over longer periods despite political changes to ensure continuous work as increasing the adaptive capacity requires time; • a comprehensive knowledge base about climate change impacts, vulnerabilities and adaptation options needs to be established and continuously updated such as the European Climate Adaptation Platform CLIMATE‑ADAPT; • regional projections on impacts and vulnerabilities, alongside global and European information; • tools of active information exchange and continuous learning supplementing CLIMATE‑ADAPT and making it work via joint projects, development of transferability tools for good practice, training, staff exchange and coaching (Rob Swart et al., 2009; Georgi et al., 2012). Research and experience on environmental policy integration shows that a variety of communicative, organisational and procedural instruments can also support integration. Mickwitz, 2009 points to measures such as making impact assessments climate change inclusive, coordinating territorially through spatial planning, using national and other public budgets for mainstreaming and introducing cross-compliance requirements (such as on environmental regulations) for target groups receiving benefits in other policy fields. Further reading • Keskitalo, E. C. H., 2010, Developing adaptation policy and practice in Europe: multi-level governance of climate change, Springer, Dordrecht; New York. • Corfee-Morlot, J., Kamal-Chaoui, L., Donovan, M., Cochran, I., Robert, A. and Teasdale, P., 2009, Cities, Climate Change and Multi-level Governance OECD Environmental Working Papers N° 14, OECD Publishing. • VÁTI, 2011, Climate-Friendly Cities: A Handbook on the Tracks and Possibilities of European Cities in Relation to Climate Change, Ministry of Interior Hungary — VÁTI, Budapest (http://www.eukn.org/ dsresource?objectid=224489).
  • 114.
    Multi-level governance —enabling urban adaptation 112 Urban adaptation to climate change in Europe 4.3 Pillars for multi-level governance Key messages • Policy coherence, territorial governance, cross-level institutional capacities, access to funding and an adaptation knowledge base linking all levels are important building blocks towards a holistic multi-level governance approach. • The outlook on successful climate adaptation governance is rather optimistic, provided that European actors at different levels learn to work together and that climate change adaptation can be sustained as part of the EU political agenda. Based on these ideas and the factors mentioned in Section 4.2 the report elaborates the following pillars for multi-level governance: • policy coherence through multi-level climate proofing; • territorial governance and spatial planning as means for policy integration; • building institutional capacities across levels; • securing access to funding for adaptation measures; • developing the multi-level knowledge base. Table 4.6 provides a first overview. 4.3.1 Policy coherence through multi-level climate proofing The principle goal of climate proofing is to adapt the legal and policy framework, removing inconsistencies and barriers, until it supports urban adaptation to climate change. There are several ways to achieve this. Firstly, policymakers can screen existing frameworks for climate relevance and add, where necessary, the requirement to consider climate change. Systematic climate policy evaluation work can support evidence-based policymaking and learning in the longer term (Haug et al., 2009). Obvious examples at EU level are the Water Framework Directive and the Floods Directive (EC, 2000b; EC, 2007a). Introducing cross-compliance requirements (e.g. on environmental regulations) can also play a role in future revision processes. The climate proofing project from DG CLIMA (Altvater et al., 2011) has made efforts in this regard by assessing the European legal framework in four areas, one of which being urban areas. Secondly, climate proofing should play an important role when new regional and local policies are developed such as the EU budget for 2014–2020 (Box 4.8). Based on an analysis of sectoral policies and related adaptation measures, Urwin and Jordan (2008) suggest that climate proofing works best when integrated into the development of new policies at local and regional levels.
  • 115.
    Multi-level governance —enabling urban adaptation Urban adaptation to climate change in Europe 113 Contributions to put a multi-level governance approach into practice by: Local (urban) governments Regional governments National governments EU institutions Other stakeholders Policy coherence Linking up with national and EU adaptation strategies; Integration between city-sectoral programmes; Climate‑proof budgeting and planning. Integrate local needs with national and EU regional policy goals. Use the national budget as a driver for policy coherence; Eliminate national incentives for maladaptation; Climate-proofing and territorial governance. Use the EU budget as a driver for policy coherence; Mainstream adaptation into different policy areas providing a framework for national and subnational governments. Businesses can engage in climate‑proofing and support their local governments to follow suite. Institutional capacity Establish structures to access national and EU decision-making, e.g. intermediary associations and transnational networks such as CEMR, EUROCITIES, ICLEI. Establish intermediary organisations to facilitate regional climate co-operation and organise capacity building. Adjust responsibilities and tasks of the state; Establish clear roles and coordinating procedures between national and subnational governments. Facilitate access for local authorities in EU policymaking. NGOs and transnational municipal networks play an important facilitative role in climate policy and voicing local concerns at higher levels of policymaking. Spatial planning and territorial governance Integrate adaptation in urban planning and demand implementation into regional, national planning. Address adaptation in a regional planning approach in functional terms (i.e. regardless of city limits, bio-geographical regions, river basins etc.); Engage in EU territorial cooperation. Adopt and make use of the Territorial Agenda principles at national level; Include the spatial aspect of climate change impacts in national adaptation strategies. Promote the EU Territorial Agenda and encourage Member States to do so as well; Integrated adaptation into the territorial cohesion concept. Regional intermediaries (e.g. chambers of commerce, civil societies) can be supportive for territorial approaches. Funding Secure access to multiple sources of funding; Use value capture mechanisms to raise funds for local adaptation. Build regional networks and partnerships for adaptation funding. Facilitate local access to national and EU funding through national programming, guidelines and supporting tools. Climate-proofing the EU budget; Integrating financing adaptation into cohesion and other policies; Securing accessibility of EU funds to cities; ensure that adaptation is not overshadowed by mitigation. Private actors, e.g. insurance companies can facilitate innovation by raising funds. Knowledge Build capacities to knowledge absorption and adaptation; Cooperate with research institutions and individual knowledge providers; Provide local knowledge to other levels. Share adaptation knowledge on a regional forum; Provide regional knowledge to national and European level; Coordinate climate relevant research and development projects regionally to save costs; Encourage the exchange of knowledge and practice. Establish national climate change communication programmes and information portals and link with the other levels; Adaptation research; Guidance and training programmes; Establish boundary organisations to bridge science and policy. Channel research and innovation funds towards adaptation and ensure a broader usability in practice; Provide the European data context and improve data on urban adaptation; develop a coherent monitoring mechanisms for adaptation action; Make full use of CLIMATE-ADAPT Provide knowledge, e.g. universities, experts, citizens; Engage with practitioners at different levels, place value on practical applications of adaptation research. Table 4.6 Summary table of possible actions of the different stakeholders to develop the multi‑level governance framework and tools for urban adaptation in Europe
  • 116.
    Multi-level governance —enabling urban adaptation 114 Urban adaptation to climate change in Europe Thirdly, designing laws and policies in a way that provides people with sufficient adaptive capacity can also increase support to the legal and policy framework. Policies and laws in particular in the areas of economy, social, cohesion, education and research can enable society (individuals, organisations and networks) to cope better with climate change (Gupta et al., 2010). A higher level of education is assumed to increase citizens' adaptive capacity due to better knowledge absorption skills and higher incomes. The current proposal for the European Social Fund regulation (ESF) shall support a shift towards climate resilience through the reform of education and training systems, developing skills and qualifications (EC, 2011b). European programmes to support a smarter and more inclusive European development can thus increase the adaptive capacity of individuals, cities and societies. Overall, both new and existing policies and regulations need not only to be climate proof but also urban proof. This means that regional, national and European governments check the likely impacts of their policy on the options open for cities to act in order to be supportive rather than hindering local action. If, for example, rail tracks or motorways, planned at national level and eventually funded Box 4.8 Climate proofing the EU budget 2014–2020 The Institute for European Environmental Policy (IEEP) analysed the opportunities for climate proofing the EU budget and developed a guide for policymakers. It aims to aid policymakers in the forthcoming preparations and negotiations for the post-2013 MFF. The guide aims to clarify what climate proofing the EU budget actually means and how it can be put into practice when addressing the forthcoming EU budget. Experience gained through the implementation of the current Cohesion Policy can also be used. It also addresses some of the key questions on the future EU budget, including whether or not the main priorities and policy goals of the EU budget are coherent with the EU's climate change objectives. If not, what could and should be done about this? And how can the EU budget be turned into a tool to support efforts to tackle climate change? Among the priority measures, the following are identified: • securing more funds for climate change, including a dedicated climate fund; • setting cross-cutting priorities on climate change in the EU budget; • applying conditionality and incentives; • reforming and phasing out harmful spending; • development of climate change-related indicators and reporting (Medarova-Bergstrom et al., 2011). In the case of the Cohesion Policy for the period 2014–2020, the proposal for the regulation of the Structural Funds already foresees climate change adaptation and risk prevention as conditionality. National and regional risk assessments have to be in place to obtain funding (EC, 2011e). It would ensure that infrastructure in particular, which lasts for decades and is very expensive, can cope with future climate changes. by the EU budget, cut off areas for flood retention, local and regional governments are left with fewer options for flood management. One facet relevant for building policy coherence is the so called 'procedural integration'. Procedural integration requires considering climate change adaptation in the whole process at all levels without dictating the outcome. See Figure 4.2 for an example of integration into the framework for cohesion policy. Environmental Impact Assessments (EIAs) are another example particularly relevant for the purpose of procedural integration (Agrawala et al., 2010). This is due to the wide thematic and institutional reach of EIAs. Incorporating adaptation concerns in EIAs would affect existing modalities for development project design, approval and implementation and would be done through multiple entry points. Several national and sub‑national (local, regional) authorities, as well as international organisations using EIAs have made some progress in examining the possibilities of incorporating climate change impacts and adaptation measures within the EIA context. Highly relevant for this mainstreaming effort is the on-going revision of the EIA directive as a way to ensure that Strategies and Instruments for Climate Proofing the EU Budget Keti Medarova-Bergstrom Axel Volkery Pernille Schiellerup Sirini Withana David Baldock
  • 117.
    Multi-level governance —enabling urban adaptation Urban adaptation to climate change in Europe 115 Figure 4.2 Mainstreaming climate change into the process of cohesion policy at different levels Source: Adapted from Claus Kondrup, 2011. Mainstreaming climate change EU Policies — EU Law — Europe 2020 — MFF Cohesion package — set of Regulations Common Strategic Framework National legislation, policies Partnership contracts Operational programmes National/regional priorities Selection criteria Calls for proposals Projects on the ground plans and projects falling under this scope require climate proofing as a pre-condition with implication for the local and regional development (Mickwitz, 2009; Birkmann and Fleischhauer, 2009). The inclusion of climate change adaptation into EIA and SEA involves a number of challenges. The limited availability of detailed information on historical climate patterns, as well as specific scenarios of future climate for the project location poses a major challenge. In many jurisdictions such information is currently not available (Agrawala et al., 2010). In addition, if the process does not adequately consider the uncertainties associated with climate change projections, it risks counterproductive investments in altering project design. Thus, the procedures need a degree of flexibility to accommodate new information on climate change. In this sense, the climate-proof EIAs need to demonstrate features of adaptive management, where new information on both climatic and socio-economic changes can be factored into the EIA process (Pahl-Wostl, 2009). 4.3.2 Territorial governance From a European perspective, the European Union institutions along with the national governments need to identify regions and cities with similar problems as well as hotspots for adaptation. The results of Chapter 2 and Section 3.1 show that the impacts of climate change and the adaptive capacity of cities differ between cities as well as regions. This enables them to channel their support to urban adaptation where it is most needed because of high climate impacts or a low capacity for adaptation. The tailored support is more effective than a one‑size-fit-all-approach. Spatial or territorial planning provides an important tool for bridging existing governmental levels and sectoral agendas and provides a procedure for solving multiple problems simultaneously. The integration of climate change considerations into spatial plans at different levels can increase urban resilience in efficient and non-disruptive ways. For example, a heightened flood risk and an urban heat island effect can both be addressed by increasing green and blue (water) spaces in local plans and, at the same time, serve recreation and nature. The effect will however be more efficient if regional planning protects vegetated areas outside the city for flood retention and as creators of fresh air. If national governments and the European Union have identified a particular region as an adaptation hotspot and support it, this will accelerate local adaptation and contribute to a more resilient Europe with a balanced and harmonious development (Figure 4.3). It seems that stakeholders at different levels broadly understand the importance of spatial planning but in practice they have yet to develop comprehensive and consistent territorial multi-level governance for adaptation. A review of European national adaptation strategies confirms this observation (Mickwitz, 2009). If the territorial approach is not incorporated at national and subnational levels, friction is likely to emerge between local planning and national policymaking. In Finland, for instance, this issue has been addressed by establishing so called national land use objectives above regional and local planning in the planning hierarchy. Among European countries, the Netherlands seems to place the use of spatial planning as the highest priority in its national adaptation strategy (NAS). EU Member States have generally rejected overtures from the EU on spatial planning in the past. In practise however, EU policies and legislation have influenced regional and local planning in a broad
  • 118.
    Multi-level governance —enabling urban adaptation 116 Urban adaptation to climate change in Europe Figure 4.3 Generic example of a multi-level territorial approach to adapting to flood risks and heatwaves in a city and diffuse way. EU directives focusing on air quality, noise and water have become a point of reference for regional actions. European resources, in particular available through structural and cohesion funds, have shaped territorial policies, while their financial requirements and evaluation procedures have influenced regional governments (Faludi, 2009). EU territorial approaches imply soft methods of coordination, including the evaluation of policy and feedback from national and sub-national levels as tools of coordinating adaptive actions in the EU. The EU's Territorial Agenda, a process which began with the European Spatial Development Perspective (ESDP) at the end of the 1990s, marked a turning point in the EU's role as regards spatial planning. The Territorial Agenda has moved from an implicit to explicit stage, even if it still lacks the status of official EU policy (Faludi, 2009). Importantly, climate change has had a growing, even constitutive, role on the Territorial Agenda, building pressure within the EU to develop territorially oriented, coordinated responses to the multiple and varying challenges of climate change. In 2007, under the German presidency of the EU, the agenda stipulated that joint trans-regional and integrated strategies should be further developed in order to face natural hazards, reduce and mitigate greenhouse gas emissions and adapt to climate change. It also established the link between territorial cohesion policy and territorially differentiated adaptation strategies (German EU presidency, 2007). The present EU Territorial Agenda 2020 (Hungarian EU presidency, 2011) notes that the impacts of climate change vary considerably across Europe with varying impacts and different degrees of vulnerability. It addresses the geographically diverse impacts by referring to regions' varying risk profiles and opportunities in relation to both adaptation and mitigation challenges. The agenda further notes that these challenges draw attention to the territorial coordination of policies especially climate, energy, water management, agriculture, housing, tourism and transport. In parallel, EU cohesion policy developed the concept of territorial cohesion in addition to social and economic cohesion. The concept, introduced with the EU Green paper on territorial cohesion (EC, 2008), aims to promote a balanced and harmonious development in particular by reducing social and economic disparities between regions. Addressing regional imbalances will be more relevant than ever in the future and of particular relevance for climate change adaptation. The implementation of the post-2013 MFF will show Region Country EU City Vegetated areas and open channels for fresh air for the city Identification of hotspots and specific adaptation needs Tailored support Communication of needs Feedback on effectiveness Id h Green urban infrastructure (parks, trees, roofs) to buffer heat and floods Protection of vegetated areas and wetlands for flood retention and infiltration
  • 119.
    Multi-level governance —enabling urban adaptation Urban adaptation to climate change in Europe 117 how the concept of territorial cohesion including a territorial approach to climate change adaptation is put in practice. Despite the growing acceptance of EU territorial governance, the process is still informal and depends on political priorities. Multi-level implementation is still at an early stage. Only a few Member States have adopted the territorial agenda and territorial governance approaches in their national level practices (Faludi, 2009). Regarding territorial cohesion and the consideration of the urban dimension as well as climate change adaptation, the process of designing the next programming period 2014–2020 will show how far the principles of territorial governance are accepted and climate change is considered as a central thematic area. 4.3.3 Developing institutional capacities across levels Climate change is a multi-level challenge which cannot be tackled at one administrative level only. Besides intergovernmental institutional linkages, Box 4.9 Towards a Baltic Sea regional adaptation strategy — an EU territorial approach The EU Strategy for the Baltic Sea Region (EUSBSR) is a pilot case of new location-based policymaking in the European Union and acknowledges that the Baltic countries have major environmental problems to address together. This transnational regional initiative embodies the idea of territorial governance, focusing on the horizontal integration of policy goals in a given territorial context. As part of a common Baltic action plan, the EUSBSR calls for the development of a 'regional adaptation strategy at the level of the Baltic Sea Region' which would provide a useful framework for strengthening co-operation and sharing information across the region on this issue. The strategy would also ensure complementarities with the White paper on adaptation (EC, 2009b) and other EU initiatives, focusing on cross-border issues, developing more robust evidence on the impacts of climate change and raising awareness on the issue in the region (EC, 2009c). Building on a longer term process of regional research cooperation in the region, the on-going BaltAdapt project seeks to answer the call for the macro‑regional adaptation strategy. The project seeks to identify commonalities in the adaptation strategies at different levels in the Baltic Sea Region, and to develop a common policy platform for the development of a Baltic Sea Region Climate Change Adaptation Strategy. The macro-regional strategy attempts to link regional and local activities with European and global measures. The strategy has led to concrete action, with a more streamlined use of resources. New working methods and networks have been established and a number of initiatives developed. The strategy is a pioneer case also aiming to better streamline all funding instruments (EC, 2011f). Source: http://www.interact-eu.net/baltic_sea_strategy/eusbsr/284/3949. Photo: © Romtomtom-Flickr there is a clear need for functioning communication channels between government authorities and private and public actors which is crucial for coordination of climate adaptation. The organisation of effective participation and communication is therefore an important prerequisite for climate adaptation. This communication between individuals, public and private actors gives rise to 'network power', which emerges as diverse participants in a network focus on a common task and develop shared meanings and common heuristics that guide their action (Booher and Innes, 2002). Comprehensive participation and communication can sometimes pose a challenge as it can conflict with the existing capacities of governmental organisations. Departments with a highly technical character, such as water management, can lack the capacity to organise dialogue. They may even express an aversion ('all talking and no action'). This may necessitate awareness raising, training, hiring communication specialists and establishing a new culture towards a more open attitude.
  • 120.
    Multi-level governance —enabling urban adaptation 118 Urban adaptation to climate change in Europe The channels through which local authorities gain access to the EU policy process are an important aspect of institutional capacity building in Europe. So far, local authorities have no direct access, but the process of 'Europeanization' implies that cities can play a new role in shaping EU policy. Access to the European level becomes possible and traditional structures of domestic policymaking can be partially bypassed. Important initiatives in the past included the Sustainable Cities and Towns Campaign and the Covenant of Mayors where the European Commission interacted directly with local authorities. Experience gained there can serve to shape the multi-level approach around the EU adaptation strategy. Networks and associations such as the Council of European Municipalities and Regions (CEMR), and EUROCITIES make use of the opportunities to engage with the European Union. Cities gain access to the EU policy cycle through these intermediary bodies that have a status as accredited participants in the so called 'structured dialogue' with the Commission. The declaration 'Governing in Partnership' (2011) from the presidents of CEMR, AER, CPMR and EUROCITIES aims to prepare a code of conduct that the European Commission would adopt to ensure the involvement of the partners in the preparation, implementation, monitoring and evaluation of key policy documents. The European Parliament is also an important access point. Cities and their representative organisations can join political coalitions strengthening the Parliament's bargaining power and independence towards national actors. Organisations such as CEMR and EUROCITIES seek to establish a more formal role with the European Parliament and its MEPs (Heinelt and Niederhafner, 2008). In addition to CEMR and EUROCITIES, many environmentally minded municipalities participate in transnational municipal environmental networks such as ICLEI or the Climate Alliance. These non‑governmental networks are efficient in building knowledge and capacities in cities through peer‑to‑peer networking. These networks are clearly networks of pioneering cities, which means they can also process unique, innovative knowledge capacities as 'forerunners' (Kern and Bulkeley, 2009). Furthermore, these networks enable the European Commission and national governments to interact efficiently with a wide range of local authorities. The EU can play a role to foster multi-level governance by emphasising the importance of effective partnership in regional, national and European documents and settings. From the Commission perspective, cities are not only the places where adaptation takes place. They can provide feedback on the effectiveness of the Commission's proposals. After all, cities are unique observers of how different policies feed in to the local level. Cities may adopt a role of monitoring and carrying out compliance checks with a view to delivering feedback. Alongside these positive developments such informal ways of governance also bear risks. In the absence of formal procedures, participation depends on political will, lobbying and the local capacity. The ability of cities to benefit from EU structural funds depends, for example, on existing national procedures in place to develop and implement the various operational programmes. Participation possibilities for cities differ between countries. Developing clearer institutional frameworks which describe the specific roles of the different stakeholders and the interlinking forms can be crucial for successful multi-level approaches. Dividing responsibilities between levels of government in systematic and explicit ways provides benefits for both national and local authorities. For instance, the Dutch national adaptation strategy in 2007 included an explicit statement about the division of responsibilities between central government and other levels of government (see Box 4.10). Such delineations need adjustments over time as climate change adaptation is a relatively novel field and part of an on-going learning process. Cooperating with a diverse range of partners and finding joint solutions also has implications for senior management structures. Not every stakeholder feels confident with this situation as personal attitudes and different political cultures can create barriers to the policy process. Sufficient investment of time and resources with strong leadership can lead to these barriers being overcome. Lack of information is a potential barrier for multi‑level approaches to climate change adaptation. Multiple studies demonstrate that it is not the information as such that makes a difference rather, it is the context within which it is placed that can make it relevant for specific stakeholders (see more in Section 4.3.5).
  • 121.
    Multi-level governance —enabling urban adaptation Urban adaptation to climate change in Europe 119 National government Local and regional governments Assess the vulnerability of the national spatial development plan; Assess the impacts of climate change in the context of water; Finance knowledge development; Develop risk assessment, early warning systems, and methods to increase social awareness; Actively monitor the adaptation process; If needed, adjust policy-instruments (law, regulations) and strategic frameworks. Integrate climate change in provincial spatial strategies; Integrate climate change in new and existing research programmes at a provincial level; Revise regional adaptation funds to finance adaptation measures; Conduct small to medium sized case study projects. Table 4.7 The distribution of responsibilities between central and decentralised governments in the Dutch national adaptation strategy, 2007 Sources: PBL, 2011; Swart et al., 2009. Box 4.10 Distribution of responsibilities between national and local governments in the Netherlands A PBL study (2011) in the Netherlands shows that for (cost) effective adaptation a division is needed of responsibilities between national government and other parties within a comprehensive multi-level approach. The national government has the responsibility of providing a legal framework, a customised decision-making mechanism as well as financing mechanisms. In addition, the central government has the overall responsibility for tasks such as spatial planning, freshwater supplies and flood protection. In decentralising these responsibilities, the central government must create preconditions for adaptation to climate change for municipal authorities, water boards and city developers. This means that central government must indicate where the limits of its responsibility of care lie and what investments it expects. Regional and local authorities must steer adaptation strategies through multi-stakeholder alliances. If this multi-level coordination system works, the study expects that urban regions can be climate-proof within 60–80 years. In addition, the principle of negotiating responsibilities between levels of government has been adopted as part of the Dutch national adaptation strategy. Table 4.7 shows the delineations between the governments which need to fit together. 4.3.4 Securing access to funding for adaptation measures National and European funding can support and accelerate urban adaptation. As with other climate proofing efforts, funding options should be developed jointly between the local and higher levels of governance. Thus, funding climate change adaptation can rely on local or regional funds, national government and EU funding instruments. The multiple facets of budgeting and public finance allow for a variety of instruments to be used. These may include climate-focused taxes and charges, subsidies and budget allocations, removal of subsidies or taxes with harmful impacts and rules stipulating the ways public funds can be used and monitored (Mickwitz, 2009) (see also Section 3.3.7). These instruments should be used innovatively to promote climate change adaptation while securing policy coherence — i.e. funding adaptation measures needs to go hand in hand with the removal of incentives leading to maladaptation (see also the French example in Box 4.3). Although there have been regular concerns raised related to the level of funding for adaptation (e.g. Mechler et al., 2010 on refinancing losses from extreme events, and the European Solidarity Fund), many types of funding have already been available for adaptation. Whether it is urban renewal or making infrastructure climate proof by using EU structural funds, supporting regional adaptation strategies and measures by INTERREG projects, or national risk and disaster funds, a broad range of funds are available which can also provide support for local and regional climate change adaptation. The proposed increase towards 20 % of the EU budget earmarked for climate change in the financial period of 2014–2020 will further improve the situation (EC, 2011b).
  • 122.
    Multi-level governance —enabling urban adaptation 120 Urban adaptation to climate change in Europe Since funding instruments in the EU do not exclude the possibility of using them for funding adaptation measures, the accessibility and mobilisation of those funds, rather than their actual size, is a crucial factor for promoting adaptation. Even if convincingly designed, funding for climate change adaptation can fail if corresponding implementing structures are not in place or the respective political conditions and the opportunities presented are not taken into account. Indeed, the problem faced by cities and regions is that they may never gain access to EU funding instruments due to 'bottlenecks' at the national level, such as problems with operating procedures within the structural funds, information gaps and technical competence, lack of guidance and good practice examples (Baltzar et al., 2009) (Box 4.11). Baltzar et al. (2009) point to important gaps in the funding chain from EU to local level. Although the gaps relate mainly to climate change mitigation targets, they can also be highly relevant for adaptation goals (Table 4.8). He argues that the two principal ways in which operational programmes can improve the integration of climate change considerations into project development and preparation are through project application documents and assistance and guidance to project applicants (Box 4.11). Box 4.11 Access limitations to European funds — a Romanian local authority perspective Many Romanian local authorities fail to absorb EU funding because they are inappropriately informed, have poorly trained staff, are run on small budgets or are unable to partner with other institutions or associations. The Soros Foundation Romania (SFR) commissioned a study on local authorities' access to European funding in 2008. Four of Romania's eight development regions were surveyed (north-east, south-east, west and south-west) which accounted for 1 579 town halls. This was complemented by 16 in-depth case studies. The purpose was to reveal the factors which preclude certain towns or areas from tapping into development funding (particularly into the EU's post‑accession funding). The specific problems that local actors report they face in implementing EU‑funded projects were also investigated. The conclusions contrast the positive official reporting by the authorities currently coordinating the distribution of EU funding. According to the study, and for the period between 2005 and 2008, out of the total number of administrative units surveyed, one quarter did not submit even one project requesting governmental or European Union financing. Meanwhile an additional quarter submitted only one single project. For those who did apply, the average rate was 2.5 projects per town hall submitted with a 50 % success rate. The authorities best equipped were most successful in raising EU project funding potentially leading to widening gaps in capacity, skills and well-being. Source: Soros Foundation Romania: Local Authorities Access to European Funds. http://www.soros.ro/en/program_articol. php?articol=150. The 'Financing the Resilient City' report (ICLEI, 2011) suggests local strategies for capacity building to enable the financing and implementation of resilient urban development projects. The key challenge is to match local demand for resilience with the right financial options (see also Section 3.3.7). The ICLEI report highlights the fact that there are challenges to the supply of finance. Such a financial market for resilience needs to respond to varying circumstances across localities and institutional settings. When financial instruments are flexible, funded projects can be locally responsive. This is in marked contrast to a setting where markets require standardised investment propositions along with predictability about the preparation and subsequent performance of the propositions. To foster such innovative financial products enabling resilience measures, the ICLEI report proposes that international adaptation funds, or similar national level funds or programmes, need to focus on three areas: • funding for local, national, and international initiatives to mainstream new resilience standards into conventional urban development projects;
  • 123.
    Multi-level governance —enabling urban adaptation Urban adaptation to climate change in Europe 121 Budget cycle phase Gaps identified Possible responses in a multi-level framework Call for proposals (announcement) Insufficient knowledge among project applicants about the opportunities offered by projects related to climate change. Limited experience of the possible types of activities and outputs. Organising thematic calls for proposals and by providing technical assistance to project applicants by EU and national governments. Climate related questions in the application documents. Improved guidance documents to raise quality and climate awareness for the applications. Technical assistance (designated personnel) to provide support for applicants. Consultation with environmental authorities or broader dialogue within environmental networks. Project appraisal process Climate change related impacts not clearly identified. Lack of expertise of project evaluators in environmental assessments. Use of innovative mechanisms such as environmental (EIA) panels to bring expertise and knowledge into the assessment. Use checklists and guides for the impact assessments. Project monitoring and evaluation Difficulties in monitoring projects and programmes, relevant for all Member States and the EC. Lack of monitoring systems and impacts inventories. Strengthen evaluation systems in EU funding programmes that focus on climate trends, impacts, challenges and opportunities. Evaluate prior, during and after EU funded programmes are carried out. Perform a rigorous evaluation of the 2007–2013 period to identify investment needs for mitigation and adaptation from EU funds in European regions. Use evaluations as a basis for post 2013 programming. Table 4.8 General gaps in programming and funding cycles with related responses Source: Based on Baltzar et al., 2009. • special funding for local projects in highly vulnerable urban areas and systems; • financial product innovation (e.g. 'value capture mechanisms' from development) for the purpose of creating private investment flows into the upgrading of infrastructure resilience (ICLEI, 2011). In addition, adaptation measures can be led by private actors. Funding options need to include private investments of various kinds. The role of the private insurance industry will continue to remain critically focused. Their ability to assess and to communicate risk, to spread the economic impact through a variety of insurance products, to encourage behaviour change through price‑based devices and their ability to survive high cost years by accessing global financial markets will be important support mechanisms for adaptation (McEvoy, 2009). However, adaptation-related market mechanisms remain clearly underdeveloped (Corfee-Morlot et al., 2009). This implies that governance arrangements in adaptation cannot rely on market actors as heavily as in the field of mitigation and, consequently, public actors have a decisive role to play in the field. The economics of climate change adaptation are of key importance for any given case — whether operating with public or private funds or a top‑down/bottom-up approach. The fact that the economy — and especially an economy in crisis — and employment nearly always take priority over climate change on the political agenda highlights the need to focus on the economics of adaptation. It also underlines the importance of adaptation measures with multiple benefits and potential funding sources. Making this case is relevant for all levels of governance from the local to the European including international climate negotiations. With respect to EU cohesion policy funding, there is a need to explicitly include climate change measures in the national programming documents (the NSRFs) and to demonstrate the potential of those measures for economic growth and job creation. Displaying such synergies helps to integrate climate change into cohesion policy (Baltzar et al., 2009). Similarly, the synergies between climate change adaptation and cohesion policy could be improved if adaptation were more visibly included in the European green economy discourse which predominantly emphasises mitigation through resource and energy efficiency. Within this context it is important to highlight examples such the Dutch 'delta programme' which aimed to build long-term safety against flooding. Nations such as Vietnam and Bangladesh have shown an interest in the procedure with assistance from Dutch consultancy firms (Knowledge for Climate, 2012a).
  • 124.
    Multi-level governance —enabling urban adaptation 122 Urban adaptation to climate change in Europe 4.3.5 Multi-level knowledge base The preceding chapter highlighted the fact that knowledge is crucial in developing adaptation strategies and measures. This is also applicable regarding local climate change impacts, adaptive capacities as well as the governance of adaptation at and between the different levels and stakeholders. Demeritt and Langdon (2004) found in their study that over three quarters of responding local authority officers in the United Kingdom felt that they did not have access to the best information about the impacts of climate change on their regions. It seems that despite the free availability of governmental information sources these were not used regularly. Also, during the Resilient Cities conference in Bonn in 2011, participants confirmed that while knowledge regarding climate change and adaptation was available, problems to do with access and understanding were prevalent (Georgi et al., 2012). In essence, locally specific information on climate change impacts is acutely needed in many localities, but this availability is no guarantee that it will be adopted and used in practical adaptation efforts (Demeritt and Langdon, 2004). Only an active dialogue with authorities at different levels as well as scientific institutions can help to overcome this barrier. Georgi et al. (2012) suggests various proposals. • A strong collaboration between key stakeholders — policymakers, knowledge providers, business owners, citizens and communities. In particular, active collaboration between decision‑makers and knowledge providers ensures that the scientific community can respond to the information needs of cities. • Developing a shared language on climate change adaptation thus overcoming the specialised vocabularies and the interpretation of terms used by the different stakeholder groups through on-going conversations and debates with stakeholders from various backgrounds. • Continuous social and institutional learning in collaborative adaptation processes. Centralised information portals can substantially support this process of knowledge sharing and learning. Through direct contact with scientists, municipalities can access climate and adaptation science. Stuttgart in Germany is one such example where the municipality has established a special Section called 'Urban Climatology' within the Office for Environmental Protection (Box 3.10). Local and regional governments can engage with their educational institutes and universities and establish regional climate change partnerships (see also Box 3.12). National and European governments and knowledge institutions have an important role to play in supporting local knowledge use. They can provide funding for basic adaptation research, including climate modelling (e.g. NOAA, UK Hadley Centre), but also support regionally tailored research, such as INTERREG projects. The Dutch 'Knowledge for Climate' program (Knowledge for Climate, 2012b), for example, supports eight regional consortia ('hotspots') to develop regional and local adaptation strategies. The EU will continue to support climate change related research under its framework programmes (Box 4.12). Chapter 2 demonstrated that there is a strong link between climate change vulnerabilities and vulnerabilities arising from socio-economic trends. There is a clear need for research linking climate change with societal and spatial patterns and future scenarios, besides the on-going work to reduce uncertainties via downscaling climate scenarios. There is also a need to understand adaptation as well as governance processes themselves, including the need to establish procedures for eliciting data on adaptive measures in Europe's cities and regions. Science and policy interface organisations, also called boundary organisations, can make information on climate and adaptation available. Boundary organisations are institutions that specialise in facilitating the transfer of useful knowledge between science and policy (Guston et al., 2000). Examples are environmental agencies and consultancies which translate scientific results into policy relevant guidance and which communicate policy needs and shape research agendas (Box 4.13; see also Box 3.12). An important action at EU level is the European Climate Adaptation Platform CLIMATE-ADAPT.
  • 125.
    Multi-level governance —enabling urban adaptation Urban adaptation to climate change in Europe 123 Box 4.12 Adaptation Strategies for European cities — building local capacities across countries The European Commission's Directorate General for Climate Action (DG CLIMA) recently launched a project to support the development of urban adaptation strategies and to enable cities to actively participate in developing and implementing a European adaptation strategy for 2013. A core task of the project is to develop capacity for, and with, local authorities. The project shall evaluate best practice across Europe, provide guidance and tools for adaptation strategies and design and organise training. The latter shall use web based tools, workshops and coaching. Source: http://eucities-adapt.eu. Box 4.13 The UKCIP as key boundary organisation in adaptive governance UKCIP operates as a public-private partnership, and mediates between climate scientists, technology experts, policymakers and stakeholders. The UKCIP has been operating since 1997 to support decision-makers' assessments of their vulnerability to climate change so that they can plan how to adapt. The programme was developed incrementally, taking advantage of collaborative funding and facilitating long-standing partnerships. Whilst the core framework of scenarios and tools has been developed centrally, most studies have been stakeholder-funded and led. Stakeholders usually are positioned in a consultative role in research. In contrast, the UKCIP aims to bridge the gap between research and policy in a way that decision-makers can take control. The programme's results suggest that if decision-makers are supported, capacity is built for assessments, and research outputs are directly applicable to their on-going work and strategic planning. This capacity-building has worked across scales and sectors and is an effective route to mainstreaming climate change adaptation. The implication, therefore, is that more support should be given by funding agencies to develop institutional capacity to support adaptation to climate change in both the private and public sectors (McKenzie Hedger et al., 2006). Internationally, the UKCIP constituted an important inspiration for other countries (Keskitalo, 2010c) in the way it has provided concrete information on scenarios, impacts and risk assessment for both local and regional level. Source: http://www.ukcip.org.uk. Building on various national and sub-national initiatives its main functions are: • enhancing information structuring and sharing and acting as a facilitator for collecting and disseminating scientific information, data and case studies about climate change impacts and vulnerability, to build a consistent and updated knowledge base; • assisting an effective uptake of this knowledge by international, EU, national, regional, local or sectoral decision makers, by offering guidance, tools, best practices for assessments of vulnerability to climate change at different geographical levels and of adaptation plans and measures; • contributing to a greater level of coordination among the relevant sectoral policies, and among different institutional levels. The development of national, regional, local adaptation strategies and now finally one focused on the EU will demonstrate the usefulness of this tool.
  • 126.
    Multi-level governance —enabling urban adaptation 124 Urban adaptation to climate change in Europe CLIMATE-ADAPT and other similar intermediaries between knowledge and action are needed since science can only play a limited role in social learning. Intermediaries, formal networks and other 'translators' have a crucial role in learning processes where not only individuals but the institutional system itself must learn to adapt. Learning proceeds through expanding 'loops' — from evaluating a fixed norm and taking corrective actions (single loop) to evaluating and changing the norms (double loop) or completely reframing them (triple loop) (Georges et al. 1999). It becomes evident that multi‑level governance can help in a European effort to shift from the all-too-typical norm-following corrections (see Pahl-Wostl, 2009) towards higher orders of learning and innovative ways of changing and re-framing relevant norms. Figure 4.5 Homepage of the European Climate Adaptation Platform CLIMATE‑ADAPT Source: http://climate-adapt.eea.europa.eu. Further reading • Keskitalo, E. C. H., 2010, Developing adaptation policy and practice in Europe: multi-level governance of climate change, Springer, Dordrecht; New York. • Baltzar, E., Varbova, V. and Zhechkov, R., 2009, Improving the Climate Resilience of Cohesion Policy Funding Programmes: An overview of member states' measures and tools for climate proofing Cohesion Policy funds, European Network of Enrivonmental Authorities (ENEA) Regional Environment Centre (REC), Szentendre (http://ec.europa.eu/environment/integration/pdf/enea/climate_resiliance_cfr_pr.pdf). • CoR, 2011a, Adaptation to Climate Change: Policy instruments for adaptation to climate change in big European cities and metropolitan areas, European Union, Committee of the Regions, Brussels (http://80.92.67.120/en/documentation/studies/Documents/Adaptation%20to%20Climate%20Change/ EN.pdf). • Medarova-Bergstrom, K., Volkery, A., Schiellerup, P., Withana, S. and Baldock, D., 2011, Strategies and Instruments for Climate Proofing the EU Budget, IEEP, Brussels (http://www.ieep.eu/assets/782/Climate_ proofing_EU_budget.pdf). • ICLEI, 2011, Financing the Resilient City: A demand driven approach to development, disaster risk reduction and climate adaptation — An ICLEI White Paper, ICLEI Global Report, ICLEI, Bonn (http://iclei.org/fileadmin/ user_upload/documents/Global/Publications/Report-Financing_Resilient_City-Final.pdf).
  • 127.
    125 Glossary Urbanadaptation to climate change in Europe Glossary Adaptation to climate change —Adjustment in natural or human systems (e.g. urban areas) in response to actual or expected climatic stimuli or their effects. It moderates harm or exploits beneficial opportunities of climate change. Various types of adaptation can be distinguished, including anticipatory, autonomous and planned adaptation. Adaptive capacity (in relation to climate change impacts) — The ability of a system to adjust to climate change (including climate variability and extremes) to moderate potential damages, to take advantage of opportunities, or to cope with the consequences. Apparent temperature — is a measure of relative discomfort due to combined heat and high humidity. It is used as an index to describe thermal comfort. Climate — Climate in a narrow sense is usually defined as the 'average weather', or more rigorously, as the statistical description in terms of the mean and variability of relevant quantities over a period of time ranging from months to thousands or millions of years. These quantities are most often surface variables such as temperature, precipitation, and wind. Climate in a wider sense is the state, including a statistical description, of the climate system. The classical period of time is 30 years, as defined by the World Meteorological Organization (WMO). Climate change — Climate change refers to any change in climate over time, whether due to natural variability or as a result of human activity. This usage differs from that in the United Nations Framework Convention on Climate Change (UNFCCC), which defines climate change as: 'a change of climate which is attributed directly or indirectly to human activity that alters the composition of the global atmosphere and which is in addition to natural climate variability observed over comparable time periods'. Climate (change) scenario — A plausible and often simplified representation of the future climate, based on an internally consistent set of climatological relationships and assumptions of radiative forcing, typically constructed for explicit use as input to climate change impact models. A 'climate change scenario' is the difference between a climate scenario and the current climate. Climate variability — Climate variability refers to variations in the mean state and other statistics (such as standard deviations, the occurrence of extremes, etc.) of the climate on all spatial and temporal scales beyond that of individual weather events. Variability may be due to natural internal processes within the climate system (internal variability), or to variations in natural or anthropogenic external forcing (external variability). Erosion — The process of removal and transport of soil and rock by weathering, mass wasting and the action of streams, glaciers, waves, winds and underground water. Extreme weather event — An extreme weather event is an event that is rare at a particular place and time of year. Definitions of rare vary, but an extreme weather event would normally be as rare as or rarer than the 10th or 90th percentile of the observed probability density function. By definition, the characteristics of what is called extreme weather may vary from place to place in an absolute sense. Single extreme events cannot be simply and directly attributed to anthropogenic climate change, as there is always a finite chance the event in question might have occurred naturally. When a pattern of extreme weather persists for some time, such as a season, it may be classed as an extreme climate event, especially if it yields an average or total that is itself extreme (e.g. drought or heavy rainfall over a season). Forecast — Projected outcome from established physical, technological, economic, social, behavioural, etc. patterns. Global warming — Global warming refers to the gradual increase, observed or projected, in global surface temperature, as one of the consequences of radiative forcing caused by anthropogenic emissions.
  • 128.
    Glossary 126 Urbanadaptation to climate change in Europe Governance — Modern governance is not based on centralised 'command and control' but is dispersed across multiple centres of authority (Hooghe and Marks, 2003). There are many self‑organising, inter‑organisational networks which complement markets and government hierarchies as governing structures for allocating resources and exercising control and coordination (Rhodes, 1996). Two dimensions of governance exist — vertical and horizontal coordination — which work in combination. Green and blue areas refer in this report to the Urban Atlas classes. These are green urban areas, sports and leisure facilities, agricultural areas, semi‑natural areas and wetlands, forests, discontinuous low density urban fabric as a proxy for private gardens and water bodies. Green infrastructure –is seen in this report as an interconnected network of natural and green man-made features, such as forests, extensive grasslands, wetlands, but in urban areas also parks, gardens, cemeteries, trees at streets, green walls and roofs. Such green infrastructure enables ecosystem services, like flood protection, regulating temperature, filtering of air, recreation areas among others. Grey infrastructure — construction measures such as buildings, technical and transport infrastructure, dikes and other technical protection constructions using engineering services. Mal-adaptation is an adaptation action or process that actually increases vulnerability to climate. Mitigation (climate change) — An anthropogenic intervention to reduce the anthropogenic forcing of the climate system. It includes strategies to reduce greenhouse gas sources and emissions and enhancing greenhouse gas sinks. Multi-level governance — In this report the term is understood as non-hierarchical forms of policymaking, involving public authorities as well as private actors, who operate at different territorial levels, and who acknowledge their interdependence. Projection — The potential evolution of a quality or set of quantities, often computed with the aid of a model. Projections are distinguished from predictions in order to emphasise that projections involve assumptions, concerning, for example, future socio-economic and technological developments, that may or may not be realised, and are therefore subject to substantial uncertainty. Resilience — The ability of a social or ecological system to absorb disturbances while retaining the same basic structure and ways of functioning, the capacity for self-organisation and the capacity to adapt to stress and change. River discharge — Water flow within a river channel, for example expressed in m3/s. Run-off — That part of precipitation, snow melt or irrigation water that appears in uncontrolled surface streams, rivers, drains or sewers. Soft measures — non-physical measures such as policies, plans, programmes, procedures Soil sealing — is the covering of the soil surface with materials such as concrete and stone as a result of new buildings, roads, parking places but also other public and private space. Depending on its degree, soil sealing reduces or most likely completely prevents natural soil functions and ecosystem services within the area concerned. SRES scenarios — refers to the scenarios described in the IPCC Special Report on Emissions Scenarios (2000). The scenarios are grouped into four families (A1, A2, B1 and B2) that explore alternative development pathways. A1: A world of very rapid economic growth, a global population that peaks in mid-century and rapid introduction of new and more efficient technologies. A2: A very heterogeneous world with high population growth, slow economic development and slow technological change. B1: A convergent world, with the same global population as A1, but with more rapid changes in economic structures toward a service and information economy. B2: A world with intermediate population and economic growth, emphasising local solutions to economic, social, and environmental sustainability. Uncertainty — An expression of the degree to which a value (e.g. the future state of the climate system) is unknown. Uncertainty can result from lack of information or from disagreement about what is known or even knowable. It may have many types of sources, from quantifiable errors in the data to ambiguously defined concepts or terminology, or uncertain projections of human
  • 129.
    Glossary Urban adaptationto climate change in Europe 127 behaviour. Uncertainty can therefore be represented by quantitative measures, for example, a range of values calculated by various models, or by qualitative statements, for example, reflecting the judgement of a team of experts. Urban — In this report, 'urban' is used as a collective term to fit with the different country specific definitions of cities and towns. Urban Heat Island (UHI) effect — It describes the increased temperature of the urban air compared to its rural surroundings. The temperature difference can be up to 10 °C or more (Oke, 1982). The difference is particularly stark at night. Urban Morphological Zone (UMZ) — is defined as built-up areas lying less than 200 m apart. They are primarily made up of four Corine Land Cover classes and include continuous urban fabric, discontinuous urban fabric, industrial or commercial units, green urban areas, port areas, airports and sport and leisure facilities. Vulnerability — A variety of definitions exist according to the specific context. The United Nations International Strategy for Disaster Reduction (UNISDR, 2009), for example, defines vulnerability as the characteristics and circumstances of a community, system or asset that make it susceptible to the damaging effects of a hazard. The Intergovernmental Panel on Climate Change defines vulnerability to climate change as the degree to which a system is susceptible to, and unable to cope with, adverse effects of climate change, including climate variability and extremes. Vulnerability is a function of the character, magnitude, and rate of climate change and variation to which a system is exposed, its sensitivity, and its adaptive capacity (IPCC, 2007). While being aware of the different definitions and concepts of vulnerability, we do not use a specific definition or concept stringently in this report but rather use the term in a more generic way.
  • 130.
    128 References Urbanadaptation to climate change in Europe References Adaptation Sub-Committee, 2011, Analysis of how land use planning decisions affect vulnerability to climate risks, UK Committee on Climate Change (CCC), London. Adger, W. N., 2001, Social capital and climate change, Tyndall Centre Working Paper No 8, Tyndall Centre for Climate Change Research and CSERGE, Norwich. Adger, W. N., Arnell, N. W. and Tompkins, E. L., 2005, 'Successful adaptation to climate change across scales', Global Environmental Change, 15(2) 77–86. Adger, W. N., Dessai, S., Goulden, M., Hulme, M., Lorenzoni, I., Nelson, D. R., Naess, L. O., Wolf, J. and Wreford, A., 2008, 'Are there social limits to adaptation to climate change?', Climatic Change, 93(3‑4) 335–354. Agrawala, S., Matus Kramer, A., Prudent-Richard, G. and Sainsbury, M., 2010, Incorporating climate change impacts and adaptation in environmental impact assessments. Opportunities and challenges OECD Environmental Working Paper No 24, OECD Publishing, Paris. Altvater, S., van de Sandt, K., Marinova, N., de Block, D., Klostermann, J., McCallum, S., Dworak, T. and Osberghaus, D., 2011, Recommendations on priority measures for EU policy mainstreaming on adaptation — Task 3 report, Ecologic, Berlin. Altvater, S., van de Sandt, K., Marinova, N., de Block, D., Klostermann, J., Swart, R., Bouwma, I., McCallum, S., Dworak, T. and Osberghaus, D., 2011a, Assessment of the most significant threats to the EU posed by the changing climate in the short, medium and long term — Task 1 report, Ecologic, Berlin. Altvater, S., van de Sandt, K., Marinova, N., de Block, D., Klostermann, J., Swart, R., Bouwma, I., McCallum, S., Dworak, T. and Osberghaus, D., 2011b, Recommendations on priority measures for EU policy mainstreaming on adaptation — Task 2 report, Ecologic, Berlin. AMICA, 2012, Adaptation and mitigation — an integrated climate policy approach (http://www.amica-climate. net/) accessed 29 March 2012. Arnfield, A. J., 2003, 'Two decades of urban climate research: a review of turbulence, exchanges of energy and water and the urban heat island', International Journal of Climatology, (23) 1–26. Baccini, M., Biggeri, A., Accetta, G., Kosatsky, Tom, Katsouyanni, Klea, Analitis, A., Anderson, H Ross, Bisanti, L., D'Ippoliti, D., Danova, J., Forsberg, B., Medina, S., Paldy, A., Rabczenko, D., Schindler, C. and Michelozzi, P., 2008, 'Heat effects on mortality in 15 European cities', Epidemiology, (19) 711–719. Baltzar, E., Varbova, V. and Zhechkov, R., 2009, Improving the climate resilience of cohesion policy funding programmes: An overview of member states' measures and tools for climate proofing cohesion policy funds, European Network of Environmental Authorities (ENEA) and Regional Environment Centre (REC), Szentendre. Barredo, J. I., 2006, 'Major flood disasters in Europe: 1950–2005', Natural Hazards, 42(1) 125–148. Barredo, J. I., 2009, 'Normalised flood losses in Europe: 1970–2006', Natural Hazards and Earth System Science 2009-02-09, 9(1) 97–104. Barriopedro, D., Fischer, E. M., Luterbacher, J., Trigo, R. M. and Garcia-Herrera, R., 2011, 'The hot summer of 2010: Redrawing the temperature record map of Europe', Science, 332(6026) 220–224. Baumüller, J. and Verband Region Stuttgart, 2008, Klimaatlas Region Stuttgart, Verband Region Stuttgart, Stuttgart. Bell, M. L., Dominici, F. and Samet, J. M., 2005, 'A meta-analysis of time-series studies of ozone and mortality with comparison to the national morbidity, mortality, and air pollution study', Epidemiology, (16) 436–445.
  • 131.
    References Urban adaptationto climate change in Europe 129 Berkhout, F., 2005, 'Rationales for adaptation in EU climate change policies', Climate Policy, (5) 377–391. Birkmann, J. and Fleischhauer, M., 2009, 'Anpassungsstrategien der Raumentwicklung an den Klimawandel: „Climate Proofing' — Konturen eines neuen Instruments', Raumforschung and Raumordnung, 67(2) 114–127. Bolund, P. and Hunhammar, S., 1999, Ecosystem services in urban areas, Ecological Economics, 29(2) 293–301. Booher, D. E. and Innes, J. E., 2002, 'Network power in collaborative planning', Journal of Planning Education and Research, 21(3) 221–236. Brücker, G., 2005, 'Vulnerable populations: lessons learnt from the summer 2003 heat waves in Europe', Euro Surveillance, 10(147). Bulkeley, H, Schroeder, H., Janda, K., Zhao, J., Armstrong, A., Yi Chu, S. and Ghosh, S., 2009, Cities and Climate Change: The role of institutions, governance and urban planning. Report prepared for the World Bank Urban Symposium on Climate Change, Durham, Oxford. Caballero, D., 2008,'Wildland-urban interface fire risk management: WARM project.', in: Proceedings of the second international symposium on fire economics, planning, and policy: A global view, General Technical Report PSW-GTR-208, U.S. Department of Agriculture, Forest Service — Pacific Southwest Research Station, Albany. CAG, 2009, Adapting to climate change: Local areas' action, CAG consultants, London. CAP, 2007, Cities preparing for climate change: A study of six urban regions: May 2007, The Clean Air Partnership, Toronto. Casimiro, E., Gomes, A. and Almeida, S., 2010,'Saúde', in: Santos, F. D. and Cruz, M. D. (eds.) Plano estratégico de Cascais face às alterações climáticas, Câmara Municipal de Cascais, Portugal. CBT, 2009, Factsheet planning for climate change, Columbia Basin Trust (http://www.cbt.org/uploads/ pdf/FactSheetPlanningforClimateChangeFINALweb. pdf) accessed 29 March 2012. Ceylan, A., 2009, Drought management plan for Ankara, Turkey, WMO's Newsletter: MeteoWorld, (June 2009). Chouli, E., Aftias, E. and Deutsch, J.-C., 2007, 'Applying storm water management in Greek cities: learning from the European experience', Desalination, 210(1–3) 61–68. Christensen, J.H., Solomon, S., Manning, M. and Miller, H. L., 2007, 'Regional Climate Projections', in: Climate Change 2007.The physical science basis. Contribution of working group I to the fourth assessment report of the Intergovernmental Panel on Climate Change, Cambridge University Press, Cambridge. Christensen, J. Hesselbjerg and Christensen, O. B., 2007, 'A summary of the PRUDENCE model projections of changes in European climate by the end of this century', Climatic Change 2007-3-17, 81(S1) 7–30. Ciscar, J.C., et al., 2009, Climate change impacts in Europe. Final report of the PESETA research project, JRC/IPTS, Sevilla. Ciscar, J. C., Iglesias, A., Feyen, L., Szabo, L., Van Regemorter, D., Amelung, B., Nicholls, R., Watkiss, P., Christensen, O. B., Dankers, R., Garrote, L., Goodess, C. M., Hunt, A., Moreno, A., Richards, J. and Soria, A., 2011, 'Physical and economic consequences of climate change in Europe', Proceedings of the National Academy of Sciences, 108(7) 2 678–2 683. CoR, 2011a, Adaptation to Climate Change: Policy instruments for adaptation to climate change in big European cities and metropolitan areas, European Union. Committee of the Regions, Brussels. CoR, 2011b, Second CoR Monitoring Report on Europe 2020, European Union. Committee of the Regions, Brussels. Corfee-Morlot, J., Cochran, I., Hallegatte, S. and Teasdale, P.-J., 2010, 'Multilevel risk governance and urban adaptation policy', Climatic Change, 104 169–197. Corfee-Morlot, J., Kamal-Chaoui, L, Donovan, M., Cochran, I, Robert, A. and Teasdale, P. J., 2009, Cities, climate change and multilevel governance, OECD Environmental Working Papers N° 14, OECD Publishing, Paris.
  • 132.
    References 130 Urbanadaptation to climate change in Europe D'Ippoliti, D., Michelozzi, P., Marino, C., de' Donato, F., Menne, B., Katsouyanni, Klea, Kirchmayer, U., Analitis, A., Medina-Ramón, M., Paldy, A., Atkinson, R., Kovats, S., Bisanti, L., Schneider, A., Lefranc, Agnès, Iñiguez, C. and Perucci, C. A., 2010, The impact of heat waves on mortality in 9 European cities: results from the EuroHEAT project, Environmental Health: A Global Access Science Source, (9) 37. Dalman, E., Western Harbour — sustainable urban development in Malmö, (www.udss.org.uk/editpics/ File/Malmo-Eva_Dalman_comprssed.ppt) accessed 29 March 2012. Dankers, R. and Feyen, L., 2008, 'Climate change impact on flood hazard in Europe: An assessment based on high-resolution climate simulations', Journal of Geophysical Research, 113(D19), D19105. Demeritt, D. and Langdon, D., 2004, 'The UK Climate Change Programme and communication with local authorities', Global Environmental Change, (14) 325–336. Dessai, S., 2003, Heat stress and mortality in Lisbon Part II. 'An assessment of the potential impacts of climate change, International Journal of Biometeorology', 48(1) 37–44. Dessai, S., Hulme, M., Lempert, R. and Pielke, R., 2009,'Climate prediction: a limit to adaptation?', in: Adger, W. N. Lorenzoni, I. and O'Brien, K. L. (eds.) Adapting to Climate Change: Thresholds, Values, Governance, Cambridge University Press, Cambridge. Donat, M. G., Leckebusch, G. C., Wild, S. and Ulbrich, U., 2011, 'Future changes in European winter storm losses and extreme wind speeds inferred from GCM and RCM multi-model simulations', Nat. Hazards Earth Syst. Sci., 11(5) 1 351–1 370. Dousset, B., Gourmelon, F., Laaidi, K., Zeghnoun, A., Giraudet, E., Bretin, P., Mauri, E. and Vandentorren, S., 2011, 'Satellite monitoring of summer heat waves in the Paris metropolitan area', International Journal of Climatology, 31(2) 313–323. Ebi, K., Teisberg, T. J., Kalkstein, L. S., Robinson, L. and Weiher, R. F., 2004, 'Heat watch/warning systems save lives', Bulletin American Meteorological Society, 2004 (85) 1 067–1 073. EC, 1992, Council Directive 92/43/EEC of 21 May 1992 on the conservation of natural habitats and of wild fauna and flora. EC, 2000a, Regulation (EC) No 1980/2000 of the European Parliament and of the Council of 17 July 2000 on a revised Community eco-label award scheme. EC, 2000b, Directive 2000/60/EC of the European Parliament and of the Council of 23 October 2000 establishing a framework for Community action in the field of water policy. EC, 2001, Directive 2001/42/EC of the European Parliament and of the Council of 27 June 2001 on the assessment of the effects of certain plans and programmes on the environment. EC, 2004, Communication from the Commission to the European Parliament, the Council, the European Economic and Social Committee and the Committee of the Regions on flood risk management — flood prevention, protection and mitigation (COM(2004) 472 final of 12 July 2004). EC, 2007a, Directive 2007/60/EC of the European Parliament and of the Council of 23 October 2007 on the assessment and management of flood risks. EC, 2007b, Water scarcity and droughts — In-depth assessment — Second interim report. EC, 2007c, Communication from the Commission to the European Parliament and the Council 'Addressing the challenge of water scarcity and droughts in the European Union' COM(2007) 414 final, 18 July 2007. EC, 2008, Green Paper on Territorial Cohesion — Turning territorial diversity into strength COM(2008) 616 final, 6 October 2008. EC, 2009a, Promoting sustainable urban development in Europe: achievements and opportunities, European Commission, Brussels. EC, 2009b, White Paper — Adapting to climate change: Towards a European framework for action COM(2009) 147/4, 1 April 2009.
  • 133.
    References Urban adaptationto climate change in Europe 131 EC, 2009c, Communication from the Commission to the European Parliament, the Council, the European Economic and Social Committee and the Committee of the Regions concerning the European Union Strategy for the Baltic Sea Region COM(2009) 248 final, 10 June 2009. EC, 2009d, Common implementation strategy for the Water Framework Directive (2000/60/EC) — River basin management in a changing climate. Guidance document No. 24, Technical Report No 2009-040, European Commission. EC, 2010a, Communication from the Commission to the European Parliament, the Council, the European Economic and Social Committee and the Committee of the Regions — European Union Strategy for Danube Region COM(2010) 715 final, 8 December 2010. EC, 2010b, Directive 2010/31/EU of the European Parliament and of the Council of 19 May 2010 on the energy performance of buildings. EC, 2010c, The European Union strategy for the Baltic Sea Region: background and analysis (http://ec.europa. eu/regional_policy/cooperate/baltic/pdf/2010_baltic. pdf) accessed 29 March 2012. EC, 2011a, Directive 2011/92/EU of the European Parliament and of the Council of 13 December 2011 on the assessment of the effects of certain public and private projects on the environment (codification). EC, 2011b, A budget for Europe 2020. Part I and II. Communication from the Commission to the European Parliament, the Council, the European Economic and Social Committee of the Regions COM(2011) 500 final, 29 June 2011. EC, 2011c, EUROPA — Press Releases — Multiannual Financial Framework (MFF): Questions and answers (http://europa.eu/rapid/pressReleasesAction.do?re ference=MEMO/11/468format=HTMLaged=1l anguage=ENguiLanguage=en) accessed 29 March 2012. EC, 2011d, Proposal for a regulation of the European Parliament and of the Council on specific provision concerning the European Regional Development Fund and the investment for growth and jobs goal and repealing regulation (EC) No 1080/2006. EC, 2011e, Proposal for a regulation of the European parliament and of the Council of 6 October 2011 laying down common provisions on the European Regional Development Fund, the European Social Fund, the Cohesion Fund, the European Agricultural Fund for Rural Development and the European Maritime and Fisheries Fund covered by the Common Strategic Framework and laying down general provisions on the European Regional Development Fund, the European Social Fund and the Cohesion Fund and repealing Regulation (EC) No 1 083/2006. EC, 2011f, Report from the Commission to the European parliament, the Council, the European Economic and Social Committee and the Committee of the Regions on the implementation of the EU Strategy for the Baltic Sea Region (EUSBSR). EC, 2012a, Green infrastructure (http://ec.europa. eu/environment/nature/ecosystems/index_en.htm) accessed 29 March 2012. EC, 2012b, Water Scarcity Droughts in the European Union (http://ec.europa.eu/environment/water/ quantity/water_efficiency.htm) accessed 29 March 2012. ECOTEC, 2008, The economic benefits of Green Infrastructure: Developing key tests for evaluating the benefits of green infrastructure, Natural Economy Northwest (http://www.naturaleconomynorthwest. co.uk/download.php?The %20Economic %20 Value %20of %20Green %20Infrastructure.pdf) accessed 29 March 2012. EEA, 2006, Urban sprawl in Europe: the ignored challenge, EEA Report No 10/2006, European Environment Agency. EEA, 2007, Climate change: the cost of inaction and the cost of adaptation, EEA Technical report No 13/2007, European Environment Agency. EEA, 2009, Water resources across Europe: confronting water scarcity and drought, EEA Report No 2/2009, European Environment Agency. EEA, 2010a, The European environment — state and outlook 2010: Thematic assessment — Adapting to climate change, European Environment Agency. EEA, 2010b, The European environment — state and outlook 2010: Thematic assessment — Urban Environment, European Environment Agency.
  • 134.
    References 132 Urbanadaptation to climate change in Europe EEA, 2010c, Mapping the impacts of natural hazards and technological accidents in Europe — An overview of the last decade, EEA Technical report No 13/2010, European Environment Agency. EEA, 2010d, The European environment — state and outlook 2010: Thematic assessment — Air pollution, European Environment Agency. EEA, 2010e, The European environment — state and outlook 2010: Thematic assessment — Water scarcity and droughts, floods and hydromorphology, European Environment Agency. EEA, 2011a, Air pollution by ozone across Europe during summer 2010, EEA Technical report No 6/2011, European Environment Agency. EEA, 2011b, Air quality in Europe — 2011 report, EEA Technical report No 12/2011, European Environment Agency. EEA and EC, 2012, Climate-adapt (http://climate-adapt. eea.europa.eu/) accessed 29 March 2012. EEA, JRC and WHO, 2008, Impacts of Europe's changing climate: 2008 indicator-based assessment, EEA Report No 4/2008, European Environment Agency. Ellison, D., 2010,'Addressing adaptation in the EU policy Framework', in: Developing adaptation policy and practice in Europe: Multi-Level governance of climate change, Springer, Dordrecht. Van Engelen, A., Klein Tank, A., Van Der Schrier, G. and Klok, L., 2008, European Climate Assessment Dataset (ECAD), Report 2008 'Towards an operational system for assessing observed changes in climate extremes', KNMI, De Bilt, Netherlands. Engle, N. L. and Lemos, M. C., 2010, 'Unpacking governance: Building adaptive capacity to climate change of river basins in Brazil', Global Environmental Change, 20(1) 4–13. Ennos, R., 2011, Quantifying the cooling and anti-flooding benefits of green infrastructure, presentation at Green infrastructure workshop, 1 November 2011 at the University of Manchester, United Kingdom. Eurostat, 2008, 'Population projections 2008–2060 — from 2015, deaths projected to outnumber births in the EU-27', Eurostat, Luxembourg. Eurostat, 2012, Urban Audit (http://epp.eurostat. ec.europa.eu/portal/page/portal/region_cities/city_ urban) accessed 29 March 2012. Faludi, A., 2009, 'A turning point in the development of European spatial planning? The Territorial Agenda of the European Union and the First Action Programme', Progress in Planning (71) 1–42. Filleul, L., Cassadou, S., Médina, S., Fabres, P., Lefranc, Agnés, Eilstein, D., Le Tertre, A., Pascal, L., Chardon, B., Blanchard, M., Declercq, C., Jusot, J.-F., Prouvost, H. and Ledrans, M., 2006, 'The relation between temperature, ozone, and mortality in nine French cities during the heat wave of 2003', Environmental Health Perspectives, 114(9) 1 344–1 347. Fischer, E. M. and Schär, C., 2010, 'Consistent geographical patterns of changes in high-impact European heatwaves', Nature Geoscience, 3(6) 398–403. Flörke, M., Wimmer, F., Dworak, Th., Laaser, C., Vidaurre, R., Tröltzsch, J., Marinova, N., Jaspers, F., Ludwig, F., Giupponi, C., Bosello, F. and Mysiak, J., 2011, 'Draft final report for the project Climate adaptation — modelling water scenarios and sectoral impacts', CESR, Centre for Environmental Systems Research, Kassel, Germany. Ford, J. D., Berrang-Ford, L. and Paterson, J., 2011, 'A systematic review of observed climate change adaptation in developed nations', Climatic Change, 106(2) 327–336. Forsberg, B., Orru, H., Åström, C., Andersson, C., Ebi, K. and Langner, J., 2011, Impact of climate change on ozone induced mortality in Europe, European Respiratory Society. Annual Congress 2011, Amsterdam. FRC, 2012, FloodResilienCity (http://www. floodresiliencity.eu/en/home/index. php?mod=loginsel=setcookie) accessed 29 March 2012. Füssel, H.-M., 2007, 'Adaptation planning for climate change: concepts, assessment approaches and key lessons', Sustainability Science, (2) 265–275. Füssel, H.-M., Klein, R. J. T. and Ebi, K. L., 2006, 'Adaptation assessment for public health', in: Menne B. and Ebi, K. L. (eds.) Climate Change and Adaptation Strategies for Human Health, Steinkopf Verlag, Darmstadt, Germany. Gábor, P., Jombach, S. and Ongjerth, R., 2008,'The relation between the biological activity and the land surface temperature in Budapest', in: URBIO 2008 proceedings, 21–24 May 2008, Erfurt.
  • 135.
    References Urban adaptationto climate change in Europe 133 Genovese, E., 2006, A methodological approach to land use-based flood damage assessment in urban areas: Prague case study, European Commission, Joint Research Centre, Ispra. Georgi, B., Kazmierczak, A. and Fünfgeld, H., 2012, 'Knowledge and information for resilient cities', in: Otto‑Zimmermann, K. (ed.), Resilient cities 2: Cities and adaptation to climate change proceedings of the global forum 2011, Local Sustainability 2, Springer Science+Business Media B.V. 2012 forthcoming. German Presidency of the Council of the European Union, 2007, Territorial Agenda of the European Union. Towards a more competitive and sustainable Europe of diverse regions, Leipzig. Gill, S. E., Handley, J. F., Ennos, A. R. and Pauleit, S., 2007, 'Adapting Cities for Climate Change: The Role of the Green Infrastructure', Built Environment, (33) 115–133. Giorgi, F., Im, E.-S., Coppola, E., Diffenbaugh, N. S., Gao, X. J., Mariotti, L. and Shi, Y., 2011, 'Higher hydroclimatic intensity with global warming', Journal of Climate, 24(20) 5 309–5 324. Goldberg, V., Eichelmann, V., Prasse, H. and Bernhofer, C., 2003, The flash flood event in the catchment of the river Weißeritz (eastern Erzgebirge, Saxony) from 12–14 August 2002: Meteorological and hydrological reasons, damage assessment and disaster management. Technical University Dresden, Institute for Hydrology and Meteorology, Department of Meteorology, in: EGS-AGU-EUG-Joint Assembly 6–11 April 2003, Nice, France. Greater London Authority, 2010, The draft climate change adaptation strategy for London: Public Consultation Draft, Mayor of London, Greater London Authority, London. Greiving, S. et al., 2011, ESPON Climate. Climate change and territorial effects on regions and local economies, Dortmund. Grislain-Letremy, C. and Peinturier, E., 2010, Le régime d'assurance des catastrophes naturelles en France métropolitaine entre 1995 et 2006, Études documents, MEEDAT / Commissariat Général au Développement Durable, Paris. Grize, L., Huss, A., Thommen, O., Schindler, C. and Braun-Fahrländer, C., 2005, 'Heat wave 2003 and mortality in Switzerland', Swiss Medical Weekly, 135(13–14) 200–205. Gupta, J., Termeer, C. J., Klostermann, J. E., Meijerink, S., Brink van den, M. A. and Jong, P., 2010, 'The adaptive capacity wheel: a method to assess the inherent characteristics of institutions to enable the adaptive capacity of society', Environmental Science Policy, 13(6) 459–471. Guston, D. H., Clark, W., Keating, T., Cash, D., Moser, S., Miller, C. and Powers, C., 2000, Report of the workshop on boundary organizations in environmental policy and science, 9–10 December 1999, Belfer Center for Science and International Affairs, Harvard University, Cambridge, MA (http://www.hks. harvard.edu/gea/pubs/huru1.pdf) accessed 10 April 2012. GWI, 2007, Between a rock and a hard place — Ankara's water future in crisis, Global Water Intelligence, 8(8). Haddad, B. M., 2005, 'Ranking the adaptive capacity of nations to climate change when socio-political goals are explicit', Global Environmental Change Part A, 15(2) 165–176. Haines, A., Kovats, R., Campbell-Lendrum, D. and Corvalan, C., 2006, 'Climate change and human health: impacts, vulnerability, and mitigation', The Lancet, 367(9 528) 2 101–2 109. Hajat, S. and Kosatky, T., 2009, 'Heat-related mortality: a review and exploration of heterogeneity', Journal of Epidemiology Community Health, 64(9) 753–760. Hajat, S., O'Connor, M. and Kosatsky, T., 2010, 'Health effects of hot weather: from awareness of risk factors to effective health protection', Lancet, 375(9717) 856–863. Hallegatte, Stéphane, 2009, 'Strategies to adapt to an uncertain climate change', Global Environmental Change, 19(2) 240–247. Harlan, S. L., Brazel, A. J., Prashad, L., Stefanov, W. L. and Larsen, L., 2006, 'Neighborhood microclimates and vulnerability to heat stress', Social Science Medicine, 63(11) 2 847–2 863. Harris, G. R., Collins, M., Sexton, D. M. H., Murphy, J. M. and Booth, B. B. B., 2010, 'Probabilistic projections for 21st century European climate', Natural Hazards and Earth System Science, 10(9) 2 009–2 020.
  • 136.
    References 134 Urbanadaptation to climate change in Europe Haug, C., Rayner, T., Jordan, A., Hildingsson, R., Stripple, J., Monni, S., Huitema, D., Massey, Eric, Asselt, H. and Berkhout, F., 2009, 'Navigating the dilemmas of climate policy in Europe: evidence from policy evaluation studies', Climatic Change, (101)427–445. Heinelt, H. and Niederhafner, S., 2008, 'Cities and organized interest intermediation in the EU multi-level system', European Urban and Regional Studies, (8) 173–187. Hémon, D. and Jougla, E., 2004, Surmortalité liée à la canicule d'août 2003: suivi de la mortalité post-canicule, causes médicales de décès observées au cours de la vague de chaleur, INSERM, Paris. Heusinkveld, B. G., van Hove, L. W. A., Jacobs, C. M. J., Steeneveld, G. J., Elbers, J. A., Moors, E. J. and Holtslag, A. A. M., 2010,'Use of a mobile platform for assessing urban heat stress in Rotterdam', in: Proceedings of the 7th Conference on Biometeorology. — Berichte des Meteorologischen Instituts der Albert- Ludwigs-Universität 12-14 April 2010, Freiburg, Germany (http://library.wur.nl/WebQuery/ wurpubs/391825) accessed 29 March 2012. Hilpert, K., Mannke, F. and Schmidt-Thomé, P., 2007, Towards Climate Change Adaptation Strategies in the Baltic Sea Region., Geological Survey of Finland, Espoo. Hirabayashi, Y., Kanae, S., Emori, S., Oki, T. and Kimoto, M., 2008, 'Global projections of changing risks of floods and droughts in a changing climate', Hydrological Sciences Journal, 53(4) 754–772. Hoerling, M., Eischeid, J., Perlwitz, J., Quan, X., Zhang, T. and Pegion, P., 2012, On the increased frequency of Mediterranean drought, Journal of Climate, 25(6) 2 146–2 161. Hooghe, L. and Marks, G., 2003, Unraveling the central state, but how? Types of multi-level governance, American Political Science Review, 97(02) 233–243. Hudeková, Z. and Tvrdoň, M., 2011, Adaptation action plan Bratislava — Executive summary, GraBS project (http://www.grabs-eu.org/downloads/AAP_ Executive_summary_Bratislava.pdf). Hungarian Presidency of the Council of the European Union, 2011, Territorial Agenda of the European Union 2020: Towards an inclusive, smart and sustainable Europe of diverse regions, Gödöllő. Hunt, Alistair and Watkiss, Paul, 2010, 'Climate change impacts and adaptation in cities: a review of the literature', Climatic Change, (104) 13–49. Hutter, G., McFadden, L., Penning-Rowsell, E., Tapsell, S. and Borga, M., 2007, Strategies for pre-flood risk management: case studies and recommendations: Integrated flood risk analysis (http://www.floodsite. net/html/partner_area/project_docs/T13_07_04_pre_ flood_RM_strategies_D13_1_v1_0_p04.pdf) accessed 29 March 2012. ICLEI, 2011, Financing the resilient city: A demand driven approach to development, disaster risk reduction and climate adaptation, ICLEI Global Report, ICLEI, Bonn. IPCC, 2001, Climate change 2001: Impacts, adaptation, and vulnerability — Contribution of Working Group II to the third assessment report of the Intergovernmental Panel on Climate Change, Cambridge University Press, Cambridge. IPCC, 2007, Climate change 2007: Synthesis report. Contribution of Working Groups I, II and III to the fourth assessment report of the Intergovernmental Panel on Climate Change, Cambridge University Press, Cambridge, United Kingdom. IPCC, 2000, IPCC Special report on emissions Scenarios, Intergovernmental Panel Climate Change. IPCC, 2012,'Summary for Policymakers.Managing the Risks of Extreme Events and Disasters to Advance Climate Change Adaptation', in: Field, C.B., Barros, V., Stocker, T.F., Qin, D., Dokken, D.J., Ebi, K.L., Mastrandrea, M.D., Mach, K.J., Plattner, G.-K., Allen, S.K., Tignor, M., and Midgley, P.M. (eds), A Special Report of Working Groups I and II of the Intergovernmental Panel on Climate Change, Cambridge University Press, Cambridge, United Kingdom and New York, NY, USA. Johansson, M., Kahma, K., Boman, H. and Launiainen, J., 2004, 'Scenarios for the sea level on the Finnish coast', Boreal Environ Research, (9) 153–166. Juhola, S., 2010,'Mainstreaming Climate Change Adaptation: The Case of Multi-level Governance in Finland', in: Keskitalo, E. C. H. (ed.) Developing adaptation policy and practice in Europe: Multi-level governance of climate change, Springer, Dordrecht.
  • 137.
    References Urban adaptationto climate change in Europe 135 Kamal-Chaoui, L. and Robert, A. (eds), 2009, Competitive cities and climate change, OECD Regional Development Working Papers No 2/2009, OECD publishing, Paris. Katsouyanni, K., 1995, 'Health-effects of air pollution in Southern Europe — Are there interacting factors?', Environmental health perspectives, (103, supplement 2) 23–27. Kazmierczak, A. and Carter, J., 2010, Adaptation to climate change using green and blue infrastructure. A database of case studies. GraBS project, University of Manchester, United Kingdom (http://www.grabs-eu. org/membersArea/files/Database_Final_no_ hyperlinks.pdf) accessed 29 March 2012. Keatinge, W. R., Donaldson, G. C., Cordioli, E., Martinelli, M., Kunst, A. E., Mackenbach, J. P., Nayha, S. and Vuori, I., 2000, 'Heat related mortality in warm and cold regions of Europe: observational study', BMJ (Clinical Research Ed.), 321(7262) 670–673. Kern, K. and Alber, G., 2008, 'Governing climate change in cities: Modes of urban climate governance in multi-level systems', in: Multi-level Systems. OECD International Conference: Competitive Cities and Climate Change 9-10 October 2008, Milan, Italy (http://www. oecd.org/dataoecd/12/38/42554913.pdf) accessed 29 March 2012. Kern, K. and Bulkeley, H., 2009, 'Cities, Europeanization and multi-level governance: Governing climate change through transnational municipal networks', JCMS: Journal of Common Market Studies, 47 309–332. Keskitalo, E. C. H., 2010a, 'Introduction: Adaptation to climate change in Europe — Theoretical ramework and study design', in: Developing of adaptation policy and practice in Europe: Multi-level governance of climate change, Springer, Dordrecht. Keskitalo, E. C. H., 2010b, 'Climate change adaptation in the United Kingdom: England and South-East England', in: Developing of adaptation policy and practice in Europe: Multi-level governance of climate change, Springer, Dordrecht. Keskitalo, E. C. H., 2010c, 'Conclusion: The Development of Adaptive Capacity and Adaptation Measures in European Countries', in: Developing of adaptation policy and practice in Europe: Multi-level governance of climate change, Springer Netherlands, Dordrecht. Keskitalo, E. C. H., 2010d, 'Adapting to climate change in Sweden: National policy development and adaptation measures in Västra Götaland', in: Developing of adaptation policy and practice in Europe: Multi-level governance of climate change, Springer, Dordrecht. Keskitalo, E. C. H. (ed.), 2010e, Developing adaptation policy and practice in Europe: multi-level governance of climate change, Springer, Dordrecht, New York. Kirshen, P., Ruth, M. and Anderson, W., 2007, 'Interdependencies of urban climate change impacts and adaptation strategies: a case study of Metropolitan Boston USA', Climatic Change, (86) 105–122. Klein Tank, A. M. G. and Können, G. P., 2003, 'Trends in indices of daily temperature and precipitation extremes in Europe, 1946–99', Journal of Climate, 16(22) 3 665–3 680. Knight, S., Smith, C. and Roberts, M., 2010, 'Mapping Manchester's urban heat island', Weather, 65(7) 188–193. Knowledge for Climate, 2012a, Netherlands National Climate Change Research Programme — Home (http:// www.climateresearchnetherlands.nl/) accessed 29 March 2012. Knowledge for Climate, 2012b, Rotterdam region (http://knowledgeforclimate. climateresearchnetherlands.nl/hotspots/rotterdam-region) accessed 29 March 2012. Kohler-Koch, B. and Rittberger, B., 2006, Review Article: 'The 'Governance Turn' in EU Studies', JCMS: Journal of Common Market Studies, 44(s1) 27–49. Kooiman, J., 1993,'Governance and governability: Using complexity, dynamics and diversity', in: Modern Governance, Sage, London. Koppe, C., Kovats, S., Jendritzky, G., Menne, B. and Breuer, D. J., 2004, Heat waves: risks and responses, Regional Office for Europe, World Health Organization, Copenhagen. Kovats, R. S. and Hajat, Shakoor, 2008, 'Heat stress and public health: A critical review', Annual Review of Public Health, 29(1) 41–55. Kruuse, A., 2010, The green space factor and green points system, Expert Paper No 6, GraBS project (http://www.grabs-eu.org/downloads/EP6 %20 FINAL.pdf) accessed 29 March 2012.
  • 138.
    References 136 Urbanadaptation to climate change in Europe Kuttler, W., 2008, 'The Urban Climate — Basic and Applied Aspects', in: Marzluff, J. M. Shulenberger, E. Endlicher, W. Alberti, M. Bradley, G. Ryan, C. Simon, U. and ZumBrunnen, C. (eds.) Urban Ecology, Springer US, Boston. Landeshauptstadt Dresden, 2011, Stadtentwicklung and Umwelt: Hochwasser. (http://www.dresden.de/ de/08/03/c_054.php) accessed 29 March 2012. Lautenschlager, M., Keuler, K., Wunram, C., Keup‑Thiel, E., Schubert, M., Will, A., Rockel, B. and Boehm, U., 2009, Climate Simulation with CLM, Climate of the 20th Century (run no.1, 2 and 3) and Scenarios A1B and B1 (run no.1 and 2), Data Stream 3: European region MPI-M/MaD. World Data Center for Climate. Lehner, B., Döll, P., Alcamo, J., Henrichs, T. and Kaspar, F., 2006, 'Estimating the impact of global change on flood and drought risks in Europe: A continental, integrated analysis', Climatic Change, 75(3) 273–299. Letremy, C. and Grislain, N., 2009, Assurance des risques naturels en France: sous quelles conditions les assureurs peuvent-ils inciter à la prévention des catastrophes naturelles?, Études documents, MEEDDAT / Commissariat Général au Développement Durable, Paris. Van der Linden, P. and Mitchell, J. F. B., 2009, Climate change and its impacts: Summary of research and results from the ENSEMBLES project, Met Office Hadley Centre, Exeter. Loftus, A.-C., 2011, Łódź, Poland — River restoration as a catalyst for sustainable urban development. case study of the SWITCH project, ICLEI European Secretariat, Freiburg. London Climate Change Partnership, 2002, London's warming: The impact of climate change on London: Summary report, London Climate Change Partnership, London. Luber, G. and McGeehin, M., 2008, 'Climate change and extreme heat events', American Journal of Preventive Medicine, 35(5) 429–435. Lugeri, N., Kundzewicz, Z. W., Genovese, E., Hochrainer, S. and Radziejewski, M., 2010, 'River flood risk and adaptation in Europe—assessment of the present status', Mitigation and adaptation strategies for global change, 15(7) 621–639. MailOnline, 2009, 'Imbeciles': Hundreds evacuated from their homes as bushfire caused by French military threatens Marseille (http://www.dailymail.co.uk/ news/article-1201562/Imbeciles-Hundreds-evacuated- homes-bushfire-caused-French-military-threatens- Marseille.html) accessed 23 April 2012. Mairie de Paris, 2011, Prévenir les effets d'une canicule (http://www.paris.fr/pratique/Portal.lut?page_ id=6687document_type_id=4document_ id=54173portlet_id=15402multileveldocument_ sheet_id=10003) accessed 29 March 2012. Marchi, L., Borga, M., Preciso, E. and Gaume, E., 2010, 'Characterisation of selected extreme flash floods in Europe and implications for flood risk management', Journal of Hydrology, 394(1–2), 118–133. Martens, W. J. M., 1998, 'Climate change, thermal stress and mortality changes', Social Science Medicine, 46(3) 331–344. Martiello, M. A. and Giacchi, M. V., 2010, 'Review Article: High temperatures and health outcomes: A review of the literature', Scandinavian Journal of Public Health, 38(8) 826–837. Martins, R. D. and Ferreira, L. D. C., 2011, 'Opportunities and constraints for local and subnational climate change policy in urban areas: insights from diverse contexts', International Journal of Global Environmental Issues, 11(1) 37–53. Matthies, F., Bickler, G., Cardenosa Marin, N. and Hales, S., 2008, Heat-health action plans — Guidance, WHO Regional Office for Europe, Copenhagen, Denmark. McEvoy, D., 2009, Insurance industry. Entry in the adaptation and mitigation strategies supporting European climate policy, (ADAM) project digital compendium (http://adam-digital-compendium.pik-potsdam.de/) accessed 29 March 2012McGranahan, G., Balk, D. and Anderson, B., 2007, 'The rising tide: assessing the risks of climate change and human settlements in low elevation coastal zones', Environment and Urbanization, 19(1) 17–37. McKenzie Hedger, M., Connell, Richenda and Bramwell, P., 2006, 'Bridging the gap: empowering decision-making for adaptation through the UK Climate Impacts Programme', Climate Policy, 6(2) 201–215.
  • 139.
    References Urban adaptationto climate change in Europe 137 Mechler, R., Dlugolecki, A., Linnerooth-Bayer, J. and Hochrainer, S., 2011, Insurance instruments for adaptation to climate change, presentation at prevention and insurance of natural catastrophes, 18 October 2011, Brussels, Belgium. Mechler, R., Hochraine, S., Aaheim, A., Kundezewicz, Z. K., Lugeri, N. and Moriondo, M., 2010,'A risk management approach for assessing adaptation to changing flood and drought risks in Europe', in: Making Climate Change Work for Us: European Perspectives on Adaptation and Mitigation Strategies, Cambridge University Press, Cambrigde. Medarova-Bergstrom, K., Volkery, A., Schiellerup, P., Withana, S. and Baldock, D., 2011, Strategies and instruments for climate proofing the EU budget, IEEP, Brussels. Medina-Ramón, M., Zanobetti, A., Cavanagh, D. P. and Schwartz, J., 2006, 'Extreme temperatures and mortality: Assessing effect modification by personal characteristics and specific cause of death in a multi-city case-only analysis', Environmental Health Perspectives, 114(9) 1 331–1 336. Meier, H. E. M., 2006, 'Baltic Sea climate in the late twenty-first century: a dynamical downscaling approach using two global models and two emission scenarios', Climate Dynamics, 27(1) 39–68. Mickwitz, P., 2009, Climate policy integration, coherence and governance, Partnership for European Environmental Research, Helsinki. de Moel, H., van Alphen, J. and Aerts, J. C. J. H., 2009, 'Flood maps in Europe — methods, availability and use', Natural Hazards and Earth System Science, 9(2) 289–301. Municipality of Kalamaria, 2011, Adaptation Action Plan and Political Statement (http://www. grabs-eu.org/downloads/Municipality %20of %20 Kalamaria %20CAAP.pdf) accessed 29 March 2012. Næss, L. O., Bang, G., Eriksen, S. and Vevatne, J., 2005, 'Institutional adaptation to climate change: Flood responses at the municipal level in Norway', Global Environmental Change, 15(2) 125–138. Natural Economy North West, 2012, Natural Economy North West (http://www.naturaleconomynorthwest. co.uk/about.php) accessed 29 March 2012. Nawrot, T. S., Nackaerts, K., Hoet, P. H. M. and Nemery, B., 2007, 'Lung cancer mortality and fine particulate air pollution in Europe', International Journal of Cancer, 120(8) 1 825–1 826. NCVO, 2012, Climate change | National Council for Voluntary Organisations (http://www.ncvo-vol.org.uk/ climatechange) accessed 29 March 2012. Nicholls, R. J., 2004, 'Coastal flooding and wetland loss in the 21st century: changes under the SRES climate and socio-economic scenarios', Global Environmental Change, 14(1) 69–86. Nicholls, R. J., Hanson, S., Herweijer, C., Patmore, N., Hallegatte, S., Corfee-Morlot, J., Chateau, J. and Muir-Wood, R., 2007, Ranking port cities with high exposure and vulnerability to climate extremes — exposure estimates, Environment working paper No 1, Organization for Economic Cooperation and Development, OECD, Paris. Oke, T. R., 1987, Boundary layer climates, 2nd ed., Methuen, London, New York. Oke, T. R., 1982, 'The energetic basis of the urban heat island', Quarterly Journal of the Royal Meteorological Society, 108(455) 1–24. Oliveira, R., Ribeiro, L., Mendes, M. P. and Nascimento, J., 2010,'Recursos Hídricos', in: Santos, F.D. and Cruz, M.J. (eds.) Plano Estratégico de Cascais face às Alterações Climáticas, Câmara Municipal de Cascais, Portugal. ONERC, 2010, Cities and adapting to climate change: Report to the Prime Minister and Parliament, La Documentation Francais, Observatoire National sur les Effets du Réchauffement Climatique, Paris. Ongjerth, R., Gábor, P. and Jombach, S., 2007, A városi hősziget és a zöldfelületi intenzitás kapcsolata, Studio Metropolitana, Budapest. Pahl-Wostl, C., 2009, 'A conceptual framework for analysing adaptive capacity and multi-level learning processes in resource governance regimes', Global Environmental Change, 19(3) 354–365. Paldy, A. and Bobvos, J., 2010,'Health impacts of heat waves of 2007 in Hungary — Background and experiences', in: Dincer, I. Hepbasli, A. Midilli, A. and Karakoc, T. H. (eds.) Global Warming, Springer US, Boston, MA.
  • 140.
    References 138 Urbanadaptation to climate change in Europe Pauleit, S., Liu, L., Ahern, J. and Kazmierczak, A., 2011,'Multifunctional green infrastructure planning to promote ecological services in the city', in: Urban Ecology. Patterns, Processes, and Applications, Oxford University Press, Oxford. PB, 2009, Climate change risk assessment and adaptation action plan: Volume 1 — risk assessment report, Parsons Brinckerhoff Australia Pty Limited; Penrith City Council, Sydney. PBL, 2011, Climate Adaptation in the Dutch Delta. Strategic options for a climate-proof development of the Netherlands, PBL Netherlands Environmental Assessment, Den Haag, the Netherlands. Philip, R., 2011, Zaragoza, Spain — Reducing water demand and establishing a water saving culture in the city of Zaragoza. case study in the SWITCH project, ICLEI European Secretariat, Freiburg. Piorr, A., Ravetz, J. and Tosics, I., 2011, Peri‑urbanisation in Europe, PLUREL, Berlin. PLUREL, 2011, Peri-urbanisation in Europe — Towards European policies to sustain urban-rural futures. Synthesis Report, Forest Landscape, University of Copenhagen, Copenhagen. Provincia di Genova, 2011, Climate change adaptation action plan. Executive summary (http://www.grabs-eu. org/downloads/Province %20of %20Genoa %20 AAP_Executive %20summary.pdf) accessed 29 March 2012. Prutsch, A., Grothmann, T., Schauser, I., Otto, S. and McCallum, S., 2010, Guiding principles for adaptation to climate change in Europe, ETC/ACC Technical Paper, The European Topic Centre on Air and Climate Change, Bilthoven. Rauhala, J. and Schultz, D. M., 2009, 'Severe thunderstorm and tornado warnings in Europe', Atmospheric Research, 93(1–3) 369–380. Reid, C., O'Neill, M., Gronlund, C., Brines, S., Brown, D., Diez-Roux, A. and Schwartz, J., 2009, Mapping community determinants of heat vulnerability, Environmental Health Perspectives, 117(11) 1 730–1 736. Rhodes, R. A. W., 1996, 'The new governance: Governing without government', Political Studies, 44(4) 652–667. Ribeiro, M., Losenno, C., Dworak, T, Massey, E, Swart, R, Benzie, M. and Laaser, C., 2009, Design of guidelines for the elaboration of regional climate change adaptations strategies. Study for European Commission, Ecologic institute, Berlin. van Riel, W., 2011, Exploratory study of pluvial flood impacts in Dutch urban areas, Deltares, Delft. Robine, J., Cheung, S., Leroy, S., Vanoyen, H., Griffiths, C., Michel, J. and Herrmann, F., 2008, 'Death toll exceeded 70,000 in Europe during the summer of 2003', Comptes Rendus Biologies, 331(2) 171–178. Royal Academy of Engineering, 2011, Infrastructure, engineering and climate change adaptation — ensuring services in an uncertain future, Royal Academy of Engineering, London. Salford City Council, 2008, Planning Guidance: Flood Risk and Development (http://www.salford.gov.uk/ floodrisk-planguidance.htm) accessed 29 March 2012. Sardon, J.-P., 2007, 'The 2003 heat wave', Euro Surveillance, 12(3) 226. Scarlett, L., 2011,'Climate Adaptation', in: Linkov, I. and Bridges, T. S. (eds.) Climate, Springer Netherlands, Dordrecht. Schär, C., Vidale, P. L., Lüthi, D., Frei, C., Häberli, C., Liniger, M. A. and Appenzeller, C., 2004, The role of increasing temperature variability in European summer heatwaves, Nature, 427(6972) 332–336. Schauser, I., Otto, S., Schneiderbauer, S., Harvey, A., Hodgson, N., Robrecht, H., Morchain, D., Schrander, J.-J., Khovanskaia, M., Celikyilmaz-Aydemir, G., Prutsch, A. and McCallum, S., 2010, Urban regions: vulnerabilities, vulnerability assessments by indicators and adaptation options for climate change impacts — Scoping study, ETC/ACC Technical Paper, European Topic Centre on Air and Climate Change, Bilthoven. Schmidt-Thomé, P. and Pelton, L., 2006,'Sea level change assessment in the Baltic Sea Region and spatial planning responses', in: Sea Level Change Affecting the Spatial Development of the Baltic Sea Region, Special paper 41, Geological Survey of Finland, Espoo, 7–16.
  • 141.
    References Urban adaptationto climate change in Europe 139 Schröter, D. et al., 2004, ATEAM Final report. Section 5 and 6 and Annex 1 to 6. Detailed report, related to overall project duration. Reporting period: 01.01.2001- 30.06.2004, Potsdam Institute for Climate Impact Research (PIK), Potsdam. Schumacher, U., 2005, Historic maps promote recent flood risk research — the case of the upper Elbe river, Leibnitz Institute of Ecological and Regional Development, Dresden. Scott, F., 2011, Is localism delivering for climate change? Emerging responses from local authorities, local enterprise partnerships and neighbourhood plans, Green Alliance, London. Scott, J. and Weston, C., 2011, 'The pitfalls and promises of climate adaptation planning', Australasian Journal of Environmental Management, 18(2) 73–87. Sedee, A.G.J. and Pijnappels, M.H.J., 2010, Klimaat als kans. Adaptatie aan klimaatverandering in de ruimtelijke ordening, Kennis voor Klimaat, Utrecht. Shaw, R., Colley, M. and Connell, R., 2007, Climate change adaptation by design: a guide for sustainable communities, TCPA, London. Smargiassi, A., Goldberg, M. S., Plante, C., Fournier, M., Baudouin, Y. and Kosatsky, T, 2009, 'Variation of daily warm season mortality as a function of micro-urban heat islands', Journal of Epidemiology Community Health, 63(8) 659–664. Smit, B., Burton, I., Klein, R. J. T. and Wandel, J., 2000, 'An anatomy of adaptation to climate change and variability', Climatic Change, (45) 223–251. Smit, B. and Pilifosova, O., 2001, Adaptation to climate change in the context of sustainable development and equity. Contribution of the Working Group to the third assessment report of the Intergovernmental Panel on Climate Change, Cambridge University Press, Cambridge. Sousa, P. M., Trigo, R. M., Aizpurua, P., Nieto, R., Gimeno, L. and Garcia-Herrera, R., 2011, 'Trends and extremes of drought indices throughout the 20th century in the Mediterranean', Natural Hazards and Earth System Science, 11(1) 33–51. Southampton City Council, 2011, Low Carbon City 2011-2020. Part 2: The Strategy (http://www.grabs-eu. org/downloads/Part %202 %20 %20The %20 Low %20Carbon %20City %20Strategy.pdf) accessed 29 March 2012. Stalenberg, B. and Vrijling, H., 2009,'The concept of adaptable flood defenses as a synergic and sustainable solution for the flood issues in the city of Nijmegen (NL)' (http://www.waterbouw.tudelft. nl/fileadmin/Faculteit/CiTG/Over_de_faculteit/ Afdelingen/Afdeling_Waterbouwkunde/sectie_ waterbouwkunde/people/personal/stalenberg/ Publications/doc/SASBE2009_NT4380.pdf) accessed 29 March 2012. Stedman, J. R., 2004, 'The predicted number of air pollution related deaths in the UK during the August 2003 heatwave', Atmospheric Environment, 38(8) 1 087–1 090. Stedman, J. R., Anderson, H. R., Atkinson, R. W. and Maynard, R. L., 1997, 'Emergency hospital admissions for respiratory disorders attributable to summer time ozone episodes in Great Britain', Thorax, 52(11) 958–963. Steeneveld, G. J., Koopmans, S., Heusinkveld, B. G., van Hove, L. W. A. and Holtslag, A. A. M., 2011, Quantifying urban heat island effects and human comfort for cities of variable size and urban morphology in the Netherlands, Journal of Geophysical Research, 116(D20). Sterl, A., Severijns, C., Dijkstra, H., Hazeleger, W., Jan van Oldenborgh, G., van den Broeke, M., Burgers, G., van den Hurk, B., Jan van Leeuwen, P. and van Velthoven, P., 2008, 'When can we expect extremely high surface temperatures?', Geophysical Research Letters, 35(14) L14703. Stocker, T., Dahe, Q., Plattner, G.-K., Tignor, M., Allen, S. and Midgley, P., 2010, IPCC workshop on sea level rise and ice sheet instabilities — Workshop report, Kuala Lumpur, Malaysia, 21–25 June 2010, IPCC Working Group I Technical Support Unit, Bern, Switzerland. Stone, C., 1986,'Power and Social Complexity', in: Waste, R. J. (ed.) Community Power. Directions for future research, SAGE, Beverly Hills. Storbjörk, S., 2007, 'Governing climate adaptation in the local arena: Challenges of risk management and planning in Sweden', Local Environment, 12(5) 457–469.
  • 142.
    References 140 Urbanadaptation to climate change in Europe Swart, R., Biesbroek, R., Binnerup, S, Carter, T.R., Cowan, C, Henrichs, T, Loquen, S., Mela, H., Morecroft, M., Reese, M. and Rey, D., 2009, Europe adapts to climate change comparing national adaptation strategies, PEER, Helsinki. Tanner, T., Mitchell, T., Polack, V. and Guenther, B., 2009, Urban governance for adaptation: assessing climate change resilience in ten Asian cities, Working paper No 315, Volume 2009, Institute of Development Studies, Brighton, United Kingdom. Tigrek, S. and Kibaroglu, A., 2011,'Strategic Role of Water Resources for Turkey', in: Kramer, A. Kibaroglu, A. and Scheumann, W. (eds.), Turkey's Water Policy, Springer Berlin Heidelberg, Berlin, Heidelberg. Uejio, C. K., Wilhelmi, O. V., Golden, J. S., Mills, D. M., Gulino, S. P. and Samenow, J. P., 2011, 'Intra‑urban societal vulnerability to extreme heat: the role of heat exposure and the built environment, socioeconomics, and neighborhood stability', Health Place, 17(2) 498–507. UKCIP, 2009, A local climate impacts profile: how to do an LCLIP. UK Climate Impacts Programme, Oxford (http://www.ukcip.org.uk/wordpress/wp-content/ PDFs/LCLIP_guidance2009.pdf) accessed 29 March 2012. UN, 2010, World urbanization prospects, the 2009 revision. Highlights, United Nations, New York. UNECE, 2009, Guidance on water and adaptation to climate change, United Nations, New York, Geneva. UNISDR, 2009, 2009 UNISDR terminology on disaster risk reduction, United Nations International Strategy for Disaster Reduction, Geneva. VÁTI, 2011, Climate-friendly cities: A handbook on the tracks and possibilities of European cities in relation to climate change, Ministry of Interior Hungary — VÁTI, Budapest. Vermeer, M. and Rahmstorf, S., 2009, 'From the Cover: Global sea level linked to global temperature', Proceedings of the National Academy of Sciences, 106(51) 21 527–21 532. Wardekker, J. A., 2011, Climate change impact assessment and adaptation under uncertainty, Utrecht University, Utrecht. (http://www.nusap.net/ downloads/Wardekker_PhDdissertation_2011.pdf) accessed 29 March 2012. Watkiss, P., 2011, The ClimateCost project. Final report, Volume 1: Europe, Stockholm Environment Institute, Stockholm, Sweden. Westerhoff, L., Keskitalo, E. C. H. and Juhola, S., 2011, Capacities across scales: local to national adaptation policy in four European countries, Climate Policy, 11(4) 1 071–1 085. Wilby, R. L., 2008, Constructing climate change scenarios of urban heat island intensity and air quality, Environment and Planning B: Planning and Design, 35(5) 902–919. Wilhelmi, O. V. and Hayden, M. H., 2010, Connecting people and place: a new framework for reducing urban vulnerability to extreme heat, Environmental Research Letters, 5(1) 014021. Wilhelmi, O. V., Purvis, K. L. and Harriss, R. C., 2004, Designing a geospatial information infrastructure for mitigation of heat wave hazards in urban areas, Natural Hazards Review, 5(3) 147. World Bank, 2012, The worldwide governance indicators (WGI) project (http://info.worldbank.org/governance/ wgi/index.asp) accessed 29 March 2012. Yohe, G. and Tol, R. S. J., 2002, Indicators for social and economic coping capacity—moving toward a working definition of adaptive capacity, Global Environmental Change, (12) 25–40. Young, O.R., 2002, The institutional dimensions of environmental change. Fit, interplay, and scale, MIT Press, Cambridge and London.
  • 143.
    141 Annex I Urban adaptation to climate change in Europe Annex I Key information The European Climate Adaptation Platform CLIMATE-ADAPT (Figure A.1) provides a huge variety of information on climate change adaptation at European, national, regional level and for cities including case studies, tools, reports and documents. This collection will be continuously updated. In addition national information portals provide information for urban adaptation. Figure A.1 Homepage of the European Climate Adaptation Platform CLIMATE‑ADAPT Source: http://climate-adapt.eea.europa.eu. The following list highlights selected key sources. a) Selection of key literature and studies VÁTI, 2011, Climate-Friendly Cities: A Handbook on the Tracks and Possibilities of European Cities in Relation to Climate Change, Ministry of Interior Hungary — VÁTI, Budapest (http://www.eukn.org/ dsresource?objectid=224489). CoR, 2011a, Adaptation to Climate Change: Policy instruments for adaptation to climate change in big European cities and metropolitan areas, European Union. Committee of the Regions, Brussels (http://80.92.67.120/en/documentation/studies/ Documents/Adaptation%20to%20Climate%20 Change/EN.pdf). Schauser et al., 2010, Urban Regions: Vulnerabilities, Vulnerability Assessments by Indicators and Adaptation Options for Climate Change Impacts — Scoping Study, European Topic Centre on Air and Climate Change, Bilthoven (http://acm.eionet.europa.eu/reports/docs/ ETCACC_TP_2010_12_Urban_CC_Vuln_Adapt. pdf). IPCC, 2007, Climate change 2007: Synthesis report. Contribution of Working Groups I, II and III to the Fourth Assessment Report of the Intergovernmental Panel on Climate Change, Cambridge University Press, Cambridge, United Kingdom (http://www. ipcc.ch/pdf/assessment-report/ar4/syr/ar4_syr.pdf). EEA, JRC and WHO, 2008, Impacts of Europe's changing climate: 2008 indicator-based assessment, EEA Report No 4/2008, European Environment Agency (http://www.eea.europa.eu/publications/ eea_report_2008_4). EEA, 2010a, The European environment — state and outlook 2010: Thematic assessment — Adapting to climate change. European Environment Agency (http://www.eea.europa.eu/soer/europe/adapting-to-climate- change).
  • 144.
    Annex I 142Urban adaptation to climate change in Europe Greiving, S. et al., 2011, ESPON Climate. Climate Change and Territorial Effects on Regions and Local Economies, ESPON (http://www.espon.eu/export/ sites/default/Documents/Projects/AppliedResearch/ CLIMATE/inceptionreport_final.pdf). OECD, 2010, Cities and Climate Change, OECD Publishing (http://www.oecd.org/document/34/0 ,3746,en_2649_37465_46573474_1_1_1_37465,00. html#how_to_obtain_this_book) Corfee-Morlot, J., Kamal-Chaoui, L., Donovan, M., Cochran, I., Robert, A. and Teasdale, P., 2009, Cities, Climate Change and Multilevel Governance OECD Environmental Working Papers N° 14., OECD Publishing. Kamal-Chaoui, L. and Robert, A. (eds), 2009, Competitive Cities and Climate Change, OECD publishing (http://www.oecd.org/ dataoecd/30/36/44232251.pdf). Kazmierczak, A. and Carter, J., 2010, Adaptation to climate change using green and blue infrastructure. A database of case studies (http://www.grabs-eu.org/ membersArea/files/Database_Final_no_hyperlinks. pdf). Keskitalo, E. C. H., 2010, Developing adaptation policy and practice in Europe: multi-level governance of climate change, Springer, Dordrecht; New York. b) Selection of tools and guidance for adaptation Shaw, R., Colley, M. and Connell, R., 2007, Climate change adaptation by design: a guide for sustainable communities, TCPA, London (www.preventionweb. net/files/7780_20070523CCAlowres1.pdf). Matthies, F., Bickler, G., Cardenosa Marin, N. and Hales, S., 2008, Heat-health action plans — Guidance, WHO Regional Office for Europe, Copenhagen, Denmark (http://www.euro.who.int/__data/assets/ pdf_file/0006/95919/E91347.pdf). SWITCH Managing Water for the City of the Future — Trainings Desk (http://www.switchtraining.eu/ home). UKCIP Adaptation Wizard (http://www.ukcip.org. uk/wizard). Snover, A. K., Whitely Binder, L., Lopez, J., Willmott, E., Kay, J., Howell, D. and Simmonds, J., 2007, Preparing for Climate Change: A Guidebook for Local, Regional, and State Governments, ICLEI- Local Governments for Sustainability, Oakland, CA, USA (http://www.icleiusa.org/action-center/planning/ adaptation-guidebook). Ribeiro, M., Losenno, C., Dworak, T., Massey, E., Swart, R., Benzie, M. and Laaser, C., 2009, Design of guidelines for the elaboration of Regional Climate Change Adaptations Strategies. Study for European Commission.
  • 145.
    143 Annex II Urban adaptation to climate change in Europe Data types Primary data source Link Share of green and blue urban areas per city area Urban Atlas http://www.eea.europa.eu/data-and-maps/data/ urban-atlas Percentage of the city that would be flooded in case of water in rivers rises 1m Urban Atlas; Projected change in 100-year return level of river discharge between 2071–2100 and the reference period 1961–1990 http://www.eea.europa.eu/data-and-maps/data/ urban-atlas http://ec.europa.eu/dgs/jrc/index.cfm Mean soil sealing degree EEA FTSP on Land Monitoring — Degree of soil sealing 100 m http://www.eea.europa.eu/data-and-maps/ data/eea-fast-track-service-precursor-on-land-monitoring- degree-of-soil-sealing-100m-1 Change in the potential inundation exposure for urban areas due to sea level rise Urban Atlas; ESPON CLIMATE http://www.eea.europa.eu/data-and-maps/data/ urban-atlas Total population Urban Audit http://epp.eurostat.ec.europa.eu/portal/page/ portal/region_cities/introduction Population density Urban Audit http://epp.eurostat.ec.europa.eu/portal/page/ portal/region_cities/introduction Share of people 65 years Urban Audit http://epp.eurostat.ec.europa.eu/portal/page/ portal/region_cities/introduction Percentage of higher educated population aged 15–64 (qualified at tertiary level) Urban Audit http://epp.eurostat.ec.europa.eu/portal/page/ portal/region_cities/introduction percentage of women among elected city representatives Urban Audit http://epp.eurostat.ec.europa.eu/portal/page/ portal/region_cities/introduction GDP per capita Urban Audit http://epp.eurostat.ec.europa.eu/portal/page/ portal/region_cities/introduction Age dependency index Urban Audit http://epp.eurostat.ec.europa.eu/portal/page/ portal/region_cities/introduction Perceptions that the city is committed to fight against climate change Urban perception survey http://epp.eurostat.ec.europa.eu/portal/page/ portal/region_cities/introduction Perceptions on 'most people can be trusted' Urban perception survey http://epp.eurostat.ec.europa.eu/portal/page/ portal/region_cities/introduction Annex II City data The selection of cities considered in the maps and diagrams of this report is based on the Urban Audit database(Eurostat, 2012). This database includes 321 European cities in the 27 countries of the European Union along with 36 additional cities in Norway, Switzerland and Turkey. The administrative unit of the city is here defined as the 'core city'. Table A1 below lists the data types collected for the report. They were retrieved from the Urban Audit database as well as other public available data sources. It should be noted that not all data were available for each of the Urban Audit cities. Table A.1 List of data types collected for the report Available at: http://www.eea.europa.eu/publications/urban-adaptation-to-climate-change. The following information can be downloaded at: http://www.eea.europa.eu/publications/urban-adaptation- to-climate-change • Interactive maps and Excel data table with the collected and produced city data; • Description of the methodology used to define the city area; • Description of specifically developed indicators: - Share of green and blue urban areas; - Coastal flooding; - River flooding.
  • 147.
    European Environment Agency Urban adaptation to climate change in Europe Challenges and opportunities for cities together with supportive national and European policies 2012 — 143 pp. — 21 x 29.7 cm ISBN 978-92-9213-308-5 doi:10.2800/41895 HOW TO OBTAIN EU PUBLICATIONS Free publications: • via EU Bookshop (http://bookshop.europa.eu); • at the European Union's representations or delegations. You can obtain their contact details on the Internet (http://ec.europa.eu) or by sending a fax to +352 2929-42758. Priced publications: • via EU Bookshop (http://bookshop.europa.eu). Priced subscriptions (e.g. annual series of the Official Journal of the European Union and reports of cases before the Court of Justice of the European Union): • via one of the sales agents of the Publications Office of the European Union (http://publications.europa.eu/others/agents/index_en.htm).
  • 148.
    TH-AL-12-002-EN-C doi:10.2800/41895 EuropeanEnvironment Agency Kongens Nytorv 6 1050 Copenhagen K Denmark Tel.: +45 33 36 71 00 Fax: +45 33 36 71 99 Web: eea.europa.eu Enquiries: eea.europa.eu/enquiries