Download to read offline
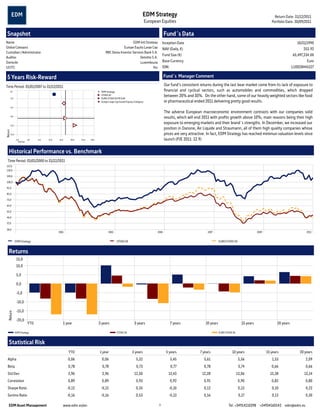


This document provides a summary of the EDM International Strategy fund as of September 30, 2011. The fund focuses on European equities and has $65.5 million in assets under management. It has outperformed its benchmarks with returns of 5.32% and 5.45% over the past 3 and 5 years. The top holdings are Roche Holding AG, Capita Group PLC, Tesco PLC, Danone, and SAP AG. The majority of country exposure is to France at 21.3% and Denmark at 7.4%.


