Download to read offline
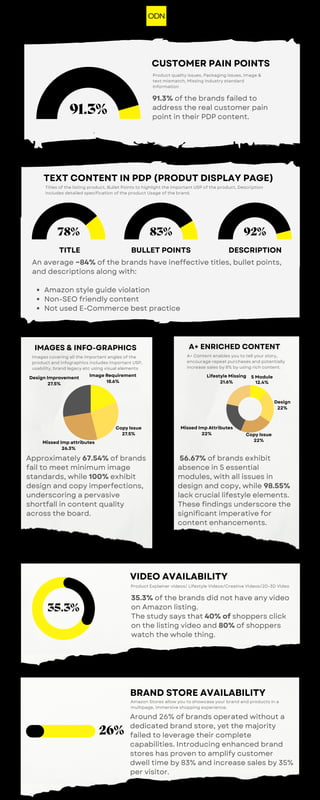

The document analyzes e-commerce content across 25 categories and multiple marketplaces, highlighting significant shortcomings in brands' product display page (PDP) content. Key findings indicate that 91.3% of brands fail to address customer pain points, with poor titles, bullet points, and descriptions contributing to ineffective listings. Additionally, many brands lack essential video content and brand store capabilities, emphasizing the need for substantial content enhancement to improve customer engagement and sales.