(DIYA) Bhumkar Chowk Call Girls Just Call 7001035870 [ Cash on Delivery ] Pun...
ecolab DescriptionFinancialHighlights
1. DESCRIPTION OF BUSINESS
Ecolab is the global leader in cleaning, sanitizing, food safety and infection control products and services. Founded
in 1923 and headquartered in St. Paul, Minn., Ecolab has been partnering with customers for more than 80 years.
Ecolab reaches customers in more than 160 countries across North America, Europe, Asia Pacific, Latin America,
the Middle East and Africa, and employs more than 23,000 associates worldwide. Ecolab delivers comprehensive
programs and services to the foodservice, food and beverage processing, hospitality, healthcare, government and
education, retail, textile care, commercial facilities, and vehicle wash industries.
Ecolab is committed to assisting customers worldwide with their unique needs by providing them with
comprehensive, value-added solutions and professional, personal service. With more than 13,000 sales-and-service
experts, Ecolab employs the industry’s largest and best-trained direct sales-and-service force, which advises and
assists customers in meeting a full range of cleaning, sanitation and service needs. For more information, visit
www.ecolab.com or call 1-800-35-CLEAN.
Ecolab common stock is traded on the New York Stock Exchange under the symbol ECL. Ecolab news releases and
other selected investor information are available at www.ecolab.com.
FORWARD-LOOKING STATEMENTS AND RISK FACTORS
We refer readers to the company’s disclosure, entitled “Forward-Looking Statements and Risk Factors,” which is
located on page 26 of this Annual Report.
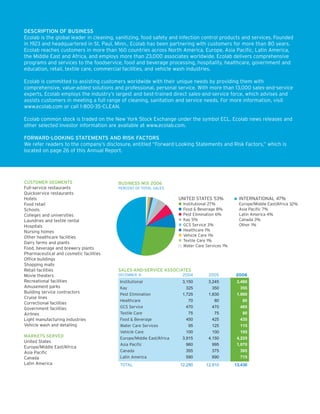
CUSTOMER SEGMENTS BUSINESS MIX 2006
Full-service restaurants PERCENT OF TOTAL SALES
Quickservice restaurants
UNITED STATES 53% INTERNATIONAL 47%
Hotels
Institutional 27% Europe/Middle East/Africa 32%
Food retail
Food & Beverage 8% Asia Pacific 7%
Schools
Pest Elimination 6% Latin America 4%
Colleges and universities
Kay 5% Canada 3%
Laundries and textile rental
GCS Service 3% Other 1%
Hospitals
Healthcare 1%
Nursing homes
Vehicle Care 1%
Other healthcare facilities
Textile Care 1%
Dairy farms and plants
Water Care Services 1%
Food, beverage and brewery plants
Pharmaceutical and cosmetic facilities
Office buildings
Shopping malls
SALES-AND-SERVICE ASSOCIATES
Retail facilities
2004 2005 2006
DECEMBER 31
Movie theaters
Recreational facilities Institutional 3,150 3,245 3,490
Amusement parks Kay 325 350 355
Building service contractors Pest Elimination 1,725 1,830 1,900
Cruise lines
Healthcare 70 80 80
Correctional facilities
GCS Service 470 470 465
Government facilities
Textile Care 75 75 80
Airlines
Food & Beverage
Light manufacturing industries 450 425 435
Vehicle wash and detailing Water Care Services 95 125 115
Vehicle Care 100 100 105
MARKETS SERVED Europe/Middle East/Africa 3,915 4,150 4,225
United States
Asia Pacific 960 995 1,070
Europe/Middle East/Africa
Canada 355 375 395
Asia Pacific
Latin America 590 690 715
Canada
Latin America TOTAL 12,280 12,910 13,430
2. NET INCOME DILUTED NET INCOME DIVIDENDS DECLARED
NET SALES
PER SHARE PER SHARE
DOLLARS IN MILLIONS
DOLLARS IN MILLIONS
DOLLARS DOLLARS
$1.43
$0.4150
$369
$4,896
$4,535
$0.3625
$319
$1.23
$4,185
$0.3275
$283
$3,762
$1.09
$0.2975
$261
$0.2750
$0.99
$3,404
$196
$0.75
02 03 06 02 03 06 02 03 06 02 03 06
04 05 04 05 04 05 04 05
FINANCIAL HIGHLIGHTS PERCENT CHANGE
2006 2005 2004 2006 2005
THOUSANDS, EXCEPT PER SHARE
Net Sales $4,895,814 $4,534,832 $4,184,933 8% 8%
Net Income 368,615 319,481 282,693 15 13
Percent of Sales 7.5% 7.0% 6.8%
Diluted Net Income Per Common Share 1.43 1.23 1.09 16 13
Diluted Weighted-Average Common Shares Outstanding 257,144 260,098 260,407 (1) –
Dividends Declared Per Common Share 0.4150 0.3625 0.3275 14 11
Cash Provided by Operating Activities 627,564 590,136 570,908 6 3
Capital Expenditures 287,885 268,783 275,871 7 (3)
Shareholders’ Equity 1,680,230 1,649,210 1,598,141 2 3
Return on Beginning Equity 22.4% 20.0% 21.4%
Total Debt 1,066,036 746,301 701,577 43 6
Total Debt to Capitalization 38.8% 31.2% 30.5%
Total Assets $4,419,365 $3,796,628 $3,716,174 16% 2%
ECOLAB STOCK PERFORMANCE ECOLAB STOCK PERFORMANCE COMPARISON
1.70
2004 2005 2006
• Ecolab Stock Price Index, Dec. 31, 2003 = 1.00
$47
• Ecolab Stock Price 31, 2003 = 1.00
ECOLAB, S&P 500 INDICES
QUARTER LOW HIGH LOW HIGH LOW HIGH 1.60
• S&P 500 Index, Dec.
ECOLAB STOCK PRICE
$42
First $26.12 $28.61 $31.20 $35.08 $33.64 $40.50 1.50
Second 27.95 31.77 30.68 34.23 37.00 41.20
1.40
Third 29.04 31.80 30.75 34.14 39.57 45.43 $37
1.30
Fourth 31.32 35.59 30.93 37.15 43.81 46.40
$32 1.20
1 .1 0
$27
1.00
$22 0.90
4Q 1Q 2Q 3Q 4Q 1Q 2Q 3Q 4Q 1Q 2Q 3Q 4Q
2003 2004 2005 2006
All financial information for all periods reflects the company’s adoption of Statement of Financial Accounting Standards No. 123 (Revised 2004), “Share-Based
Payment” in the fourth quarter of 2005. All prior periods have been restated.
COVER: Inspiring Confidence is all about expertise. And that’s exactly what Ecolab provides to our customers around the globe.
Our experts provide the most professional, timely service. The most creative, thoughtful problem-solving. The most thorough,
knowledgeable research. In fact, there are more than 23,000 experts hard at work every day at Ecolab to help our customers
run smoother, more efficient and more successful operations. For us, Inspiring Confidence isn’t something to aspire to – it’s a job
requirement. And we wouldn’t have it any other way.