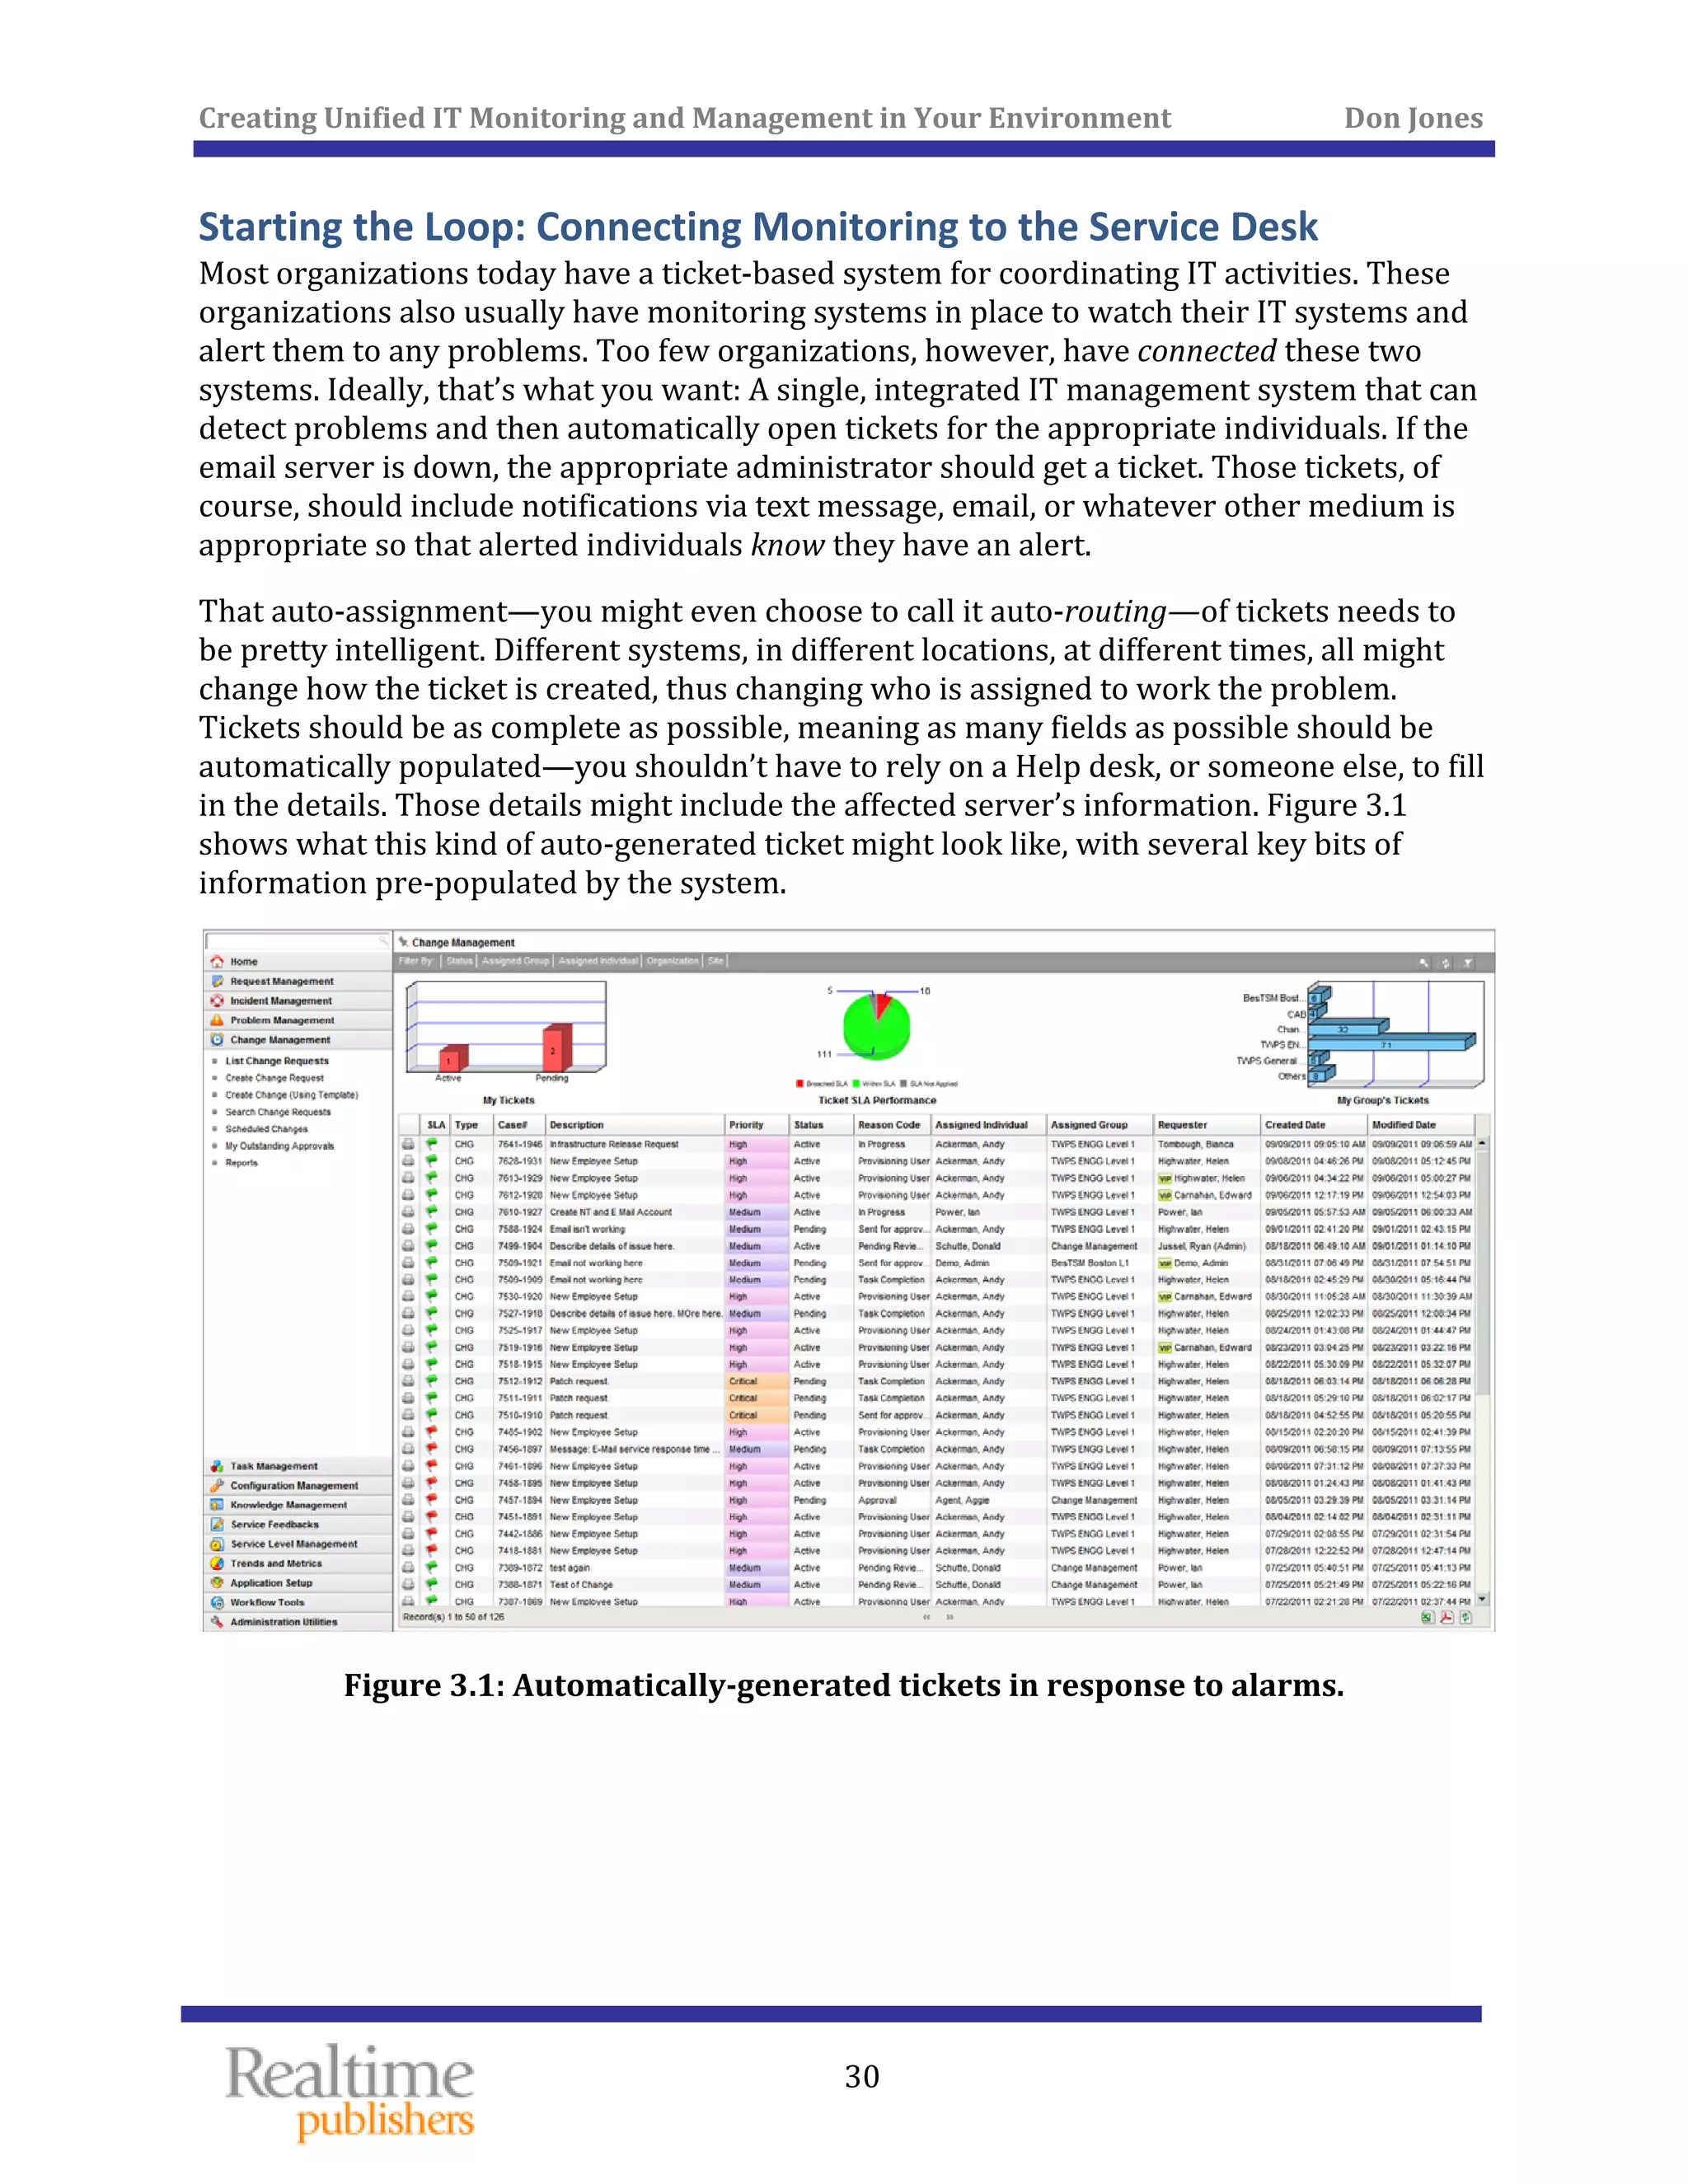
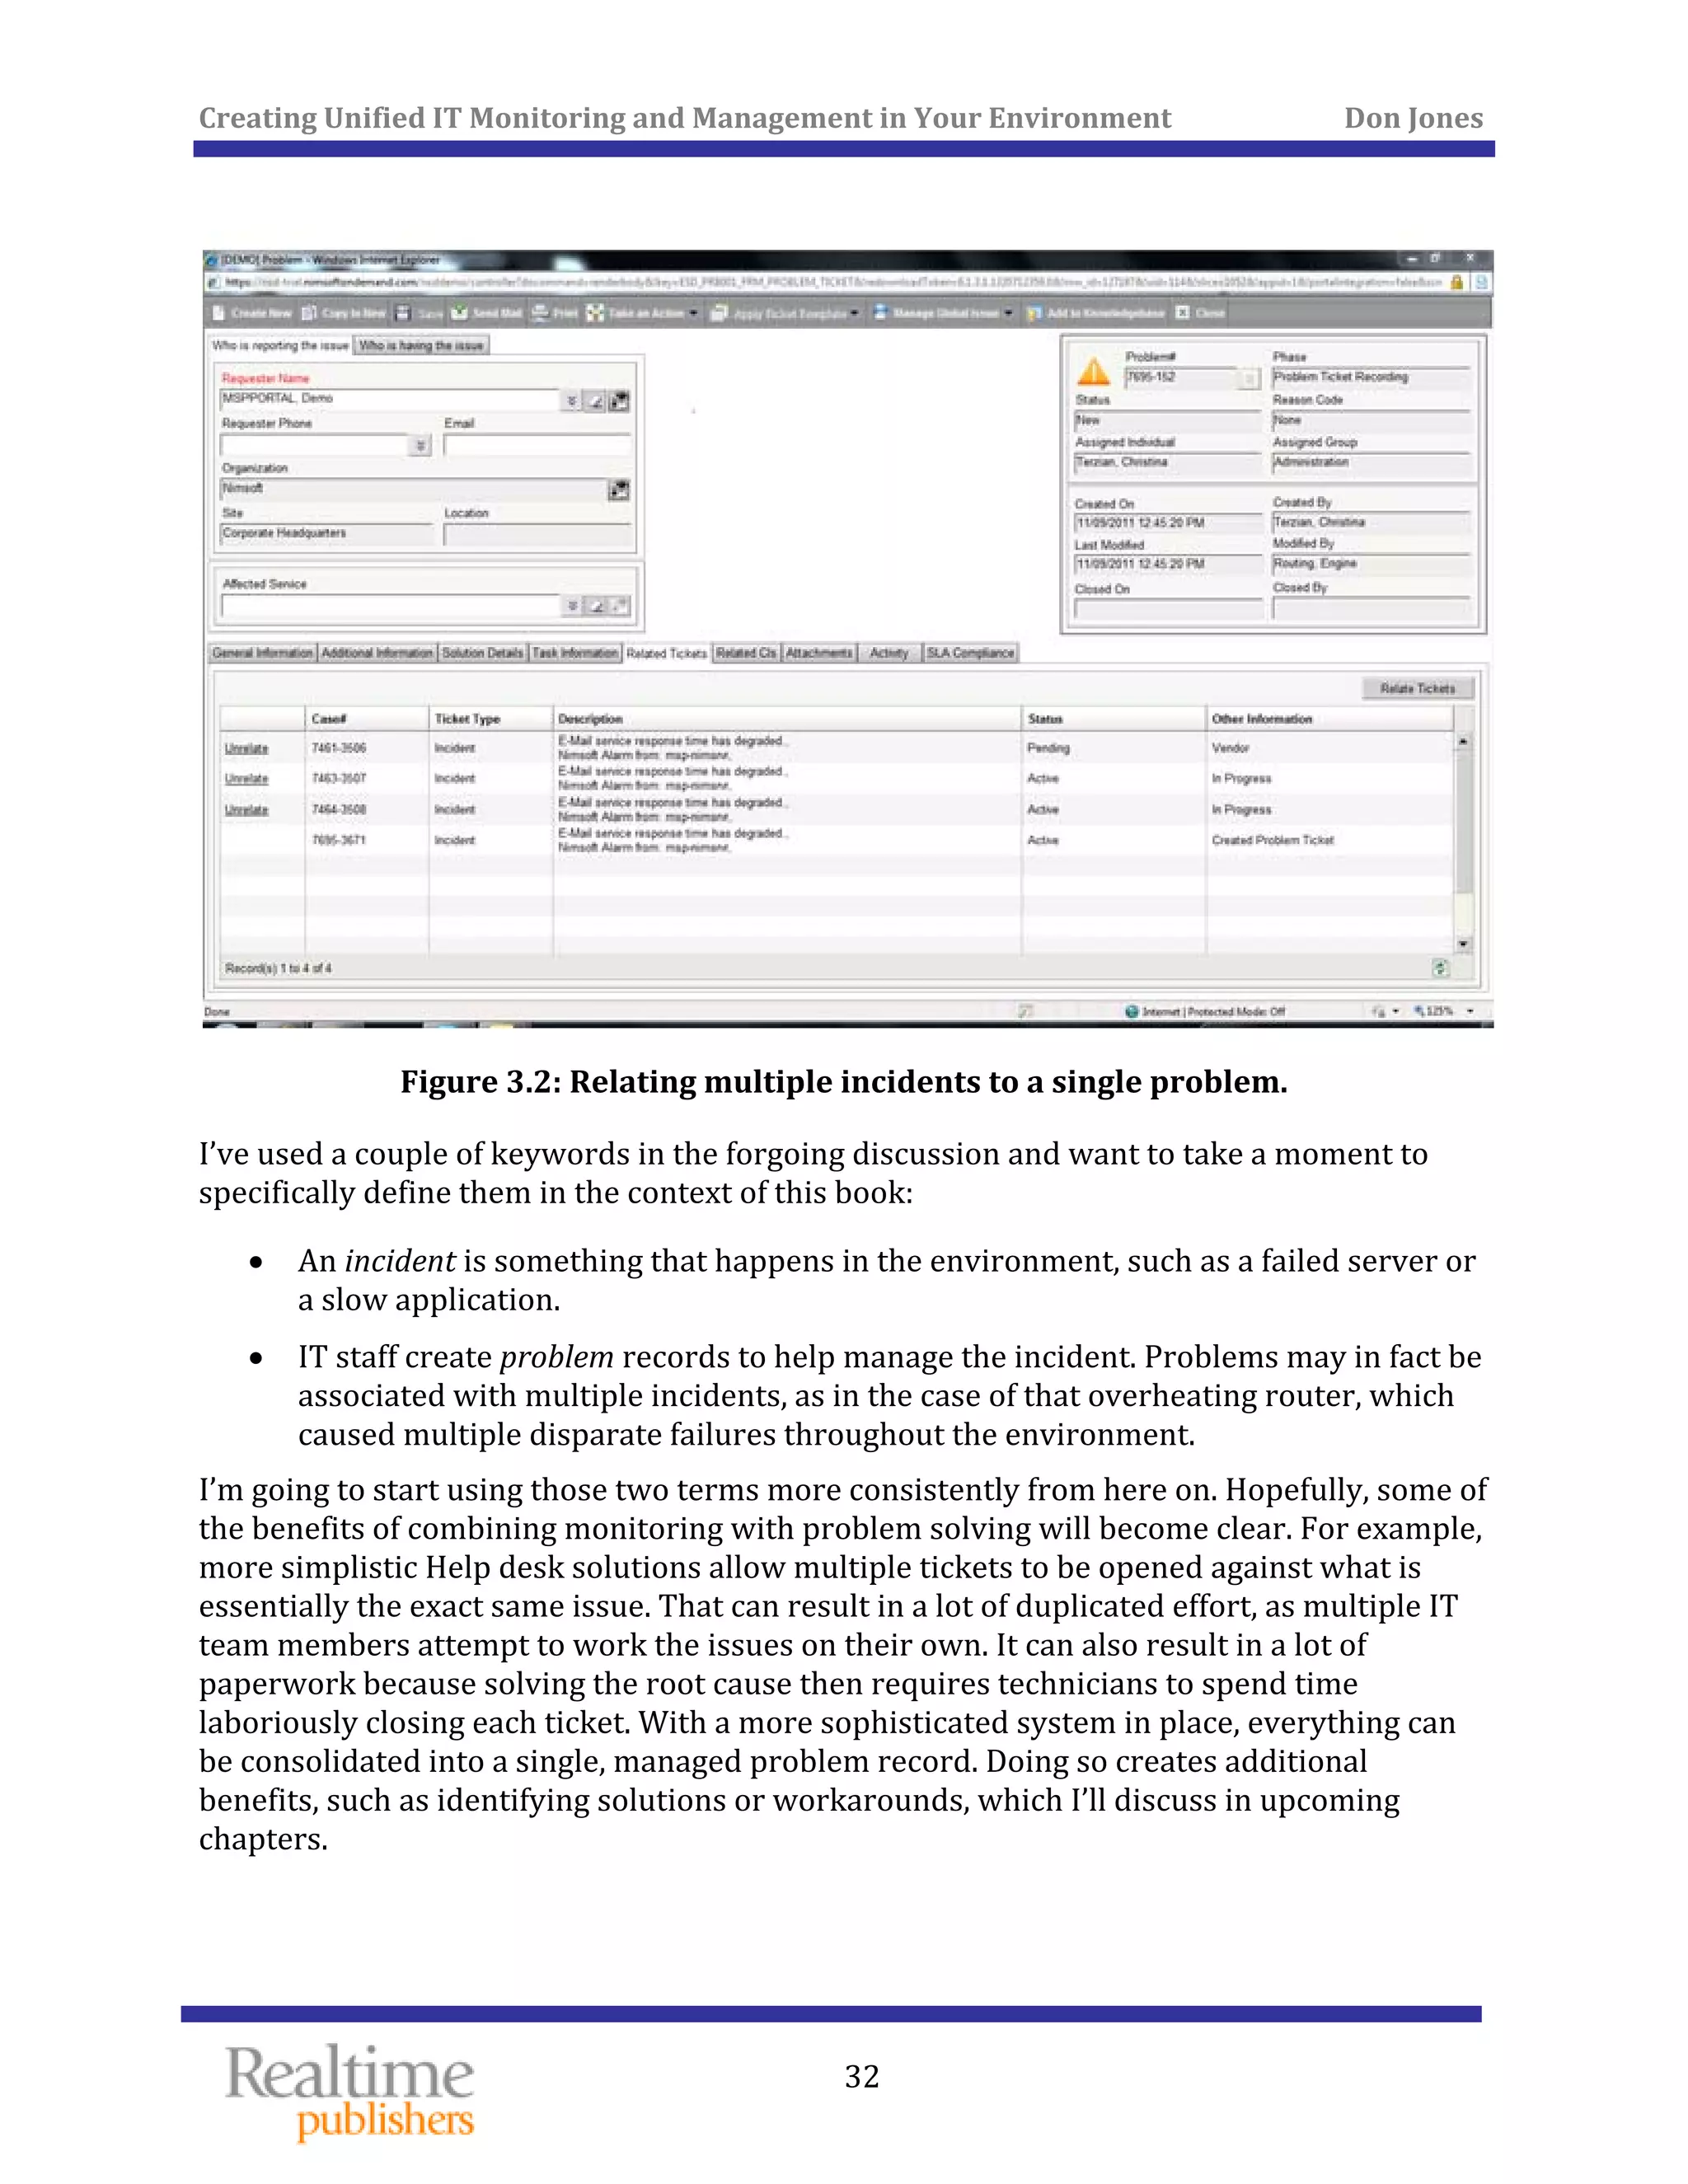
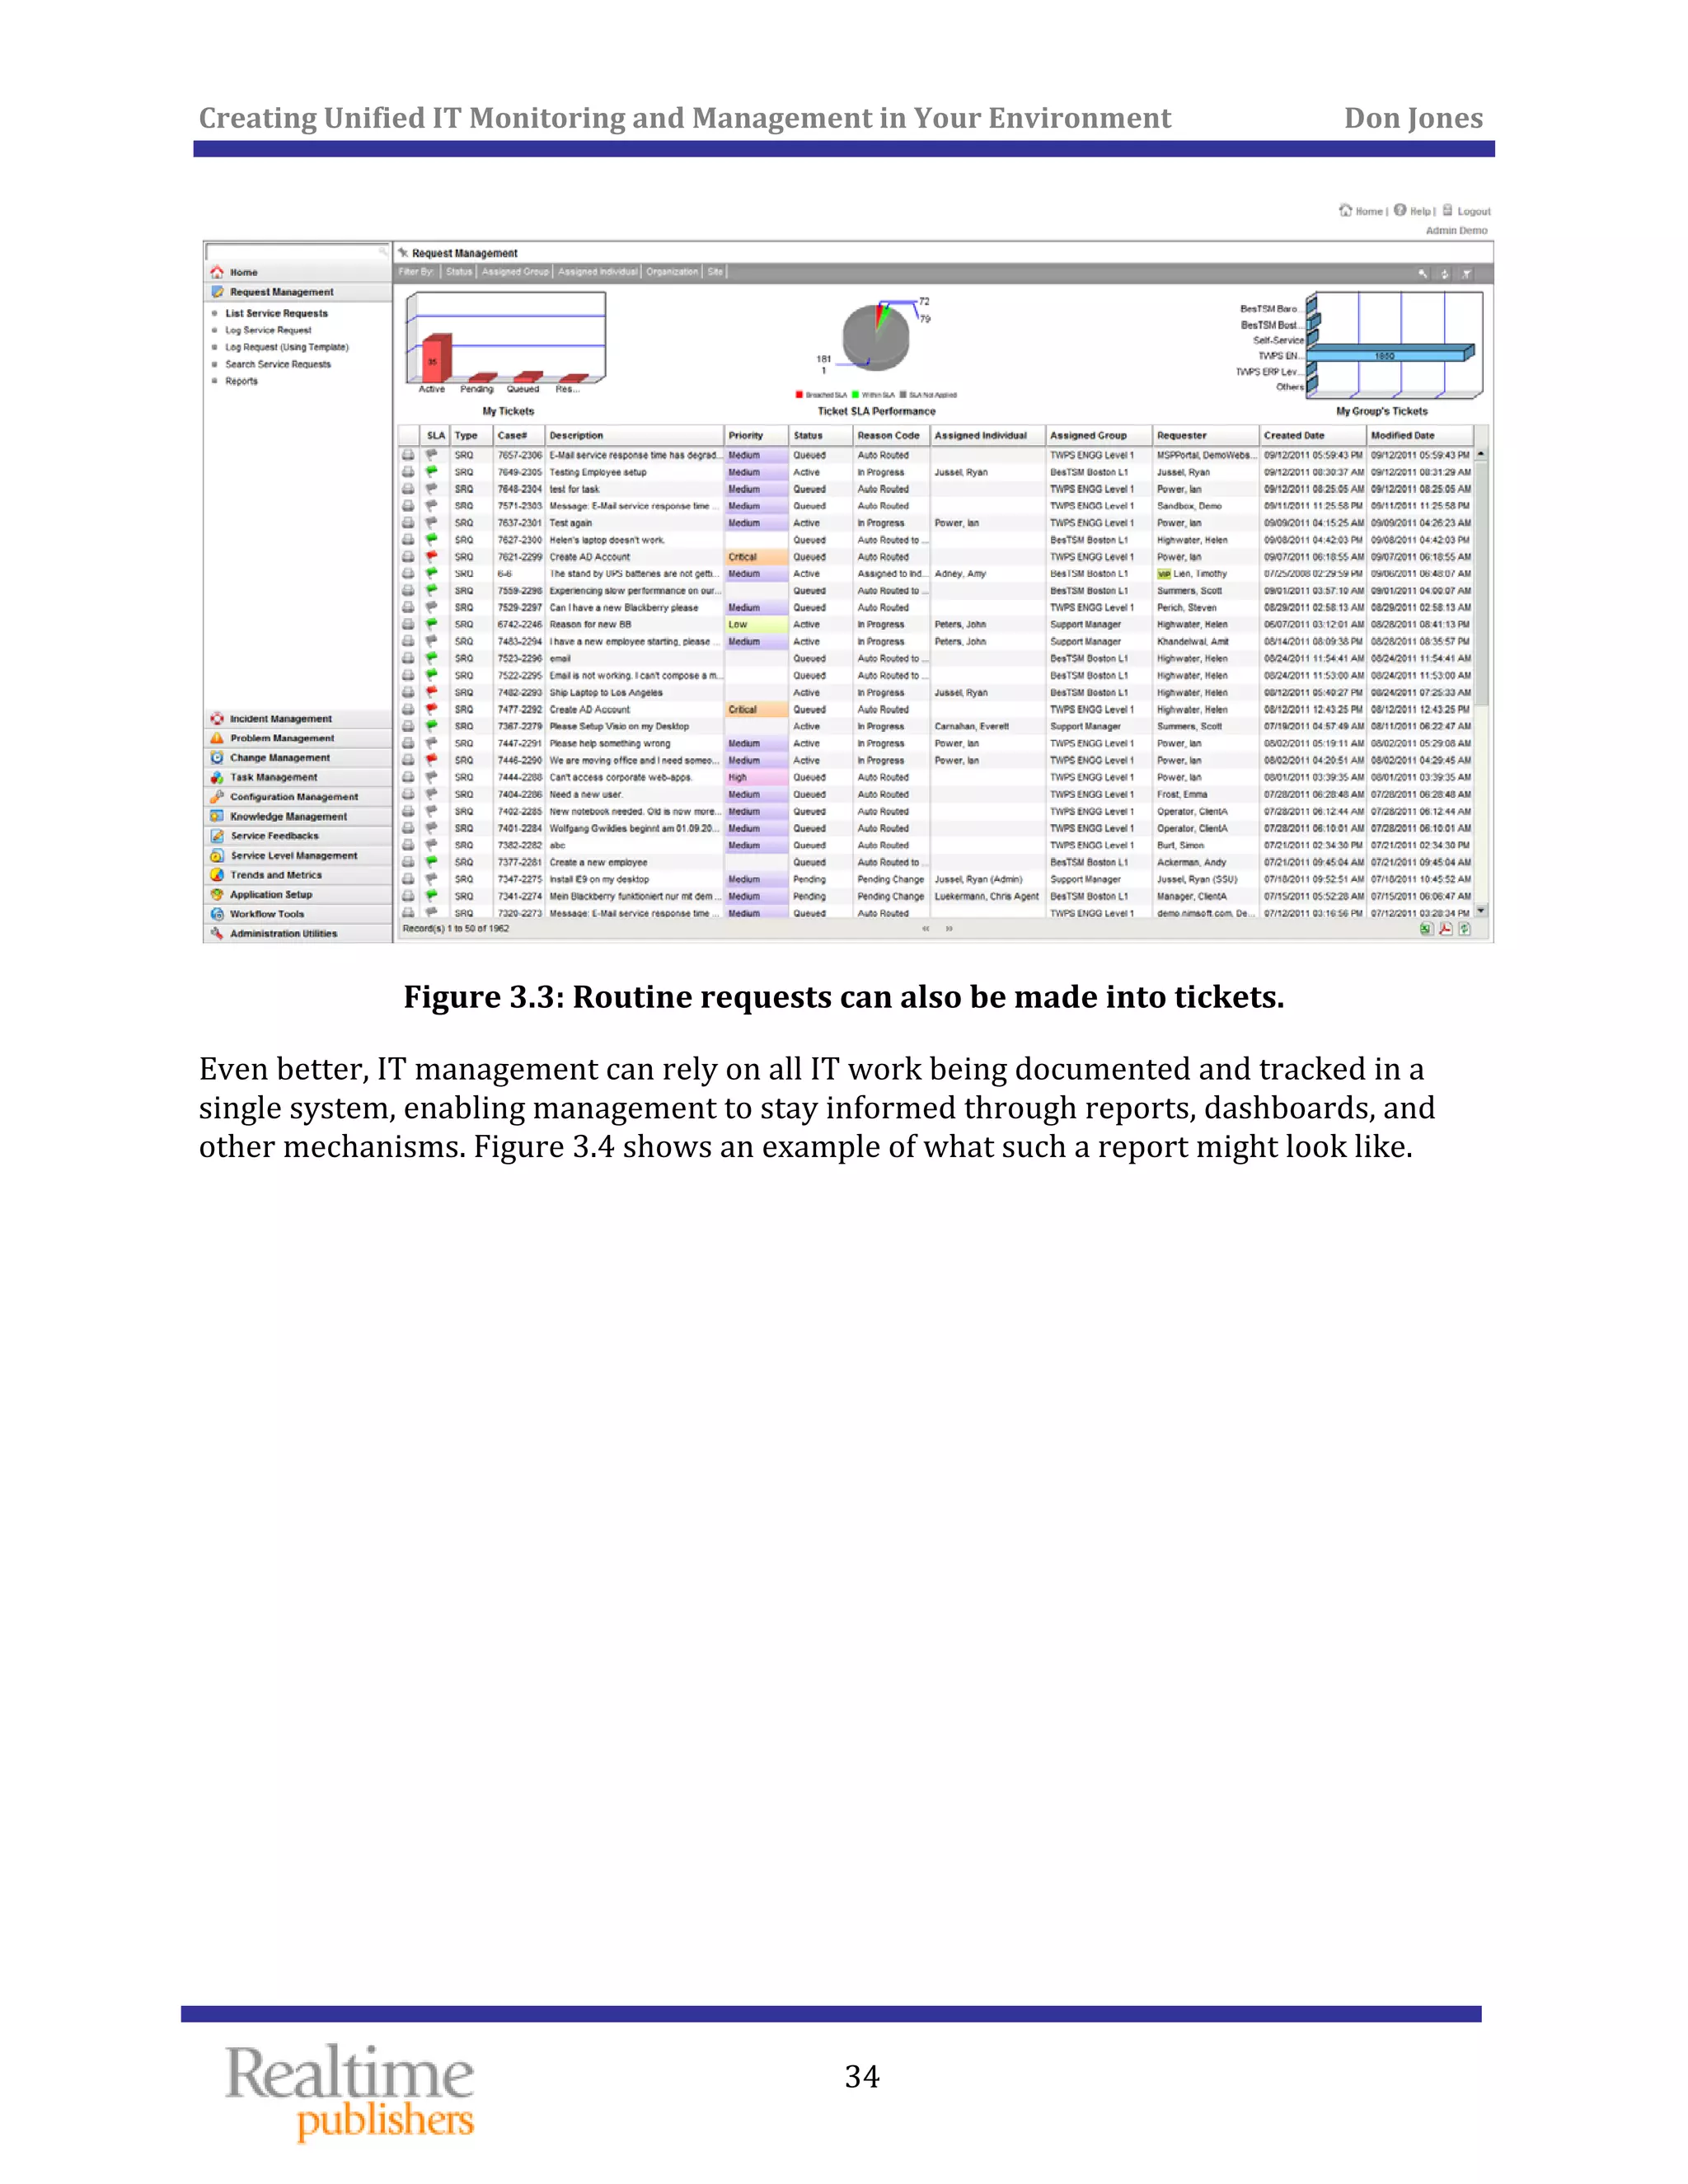
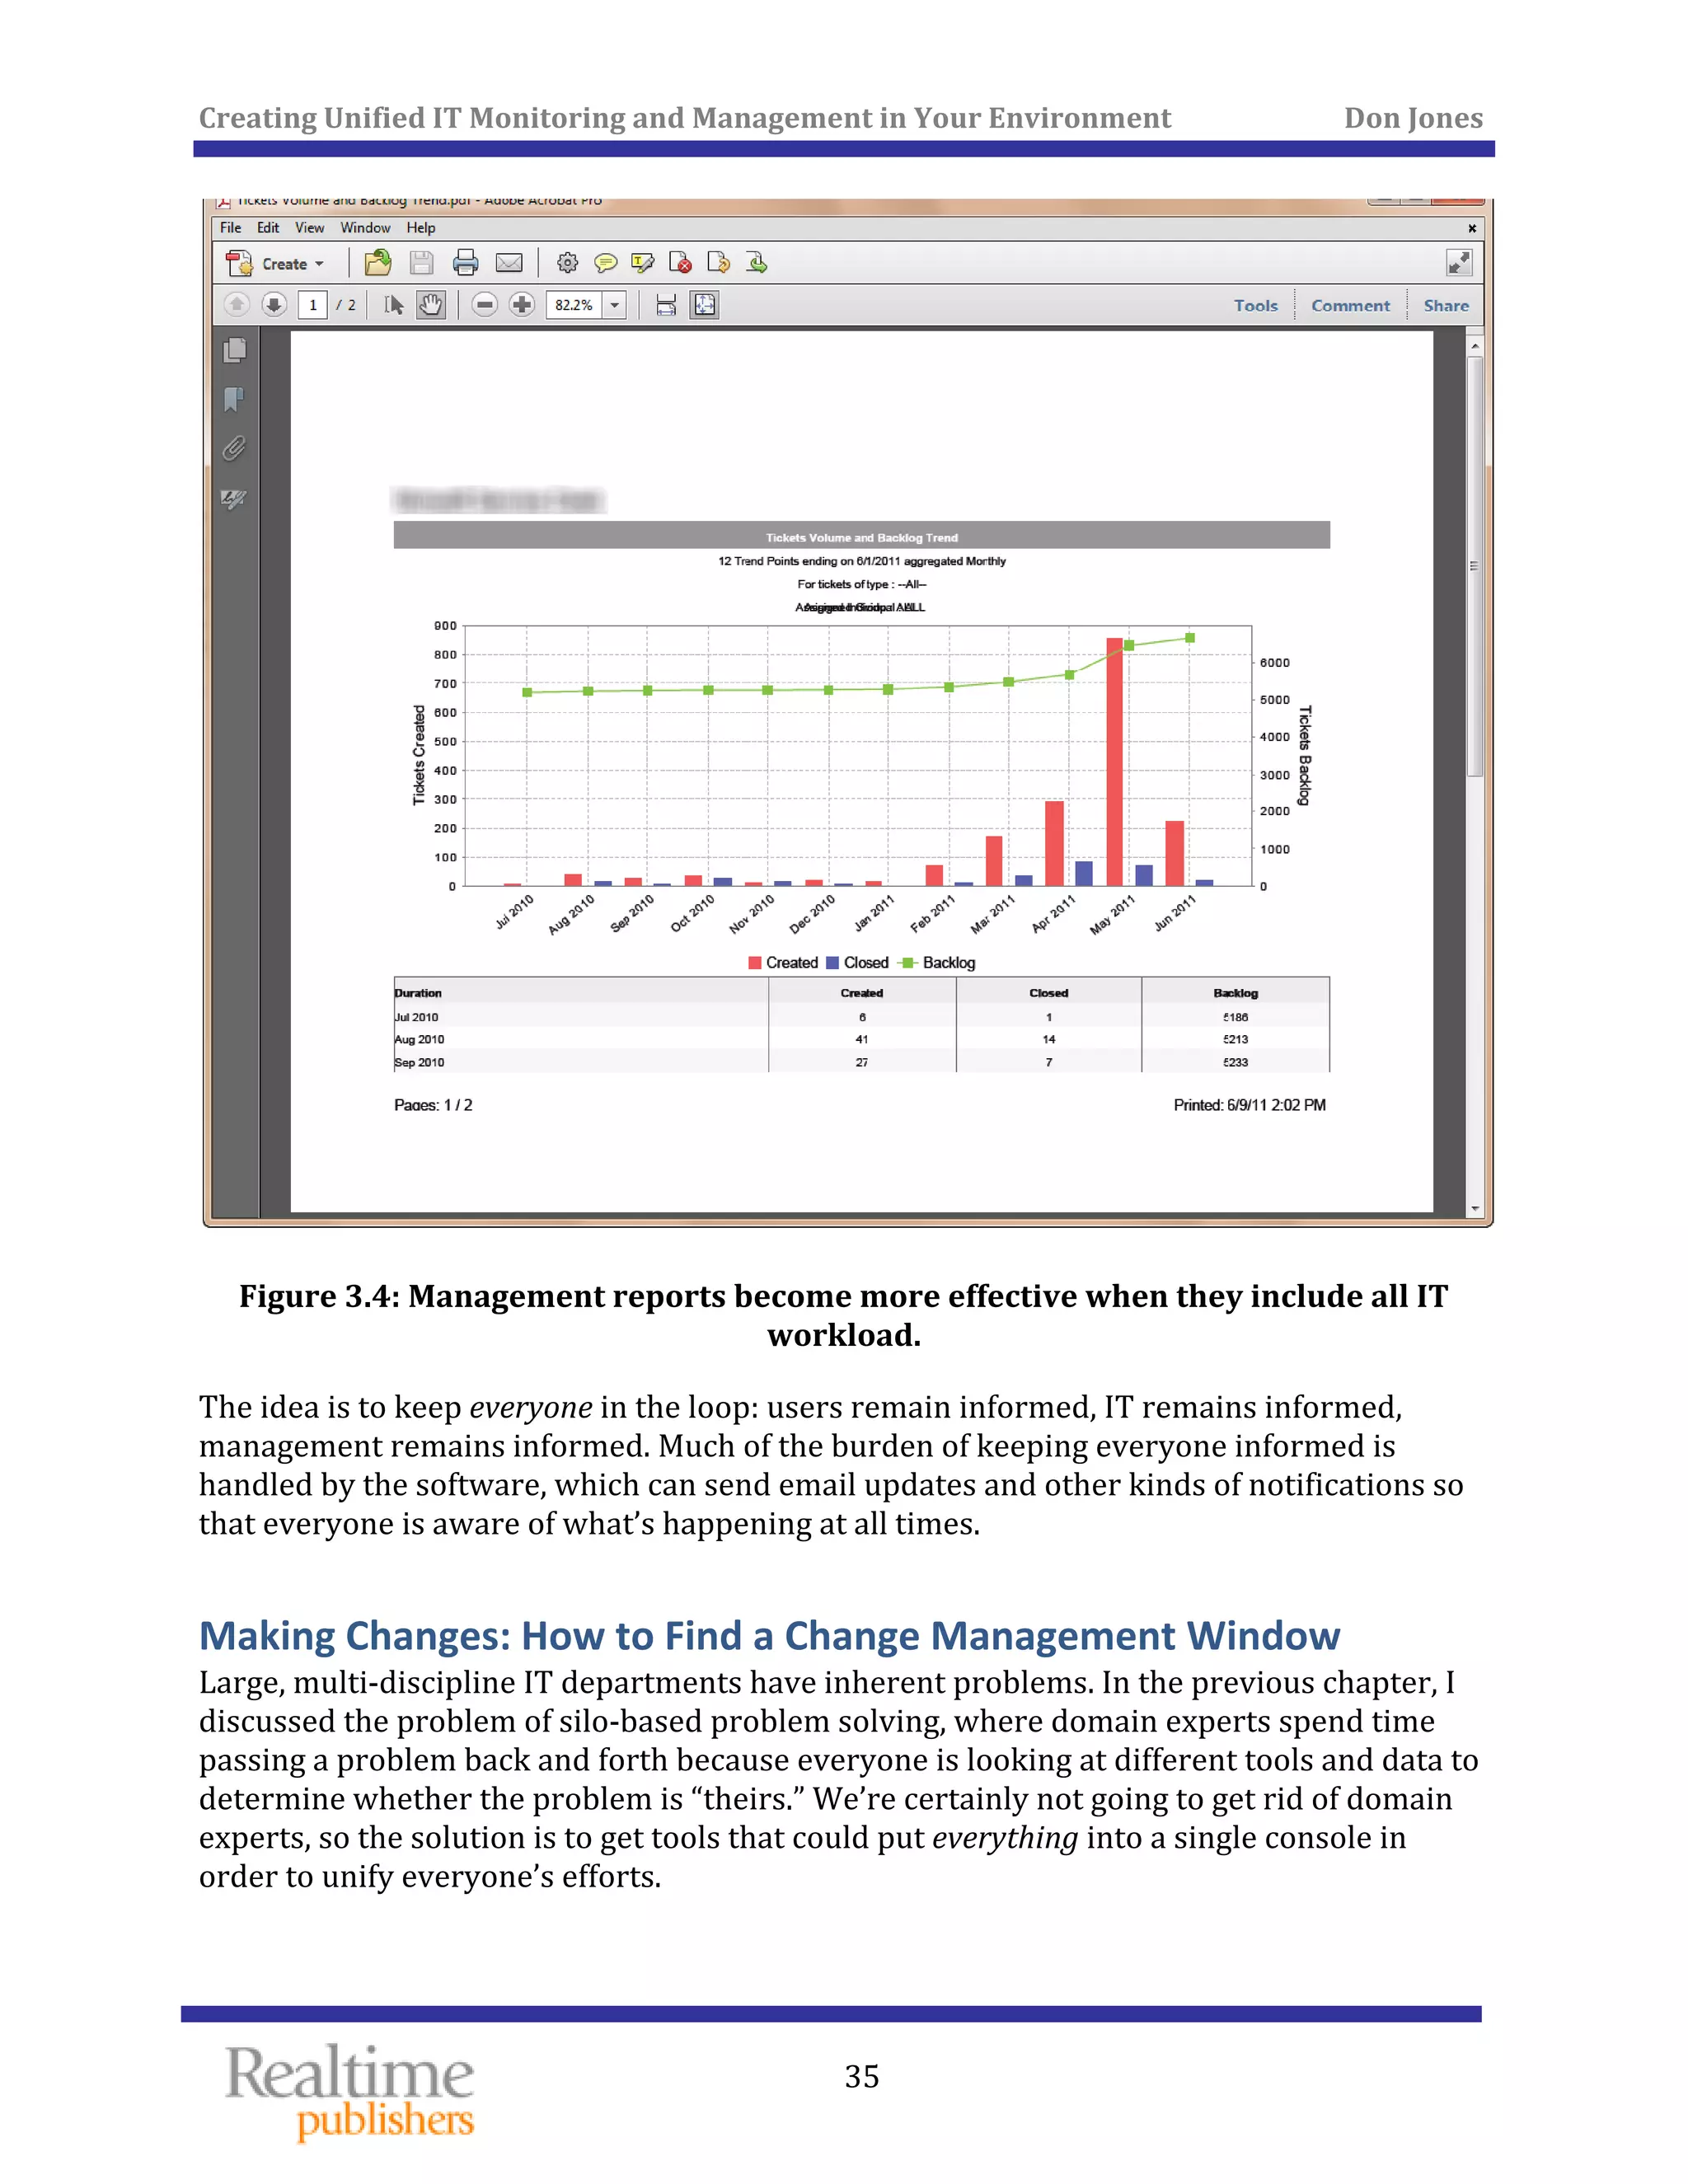
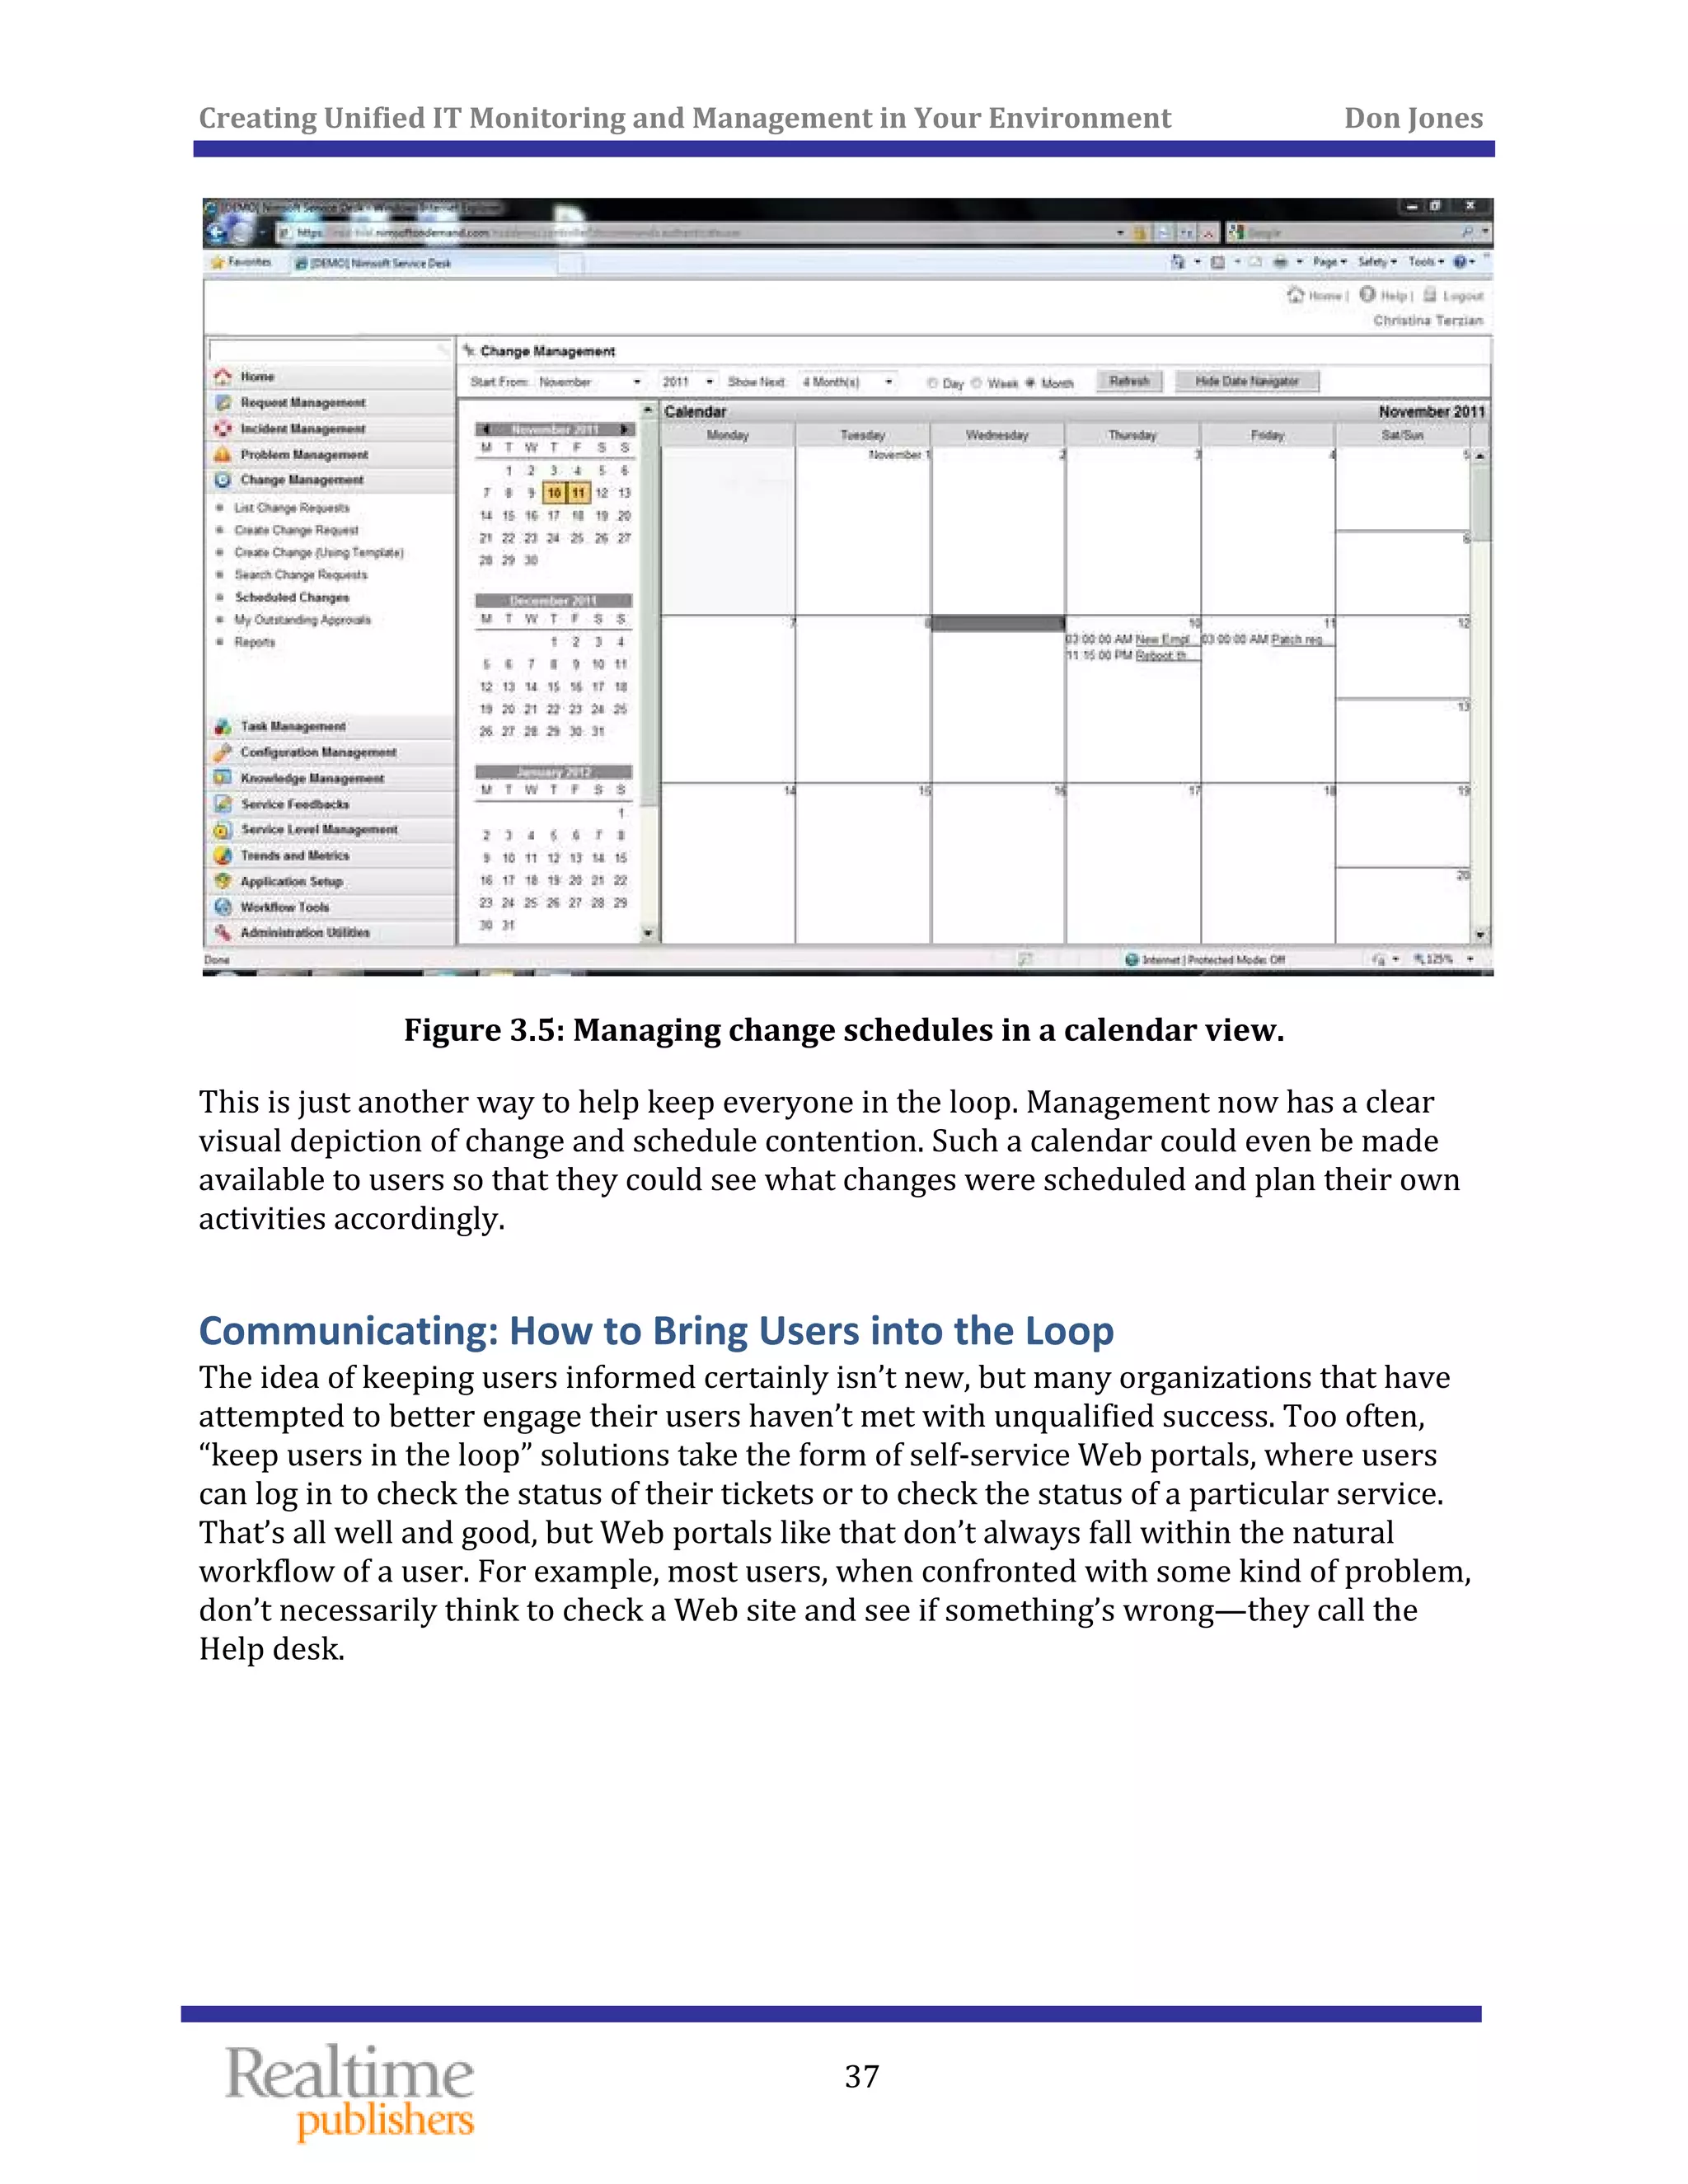
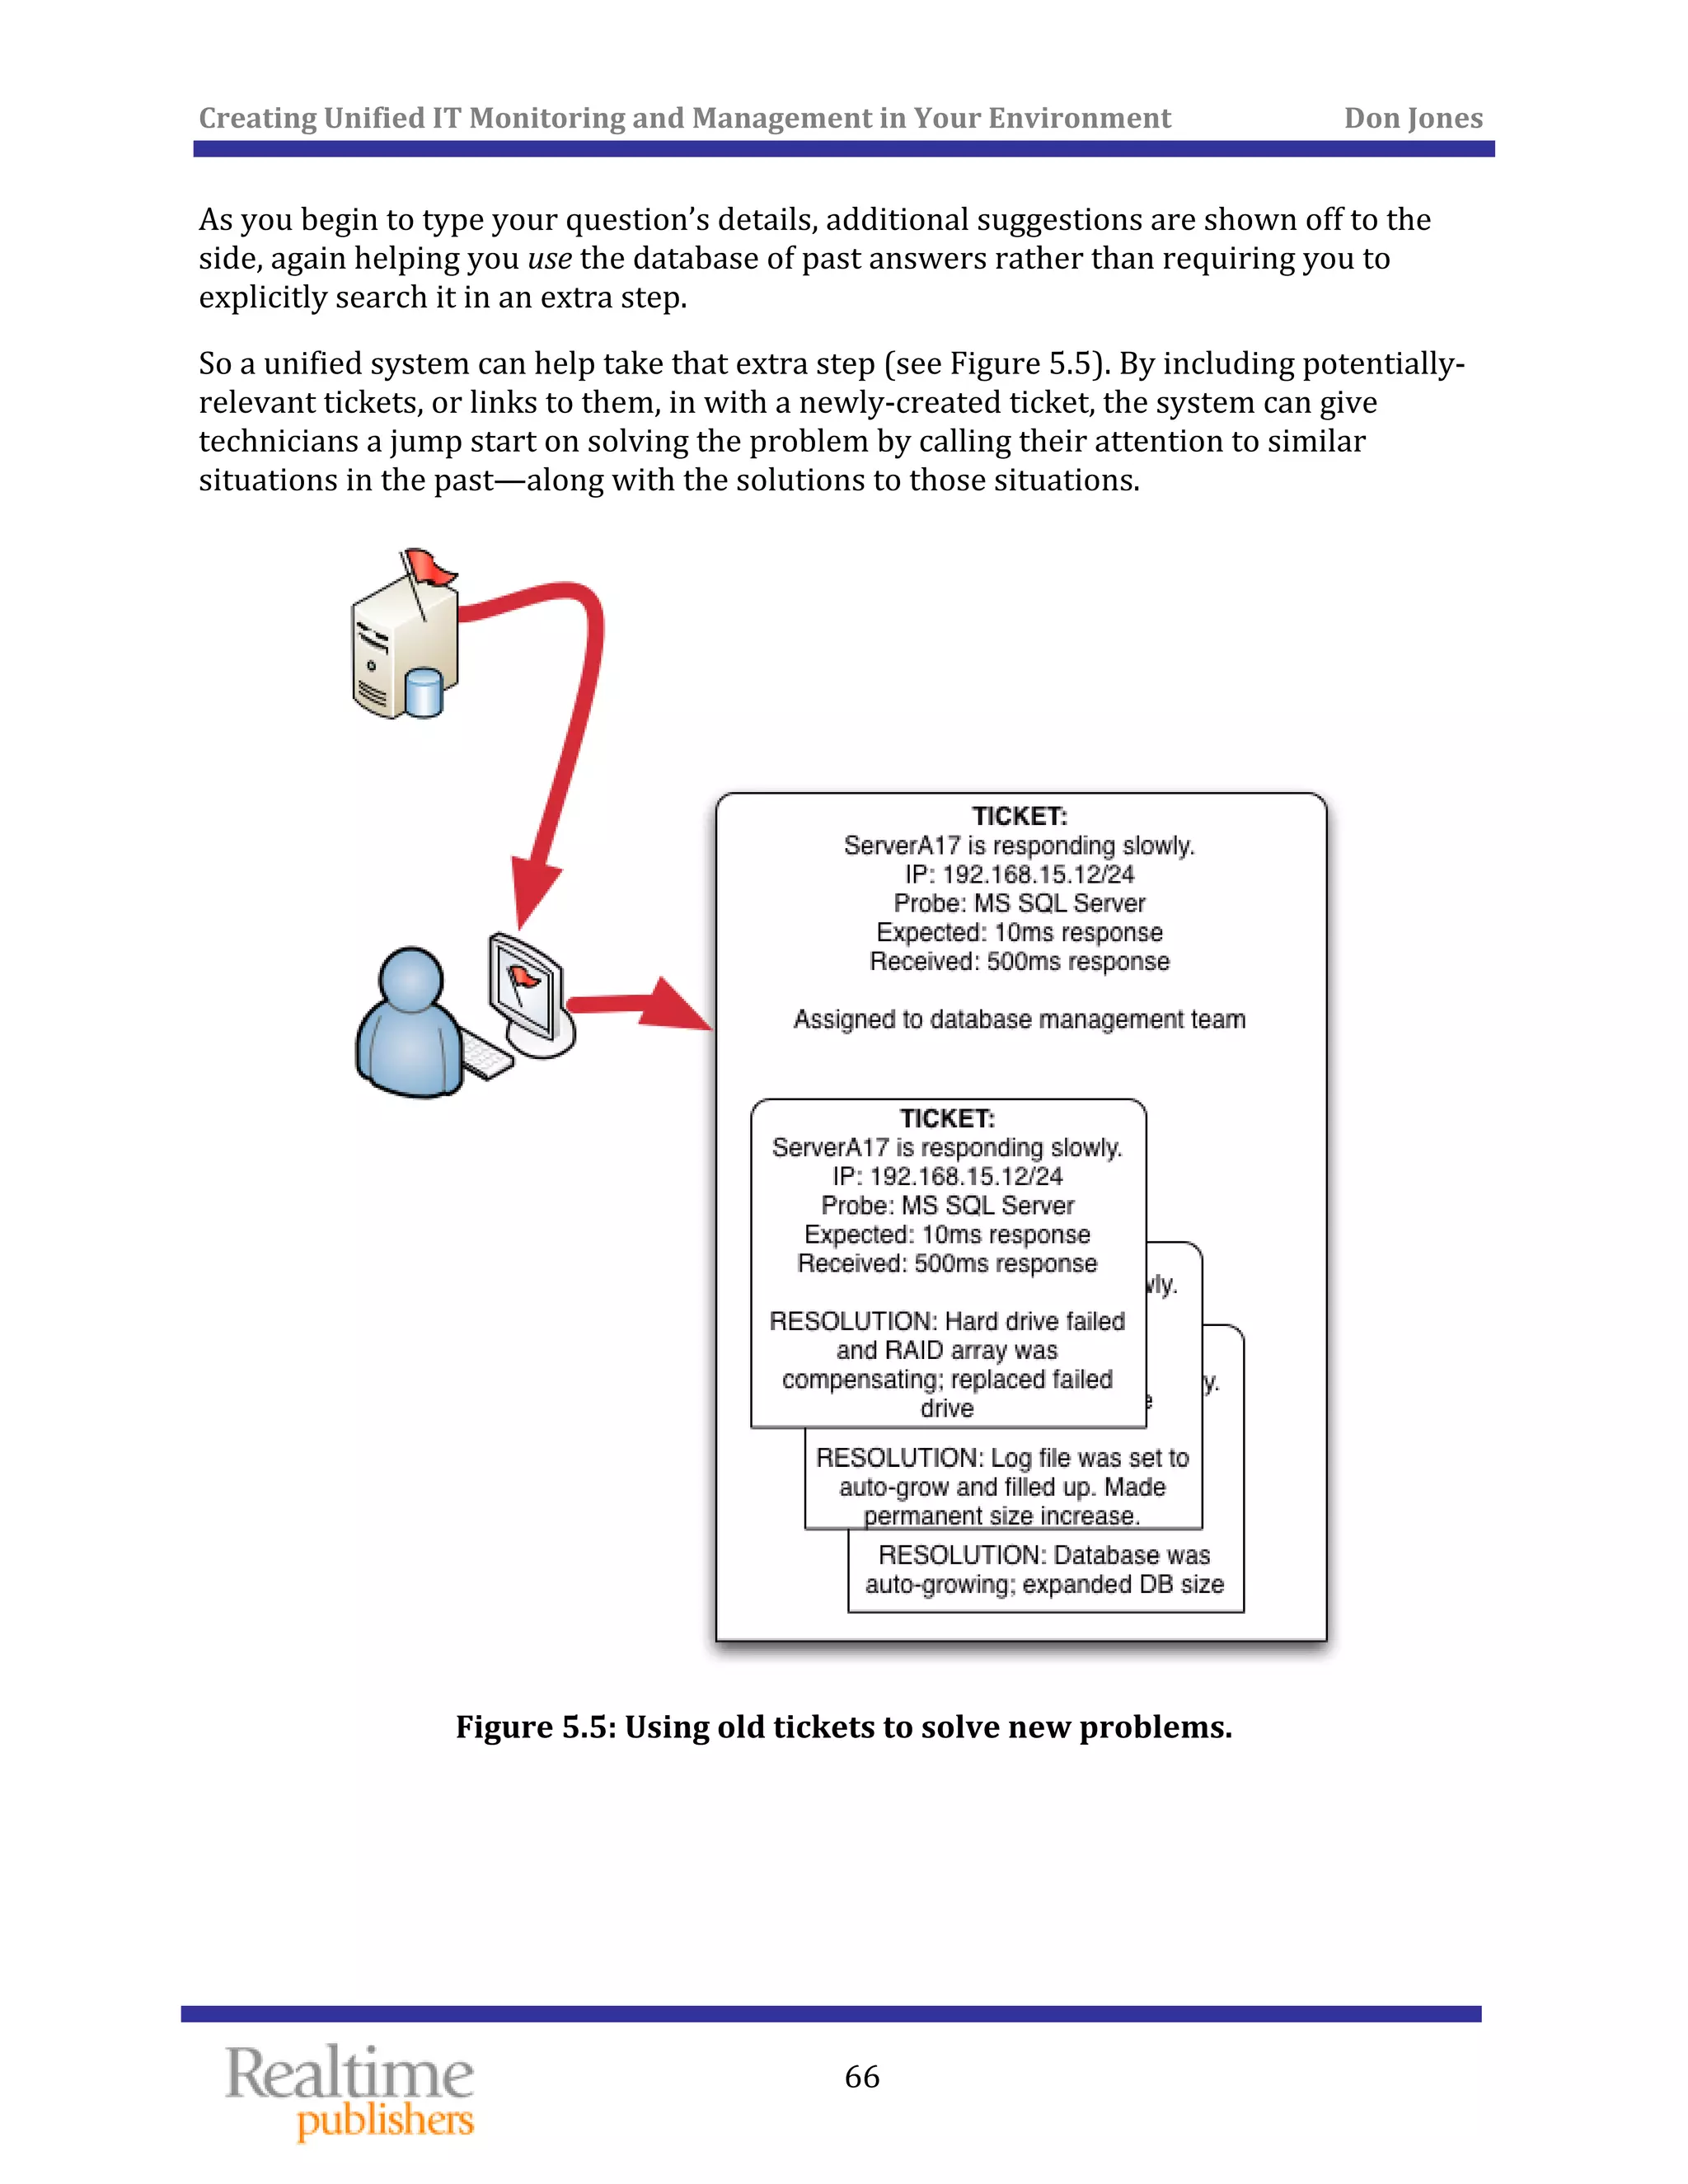
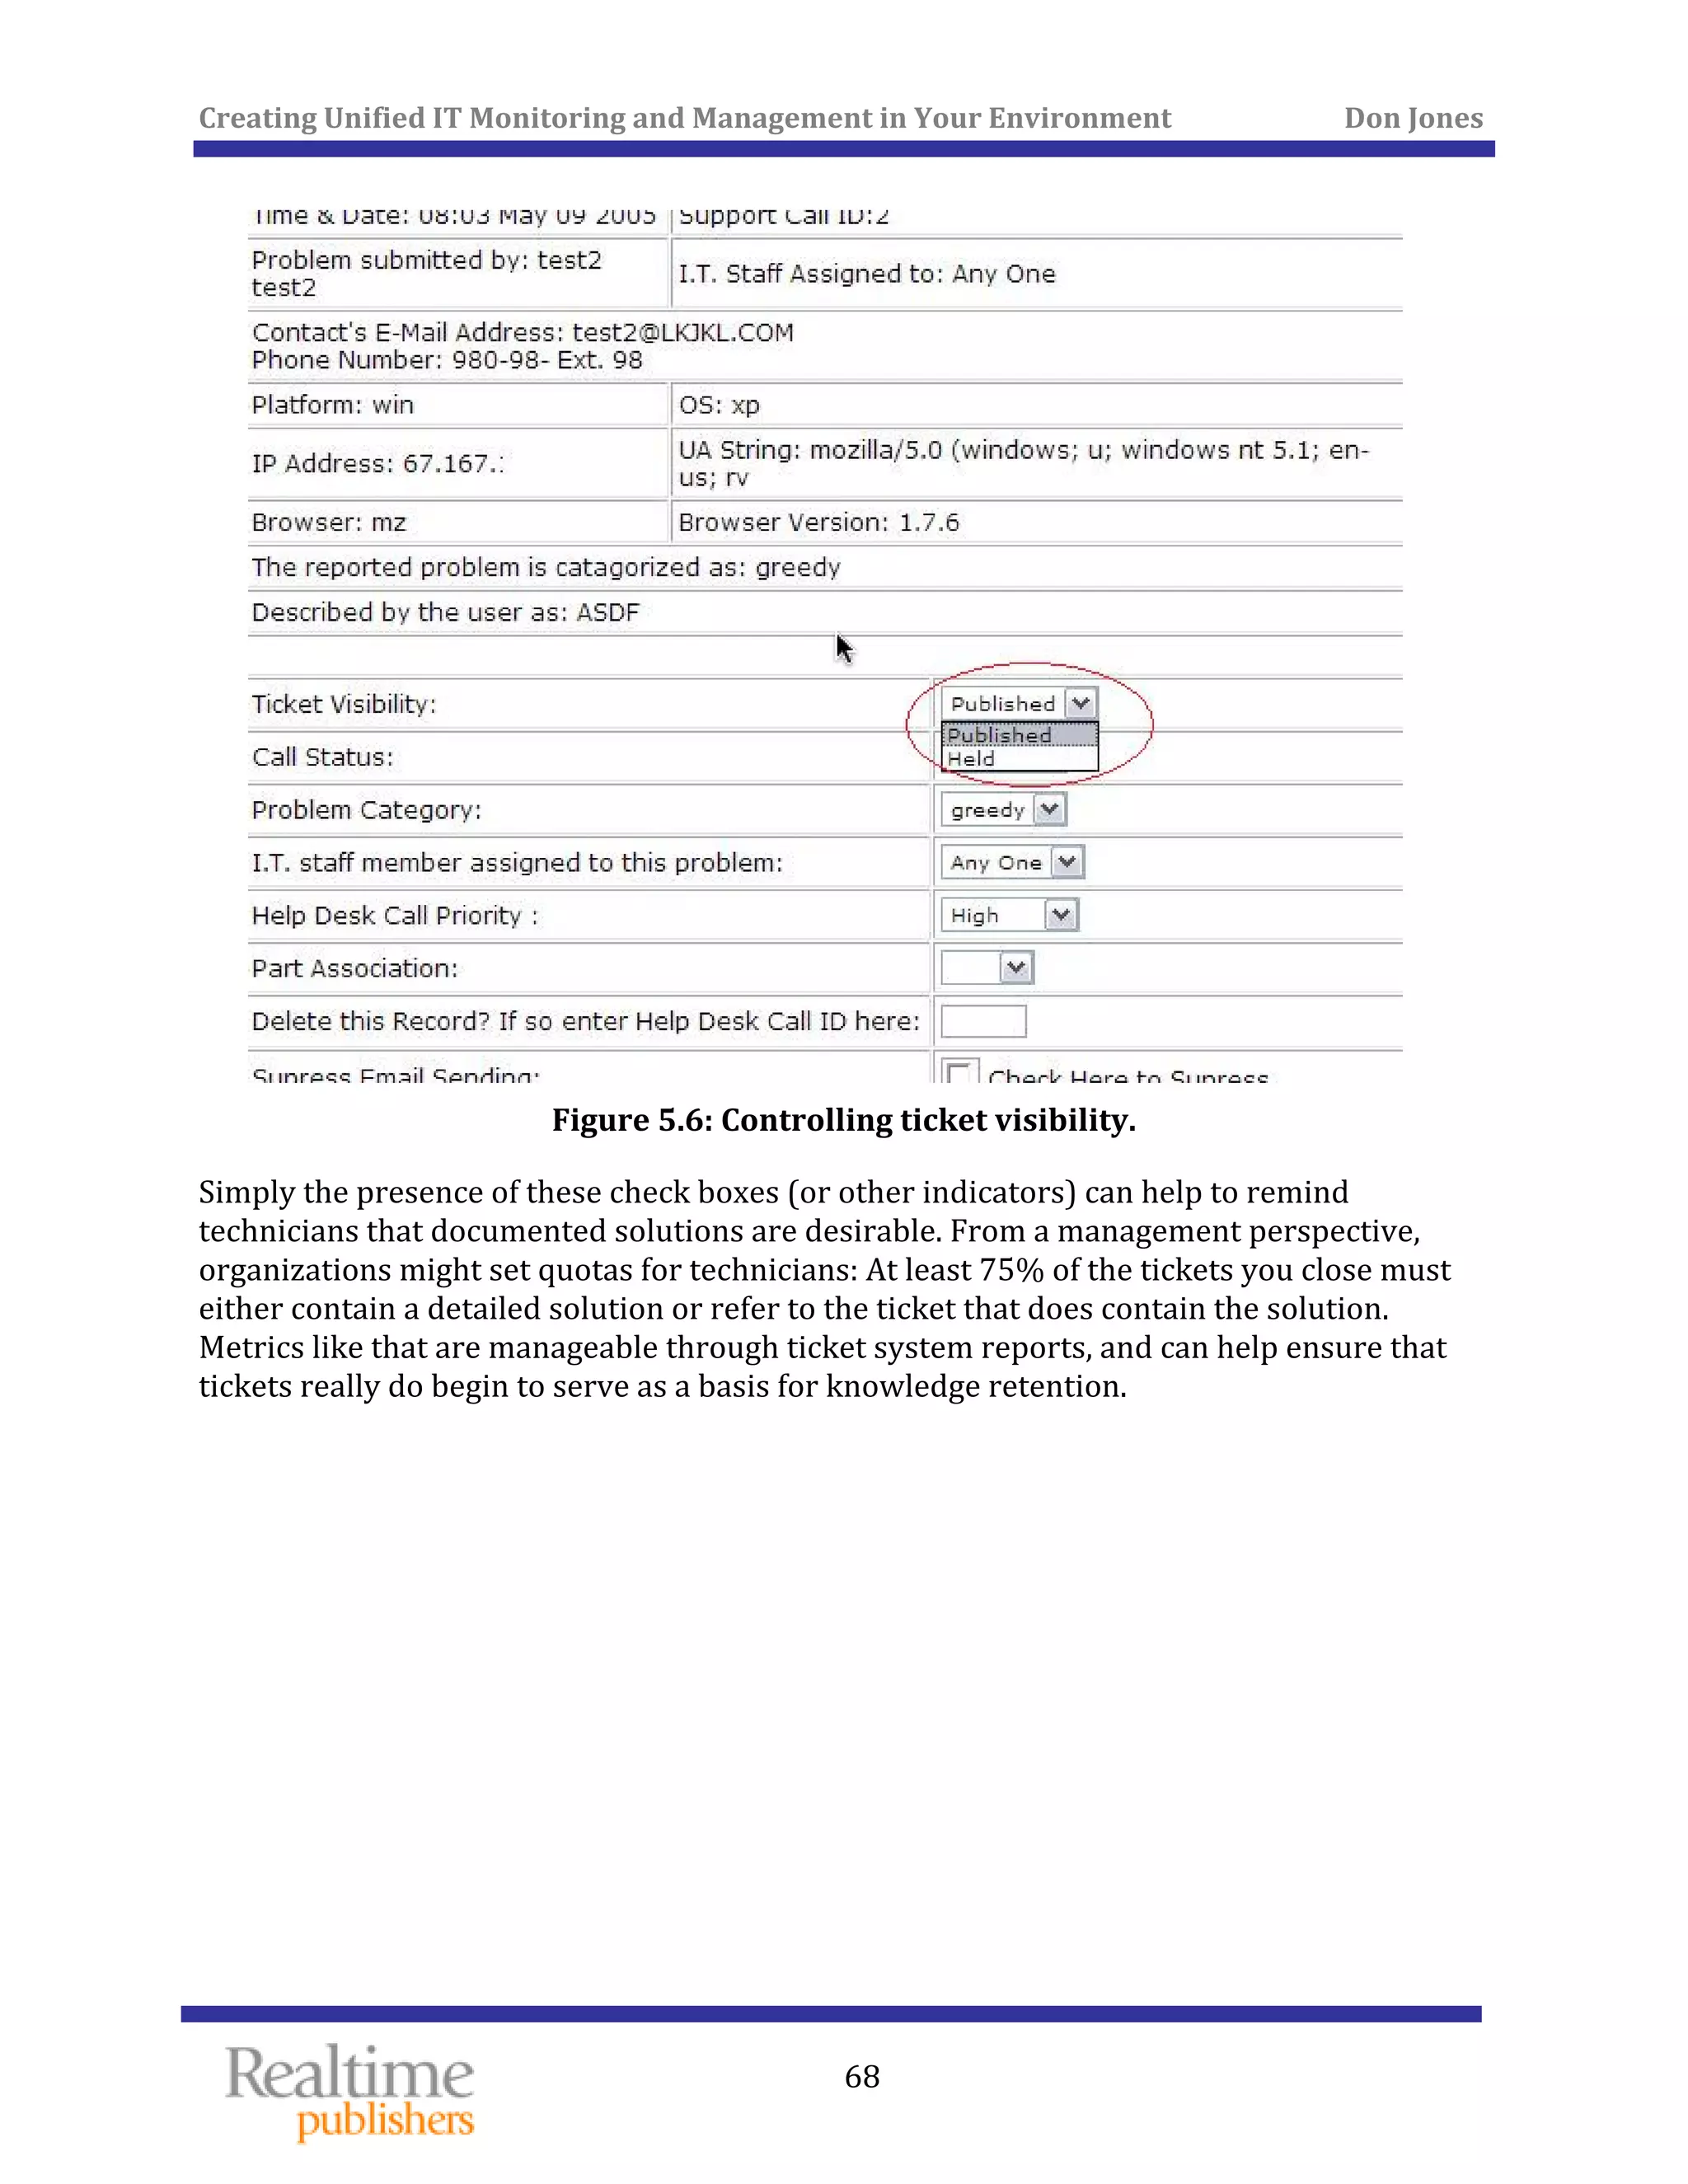
sponsored by
Creating Unified IT
Monitoring and
Management in
Your Environment
Don Jones
Creating Unified IT Monitoring and Management in Your Environment          Don Jones 
 
i
Introduction to Realtime Publishers 
by Don Jones, Series Editor
For several years now, Realtime has produced dozens and dozens of high‐quality books 
that just happen to be delivered in electronic format—at no cost to you, the reader. We’ve 
made this unique publishing model work through the generous support and cooperation of 
our sponsors, who agree to bear each book’s production expenses for the benefit of our 
readers. 
Although we’ve always offered our publications to you for free, don’t think for a moment 
that quality is anything less than our top priority. My job is to make sure that our books are 
as good as—and in most cases better than—any printed book that would cost you $40 or 
more. Our electronic publishing model offers several advantages over printed books: You 
receive chapters literally as fast as our authors produce them (hence the “realtime” aspect 
of our model), and we can update chapters to reflect the latest changes in technology. 
I want to point out that our books are by no means paid advertisements or white papers. 
We’re an independent publishing company, and an important aspect of my job is to make 
sure that our authors are free to voice their expertise and opinions without reservation or 
restriction. We maintain complete editorial control of our publications, and I’m proud that 
we’ve produced so many quality books over the past years. 
I want to extend an invitation to visit us at http://nexus.realtimepublishers.com, especially 
if you’ve received this publication from a friend or colleague. We have a wide variety of 
additional books on a range of topics, and you’re sure to find something that’s of interest to 
you—and it won’t cost you a thing. We hope you’ll continue to come to Realtime for your 
 far into the future. educational needs
enjoy. Until then, 
Don Jones 
 
Creating Unified IT Monitoring and Management in Your Environment          Don Jones 
  ii
 
Introduction to Realtime Publishers ................................................................................................................. i
Ch  
 
apter 1: Managing Your IT Environment: Four Things You’re Doing Wrong ........................... 1
 IT Management: How We Got to Where We Are Today ..................................................................... 1
 Problem 1: You’re Managing IT in Silos ..................................................................................................... 3
 Problem 2: You Aren’t Connecting Your Users, Service Desk, and IT Management ............... 6
 Problem 3:  You’re Measuring the Wrong Things ................................................................................. 8
 Problem 4: You’re Losing Knowledge ..................................................................................................... 12
 How Truly Unified Management Can Fix the Problems ................................................................... 13
 Summary .............................................................................................................................................................. 14
Ch  apter 2: Eliminating the Silos in IT Management ............................................................................... 16
 Too Many Tools Means Too Few Solutions ........................................................................................... 16
 Domain‐Specific Tools Don’t Facilitate Cooperation ........................................................................ 19
 The Cloud Question: Unifying On‐Premise and Off‐Premise Monitoring................................. 21
 Missing Pieces .................................................................................................................................................... 23
 Not All of IT Is a Problem: Ordering, Routing, and Providing Services ..................................... 27
 Coming Up Next… ............................................................................................................................................. 28
Ch  apter 3: Connecting Everyone to the IT Management Loop ........................................................... 29
 Starting the Loop: Connecting Monitoring to the Service Desk ................................................... 30
 Making Changes: How to Find a Change Management Window .................................................. 35
 Communicating: How to Bring Users into the Loop .......................................................................... 37
 SLAs: Setting and Meeting Realistic Expectations .............................................................................. 39
Thin  Tell Me What You Really  k ................................................................................................................... 41
 When Everyone Doesn’t Need to See Everything: A Multi‐Tenant Approach ........................ 42
 Call It a Private Management Cloud: Allocating Costs ...................................................................... 43
 Conclusion ........................................................................................................................................................... 44
 Coming Up Next… ............................................................................................................................................. 44
Ch  apter 4: Monitoring: Look Outside the Data Center .......................................................................... 45
Monitoring Technical Counters vs. the End‐User Experience ...................................................... 45 
Creating Unified IT Monitoring and Management in Your Environment          Don Jones 
 
  iii
How the EUE Drives Better SLAs ............................................................................................................... 46
 
 
How It’s Done: Synthetic Transactions, Transaction Tracking, and More ............................... 49
 Top‐Down Monitoring: From the EUE to the Root Problem ......................................................... 50
 Agent vs. Agentless Monitoring .................................................................................................................. 51
 Monitoring What Isn’t Yours ....................................................................................................................... 54
 Critical Capability: You Need to Monitor Everything ........................................................................ 57
 Conclusion ........................................................................................................................................................... 59
 Coming Up Next… ............................................................................................................................................. 59
Ch  apter 5: Turning Problems into Solutions ............................................................................................. 60
 Closing the Loop: Connecting the Service Desk to Monitoring ..................................................... 60
Re  taining Knowledge Means Faster Future Resolution .................................................................. 62
 Knowledge Bases ......................................................................................................................................... 63
 Tickets as Knowledge Base Articles .................................................................................................... 64
 Unifying the Knowledge Base ................................................................................................................. 65
 Making Tickets an Asset ........................................................................................................................... 69
Pa  st Performance Is an Indication of Future Results ........................................................................ 69
 It’s the Performance Database ............................................................................................................... 72
 Summary .............................................................................................................................................................. 73
 Coming Up Next… ............................................................................................................................................. 73
Ch  apter 6: Unified Management, Illustrated ............................................................................................. 74
Th  e Case Studies ............................................................................................................................................... 74
 Detecting and Solving Problems ........................................................................................................... 74
 Fulfilling User Orders ................................................................................................................................. 79
 A Shopping List for Unified IT Management ......................................................................................... 82
 Ways to Buy Your Unified IT ....................................................................................................................... 84
Conclusion ........................................................................................................................................................... 85 
 
Creating Unified IT Monitoring and Management in Your Environment          Don Jones 
 
iv
Copyright Statement
© 2012 Realtime Publishers. All rights reserved. This site contains materials that have
been created, developed, or commissioned by, and published with the permission of,
Realtime Publishers (the “Materials”) and this site and any such Materials are protected
by international copyright and trademark laws.
THE MATERIALS ARE PROVIDED “AS IS” WITHOUT WARRANTY OF ANY KIND,
EITHER EXPRESS OR IMPLIED, INCLUDING BUT NOT LIMITED TO, THE IMPLIED
WARRANTIES OF MERCHANTABILITY, FITNESS FOR A PARTICULAR PURPOSE,
TITLE AND NON-INFRINGEMENT. The Materials are subject to change without notice
and do not represent a commitment on the part of Realtime Publishers its web site
sponsors. In no event shall Realtime Publishers or its web site sponsors be held liable for
technical or editorial errors or omissions contained in the Materials, including without
limitation, for any direct, indirect, incidental, special, exemplary or consequential
damages whatsoever resulting from the use of any information contained in the Materials.
The Materials (including but not limited to the text, images, audio, and/or video) may not
be copied, reproduced, republished, uploaded, posted, transmitted, or distributed in any
way, in whole or in part, except that one copy may be downloaded for your personal, non-
commercial use on a single computer. In connection with such use, you may not modify
or obscure any copyright or other proprietary notice.
The Materials may contain trademarks, services marks and logos that are the property of
third parties. You are not permitted to use these trademarks, services marks or logos
without prior written consent of such third parties.
Realtime Publishers and the Realtime Publishers logo are registered in the US Patent &
Trademark Office. All other product or service names are the property of their respective
owners.
If you have any questions about these terms, or if you would like information about
licensing materials from Realtime Publishers, please contact us via e-mail at
info@realtimepublishers.com.
 
Creating Unified IT Monitoring and Management in Your Environment          Don Jones 
 
1
Chapter 1: Managing Your IT Environment: 
Four Things You’re Doing Wrong 
At the very start of the IT industry, “monitoring” meant having a guy wander around inside 
the mainframe looking for burnt‐out vacuum tubes. There wasn’t really a way to locate the 
tubes that were working a bit harder than they were designed for, so monitoring—such as 
it was—was an entirely reactive affair. 
In those days, the “Help desk” was probably that same guy answering the phone when one 
of the other dozen or so “computer people” needed a hand feeding punch cards into a 
hopper, tracking down a burnt‐out tube, and so on. The concepts of tickets, knowledge 
bases, service level agreements (SLAs), and so forth hadn’t yet been invented. 
IT management has certainly evolved since those days, but it unfortunately hasn’t evolved 
as much as it could or should have. Our tools have definitely become more complex and 
more mature, but the way in which we use those tools—our IT management processes—
are in some ways still stuck in the days of reactive tube‐changing. 
Some of the philosophies that underpin many organizations’ IT management practices are 
really becoming a detriment to the organizations that IT is meant to support. The 
discussion in this chapter will revolve around several core themes, which will continue to 
drive the subsequent chapters in this book. The goal will be to help change your thinking 
about how IT management—particularly monitoring—should work, what value it should 
provide to your organization, and how you should go about building a better‐managed IT 
environment. 
IT Management: How We Got to Where We Are Today 
In the earliest days of IT, we dealt with fairly straightforward systems. Even simplistic, by 
today’s standards. The IT team often consisted of people who could fix any of the problems 
that arose, simply because there weren’t all that many “moving parts.” It’s as if IT was a car: 
A machine capable of complexity and of doing many different things, but perfectly 
 comprehendible, in its entirety, by a single human being.
   
 
Creating Unified IT Monitoring and Management in Your Environment          Don Jones 
  2
 
As we started to evolve that IT car into a space shuttle, we gradually needed to allow for 
specialization. Individual systems became so complex in and of themselves that we needed 
domain‐specific experts to be able to monitor, maintain, and manage each system. 
Messaging systems. Databases. Infrastructure components. Directory services. The vendors 
who produced these systems, along with third parties, developed tools to help our experts 
monitor and manage each system. That’s really where things went wrong. It seemed 
perfectly sensible at the time, and indeed there was probably no other way to have done 
things, but that establishment of domain‐specific silos—each with their own tools, their 
own procedures, and their own expertise—was the seed for what would become a 
towering problem inside many IT shops. 
Fast forward to today, when our systems are vastly more complex, vastly interconnected, 
and increasingly not even hosted within our own data centers. When a user encounters a 
problem, they obviously can’t tell us which of our many complex systems is at fault. They 
simply tell us what they observe and experience about the problem, which may be the 
aggregate result of several systems’ interactions and interdependencies. Our users see a 
holistic environment: “IT.” That doesn’t correspond well to what we see on the back end: 
databases, servers, directories, files, networks, and more. As a result, we often spend a lot 
of time trying to track down the root cause of problems. Worse, we often don’t even see the 
problems coming, because the problems only exist when you look at the end result of the 
entire environment rather than at individual subsystems. Users feel completely 
disconnected from the process, shielded from IT by a sometimes‐helpful‐sometimes‐not 
“Help desk.” IT management has a difficult time wrapping their heads around things like 
performance, availability, and so on, simply because they’re forced to use metrics that are 
specific to each system on the network rather than look at the environment as a whole. 
The way we’ve built out our IT organizations has led to very specific business‐level issues, 
which have become common concerns and complaints throughout the world: 
• IT has difficulty defining and meeting business‐level SLAs. “The messaging server 
will be up 99% of the time” isn’t a business‐level SLA; it’s a technical one. “Email will 
flow between internal and external users 99% of the time” is a business‐level SLA, 
but it can be difficult to measure because that statement involves significantly more 
systems than just the email server. 
• IT has difficulty proactively predicting problems based on system health, and 
remains largely reactive to problems. 
• When problems occur, IT often spends far too much time pinpointing the root cause 
of the problem. 
• IT’s concept of performance and system health is driven by systems—database 
servers, directory services, network devices, and so forth—rather than by how users 
and the organization as a whole are experiencing the services delivered by those 
systems. 
 
Creating Unified IT Monitoring and Management in Your Environment          Don Jones 
  3
 
• IT has a tough time rapidly adopting new technologies that can benefit the business. 
Oxymoronically, IT is often the part of the organization most opposed to change, 
because change is usually the trigger for problems. Broken systems don’t help 
anyone, but an inability to quickly incorporate changes can also be a detriment to 
the organization’s competitiveness and flexibility. 
• IT has a really tough time adopting new technologies that are significantly outside 
the team’s experience or physical reach—most specifically the bevy of outsourced 
offerings commonly grouped under the term “cloud computing.” These technologies 
and approaches to technology are so different from what’s come before that IT 
doesn’t feel confident that they can monitor and manage these new systems. Thus, 
they resist implementing these types of systems for fear that doing so will simply 
damage the organization. 
• Even with modern self‐service Help desk systems, users feel incredibly powerless 
and out of touch when it comes to IT. 
All of these business‐level problems are the direct result of how we’ve always managed IT. 
Our processes for monitoring and managing IT basically have four core problems. Not 
every organization has every single one of these, of course, and most organizations are at 
least aware of some of these and work hard to correct them. Ultimately, however, 
organizations need to ensure that all four of these core problems are addressed. Doing so 
will immediately begin to resolve the business‐level issues I’ve outlined. 
Problem 1: You’re Managing IT in Silos 
Figures 1.1, 1.2, and 1.3 illustrate one of the fundamental problems in IT monitoring and 
management today. 
 
Figure 1.1: Windows Performance Monitor. 
Creating Unified IT Monitoring and Management in Your Environment          Don Jones 
 
4
 
Figure 1.2: SQL Server Performance. 
 
 
Figure 1.3: Router Performance. 
These figures each illustrate a different performance chart for various components of an IT 
system. Each of these images was produced using a tool that is more or less specialized for 
the exact thing that was being monitored. The tool that produced the router performance 
chart, for example, can’t produce the same chart for a database server or even for a router 
that’s located on someone else’s network. 
   
 
Creating Unified IT Monitoring and Management in Your Environment          Don Jones 
  5
 
This is such a core, fundamental problem that many IT experts can’t even recognize that it 
is a problem. Using these domain‐specific tools is such an integrated and seemingly natural 
part of how IT works that many of us simply can’t imagine a different way. But we need to 
move past using these domain‐specific tools as our first line of defense when it comes to 
ring and troubleshooting. monito
Why? 
One major reason is that these tools keep us all from being on the same page. IT experts 
can’t even have meaningful cross‐discipline discussions when these tools become involved. 
“I’m looking at the database server, and the performance is at more than 200 TPMs,” one 
expert says. “Well, that must be a problem because the router is running well over 10,000 
PPMs.” Those two experts don’t even have a common language for performance because 
they’re locked into the domain‐specific, deeply‐technical aspects of the technologies they 
manage. 
Domain‐specific tools also encourage what is probably the worst single practice in all of IT: 
looking at systems in isolation. The database guy doesn’t have the slightest idea what 
makes a router tick, what constitutes good or bad performance in a messaging server, or 
what to look for to see if the directory services infrastructure is running smoothly. So the 
database guy puts on a set of blinders and just looks at his database servers. But those 
servers don’t exist in a vacuum; they’re impacted by, and they in turn impact, many other 
systems. Everything works together, but we can’t see that using domain‐specific tools. 
We have to permanently remove the walls between our technical disciplines, breaking 
down the silos and getting everyone to work as a single team. In large part, that means 
we’re going to have to adopt new tools that enable IT silos to work as a team, putting the 
information everyone needs into a common context. Sure, domain‐specific tools will always 
have their place, but they can’t be our first line of information. 
Case Study 
Jerry works for a typical IT department in a midsize company. His specialty is 
Windows server administration, and his team includes specialists for Web 
applications, Microsoft SQL Server and Oracle, VMware vSphere, and for the 
network infrastructure. The company outsources certain enterprise 
functionality, including their Customer Relationship Management (CRM) and 
email. 
Recently, a problem occurred that caused the company’s main Web site to 
stop sending customer order confirmation emails. Jerry was initially called to 
solve the problem, on the assumption that it was with the company’s 
outsourced messaging solution. Jerry discovered, however, that user email 
was flowing normally. He passed the problem to the Web specialist, who 
confirmed that the Web site was working properly but that emails sent by it 
were being rejected. Jerry filed a ticket with the messaging hosting company, 
who responded that their systems were in working order and that he should 
check the passwords that the Web servers were using. 
Creating Unified IT Monitoring and Management in Your Environment          Don Jones 
 
6
After more than a day of back‐and‐forth with the hosting company and 
various experts, the problem was traced to the company’s firewall. It had 
recently been upgraded to a new version, and that version was now blocking 
outgoing message traffic from the company’s perimeter network, which is 
where the Web servers were located. The network infrastructure specialist 
was called in to reconfigure the firewall, and the problem was solved. 
 
This narrative precisely demonstrates the problem: By managing our IT teams as domain‐
specific silos, we significantly hinder their ability to work together to solve problems. The 
fact that IT experts require domain‐specific tools shouldn’t be a barrier to breaking down 
those silos and getting our team to work more efficiently together. This becomes especially 
important when pieces of the infrastructure are outsourced; those hosting companies are 
an unbreakable silo, as they’re not responsible for any systems other than the ones they 
provide to us. However, the dependencies that our systems and processes have on their 
systems means our own team still has to be able to monitor and troubleshoot those 
outsourced systems as if they were located right in the data center. 
Problem 2: You Aren’t Connecting Your Users, Service Desk, and IT 
Management 
Communication is a key component of making any team work; and the “team” that is your 
organization is no exception. In the case of IT, we typically use Help desk systems as our 
means of enabling communications—but that isn’t always sufficient. Help desk systems are 
almost always built around the concept of reacting to problems, then managing that 
reaction; they’re almost by definition not proactive. 
For example, how do you tell your users that a given system will have degraded 
performance or will be offline for some period of time? Probably through email, which 
creates a couple of problems: 
•  Important messages tend to get lost in the glut of email that users deal with daily
• Users who don’t get the message tend to go the “Help desk route,” which doesn’t 
include a means of intercepting their mental process and letting them know that the 
“problem” was planned for. 
   
 
Creating Unified IT Monitoring and Management in Your Environment          Don Jones 
  7
 
Most IT teams do know the things that need to be communicated throughout the 
organization, for example: 
• SLAs 
• ey’re being met The current status of SLAs—whether th
• Planned outages and degraded service 
• ices Average response times for specific serv
• Known issues that are being worked on 
What most IT teams have a problem with is communicating these items consistently across 
the entire organization. Some organizations rely on email, which as I’ve already pointed out 
can be inefficient and not consistently effective. Some organizations will use an intranet 
Web site, such as a SharePoint portal, to post notices—but these sites aren’t directly 
integrated with the Help desk, making it an extra step to keep them updated and requiring 
users to remember to check them. 
Case Study 
Tom works as an inside salesperson for a midsize manufacturing company. 
Recently, the application that Tom uses to track prospects and create new 
orders started responding very slowly, and over the course of the day, 
stopped working completely. 
Tom’s initial action was to call his company’s IT Help desk. The Help desk 
technician sounded harried and frustrated, and told Tom, “We know, we’re 
working on it,” and hung up. Tom had no expectation when the system might 
return to normal, and was afraid to bother the Help desk by calling back for 
more details. 
Over the course of that day, the Help desk logged calls from nearly every 
salesperson, each of whom called on their own to find out what was going on. 
Eventually, the Help desk simply stopped logging the calls, telling everyone 
that, “A ticket is already open,” and disconnecting the call. 
Someone on the IT management team eventually sent out an email explaining 
that a server had failed and that the application wasn’t expected to be online 
until the next morning. Tom wished he had known earlier; although he’d 
originally planned to make sales calls all day, if he’d known that the 
application would be down for that long, he could have switched to other 
activities for the day or even just taken the day of
   
f. 
Creating Unified IT Monitoring and Management in Your Environment          Don Jones 
  8
 
Management communications are equally important, and equally challenging. Providing 
frank numbers on service levels, response times, outages, and so forth is crucial in order for 
management to make better decisions about IT—but that information can often be difficult 
to come by. 
Problem 3:  You’re Measuring the Wrong Things 
This problem is very likely at the heart of everything IT is not doing to help better align 
technology with business needs. The following case study outlines the scenario. 
Case Study 
Shelly works in the Accounting department for her company. Recently, while 
trying to close the books for her company, the accounting application began 
to react very slowly. She called her company’s IT Help desk to report the 
problem. 
The Help desk technician listened to her then said that, “Everything on that 
server looks fine right now. I’ll open a ticket and ask someone to look at it, 
but since we are currently within our service level agreement for response 
times, it will be a low‐priority ticket.” 
Shelly continued to struggle with the slowly‐responding application. 
Eventually, someone was dispatched to her desktop. She demonstrated that 
every other application was responding normally. She pointed out that other 
people in her department were having similar problems with the application. 
The technician made her close all of her applications and then restarted her 
computer, to no effect. He shrugged, entered some notes into his smartphone, 
and left. 
By the next morning, the application’s response times were better, but they 
were far from normal. Shelly continued to call the Help desk for updates on 
her ticket’s status, but it seemed as if the IT team had given up on trying to fix 
the problem—and refused to even admit that there was a problem. 
 
This kind of scenario unfortunately happens all too often in many organizations. It exactly 
illustrates what happens when several problems are happening at once: IT is operating as a 
set of individual silos rather than as a team, and each silo has its own definition for words 
like “slow.” A root issue here is that everyone is measuring the wrong thing. Figure 1.4 
shows how the average IT team sees a multi‐component, distributed application. 
Creating Unified IT Monitoring and Management in Your Environment          Don Jones 
 
9
 
Figure 1.4: IT perspective of a distrib
   
uted application. 
 
Creating Unified IT Monitoring and Management in Your Environment          Don Jones 
  10
 
They see the components. Domain experts measure the performance of each component 
using technical metrics, such as processor utilization, response time, and so forth. When a 
component’s performance exceeds certain predefined thresholds, someone in IT pays 
attention. Figure 1.5, however, shows how a user sees this same application. 
 
Figure 1.5 er’s perspective of a distributed application. 
The user doesn’t—often can’t—see any of the components. They simply see an application, 
and either it’s responding the way they expect, or it isn’t. It doesn’t matter a bit to the user 
if every single constituent component is running at an “acceptable level of processor 
utilization”—whatever that means. They simply care whether the application is working. 
This creates a major disconnect between the user population and IT, as Figure 1.6 
illustrates. 
: Us
Creating Unified IT Monitoring and Management in Your Environment          Don Jones 
 
11
 
Figure 1.6: IT vs. user measurements
   
 of performance. 
 
Creating Unified IT Monitoring and Management in Your Environment          Don Jones 
  12
 
Users and IT measure very different things. An IT‐centric SLA might specify a given 
response time for queries sent to a database server; that often has little to do with whether 
an application is seen as “slow” by users. Worse, as we start to migrate services and 
components to “the cloud,” we lose much of our ability to measure those components’ 
performance the way we do for things that are in our own data center. The result? Nobody 
can agree on what an SLA should say. 
This all has to change. We have to start measuring things more from a user perspective. 
The performance of individual components is important, but only as they contribute to the 
total experience that a user perceives. We need to define SLAs that put everyone—users 
and IT—on the same page, then manage to those SLAs using tools that enable us to do so. 
Some organizations will tell you that they’re moving, or have moved, to a service‐based IT 
offering. What that generally means in broad terms is that the organization is seeking to 
provide IT as a set of services to the organization’s various departments and users. In many 
instances, however, those “service‐oriented” organizations are still focused on components 
and devices, which isn’t a service‐oriented approach at all. When your phone line goes 
down, you don’t call the phone company (on your cell phone, probably) and start asking 
questions about switches and trunk lines—you ask when your dial tone will be back. The 
back‐end infrastructure is meaningless to the user. You don’t ask for a service credit based 
on how long a particular phone company office will be offline, you ask for that credit based 
on how long you went without a dial tone. That's the model IT needs to move toward. 
Problem 4: You’re Losing Knowledge 
The last problematic practice we’ll look at is the issue of lost institutional knowledge. This 
problem is a purely human one, and frankly it’s going to be difficult to address. Here’s a 
quick scenario to set the scene. 
Case Study 
Aaron works for his company’s IT department. He’s been with the company 
for 3 years and is responsible for several of the company’s systems and 
infrastructure components. One Tuesday, Aaron is contacted by his 
company’s IT Help desk. “We’re assigning you a ticket about the Oracle 
system,” he’s told. “Once every couple of months it starts acting really weird, 
and someone has to fix it.” 
“I’m not the Oracle guy,” Aaron says. “That’s Jill.” 
“Yeah, but Jill’s out on vacation for 2 weeks. So you’ll have to fix it.” 
“I’ve no idea what to do!” 
“Well, figure something out. The CEO gets upset when this takes too long to 
fix.” 
   
Creating Unified IT Monitoring and Management in Your Environment          Don Jones 
  13
 
Unfortunately, too much knowledge gets wrapped up in the heads of specific individuals. In 
fact, it’s a sad truth that many organizations “deal” with this problem by simply 
discouraging IT team members to take lengthy vacations, and often resist other activities 
that would put them out of touch—such as sending them to conferences and classes to 
continue their education and to learn new skills. 
More than a few organizations have made halfhearted attempts at building “knowledge 
bases,” in a hope that some of this institutional knowledge can be committed to electronic 
paper, preserved, and made more accessible. The problem is that IT professionals aren’t 
necessarily good writers, so the act of producing the knowledge base is difficult for them. It 
also takes time—time the organization is often unwilling to commit, especially in the face 
of other daily pressures and demands. 
As I said, this is a problem that’s difficult to fix. The IT team realizes it’s a problem, and is 
generally willing to fix it—but they’re not tech writers, and often have a limited ability to 
fix the problem. You can usually create management requirements that require problems 
and solutions be logged in a Help desk ticketing system, but searching through that system 
for problems and solutions can often be difficult and time‐consuming—much like searching 
for solutions on an Internet search engine, with all of the false “hits” such a search generally 
s. produce
But we must find a way to address this problem. Knowledge about the company’s 
infrastructure—and how to solve problems—has to be captured and preserved. This 
requirement is crucial not only to solving problems faster in the future but also to 
eventually preventing those problems by making better IT management decisions. 
How Truly Unified Management Can Fix the Problems 
This book is going to be all about fixing these four problems, and the means by which I’ll 
propose to do so falls under the umbrella term unified management. Essentially, unified 
management is all about bringing everything together in one place. 
We’ll break down the silos between IT disciplines, putting everyone onto the same console, 
getting everyone working from the same data set, and getting everyone working together 
on problems. We’ll do that in a way that brings users, IT, and management into a single 
viewport of IT service and performance. We’ll create more transparency about things like 
service levels, letting users see what’s happening in the environment so that they’re more 
informed. 
We’ll inform users in a way that’s meaningful to them rather than using invisible, back‐end 
technical metrics. We’ll rebuild the entire concept of SLAs into something that’s meaningful 
first to users and management, and that can withstand the transition to “hybrid IT” that’s 
cloud.” being brought about by outsourcing certain IT services to “the 
   
Creating Unified IT Monitoring and Management in Your Environment          Don Jones 
  14
 
Finally, we’ll find a way to capture information about our environment, including solutions 
to problems, to enable faster time‐to‐resolution when problems occur. In addition, this 
information will enable management to make smarter decisions about future technology 
directions and investments. 
We’ll try to do all of this in a way that won’t cost the organization an arm and a leg nor take 
half a lifetime to actually implement. That will involve a certain amount of creativity, 
including looking at outsourced solutions. The idea of an outsourced solution providing 
monitoring for in‐sourced components is fairly innovative, and we’ll see what applicability 
it has. 
I should point out that much of what we’ll be looking at can work to support the IT 
management frameworks that many organizations are adopting these days, including the 
ITIL framework that’s become popular in the past few years. You certainly don’t have to be 
an ITIL expert to take advantage of the new processes and techniques I’ll suggest—nor do 
you even have to think about implementing ITIL (or any other framework) if your 
organization isn’t already doing so. If you are using a framework, however, you’ll be 
pleased to know that everything I have to propose should fit right into it. 
Summary 
This chapter has established the four main themes that will drive the remaining chapters in 
this book. These core things represent what many experts believe are the biggest and most 
fundamental problems with how IT is managed today, and represent the things that we’ll 
focus on fixing throughout the remainder of this book. Our focus will be on changing 
management philosophies and practices, not on simply picking out new tools—although 
new tools may be something you’ll acquire to help support these new practices. 
Chapter 2 will focus on the first problematic practice, which is the fact that IT tends to be 
managed in domain‐specific silos. We’ll look at the technical reasons organizations have 
been more or less forced to manage this way, and explore ways in which you can start to 
change that practice. 
Chapter 3 will look at connecting people: IT management, your users, your service desk, 
and more. Only by bringing everyone into the process can IT better align itself to the needs 
of the organization. 
Our third problem practice will be the subject of Chapter 4, where we dive into looking 
outside the data center for monitoring. The goal will be to solve the problems we’ve 
 to the organization. discussed in this chapter, further focusing IT on its value
   
Creating Unified IT Monitoring and Management in Your Environment          Don Jones 
  15
 
Chapter 5 will discuss ways to turn problems into future solutions. Although modern 
organizations are fully aware of the need for Help desk tracking and knowledge building, 
how those activities are managed as part of the larger IT management process can make a 
huge difference in their value‐add to the organization. 
We’ll conclude in Chapter 6, with an attempt to visualize an IT environment where these 
new, unified management practices are in place. I’ll provide narratives from several case 
 work in a real environment. studies, helping you see how these modernized practices
   
Creating Unified IT Monitoring and Management in Your Environment          Don Jones 
 
16
Chapter 2: Eliminating the Silos in IT 
Management 
In the previous chapter, I proposed that one of the biggest problems in modern IT is the 
fact that we manage our environment in technology‐specific silos: database administrators 
are in charge of databases, Windows admins are in charge of their machines, VMware 
admins run the virtualization infrastructure, and so forth. I’m not actually proposing that 
we change that exact practice—having domain‐specific experts on the team is definitely a 
benefit. However, having these domain‐specific experts each using their own unique, 
domain‐specific tool definitely creates problems. In this chapter, we’ll explore some of 
those problems, and see what we can do to solve them and create a more efficient, unified 
IT environment. 
Too Many Tools Means Too Few Solutions 
“Comparing apples to oranges” is an apt phrase when it comes to how we manage 
performance, troubleshooting, and other core processes in IT. Tell an Exchange Server 
administrator that there’s a performance problem with the messaging system, and he’ll 
likely jump right into Windows’ Performance Monitor, perhaps with a pre‐created counter 
set that focuses on disk throughput, processor utilization, RPC request count, and so 
forth—as shown in Figure 2.1. 
 
Figure 2.1: Monitoring Exchange. 
 
Creating Unified IT Monitoring and Management in Your Environment          Don Jones 
  17
 
If the Exchange administrator can’t find anything wrong with the server, he might pass the 
problem over to someone else. Perhaps it will be the Active Directory administrator 
because Active Directory plays such a crucial role in Exchange’s operation and 
performance. Out comes the Active Directory administrator’s favorite performance tool, 
perhaps similar to the one shown in Figure 2.2. This is truly a domain‐specific tool, with 
special displays and measurements that relate specifically to Active Directory. 
 
Figure 2.2: Monitoring Active Directory. 
If Active Directory looks fine, then the problem might be passed over to the network 
infrastructure specialist. Out comes another tool, this one designed to look at the 
performance of the organization’s routers (see Figure 2.3). 
Creating Unified IT Monitoring and Management in Your Environment          Don Jones 
 
18
 
Figure 2.3: Monitoring router performance. 
Combined, all of these tools have led these three specialists to the same decision: 
Everything’s working fine. In spite of the fact that Exchange is clearly, from the users’ point 
of view, not working fine, there’s no evidence that points to a problem. 
Simply put, this is a “too many tools, too few answers” problem. In today’s complex IT 
environments, performance—along with other characteristics like availability and 
scalability—are the result of many components interacting with each other and working 
together. You can’t manage IT by simply looking at one component; you have to look at 
entire systems of interacting, interdependent components. 
Our reliance on domain‐specific tools holds us back from finding the answers to our IT 
problems. That reliance also holds us back when it comes time to grow the environment, 
manage service level agreements (SLAs), and other core tasks. I’ve actually seen instances 
where domain‐specific tools acted almost as blinders, preventing an expert who should 
have been able to solve a problem, or at least identify it, from doing so as quickly as he or 
she might have done. 
   
 
Creating Unified IT Monitoring and Management in Your Environment          Don Jones 
  19
 
 
Case Study 
Heather is a database administrator for her organization. She’s responsible 
for the entire database server, including the database software, the operating 
system (OS), and the physical hardware. 
One day she receives a ticket indicating that users are experiencing sharply 
reduced performance from the application that uses her database. She whips 
out her monitoring tools, and doesn’t see a problem. The server’s CPU is 
idling along, disk throughput is well within norms, and memory consumption 
is looking good. In fact, she notices that the amount of workload being sent to 
the server is lower than she’s used to seeing. That makes her suspect the 
network is having traffic jams, so she re‐assigns the ticket to the company’s 
infrastructure team. That team quickly re‐assigns the ticket right back to her, 
assuring her that the network is looking a bit congested, but it’s all traffic 
coming from her server. 
Heather looks again, and sees that the server’s network interface is humming 
along with a bit more traffic than usual. Digging deeper, she finally realizes 
that the server is experiencing a high level of CRC errors, and is thus having 
to retransmit a huge number of packets. Clients experience this problem as a 
general slowdown because it takes longer for undamaged packets to reach 
their computers. 
Heather’s focus on her specific domain expertise led her to “toss the problem 
over the wall” to the infrastructure team, wasting time. Because she wasn’t 
accustomed to looking at her server’s network interface, she didn’t check it 
as part of her routine performance troubleshooting process. 
Domain‐Specific Tools Don’t Facilitate Cooperation 
If the components of our complex IT systems are cooperative and interdependent, our IT 
professionals are often anything but. In other words, IT management tends to encourage 
the silos that are built around specific technology domains. There’s the database 
administration group, the Active Directory group, the infrastructure group, and so forth. 
Even companies that practice “matrix management,” in which multiple domain experts are 
os around each technical domain. grouped into a functional team, still tend to accept the sil
   
Creating Unified IT Monitoring and Management in Your Environment          Don Jones 
  20
 
There are two major reasons that these silos persist, and almost any IT professional can 
describe them to you: 
• “I don’t know anything about that.” Each domain expert is an expert in his technical 
area. The database administrator isn’t proficient at monitoring or managing routers, 
and doesn’t especially want to work with them anyway. There’s little real value in 
extensive technical cross‐training for most organizations, simply because their staff 
doesn’t have the time. Devoting time to secondary and tertiary disciplines reduces 
the amount of time available for their primary job responsibilities. 
• “I don’t want anyone messing with my stuff.” IT professionals want to do a good job, 
and they’re keenly aware that most problems come about as the result of change. 
Allow someone to change something, and you’re asking for trouble. If someone 
changes something in your part of the environment, and you don’t know about their 
activity, you’ll have a harder time fixing any resulting problems. 
Both of these reasons are completely valid, and I’m in no way suggesting that everyone on 
the IT team become an expert in every technology that the organization must support. 
 minor adjHowever, the attitudes reflected in these two perspectives require some ustment. 
One reason I keep coming back to domain‐specific tools is because they encourage this kind 
of walled‐garden separation, and do nothing to encourage even the most cursory 
cooperation between IT specialists. Cooperation, when it exists, comes about through good 
human working relationships—and those relationships often struggle with the fact that 
each specialist is looking at a different set of data and working from a different “sheet of 
music,” so to speak. I’ve been in environments and seen administrators spend hours 
arguing about whose “fault” something was, each pointing to their own domain‐specific 
tools as “evidence.” 
Case Study 
Dan is an Active Directory administrator for his company, and is responsible 
for around two dozen domain controllers, each of which runs in a virtual 
machine. Peg is responsible for the organization’s virtual server 
infrastructure, and manages the physical hosts that run all of the virtual 
machines. 
One afternoon, Peg gets a call from Dan. Dan’s troubleshooting a performance 
problem on some of the domain controllers, and suspects that something is 
consuming resources on the virtualization host that his domain controllers 
need. 
   
Creating Unified IT Monitoring and Management in Your Environment          Don Jones 
 
21
Peg opens her virtual server console and assures Dan that the servers aren’t 
maxed out on either physical CPU or memory, and that disk throughput is 
well within expected levels. Dan counters by pointing to his Active Directory 
monitoring tools, which show maxed‐out processor and memory statistics, 
and lengthening disk queues that indicate data isn’t being written to and read 
from disk as quickly as it should be. Peg insists that the physical servers are 
fine. Dan asks if the virtual machines settings have been reconfigured to 
provide fewer resources to them, and Peg tells him no. 
The two go back and forth like this for hours. They’re each looking at 
different tools, which are telling them completely different things. Because 
they’re not able to speak a common technology language, they’re not able to 
work together to solve the problem. 
We don’t need to have every IT staffer be an expert in every IT technology; we do need to 
make it easier for specialists to cooperate with one another on things like performance, 
scalability, availability, and so forth. That’s difficult to do with domain‐specific tools. The 
router administrator doesn’t want a set of database performance‐monitoring tools, and the 
database administrator doesn’t especially want the router admin to have those tools. 
Having domain‐specific tools for someone else’s technical specialization is exactly how the 
two attitudes I described earlier come into play. 
Ultimately, the problem can be solved by having a unified tool set. Get everyone’s 
performance information onto the same screen. That way, everyone is playing from the 
same rule book, looking at the same data—and that data reflects the entire, interdependent 
environment. Everyone will be able to see where the problem lies, then they can pull out 
the domain‐specific tools to start fixing the actual problem area, if needed. 
The Cloud Question: Unifying On‐Premise and Off‐Premise M
This concept of a unified monitoring console becomes even more important as 
organizations begin shifting more of their IT infrastructure into “the cloud.” 
onitoring 
The Cloud Is Nothing New 
I have to admit that I’m not a big fan of “the cloud” as a term. It’s very sales‐
and‐marketing flavored, and the fact is that it isn’t a terribly new concept. 
Organizations have outsourced IT elements for years. Probably the most‐
outsourced component is Web hosting, either outsourcing single Web sites 
into a shared‐hosting environment, or outsourcing collocated servers into 
someone else’s data center. 
   
 
Creating Unified IT Monitoring and Management in Your Environment          Don Jones 
 
22
For the purposes of this discussion, “the cloud” simply refers to some IT 
element being outsourced in a way that abstracts the underlying 
infrastructure. For example, if you have collocated servers in a hosting 
company’s data center, you don’t usually have details about their internal 
network architecture, their Internet connectivity, their routers, and so 
forth—the data center is the piece you’re paying to have abstracted for you. 
In a modern cloud computing model like Windows Azure or Amazon Elastic 
Cloud, you don’t have any idea what physical hosts are running your virtual 
machines—that physical server level is what you’re paying to have 
abstracted, along with supporting elements like storage, networking, and so 
on. For a Software as a Service (SaaS) offering, you don’t even know what 
virtual machines might be involved in running the software because you’re 
paying to have the entire underlying infrastructure abstracted. 
Regardless which bits of your infrastructure wind up in some outsourced service 
provider’s hands, those bits are still a part of your business. Critical business applications 
and processes rely on those bits functioning. You simply have less control over them, and 
typically have less insight into how well they’re running at any given time. 
This is where domain‐specific tools fall apart completely. Sure, part of the whole point of 
outsourcing is to let someone else worry about performance—but outsourced IT still 
supports your business, so you at least need the ability to see how the performance of 
outsourced elements is affecting the rest of your environment. If nothing else, you need the 
ability to authoritatively “point the finger” at the specific cause of a problem—even if that 
cause is an outsourced IT element, and you can’t directly effect a solution. This is where 
unified monitoring truly earns a place within the IT environment. For example, Figure 2.4 
shows a very simple “unified dashboard” that shows the overall status of several 
components of the infrastructure—including several outsourced components, such as 
mazon Web Services. A
 
 
Creating Unified IT Monitoring and Management in Your Environment          Don Jones 
 
23
 
Figure 2.4: Unified monitoring dashboard. 
The idea is to be able to tell, at a glance, where performance is failing, to drill through for 
more details, and then to either start fixing the problem—if it exists on your end of the 
cloud—or escalate the problem to someone who can. 
Let’s be very clear on one thing: Any organization that’s outsourcing any portion of its 
business IT environment and cannot monitor the basic performance of those outsourced 
elements is going to be in big trouble when something eventually goes wrong. Sure, you 
have SLAs with your outsourcing partners—but read those SLAs. Typically, they only 
commit to a refund of whatever fees you pay if the SLA isn’t met. That does nothing to 
compensate you for lost business that results from the unmet SLA. It’s in your best 
interests, then, to keep a close watch on performance. That way, when it starts to go bad, 
you can immediately contact your outsourcing partner and get someone working on a fix so 
that the impact on your business can at least be minimized. 
Missing Pieces 
There’s another problem when it comes to performance monitoring and management, 
scalability planning, and so forth: missing pieces. Our technology‐centric approach to IT 
tends to give us a myopic view of our environment. For example, consider the diagram in 
Figure 2.5. This is a typical (if simplified) diagram that any IT administrator might create to 
help visualize the components of a particular application. 
 
Creating Unified IT Monitoring and Management in Your Environment          Don Jones 
 
24
 
Figure 2.5: Application diagram. 
The problem is that there are obviously missing pieces. For example, where’s the 
infrastructure? Whoever created this diagram clearly doesn’t have to deal with the 
infrastructure—routers and switches and so forth—so they didn’t include it. It’s assumed, 
almost abstracted like an outsourced component of the infrastructure. Maybe Figure 2.6 is 
a more accurate depiction of the environment. 
 
Creating Unified IT Monitoring and Management in Your Environment          Don Jones 
 
25
 
Figure 2.6: Expanded application diagram. 
And even with this diagram, there are still probably missing pieces. This reality is probably 
one of the biggest dangers in IT management today: We forget about pieces that are outside 
our purview. 
   
 
Creating Unified IT Monitoring and Management in Your Environment          Don Jones 
  26
 
Again, this is where a unified monitoring system can create an advantage. Rather than 
focusing on a single area of technology—like servers—it can be technology‐agnostic, 
focusing on everything. There’s no need to leave something out simply because it doesn’t fit 
within the tool’s domain of expertise; everything can be included. 
In fact, an even better approach is to focus on unified monitoring tools that can actually go 
out and find the components in the environment. Software doesn’t have to make the same 
assumptions, or have the same technology prejudices, as humans. A unified monitoring 
console doesn’t care if you happen to be a Hyper‐V expert, or if you prefer Cisco routers 
over some other brand. It can simply take the environment as it is, discovering the various 
components and constructing a real, accurate, and complete diagram of the environment. It 
can then start monitoring those components (perhaps prompting you for credentials for 
each component, if needed), enabling you to get that complete, all‐in‐one, unified 
dashboard. I’ve been in environments where not using this kind of auto‐discovery became a 
real problem. 
Case Study 
Terry is responsible for the infrastructure components that support his 
company’s primary business application. Those components include routers, 
switches, database servers, virtualization hosts, messaging servers, and even 
an outsourced SaaS sales management application. Terry’s heard about the 
unified monitoring idea, and his organization has invested in a service that 
provides unified monitoring for the environment. Terry’s carefully 
configured each and every component so that everything shows up in the 
monitoring solution’s dashboard. 
One afternoon, the entire application goes down. Terry leaps to the unified 
monitoring console, and sees several “alarm” indications. He drills down and 
discovers that the connection to the SaaS application is unavailable. Drilling 
further, he sees that the router for that connection is working fine, and that 
the firewall is up and responsive. He’s at a complete loss. 
Several hours of manual troubleshooting and wire‐tracing reveal something 
about the environment that Terry didn’t know: There’s a router on the other 
side of the firewall as well, and it’s failed. Normal Internet communications 
are still working because those travel through a different connection, but the 
connection that carries the SaaS application’s traffic is offline. The “extra” 
router is actually a legacy component that pretty much everyone had 
forgotten about. 
A monitoring solution capable of automated discovery wouldn’t have 
“forgotten,” though. It could have detected the extra router and included it in 
Terry’s dashboard, making it much easier for him to spot the problem. In fact, 
it might have prompted him to replace or remove that router much earlier, 
once he realized it existed. 
   
Creating Unified IT Monitoring and Management in Your Environment          Don Jones 
  27
 
Discovery can also help identify components that don’t fit neatly within our technology 
silos, and that don’t “belong” to anyone. Infrastructure components like routers and 
switches are commonly‐used examples of these “orphan” components because not every 
organization maintains a dedicated infrastructure specialist to support these devices. 
However, legacy applications and servers, specialty equipment, and other components can 
all be overlooked when they’re not anyone’s specific area of responsibility. Discovery helps 
keep us from overlooking them. 
Not All of IT Is a Problem: Ordering, Routing, and Providing Services
Most organizations tend to get into the habit of thinking of their IT department as “fire 
fighters.” IT exists to solve problems. That isn’t true, of course, and any organization 
probably (hopefully) depends more on IT to carry out day‐to‐day tasks and requests more 
than they rely on them to solve problems. But the day‐to‐day tasks are easy to overlook, 
 
whereas “fire fighting” gets everyone’s attention. 
The result of this way of thinking is that IT management tends to focus on tools that help 
make problem‐solving easier. Unified monitoring is exactly that kind of tool: If nothing ever 
went wrong, we wouldn’t need it. It’s there to make problem‐solving faster, primarily in the 
rform d availabilityareas of pe ance an . Right? 
Not quite. Truly unified management also entails making day‐to‐day IT tasks easier for 
everyone involved. Users, for example, need to order and receive routine services, from 
simple password resets and account unlocks to new hardware and software requests. I’ll 
make what some consider to be a bold statement and say that those routine requests 
should be treated in the exact same way as a problem. Look at any IT management 
framework, such as ITIL, and you’ll find that concept runs throughout: Routine IT requests 
should be part of a unified management process, which also includes problem‐solving. 
Consider some of these broad functional capabilities that a unified management (versus 
mere “monitoring”) can offer both to problem‐solving activities and to routine IT services: 
• Workflow—When problems arise, following a structured process, or workflow, can 
help make problem‐solving more consistent and efficient. Similarly, structured 
workflows can help make routine IT services more efficient and consistent. The 
workflows will be different for problem‐solving and for various routine services, but 
having the ability to manage and monitor workflows can be a real benefit. 
• Approvals—Workflows should include approvals. This capability is most obvious 
for routine services like hardware and software requests, security requests, and so 
on—but it can be just as important for problem solving. Not every problem can be 
fixed by changing a setting or rebooting a device; sometimes you’ll need to make a 
more significant change, and having the ability to formally route approval to make 
that change is a benefit. 
   
Creating Unified IT Monitoring and Management in Your Environment          Don Jones 
  28
 
• Routing. The specialist who fixes a problem is usually the last one to hear about it. 
Front‐line resources, such as your Help desk and your end users, are the first 
“responders.” Being able to select a problem category and have a ticket routed to the 
right individual helps speed problem resolution. The same is true for routine 
services: Things get done quicker when the right person has the request. Automated 
routing capabilities can help get the right person on the job more quickly and more 
accurately. 
• Self‐service. Reducing phone calls and manual email juggling is crucial to achieving 
better efficiency. Self‐service can help do that for both problems and routine 
requests. When users experience a problem, self‐service can allow them to submit 
tickets as well as help them solve the problem on their own, through a knowledge 
base. When users need routine service, self‐service helps them submit that request 
without having to engage additional IT services. 
• Service catalog. Part of self‐service is the ability to create an “online store” for 
services that users can request. 
There are more capabilities, of course, but we’ll cover them in upcoming chapters. These 
are simply some of the basic capabilities that we need in order to make both routine IT 
requests and problem‐solving more consistent and efficient. 
Coming Up Next… 
This chapter has been about breaking down the silos between technology specialties, or at 
least building doorways between them. That helps to solve one of the major problems in 
modern IT monitoring and management. The next chapter will tackle a somewhat more 
complicated problem: Keeping everyone in the management loop. It’s about improving 
communications. Unfortunately, communications are too often a voluntary, secondary 
exercise—we have to make an effort to communicate, and when we’re really feeling the 
pressure, it’s easy to want to put that effort elsewhere. So we need to adopt processes and 
tools that make communications more automatic, helping keep everyone in the loop 
without requiring a massive secondary effort to do so. 
   
Creating Unified IT Monitoring and Management in Your Environment          Don Jones 
 
29
Chapter 3: Connecting Everyone to the IT 
Management Loop 
IT management has for too long involved discrete, disconnected processes that often leave 
key participants wondering what’s going on. Bringing everyone—users, managers, IT 
professionals, and more—into the loop can create significant benefits as well as reduce the 
tendency to fall back into discipline‐based silos. This is where the integration between 
monitoring and service desk truly happens, and these concepts deliver the most critical, 
central themes discussed throughout this book. It’s all about communication—ways to 
ent. better achieve communication as well as create opportunities for continuous improvem
Users sometimes perceive their IT department as out‐of‐touch, ivory‐tower geeks with 
poor people skills. Whether or not that’s true depends on the actual IT team members, but 
the perception, fair or not, often exists. That’s because IT can too often be the last ones to 
know about things that users perceive as problems. Sure, the server might me humming 
along within specs, but the order‐entry application is incredibly slow. IT says that email is 
working fine, but I’ve been waiting on an incoming purchase order for an hour—the email 
system can’t possibly be working correctly! 
IT has its own unique problems to deal with, and they sometimes involve a disconnect with 
management. Finding windows in which to make approved changes, for example, can be 
incredibly tricky. Simply coordinating the changes that are proposed, approved, under 
development, ready for implementation, and so forth can be difficult. Many organizations 
have adopted change management frameworks, such as those proposed by ITIL, that 
outline specific processes for reviewing and approving changes. Physically coordinating 
that process, however, can seem like herding cats. It’s even worse when IT has been 
divided into silos: The database team might have a change scheduled for tonight, but that 
change is going to conflict with the power supply changes being implemented by the data 
enter team. We need to get everyone on the same page. c
   
 
Creating Unified IT Monitoring and Management in Your Environment          Don Jones 
 
30
Starting the Loop: Connecting Monitoring to the Service Desk 
Most organizations today have a ticket‐based system for coordinating IT activities. These 
organizations also usually have monitoring systems in place to watch their IT systems and 
alert them to any problems. Too few organizations, however, have connected these two 
systems. Ideally, that’s what you want: A single, integrated IT management system that can 
detect problems and then automatically open tickets for the appropriate individuals. If the 
email server is down, the appropriate administrator should get a ticket. Those tickets, of 
course, should include notifications via text message, email, or whatever other medium is 
t. appropriate so that alerted individuals know they have an aler
That auto‐assignment—you might even choose to call it auto‐routing—of tickets needs to 
be pretty intelligent. Different systems, in different locations, at different times, all might 
change how the ticket is created, thus changing who is assigned to work the problem. 
Tickets should be as complete as possible, meaning as many fields as possible should be 
automatically populated—you shouldn’t have to rely on a Help desk, or someone else, to fill 
in the details. Those details might include the affected server’s information. Figure 3.1 
shows what this kind of auto‐generated ticket might look like, with several key bits of 
information pre‐populated by the system. 
 
Figure 3.1: Automatically­generated tickets
   
 in response to alarms. 
 
Creating Unified IT Monitoring and Management in Your Environment          Don Jones 
  31
 
The idea is to have a service desk solution—that’s the software that helps coordinate and 
manage IT activities, often through tickets—working with the monitoring solution, thus 
creating a truly integrated response to IT problems. 
This is all intended to provide specific benefits. First and foremost is faster problem 
resolution. By not waiting for users to inform you of a problem, you’re getting started on 
solving the problem faster. By having pre‐populated tickets, the IT team is able to work 
more quickly because they’re starting with more information. 
There’s a bit more depth that can be added, if you have the right service desk software in 
place. Frameworks like ITIL encourage root cause analysis, meaning your team should focus 
not only on solving today’s specific problem but also on making the overall environment 
more stable and problem‐resistant. To that end, a service desk solution can define two 
types of problems: global issues and specific incidents. 
Specific incidents might be day‐to‐day problems like, “Email moving slowly throughout the 
organization,” “Order entry application operating slowly,” and so forth. Those might all be 
tied to a global issue of “Unexplained network slowdowns,” which could be examined and 
solved—perhaps locating a router that was overheating and dropping more packets than 
usual. 
Sometimes, specific incidents might not be entirely solved until the overarching global 
issue is solved. By tracking those individual incidents along with the global issue, you can 
help keep your users and managers more informed. For example, once that overheating 
router is discovered and replaced, everyone affected by an associated specific issue could 
be notified: “Hey, we think we’ve found the root cause for all the slowdowns, so things 
should be better from here on out.” Figure 3.2 shows how a single global problem can be 
attached to multiple incidents. 
Creating Unified IT Monitoring and Management in Your Environment          Don Jones 
 
32
 
Figure 3.2: Relating multiple incidents to a single problem. 
I’ve used a couple of keywords in the forgoing discussion and want to take a moment to 
specific  define ally them in the context of this book: 
• An incident is something that happens in the environment, such as a failed server or 
ion. a slow applicat
• IT staff create problem records to help manage the incident. Problems may in fact be 
associated with multiple incidents, as in the case of that overheating router, which 
caused multiple disparate failures throughout the environment. 
I’m going to start using those two terms more consistently from here on. Hopefully, some of 
the benefits of combining monitoring with problem solving will become clear. For example, 
more simplistic Help desk solutions allow multiple tickets to be opened against what is 
essentially the exact same issue. That can result in a lot of duplicated effort, as multiple IT 
team members attempt to work the issues on their own. It can also result in a lot of 
paperwork because solving the root cause then requires technicians to spend time 
laboriously closing each ticket. With a more sophisticated system in place, everything can 
be consolidated into a single, managed problem record. Doing so creates additional 
benefits, such as identifying solutions or workarounds, which I’ll discuss in upcoming 
chapters. 
   
 
Creating Unified IT Monitoring and Management in Your Environment          Don Jones 
  33
 
Problems and incidents, however, aren’t the only reason that users interact with IT. 
Hopefully, they’re not even the major reason your users interact with IT! Aside from 
reporting incidents, users also need to request routine services: advice, new hardware 
requests, routine change requests, access requests, and so forth. These interactions should 
be managed through a more formal workflow in which users submit their request, have it 
assigned to the appropriate technician after being approved, and be able to track the status 
st. of their reque
For a ex mple: 
1. A user might visit a Web site to browse a “catalog” of items they can request, such as 
access to systems, changes to hardware, and so forth. 
 2. A user selects an item from the catalog, and provides whatever details are necessary
to complete the request. 
ending 
proval. 
3. A ticket is created in the service desk that represents the user’s request. Dep
upon the request, the ticket might first be routed to the user’s manager for ap
4. Once approved, the ticket would be automatically routed to the appropriate 
technician or IT team for completion. 
5. The user would receive status updates, perhaps via email, throughout this process, 
keeping them informed of its progress. The status updates would include a 
“completed” update once the request was finished. 
By using the same ticket‐based system employed for problem‐solving to address routine 
requests, IT technicians can rely on a single interface to manage their workload. Figure 3.3 
shows what a routine request ticket might look like. 
 
Creating Unified IT Monitoring and Management in Your Environment          Don Jones 
 
34
 
Figure 3.3: Routine requests can also be made into tickets. 
Even better, IT management can rely on all IT work being documented and tracked in a 
single system, enabling management to stay informed through reports, dashboards, and 
other mechanisms. Figure 3.4 shows an example of what such a report might look like. 
 
Creating Unified IT Monitoring and Management in Your Environment          Don Jones 
 
35
 
Figure 3.4: Management reports become more effective when they include all IT 
workload. 
The idea is to keep everyone in the loop: users remain informed, IT remains informed, 
management remains informed. Much of the burden of keeping everyone informed is 
handled by the software, which can send email updates and other kinds of notifications so 
that everyone is aware of what’s happening at all times. 
Making Changes: How to Find a Change Management Window 
Large, multi‐discipline IT departments have inherent problems. In the previous chapter, I 
discussed the problem of silo‐based problem solving, where domain experts spend time 
passing a problem back and forth because everyone is looking at different tools and data to 
determine whether the problem is “theirs.” We’re certainly not going to get rid of domain 
experts, so the solution is to get tools that could put everything into a single console in 
order to unify everyone’s efforts. 
 
Creating Unified IT Monitoring and Management in Your Environment          Don Jones 
  36
 
Another problem created by those silos relates to change management. At the start of this 
chapter, I outlined one of those problems: The database team is ready to implement a 
change, but it’s going to be in conflict with a change being implemented by another group. 
Managing change windows is becoming increasingly difficult. Not only are applications and 
services needed round‐the‐clock, creating tiny change windows in the first place, but the 
varying needs of different experts creates contention for those already‐small windows. 
“Boss, we’d have that fix in place, but we can only implement it at night. It’s going to take 4 
hours, which just fits inside the window management allows us. But all this week, other 
teams have been using the window, and the changes they’re making are blocking us from 
doing anything at the same time.” It’s not an unusual situation. It gets tough for 
management to even track what changes are pending and to slot them into the shrinking 
time that’s available to make them. 
The lack of visibility into these windows, and the contention for them, makes it impossible 
to even make a management decision. For example, if management could see the number of 
changes stacked up, and see the contention, they might decide to expand the window for a 
period of time in order to get the changes implemented. They might not decide to do that, 
but they’d be consciously making a decision rather than remaining ignorant of the actual 
problem. 
The solution, of course, is software that facilitates the coordination of departments. Think 
about it: If you’re using a service desk solution to track tickets, then tickets can be created 
for proposed changes. Those tickets would be assigned to a technician, routed for reviews 
and approvals, and so forth, all via some workflow you designed. That’s an excellent way to 
support ITIL processes, by the way. The tickets themselves can then feed a unified 
calendar, built right into the service desk, which allows change planners to schedule 
activities. They can see agreed maintenance windows, manage contention between 
conflicting changes, and so forth. By getting this information into a familiar calendar form, 
they can also make decisions about whether to widen maintenance windows if doing so is 
necessary and beneficial to the organization. Figure 3.5 shows a change management 
calendar. 
Creating Unified IT Monitoring and Management in Your Environment          Don Jones 
 
37
 
Figure 3.5: Managing change schedules in a calendar view. 
This is just another way to help keep everyone in the loop. Management now has a clear 
visual depiction of change and schedule contention. Such a calendar could even be made 
available to users so that they could see what changes were scheduled and plan their own 
activities accordingly. 
Communicating: How to Bring Users into the Loop 
The idea of keeping users informed certainly isn’t new, but many organizations that have 
attempted to better engage their users haven’t met with unqualified success. Too often, 
“keep users in the loop” solutions take the form of self‐service Web portals, where users 
can log in to check the status of their tickets or to check the status of a particular service. 
That’s all well and good, but Web portals like that don’t always fall within the natural 
workflow of a user. For example, most users, when confronted with some kind of problem, 
don’t necessarily think to check a Web site and see if something’s wrong—they call the 
Help desk. 
   
 
Creating Unified IT Monitoring and Management in Your Environment          Don Jones 
  38
 
Users do, however, spend a lot of time in their email inbox. Why not make that your 
channel for communication? Organizations don’t use this method of communication in part 
because doing so could easily become a time burden for your IT team. “So on top of solving 
the problem, I have to send out hourly update emails with the status of the problem?” 
Sounds like a Dilbert cartoon! 
In reality, a good service desk solution can do it for you. Sending an email update when a 
user’s ticket is updated, for example, is an easy operation for a piece of software. Such 
emails can be informative, and help users feel comfortable that their request is being 
handled. Figure 3.6 shows what one might look like. 
 
Figure 3.6: Keeping users informed wi
   
th detailed emails. 
Creating Unified IT Monitoring and Management in Your Environment          Don Jones 
  39
 
What’s more compelling is a service desk solution that can actually accept requests via 
email rather than expecting users to go to a self‐service Web portal and open a ticket. Face 
it: Your users are more likely to pick up the phone than visit a Web site, unless you’ve 
placed significant artificial barriers in the way, like complex voice menus in the phone 
system. Users are more likely to send an email. If your service desk, rather than a human 
technician, can receive those emails and use them to create a ticket, you’ve truly created a 
system your users are likely to embrace. Such tickets could still be auto‐assigned and –
routed, helping the right technician to start working the problem more quickly. 
Even for your users’ routine, non‐problem requests, email updates can be valuable. When 
their request is approved, rejected, underway, completed, and so forth, an email update 
helps keep users informed without additional human effort. 
Note 
I want to emphasize that self‐service portals are a good thing. They can 
provide a rich user experience, help guide users to self‐service solutions, and 
more. They just shouldn’t be the only means of communicating with users. 
SLAs: Setting and Meeting Realistic Expectations 
Unless you’ve been living under a rock for the past decade or so, Service Level Agreements 
(SLAs) are probably pretty familiar to you. These are, in their simplest form, an agreement 
by the IT team to provide a specific level of performance or availability for a specific service 
or application. “The email service will be available 99.999% of the time on an annualized 
basis” is an example of a very simple SLA. 
But SLAs can get complicated quickly. You can’t just pull a number out of thin air; what 
level of service can you reasonably provide? What level of service have you historically 
provided, and is that meeting the business’ needs? Once established, how do you track the 
SLA to make sure you’re actually meeting it—and ideally get some kind of notification 
when you’re in danger of breaking the agreement? 
SLAs might not be the only type of agreement you need to define and track. Some 
organizations also use underpinning contracts (UCs) or operational level agreements (OLAs) 
for different in‐ and out‐sourced services; these often support SLAs. 
A well‐built service desk and monitoring solution can help you handle these agreements 
more precisely. You’ll start by defining top‐level SLAs, then creating and managing UCs and 
OLAs as appropriate. 
Once defined, the solution should be able to track ongoing performance and availability, 
perhaps offering a simple dashboard—like the one shown in Figure 3.7—that illustrates 
your compliance with your SLAs. You might also have more comprehensive and detailed 
reports on SLA metrics. 
   
Creating Unified IT Monitoring and Management in Your Environment          Don Jones 
 
40
 
Figure 3.7: Managing SLAs with at­a­glance dashboards. 
Most importantly, however, the solution needs to provide you with the ability to define 
rules for your SLAs so that tickets can be created—and auto‐assigned to the appropriate 
technicians—when SLAs are in danger of being broken. Further, the solution should 
support escalation rules so that if an SLA that is in danger of being broken is not corrected 
within a certain amount of time, the solution can automatically call for backup, summoning 
additional technicians, notifying management, and so forth. 
There’s also a strong need to recognize that no SLA is perfect. Sometimes, for whatever 
reason, the business will decide to take a service offline. Perhaps it’s for a software upgrade 
or for some kind of infrastructure maintenance. In those cases, you’re not breaking the SLA; 
you’re agreeing—along with whatever part of the business will be affected—to temporarily 
suspend the SLA to get the work done. A service desk solution should support these types of 
exceptions, including SLAs that are only valid during certain hours, holiday exceptions, 
agreed‐upon reduced service windows, maintenance windows, and so forth. 
The idea is to automate SLA definition and management—and to automate the notifications 
that go with SLAs. If an SLA is broken, you might agree that the affected business users will 
receive an automatic notification. That lets them know that IT knows about the problem 
and is working on it—without forcing users to visit a self‐service portal and open a ticket. 
That kind of proactive response can go a long way toward improving IT‐user relationships, 
and in helping IT be viewed as responsive to, and supportive of, business requirements. 
 
Creating Unified IT Monitoring and Management in Your Environment          Don Jones 
 
41
Tell Me What You Really Think 
IT managers like IT to think of users as “customers.” In some cases, your users might 
actually be customers, in the sense of “sending you a check for specific services you 
provide” customers. In other cases, your users might be internal users—but still 
“customers” in the sense that they consume services you, the IT department, provides, and 
that you get paid for your efforts. 
A big problem that IT has always struggled with is its perception by its customers. Do 
customers think you’re doing a good job? What is a good job? 
For this reason, monitoring End‐User Experience (EUE) metrics, which I discussed in the 
first chapter, has become a hot trend in the IT industry. You might see that your servers’ 
performance is within norms, but by the time you throw in old client computers, routers, 
network cabling, and everything else involved in delivering a service to users, they have a 
completely different perception of the server’s performance. Measuring the EUE is a way to 
get some insight into that aggregate perception that your users—your customers, if you 
prefer—deal with. 
Businesses have traditionally used another important technique to discover their 
customers’ perceptions: surveys. Phone your credit card company, and the robot who 
answers the phone might inform you that you’ve been selected to participate in a short 
satisfaction survey, which will begin when you finish speaking with the agent who is about 
to come on the line. Walk into a theme park, and a smiling employee with a tablet computer 
asks you a few questions. Look at the register receipt from your last purchase, and you 
might find that you’re eligible to win a gift card or other prize if you complete an online 
survey about your shopping experience. 
Surveys are an effective way of finding out what users really think, and a good service desk 
application should provide you with the ability to survey your customers. Perhaps you 
want to ask them their opinion after each request that’s completed. Maybe you want to be a 
bit less intrusive, and only survey them after every 3 or 4 requests. Whatever you decide, a 
service desk solution should be able to automate the process. You might even want to 
engage customers in ad‐hoc surveys to further your understanding of their perceptions 
about day‐to‐day performance, availability, service levels, and so forth. 
Of course, surveys are useless without the ability to aggregate the data and see how you’re 
doing. The back end of a survey system must include reporting capabilities, perhaps with 
charts and graphs, that help you visualize your customers’ perception of your service. 
Compare this report to your SLA compliance report—do you see any differences? If your 
SLA shows that you’re doing a great job, and your customer surveys aren’t so glowing, then 
maybe your SLAs aren’t set at the right levels—or maybe your SLAs aren’t the only metric 
you should be looking at. 
   
 
Creating Unified IT Monitoring and Management in Your Environment          Don Jones 
  42
 
I’ve worked with a number of customers who have found themselves in exactly that 
situation: “Our SLAs are all being met, every day, but our users still don’t think we do a 
good job. What’s the problem?” We discovered the answer with a few ad‐hoc surveys that 
touched on “soft” issues, such as the IT team’s “attitude” when helping users. Turns out that 
the team came across as brusque and sometimes rude. We spent some time with the team, 
and discovered that they felt an incredible amount of pressure because of the number of 
tickets assigned to them. In the end, the company developed internal metrics to track each 
IT member’s workload and efficiency, and worked to bring each person’s workload to a 
more manageable level—while continuing to survey those “soft” issues such as attitude. 
The moral of the story is that SLAs aren’t the only metric you need to concern yourself 
with, and integrated surveying can help reveal critical information to help pinpoint overall 
service problems. 
When Everyone Doesn’t Need to See Everything: A Multi‐Tenant 
Approach 
Multi­tenant is a growing trend amongst IT solution vendors, and for good reason. 
Obviously, service providers operate the very definition of multi‐tenant systems. If you’re a 
service provider, or perhaps more specifically a Managed Service Provider (MSP), then you 
know the importance of having tools that can be customized and partitioned for each of 
your customers. Customer A wants these dashboards, while Customer B wants those. 
Customer B certainly doesn’t want to see Customer A’s tickets (and Customer A doesn’t 
want Customer B to see them!). In the past, it’s been pretty common for such multi‐tenant 
features to only be present in solutions that were designed for MSPs. 
Today, however, that’s changing. Large, multi‐divisional companies want to deploy 
solutions that can serve all of their divisions’ needs without necessarily deploying a unique 
solution for each division. That’s where multi‐tenancy can help, enabling a single solution 
to be customized, partitioned, and presented to each division as if they were the only ones 
using the solution, when in fact the solution is consistently serving everyone. Different 
divisions can get a different view of just their portion of the environment. For example, 
Division A might see a dashboard, while Division B saw something completely different. 
Again, multi‐tenancy isn’t something that every single company or organization is going to 
need. However, it’s a nice feature to have in your back pocket if the time comes when you 
do need it, so be sure to consider this functionality as you’re evaluating various solutions—
even if multi‐tenancy isn’t an immediate need. Of course, if you’re an MSP, multi‐tenancy is 
definitely a must‐have feature. 
We’re continuing to support this chapter’s theme of keeping everyone in the loop: The 
ability to provide specific, customized, partitioned environments to your varying 
customers—whether internal or external—helps keep them more informed and more 
ccurately informed. a
   
Creating Unified IT Monitoring and Management in Your Environment          Don Jones 
 
43
Call It a Private Management Cloud: Allocating Costs 
There’s one more thing we should look at to keep everyone in the loop, and that’s with 
regard to their costs: The ability to provide customers with detailed reports on their usage 
of the infrastructure, and to potentially bill them for their usage based upon those reports. 
Figure 3.8 shows what such a report might look like. 
 
Figure 3.8: Reporting on usage­based metering and billing. 
Again, this kind of reporting is an obvious, must‐have feature for MSPs—but it has 
increasing applicability to organizations who deal only with internal customers. 
One of the key elements of cloud computing is the concept of billing you based on your 
actual usage. The cloud provider builds and manages the infrastructure, which is shared 
amongst their customers. Each customer then pays for the bits they use. That’s an obvious 
and well‐understood model for the public cloud—but it’s becoming a model for the private 
cloud as well. Rather than accepting IT as a giant bucket of overhead, companies are 
looking more and more at allocating IT’s costs across the consumers of those IT services. 
“Marketing wants to spin up a dozen virtual Web servers for a new Web site? Okay—do 
they have the budget to pay for it?” 
Chargebacks, as they’re called, are certainly nothing new. But monitoring and service desk 
solutions are increasingly able to provide the level of detail that you need to actually make 
chargebacks work. The technological advancements that have made public clouds possible 
can be readily integrated into private data centers for the same purposes: billing (or 
 
allocating costs) for actual usage. 
Tying IT costs directly to the consumers of those IT services is a great approach for helping 
IT make better business decisions. Rather than putting IT in the role of “gatekeeper” for 
who can and cannot have specific services, the organization’s management gets to decide 
what money will be spent, by whom, on what services. That’s how it should be. In one 
sense, IT has always been an outsourced activity: Although the IT team might be paid by 
the organization, they don’t materially participate in the organization’s actual profit‐
making activities. They’re a separate division. Essentially, the business has “outsourced” IT 
(albeit to an internal team)—why not have IT deliver usage‐based billing statements just 
like any other vendor would be expected to do? 
Creating Unified IT Monitoring and Management in Your Environment          Don Jones 
  44
 
It’s just another way of keeping everyone in the loop. Even if you don’t use your usage‐
based billing reports for actual billing or chargeback, they’re a useful way of helping upper 
management understand the cost and value of their IT investment. “Yes, you spent a zillion 
dollars on IT last quarter but here’s why, and here’s how that investment was consumed by 
the organization. If you want to cut back, start by looking at the consumers, and finding 
ways to make them consume less.” 
Conclusion 
This chapter has been all about keeping people in the loop when it comes to IT 
management. From keeping users more updated and engaged in the IT process, to keeping 
technicians more connected to ongoing events, to keeping management more informed so 
that they can make better decisions—it’s been about communications. There’s very little 
I’ve discussed in this chapter that any organization couldn’t start doing today, if they were 
willing to expend enough effort. The key, however, is in accomplishing these goals with 
little or no effort, by using a system of integrated software tools that understand how to do 
these things for you. 
Coming Up Next… 
In the next chapter, we’re going to look at a challenge that’s become more and more 
common in IT: key services and IT elements exist outside the data center. Yes, you can call 
it “the cloud” or you could simply call it “outsourced services.” Whatever you call them, 
they’re still critical to the business, and you need to treat them the same way you treat all of 
the in‐house services. You can’t treat them as a separate silo, because then you’ll be forcing 
yourself to manage them differently. Of course, monitoring outsourced services is a whole 
different ball game than managing in‐house services, so we’ll need to find some clever 
solutions. 
   
Creating Unified IT Monitoring and Management in Your Environment          Don Jones 
 
45
Chapter 4: Monitoring: Look Outside the 
Data Center 
IT has moved beyond our own data centers, and nearly every organization has at least one 
or two outsourced IT services. Although we’re probably always going to have on‐premise 
assets to manage and monitor, we need to realize that in most cases, monitoring has to 
start outside the data center—both in the sense of accommodating off‐premises services as 
well as focusing more closely on what end users are actually experiencing. 
Monitoring Technical Counters vs. the End‐User Experience 
The traditional IT monitoring approach is what I call inside out: It starts within the data 
center and moves outward toward the end user. Figure 4.1 provides a visual for this idea, 
illustrating how typical monitoring focuses on the backend: database servers, application 
servers, Web servers, cloud services, and so forth. The general reason for this approach is 
that we have the best control and insight over what’s inside the data center. If everything 
inside the data center is running smoothly, it stands to reason that the end users who 
consume the data center’s services will be happy. 
 
Figure 4.1: Monitoring from the data center outward. 
 
Creating Unified IT Monitoring and Management in Your Environment          Don Jones 
  46
 
Most Service Level Agreements (SLAs) derive from this approach: We promise a certain 
amount of uptime, and we set up monitoring thresholds around data center‐centric 
measurements like CPU utilization, network utilization, disk utilization, and so forth. We 
also tend to look at low‐level response times: query response time, disk response time, 
network latency, and so on. 
There’s something deeply and inherently inaccurate about the underlying assumption of 
this approach: Even if you start with a perfect pile of bricks, there’s no guarantee that 
you’re going to end up with a stable building in the end. In other words, what end users 
experience isn’t merely the sum of the data center’s various metrics. A smoothly‐running 
data center usually leads to satisfied users, but that isn’t always the case. 
It’s obviously important for us to continue monitoring these data center‐centric 
measurements, but those can’t be the only thing we monitor and measure. Current thinking 
in the industry is that we need to more directly measure what the end user experiences. In 
fact, “end user experience,” or EUE, has become a common term in more forward‐thinking 
management circles. 
Here’s another way to think of it: Suppose you go to a restaurant to eat. Your steak comes 
out cooked wrong, they brought the wrong side items, and the waitress is rude. The 
manager, standing back in the kitchen, thinks everything is fine: the steaks are hot, the 
veggies are hot, and the waitress smiles at him every time she goes back there. He’s focused 
on the backend, with no knowledge of your expectations. Restaurants address this by 
having the manager periodically roam around and ask, “Is everything okay?” That’s 
monitoring the EUE: Rather than looking at his back‐of‐house metrics, he’s going out into 
the cube farm—er, restaurant floor—and testing the waters. 
How the EUE Drives Better SLAs 
You establish metrics for what the EUE should be for various operations: so many number 
of seconds to complete such‐and‐such a transaction, and so forth. When that metric isn’t 
met, you start drilling down into the infrastructure to find out why. That’s where more‐
traditional data center monitoring re‐enters the picture. Rather than using query response 
time or whatever to derive the end user’s experience, we’re using it to troubleshoot things 
when the end user’s experience is clearly not where we need it to be. Figure 4.2 shows how 
EUE monitoring sort of reverses the model. 
Creating Unified IT Monitoring and Management in Your Environment          Don Jones 
 
47
 
Figure 4.2: Monitoring the EUE. 
You’ll still have thresholds and other considerations, but they’re set at levels that have 
historically been able to deliver an acceptable EUE. As Figure 4.3 shows, a failed EUE is 
your cue to start looking at deeper, more technical‐level measurements so that you can see 
what’s contributing to the end user problem. 
 
Creating Unified IT Monitoring and Management in Your Environment          Don Jones 
 
48
 
Figure 4.3: Tracking the cause of a poor EUE. 
In reality, it doesn’t always take a major change in the backend to cascade into a real 
problem for the EUE. A database server’s response times slow by a millisecond or two, 
resulting in an application server taking an extra half‐second to process a transaction, 
resulting in a front‐end server taking an extra second to present the next screen of 
information, resulting in the user’s client application taking a couple of extra seconds. Add 
up those couple extra seconds over the course of a day, and you’ve lost an hour or so, and 
told a lot of customers, “Sorry this is taking so long, the computer is slow today.” 
In Figure 4.3, both an internal database server and a cloud computing service are 
responding slowly (indicated by the red flags). Neither one might be alarming in and of 
itself, but together they’re combining to form a noticeable problem for the end user. 
Normally, a minor a fluctuation on the database server might not raise any alarms. It’s the 
cascade of effects that result in a poor EUE. Once we definitively know—because we’ve 
been watching it—that the EUE is declining, we can start looking for causes. Because we’re 
looking for a problem, rather than just routinely monitoring, that minor back‐end 
performance decrease will be more noticeable. 
   
 
Creating Unified IT Monitoring and Management in Your Environment          Don Jones 
  49
 
The ability to measure the EUE lets you create much more realistic SLAs. Instead of telling 
users, “We’ll guarantee a query response time of 2 seconds,” you tell them, “Such‐and‐such 
a transaction will take no more than 3 seconds to process.” That’s something an end user 
can monitor for themselves: “Click enter, and count one‐one thousand, two‐one thousand, 
three‐one… ah, it’s done.” That kind of SLA sets an expectation that users can relate to. 
They’ll know when “the system is slow” because they’re measuring the same thing you are. 
Ideally, you’ll know of slowdowns before the user, or at close to the same time, because 
you’ll have tools in place to monitor things from the users’ perspective. 
How It’s Done: Synthetic Transactions, Transaction Tracking, and 
More 
This kind of monitoring isn’t always easy. It’s possible to throw monitoring agents onto end 
user computers when they’re all employees, but what about a Web application, where the 
end users are actually external customers? They probably wouldn’t be excited about having 
you install monitoring agents on their computers just to track your application’s 
performance. 
Instead, modern monitoring tools rely on techniques like transaction tracking. With this 
technique, monitoring components on your end watch an individual transaction as it flows 
through your systems, literally measuring the time it takes the transaction to be processed. 
This can be done at a variety of levels of detail. For example, tools usually associated with 
software performance profiling can get very detailed, tracking transactions through 
individual software modules. At a higher systems management level, you might just track 
. the transaction’s start‐to‐finish time
Often, this is also done by inserting synthetic transactions into the system. Essentially, a 
monitoring system pretends to be a client, then inserts transactions into the system that 
will be processed but then later ignored. These allow the monitoring system to more 
precisely figure out the actual time‐to‐complete for various transactions. This idea is 
illustrated in Figure 4.4. 
Creating Unified IT Monitoring and Management in Your Environment          Don Jones 
 
50
 
Figure 4.4: Using transaction tracking to monitor the EUE. 
There are a lot of variations on these techniques, and a lot of specialized tools that you can 
acquire to actually implement them. In the end, though, it’s important to remember that the 
entire activity is designed to measure just one thing: the EUE. You’re not, at this point, 
trying to figure out what individual systems’ performance is or trying to track down the 
root cause of the problem. You’re simply trying to determine whether there is a problem. 
Top‐Down Monitoring: From the EUE to the Root Problem 
The EUE is intended to be an extremely high‐level diagnostic; it tells you that “something is 
wrong.” It won’t tell you what. For that, you’re going to need to go back to the traditional 
monitoring you’ve always known and loved, only this time you won’t just be watching in a 
xists. vacuum: You’ll be looking for a problem that you know e
   
 
Creating Unified IT Monitoring and Management in Your Environment          Don Jones 
  51
 
This is not the time to pull out the domain‐specific monitoring tools—we’ve discussed that 
in prior chapters. You still want to stick with a monitoring system that can monitor 
everything in a single “pane of glass.” That doesn’t necessarily mean a framework that’s 
aggregating domain‐specific tools, either—it means a monitoring system designed 
specifically to look at each of your systems. With the right understanding of what 
performance should look like at each component level, such a system can quickly tell you 
where the problem lies. Then you can dig out the domain‐specific tools to troubleshoot the 
particular problem—again, with the knowledge that there is a problem, and that the 
component you’re looking at is the one causing the problem. 
Deriving the EUE 
So why can’t you simply use better thresholds on your back‐end monitoring 
to figure out when the EUE is declining? Because EUE focuses on the entire 
system. The database can be slower, provided that time doesn’t cascade 
through the rest of the system. A slow router doesn’t necessarily mean a slow 
EUE, although in combination with other factors, it might be the tipping 
point. That’s why you need to look directly at what end users are 
experiencing, then go looking for the root cause. 
Agent vs. Agentless Monitoring 
There’s a lot of argument in the monitoring industry about the best way to monitor. Do you 
install agents? Some folks believe so, and feel that agents provide the best and most‐
detailed information. Other folks don’t like installing and maintaining agents throughout 
their environment, and correctly point out that not every component of a system can even 
have agents installed. Routers, off‐premise services, and so forth typically can’t support 
dedicated monitoring software, after all. So one approach is definitely to install agents, as 
illustrated in Figure 4.5. 
Creating Unified IT Monitoring and Management in Your Environment          Don Jones 
 
52
 
Figure 4.5: Monitoring via agents. 
You’ll typically have those agents reporting back to some centralized monitoring server or 
system. Depending on your approach, you might have agents installed on every system 
where they can be installed, potentially even on some end‐user computers for spot‐
monitoring (although that’s pretty unusual). 
Some monitoring solutions will let you get away without installing agents on every system, 
and might not even need agents on any of your components. As illustrated in Figure 4.6, 
these solutions typically use external means of picking up on system performance. 
 
Creating Unified IT Monitoring and Management in Your Environment          Don Jones 
 
53
 
Figure 4.6: Agentless monitoring. 
Whether agentless monitoring can pick up as much data, or pick up all the data you need, 
depends a lot on what kind of components are in your network, and what kind of 
monitoring techniques and technologies are in use. It’s a major competitive point between 
different vendors, so it’s something to pay close attention to. 
That “monitoring provider” in Figure 4.6 is my lead‐in to a key point about modern 
applications. You’re almost always going to wind up with some kind of hybrid system that 
relies partly on agents and partly on agentless monitoring—because some of what you’ll be 
monitoring won’t be in your own data center. 
 
Creating Unified IT Monitoring and Management in Your Environment          Don Jones 
 
54
Monitoring What Isn’t Yours 
The off‐premise stuff is where our traditional monitoring falls part. It’s unlikely that 
Amazon is going to give you detailed performance statistics into their Elastic Compute 
Cloud (EC2), and it’s unlikely that Microsoft would do so for Windows Azure. 
SalesForce.com isn’t going to send you database query response times or Web server CPU 
utilization. Even the hosting company where you’ve collocated your own servers isn’t going 
to be sending you detailed data about their routers’ dropped packet percentages, or any 
other infrastructure‐level statistic. 
Yet those numbers matter to you. If you have an application that relies on cloud computing 
components, collocated servers, Software as a Service (SaaS) solutions, or any other 
outsourced component, then the performance of those components affects your application 
performance your EUE. In short, when Amazon feels performance issues, so do your users. 
That’s where hybrid monitoring enters the picture. As Figure 4.7 shows, it usually takes the 
form of some external monitoring service, which collects key external performance 
information from major outsource providers—the “cloud components,” if you will, with the 
data collection shown as red lines—and reports back to your central monitoring console, as 
indicated by the green line. 
This is where a lot of what I’ve been outlining in the previous chapters really starts to come 
together: 
• You need both your internal systems and any external components monitored in the 
same view. There’s no way you can treat your systems as systems if you can’t get all 
of the constituent components into a single monitoring space. 
• The key competitive point for these hybrid monitoring services is the breadth of 
external components that they can monitor. Make sure you’re choosing one that can 
. monitor everything you’ve got—including all the outsourced dependencies
• Monitoring the EUE becomes important because there may well be a lot of 
fluctuation with your external services and your use of them. For example, you 
won’t care that Azure is experiencing slow response times during periods when 
your users aren’t relying on that service. You only need to pay attention—and be 
alerted—when your users are experiencing a problem. 
 
Creating Unified IT Monitoring and Management in Your Environment          Don Jones 
 
55
 
Figure 4.7: Hybrid monitoring. 
In fact, this kind of monitoring of external, outsourced components is the key piece that 
makes many organizations feel they can’t rely on cloud computing. “How will we manage 
it?” they ask. “How will we monitor it?” Along with data security, it’s probably the biggest 
question asked when organizations start considering adding “the cloud” to their IT 
portfolio. This is how you’ll monitor it: Using specialized monitoring services that add “the 
cloud” to your single pane of glass. These tools put outsourced components on the same 
r them the same way. level as your on‐premise components, and let you monito
   
 
Creating Unified IT Monitoring and Management in Your Environment          Don Jones 
  56
 
What’s interesting is the way in which some vendors are architecting these solutions. Many 
of them sell on‐premise monitoring solutions, which look a lot like what’s in Figure 4.7. 
They actually monitor the cloud components on their end, but deliver that information to 
you; their solution then collects your on‐premise data and presents everything in a 
consolidated view. 
But it doesn’t have to be that way. As Figure 4.8 shows, you could also go with a hosted 
monitoring solution, where your internal performance data is shipped to the cloud (shown 
by blue lines), combined with performance information on your outsourced components 
(red lines), and presented in a single view via a Web portal or some other tool. 
 
Figure 4.8: Outsourced, hybrid monitoring. 
Creating Unified IT Monitoring and Management in Your Environment          Don Jones 
  57
 
It’s an interesting model because it takes much of the responsibility of monitoring out of 
your hands, and lets you focus on the services you’re delivering to your users. It isn’t the 
right model for every organization, of course—but it’s an interesting option. 
Critical Capability: You Need to Monitor Everything 
The last really important piece of the puzzle is to make sure you’re monitoring everything. 
Every‐everything. Take a look at Figure 4.9, which is the example system I’ve been using all 
along. Is anything missing? If we monitored each of the components shown, in some 
fashion, would we be monitoring enough? 
 
Figure 4.9: Is this everything you’d need to monitor? 
Definitely not. There’s a lot missing from this diagram, and it’s mostly things that can have 
a massive impact on performance. Take a look at Figure 4.10—it’s a bit more complete. 
Creating Unified IT Monitoring and Management in Your Environment          Don Jones 
 
58
 
Figure 4.10: Make sure you’re monitoring everything. 
Routers. Switches. Firewalls. Proxy servers. Directory servers. DNS—both internal and 
external. And probably a lot more. If your EUE is declining, you need to be able to find the 
root cause—and you can only do that if your monitoring solution can see every possible 
root cause. 
This is why a lot of monitoring solutions these days offer automated discovery, in addition 
to letting you add components on your own. Discovery can find the stuff you’re likely to 
miss because you’re not thinking of it as “part of the system.” Infrastructure elements like 
routers and switches. Dependencies like directory services and DNS. Potential bottlenecks 
like firewalls and proxies. It all matters, so it’s important that it all get onto that “single 
ane of glass” that you use to monitor overall system health. p
   
 
Creating Unified IT Monitoring and Management in Your Environment          Don Jones 
 
59
Conclusion 
Monitoring is the thing that lets us manage SLAs, lets us spot problems brewing, and lets us 
keep our systems running the way the business needs them to. But traditional monitoring 
isn’t necessarily the only or best way to go about meeting the business’ needs. More 
importantly, as businesses start to rely more and more on external components in their 
systems, traditional monitoring just can’t get all of the necessary facts into a single view. 
Hybrid monitoring can. By using a combination of traditional monitoring techniques, cloud‐
provided performance data, and other techniques, we can get entire systems onto a single 
view, into a single dashboard, and into a single focus. 
Coming Up Next… 
In the next chapter, we’ll address a fundamental problem that all organizations seem to 
struggle with: repeatability. In other words, once you’ve solved a problem, how can you 
solve it more quickly if it happens again in the future? We’ll look at turning problems into 
solutions and improving service delivery in the future. 
   
 
Creating Unified IT Monitoring and Management in Your Environment          Don Jones 
 
60
Chapter 5: Turning Problems into Solutions 
The satirical news outlet The Onion recently ran a story related to the economy. In it, the 
publication claimed that a special kind of scientist called a historian was advancing the 
novel idea of looking at the past. “Sometimes,” one pseudo‐historian was quoted, “we can 
look at how people tried to solve problems which are similar to those problems we are 
having today. We can look and see how their solutions worked, and that can give us an idea 
of whether or not the same solution will work for us.” Hah! 
Although targeted at politicians who seem to keep making the same mistakes over and 
over, The Onion’s jibe is pretty applicable to IT as well. “Look, if this same problem 
happened 3 months ago, and we solved it then, perhaps we can solve it more quickly now. 
What, exactly, did we do last time? Maybe doing the same thing again will have the same 
effect that it did then!” 
I’ll put it another way: Perhaps you have children, or at least know someone who does. 
Ever tell a kid not to touch the hot pot that’s on the stove? Sure. Did they touch it? Of 
course. How many times? Usually just once. That’s because human beings are designed to 
learn primarily by making mistakes. Provided we remember the mistake, and that we 
remember how to avoid it or solve it, we can do so in the future very quickly. Memory 
becomes the key factor, and as we get older, stop touching hot pots and start playing with 
computers at work, it sometimes gets harder to remember. This chapter is all about the 
final aspect of unified management: Taking problems that we’ve solved, and turning those 
into solutions for the future. 
Closing the Loop: Connecting the Service Desk to Monitoring 
Before we dive into the memory aspect of solving problems, we’ve first got to close the 
operational loop in our unified monitoring toolset. Earlier in this book, we discussed that 
one aspect of a unified management system is the ability to monitor devices and services, 
such as a database server. When a problem condition is monitored, the monitoring system 
creates an alert, which is typically shown on a console, and may involve notifying someone 
via email or text message. A truly unified system may also open a problem ticket in the 
organization’s IT ticket‐tracking system. The ticket enables management to track the 
problem and its time to resolution. It also allows the ticket to be passed to different 
personnel who collaborate to solve the problem. The ticket can even be pre‐populated with 
information germane to the case, helping the person working the problem to get going 
more quickly. Figure 5.1 illustrates this first step: The alert showing up in the console, and 
the ticket being created from that. 
 
Creating Unified IT Monitoring and Management in Your Environment          Don Jones 
 
61
 
Figure 5.1: Getting an alert and opening a ticket. 
Eventually, one hopes, the problem will be corrected. At that point, it’s common for the 
o close the ticket, marking it as completed. person who completed it t
But what about the alert? 
Of course, the real‐time monitoring component of the system will realize that the problem 
no longer exists—but that doesn’t necessarily get rid of the alert. Typically, you want alerts 
left in‐place until the problem is confirmed as being handled, which means that in addition 
to closing the ticket, you’ve also got to go in and clear the alert. This is actually pretty 
common in organizations that don’t have a unified management system: Close the ticket in 
one system, then log into the monitoring system and mark the alert as handled. In a truly 
unified system, however, it would make sense for the closed ticket to also clear the 
associated alert because the alert is what created the ticket in the first place. Figure 5.2 
shows how this loop can be closed within a single system. 
 
Creating Unified IT Monitoring and Management in Your Environment          Don Jones 
 
62
 
Figure 5.2: Closing a ticket clears the original alert. 
There’s a perfectly good reason to have alerts and tickets remain separate from each other. 
A ticket tends to be an internal‐use‐only type of thing. It contains technical information, 
intended for use in solving a problem and for reporting on that resolution process. An alert, 
however, is consumable by a wider range of people. An alert might surface in a 
companywide dashboard, for example, showing users that a given system is indeed 
impacted. You don’t necessarily clear the alert just because the monitoring system is no 
longer seeing a problem, because temporary relief from a problem doesn’t necessarily 
indicate a resolved problem. You might want the alert to remain in place as a high‐level 
indicator that, “we know it’s not working perfectly right now.” But at some point you’ll 
want to clear the alert and return the affected system to “operating normally” status; 
having that happen automatically as part of closing the ticket can be a convenient way to 
keep the two different audiences updated more easily. 
Retaining Knowledge Means Faster Future Resolution 
Once a problem is solved, it doesn’t go away. At least, you hope it doesn’t go away. As I 
pointed out in the beginning of this chapter, every problem solved is a potential turbo‐
boost for solving problems in the future—both that exact same problem as well as related 
ones. In other words, you want to retain information about the problem, as well as its 
olution, so that it can become useful in the future. s
   
 
Creating Unified IT Monitoring and Management in Your Environment          Don Jones 
 
63
Knowledge Bases 
Probably the oldest formal means of retaining this information is the knowledge base. 
Originally, these were separate databases, consisting of articles about how to solve 
problems. When you have a problem, you first search the knowledge base to see if any clues 
exist to help solve the problem. 
One of the earliest knowledge bases to be widely distributed was Microsoft’s, who made it 
available in the early 1990s on CD. Today, it’s a massive collection of online articles—so 
massive, in fact, that there’s actually a knowledge base article on how to query the 
knowledge base (shown in Figure 5.3, just in case you don’t believe me). 
 
Figure 5.3: Microsoft Knowledge
   
 Base article. 
 
Creating Unified IT Monitoring and Management in Your Environment          Don Jones 
  64
 
This illustrates just one of the problems with a knowledge base: People have to learn to use 
it, and have to remember to use it. Unfortunately, IT professionals aren’t necessarily the 
audience most likely to reach for the manual—or a knowledge base—when a problem 
crops up. They’re a lot more likely to just dive in and try to use their own knowledge to 
solve the problem. Using the knowledge base—“search the KB,” in the vernacular—usually 
only happens after they’ve exhausted their internal knowledge. Part of this attitude comes 
from their professional competency, part from the poor usability of most knowledge bases, 
and part from the fact that knowledge bases can get outdated pretty quickly. 
Which illustrates another major problem with a knowledge base: The task of keeping it 
updated. Unless you’re careful at the outset to tag articles with things like product versions 
and so forth, it can get really easy for the knowledge base to become a repository of 
misinformation. Consider a line of business application, version 1.5, that has a particular 
problem. You document that in a KB article, then rely upon that knowledge to fix the 
problem whenever it arises. Finally, your developers correct the problem in v1.6. Does 
anyone go back and update the KB article? No. Even if the KB article indicates that it applies 
to v1.5, it doesn’t provide guidance beyond that. Was the problem fixed in v1.6? Will the 
same fix procedure work in v1.5? If you’re using v1.6 and the problem occurs again, should 
you follow the v1.5 procedure or report the problem as a new one—since the developers 
thought they’d fixed it? 
All of this presumes, of course, that you’ve addressed the major problem of knowledge 
bases: Getting articles into them in the first place. Vendors like Microsoft spend millions of 
dollars per year on the salaries of people who do little more than write documentation and 
contribute articles to knowledge bases. Are you willing to make that kind of investment? 
I’ve seen many companies set up a knowledge base, use it enthusiastically for a few months, 
and then let it slide and fall into disuse. 
Tickets as Knowledge Base Articles 
The first solution to many of the knowledge base’s inherent problems was to simply 
discard the separate knowledge base and instead use closed tickets as a form of knowledge 
base. This is pretty much what every major ticket‐tracking system these days offers. 
This approach solves the primary knowledge base problem of how to get content into the 
system, because it simply re‐purposes content that’s already in the system: tickets. With a 
good ticketing system, it can also help solve the problem of “what this applies to,” because 
your tickets are typically categorized with a specific product or service. So you’ll at least 
know when you’re reading an old ticket, what product and version it applied to—although 
. you won’t necessarily know if it still applies to the current version of that product or device
Using Help desk tickets as a knowledge base doesn’t solve the problem of getting people to 
actually search them for answers. In fact, using Help desk tickets can make the problem 
worse. Think about it: Every time a problem arises, a new ticket is created. So when you 
search the knowledge base (for example, the old tickets) using a keyword or by just 
selecting a product or device, you’re going to get a lot more search results because you’re 
going to be looking at every ticket that matches your criteria. 
Creating Unified IT Monitoring and Management in Your Environment          Don Jones 
  65
 
Help desk tickets don’t always make a great source of self‐service documentation, either. 
Not all IT folks are the best writers in the world, and tickets have a way of gathering… let’s 
just call it “informal” language, which you might not want to surface to your end users. For 
example, a user who logs onto your self‐service knowledge base, trying to solve a problem 
on their own rather than bugging your Help desk, might not be encouraged if the result 
they found said something like, “Rebooted stupid user’s computer.” Technicians might also 
provide very little in the way of detail. For example, it’s not unusual to see “fixed” as the 
resolution to a ticket—not very useful for future reference. But using Help desk tickets as a 
knowledge base source isn’t far off from the real solution. 
Unifying the Knowledge Base 
There are two things you can do to turn more Help desk tickets into useful knowledge base 
articles. First, you need some automation. Whenever a new ticket is created, the ticketing 
system should automatically go looking for related past tickets, presenting them as 
candidates to whatever technician is working the problem. One great example of this 
technique is used by the StackOverflow.com site—itself a kind of ticket/knowledge base 
combination—when you ask a new question. It automatically searches past questions and 
presents them to you in a visually interruptive fashion: They’re inserted below your 
question, but above where you’d type the details of your question, as Figure 5.4 shows. It 
essentially forces you to review those suggestions so that you can quickly see if your 
question has, perhaps, already been answered. 
 
Figure 5.4: Suggested answers to a question. 
Creating Unified IT Monitoring and Management in Your Environment          Don Jones 
  66
 
As you begin to type your question’s details, additional suggestions are shown off to the 
side, again helping you use the database of past answers rather than requiring you to 
explicitly search it in an extra step. 
So a unified system can help take that extra step (see Figure 5.5). By including potentially‐
relevant tickets, or links to them, in with a newly‐created ticket, the system can give 
technicians a jump start on solving the problem by calling their attention to similar 
situations in the past—along with the solutions to those situations. 
 
Figure 5.5: Using old tickets to solve
   
 new problems. 
Creating Unified IT Monitoring and Management in Your Environment          Don Jones 
  67
 
In fact, for tickets generated automatically from an alert, the ticketing system can 
potentially do a much better job of finding older tickets that actually relate to the problem. 
Because the system doesn’t mind taking the extra steps, it can include more detailed search 
criteria, such as the nature of the problem, the device or service affected, and so forth. A 
technician might not think to include all the detail, which would net them a large set of 
search results, which is often what discourages them from searching in the first place. By 
getting a narrow result set to begin with, the automatically‐referenced tickets are more 
likely to relate to the problem at hand. 
Such a system can be made even better if the Help desk system includes a couple of check 
boxes in its tickets. When closing a ticket, a technician should be able to independently 
indicate: 
• Whether this ticket contains a bona fide resolution to the problem. For example, 
sometimes the technician might solve the problem by looking at an older ticket, 
meaning the current ticket might not contain a lot of detail on how the problem was 
fixed. But if the technician has fixed the problem, and has filled in the details of what 
was done, then the current ticket can be marked as a “solution” ticket, making it 
bubble to the top of future search results. 
• Whether this ticket contains an end‐user consumable, self‐service solution. Many 
ticket‐tracking systems these days include both “public” and “private” notes fields, 
helping to ensure that end users don’t see anything that they might find upsetting or 
insulting, while accepting the fact that technicians will put that stuff into a ticket 
sometimes. By having a specific indication of which tickets are consumable outside 
the IT team, and which ones specifically contain user‐implementable solutions, you 
can build a self‐service knowledge base that actually works. 
Figure 5.6 shows how a system might implement this—in this case, rather than a checkbox, 
the system uses a “visibility” drop‐down to change a ticket from being held to being 
published. 
Creating Unified IT Monitoring and Management in Your Environment          Don Jones 
 
68
 
Figure 5.6: Controlling ticket visibility. 
Simply the presence of these check boxes (or other indicators) can help to remind 
technicians that documented solutions are desirable. From a management perspective, 
organizations might set quotas for technicians: At least 75% of the tickets you close must 
either contain a detailed solution or refer to the ticket that does contain the solution. 
Metrics like that are manageable through ticket system reports, and can help ensure that 
ickets really do begin to serve as a basis for knowledge retention. t
   
 
Creating Unified IT Monitoring and Management in Your Environment          Don Jones 
 
69
Making Tickets an Asset 
The overall idea is to take your tickets from being a way of tracking problems and work to 
being a complete life cycle for problem‐solving. In order to be effective, tickets‐as‐a‐
solution has to overcome some of the common human behaviors and implementation 
issues that have often been hurdles in the past: 
• Technicians don’t always search the ticket database—so that should happen 
automatically to some degree, with tickets being offered as potential solutions. 
• Technicians’ search skills aren’t always that great—so a unified system should, 
using the information it already has at its disposal, make a first attempt at finding 
relevant tickets. 
• Technicians’ writing skills aren’t always a priority—so the system should emphasize 
the need for complete solutions, management should focus on that as a metric, and 
technicians should be able to offer both “internal” and “externally‐consumable” 
versions of a solution, when appropriate. 
With the right system—particularly one connected to your monitoring system, making a 
truly unified environment—solutions to problems can be just a click away. 
Past Performance Is an Indication of Future Results 
Another way to use historical data is in developing service level expectations. I’m 
deliberately avoiding the phrase “service level agreement” because an SLA is a formal 
document that often includes some element of an organization’s politics. A service level 
expectation, however, is the level of service that, based upon past performance, you can 
realistically expect to achieve in the future. An SLA will ideally be based upon those real‐
world expectations—if you can provide them. 
One issue with many organizations’ SLAs is that they’re not actually based in reality. 
Someone will either make up an ambitious goal to “look good,” like promising 99.999% 
availability and then boldly stating that they will just “manage to that number.” Other 
times, someone will take an overly‐cautious approach when establishing service levels, 
forcing the organization to expect a lesser level of service than they realistically could. 
At fault are the tools we use. This gets all the way back to the first chapter of this book, 
when I wrote about the silos that IT tends to work in, and the varying domain‐specific tools 
we rely on to troubleshoot and solve problems. Those same domain‐specific tools are what 
we use to measure our existing performance levels. Because those tools don’t all speak a 
common language or use a common set of metrics, it’s actually really tough to figure out 
what our actual service levels are. 
   
 
Creating Unified IT Monitoring and Management in Your Environment          Don Jones 
  70
 
The bottom line is this: You have an existing environment. All political and internal issues 
aside, your existing infrastructure is capable of delivering some level of technically‐
measurable performance. You just need to discover what that is, using a common and 
easily‐communicated set of metrics, based upon your infrastructure’s current capability. 
You can’t really do that by using a hodgepodge of domain‐specific tools, though—and you 
really can’t do it when your infrastructure starts to contain outsourced elements. Start 
bringing in cloud computing platforms, collocated servers, software as a service (SaaS) 
elements, and so on, and you’ll find that your domain‐specific tools just can’t provide 
enough information. So how can you establish a good service level expectation? 
This drives right back to the previous chapters in this book. Say you’ve got a complex set of 
services and applications—who doesn’t these days? Figure 5.7 shows an infrastructure 
offering a lot of different elements, some inside the data center, some out. 
 
Figure 5.7: Modern environments include many different components. 
Creating Unified IT Monitoring and Management in Your Environment          Don Jones 
  71
 
You start your measuring at the one place it matters most: the end user. Put some probes, 
agents, synthetic transactions, or whatever else you need in place to figure out what your 
users are actually seeing, today, in terms of performance. Monitor that over several days 
that represent real, normal workload—no fair picking holidays as your day to monitor—
and you’ll know what your infrastructure is actually providing. It stands to reason that you 
can’t expect any better but that you also shouldn’t put up with anything worse. If that 
service level expectation isn’t as good as your SLA—well, that’s fine. You can start looking 
for areas where you can improve, bringing things up to that SLA level. 
You’ll also want to capture individual performance from each component—and this is 
where things can get tricky. It’s crucial that, at this level of monitoring, you get everything 
onto a single console, in a single language, using a single set of metrics. What you’re looking 
for is a performance range for each component that represents a normal workday. 
Provided each component operates within that observed range, you should be delivering 
the end‐user experience that you measured. Those ranges provide the basis for your 
monitoring thresholds: Anything outside those ranges is something you need to be alerted 
to. 
With that service level expectation established, you can start measuring different workload 
levels. See how things look on an especially busy day, for example, and what they look like 
on a light day (this is where it’s okay to pick a holiday, for example). You’ll start to get a feel 
for how your end user experience differs under those different workloads, and how the 
elements of your infrastructure change under different workloads. 
Making sure that any outsourced elements are included in all of this is, of course, absolutely 
crucial. As I’ve pointed out in earlier chapters, monitoring those is a bit different than 
monitoring things that live inside your own data center. You’ll either need a unified 
monitoring solution that’s truly capable of hybrid monitoring, or you’ll need a special set of 
tools to gather performance information on those outsourced pieces. 
Notice that I’ve laid out two sets of metrics for you to monitor: performance and workload. 
Too often, I see SLAs that don’t take the workload into account. “We will provide a 100ms 
response time.” Okay—under what workload, specifically? Because maybe I can give you a 
100ms response time under what I consider to be a normal workload, but if you start 
loading on additional users and functions, then that response time is obviously going to fall 
off. Again, monitoring solutions can help with this by not only measuring performance of 
things like processor, memory, disk, and so forth, but also workload, like the number of 
transactions being processed, the number of network packets being routed, and so on. It’s 
important that your performance expectations include that workload context so that you 
an begin to make better service level agreements in the future. c
   
Creating Unified IT Monitoring and Management in Your Environment          Don Jones 
 
72
It’s the Performance Database 
All of this performance data needs to not only be captured but also stored. That’s where a 
lot of monitoring solutions miss the point: They’re monitoring in real‐time, and they’re 
alerting to problems, but they’re not always saving the data they see. Let’s expand the 
example application to include that performance database—it’s in Figure 5.8. 
 
Figure 5.8: Adding a performance databas
   
e to the environment. 
 
Creating Unified IT Monitoring and Management in Your Environment          Don Jones 
  73
 
The point of this figure is simply that you need to get performance data from every 
component—even the outsourced ones—into that database. Why? Two reasons: 
• This database is what’s going to show you what your performance really looks like 
on what you consider to be a normal day. This is where your performance 
expectations will come from, and it’s hopefully what you’ll use to derive more 
realistic and meaningful SLAs. 
• This database is what’s going to tell you when your performance is trending away 
from previously‐established norms. I’m not referring here to a situation where one 
component’s performance goes wonky due to a problem—live monitoring and 
alerting will take care of that. The database is there to spot the long‐term trends: 
“Hey, did you know that performance is down 1% from last month, which was down 
.75% from the month before? At this rate, you’ll be unable to meet your SLAs in 6 
months.” 
And frankly, a good monitoring solution shouldn’t even show you the prototypical “trend 
line” in performance as its first step. The first step should be a simple dashboard: “You’re 
meeting your SLA, and based on current trends, will continue to do so for the foreseeable 
future.” Or, “You’re meeting your SLA—but barely, and based on trends, you aren’t going to 
be able to meet your SLA for more than a month or two.” 
From there, you can drill down into graphs and charts that give you more detail so that you 
can find the component or components that look like the current bottleneck, and start 
making plans to get more capacity in place before you miss your SLA. 
Summary 
Embracing the past to make a better future—that’s been the theme of this chapter. 
Whether you’re gathering ticket‐resolution information so that it can be used to solve 
future problems more quickly, or gathering performance information so that you can 
establish expectations and predict capacity, it’s all about keeping historical data and 
leveraging it to put the organization on a better footing for tomorrow. 
Coming Up Next… 
In the last chapter of this book, we’re going to step all the way back to the beginning and 
look at unified management from a case study perspective. I’ll use my consulting and field 
experience to construct a composite case study, drawing elements of unified management 
together to show you what a modern, truly‐unified environment can look like. I’ll share 
specific problems from each environment, and explain how unified management helped 
solve those problems more quickly and effectively. 
   
Creating Unified IT Monitoring and Management in Your Environment          Don Jones 
 
74
Chapter 6: Unified Management, 
Illustrated 
In this final chapter of the book, I want to revisit everything from the first five chapters. 
However, I’m going to do so in the form of case studies. I’ve been fortunate enough to speak 
with several consulting clients of mine who’ve been struggling with the same issues I’ve 
outlined, and who’ve recently been trying solutions that follow the basic approach I’ve 
described. They’ve agreed to let me share their stories (although they’ve asked that I not 
use their names or company names) so that you can get a before‐and‐after look at how this 
“unified management” thing should work. Along the way, I’ll also share some of the 
challenges and roadblocks they’ve encountered. A switch to unified management isn’t 
always going to be hassle‐free, so I think it’s valuable for you to see what they’ve had to 
deal with, and how they think they’re going to do so. 
This chapter will also include some of the practical information on unified management 
that hasn’t made it into the previous chapters. I’ll provide a consolidated shopping list of 
unified management features so that when you start examining solutions, you can have that 
list in hand to help you. I’ll also look at different purchasing models that vendors are 
offering these days to give you an idea what kind of flexibility you might have for acquiring 
and implementing a solution. 
The Case Studies 
A unified management solution has to provide features for what I believe are two distinct 
broad use cases. The first is in helping you to react to problems, while the second helps you 
manage non‐problem requests—such as requests for changes within the environment. I’m 
going to provide two distinct stories for each of these. They’re actually both drawn from the 
same consulting customer, although you’ll meet different people from those organizations 
in each narrative. 
Detecting and Solving Problems 
Lisa is a senior systems administrator, responsible primarily for the Windows‐based 
systems in her environment. Her counterpart, Peter, is responsible for the company’s Unix‐ 
and Linux‐based server infrastructure. Both have considerable areas of overlapping 
responsibility, as many of the company’s line‐of‐business (LOB) applications rely on both 
Windows‐ and *nix‐based resources. 
 
Creating Unified IT Monitoring and Management in Your Environment          Don Jones 
  75
 
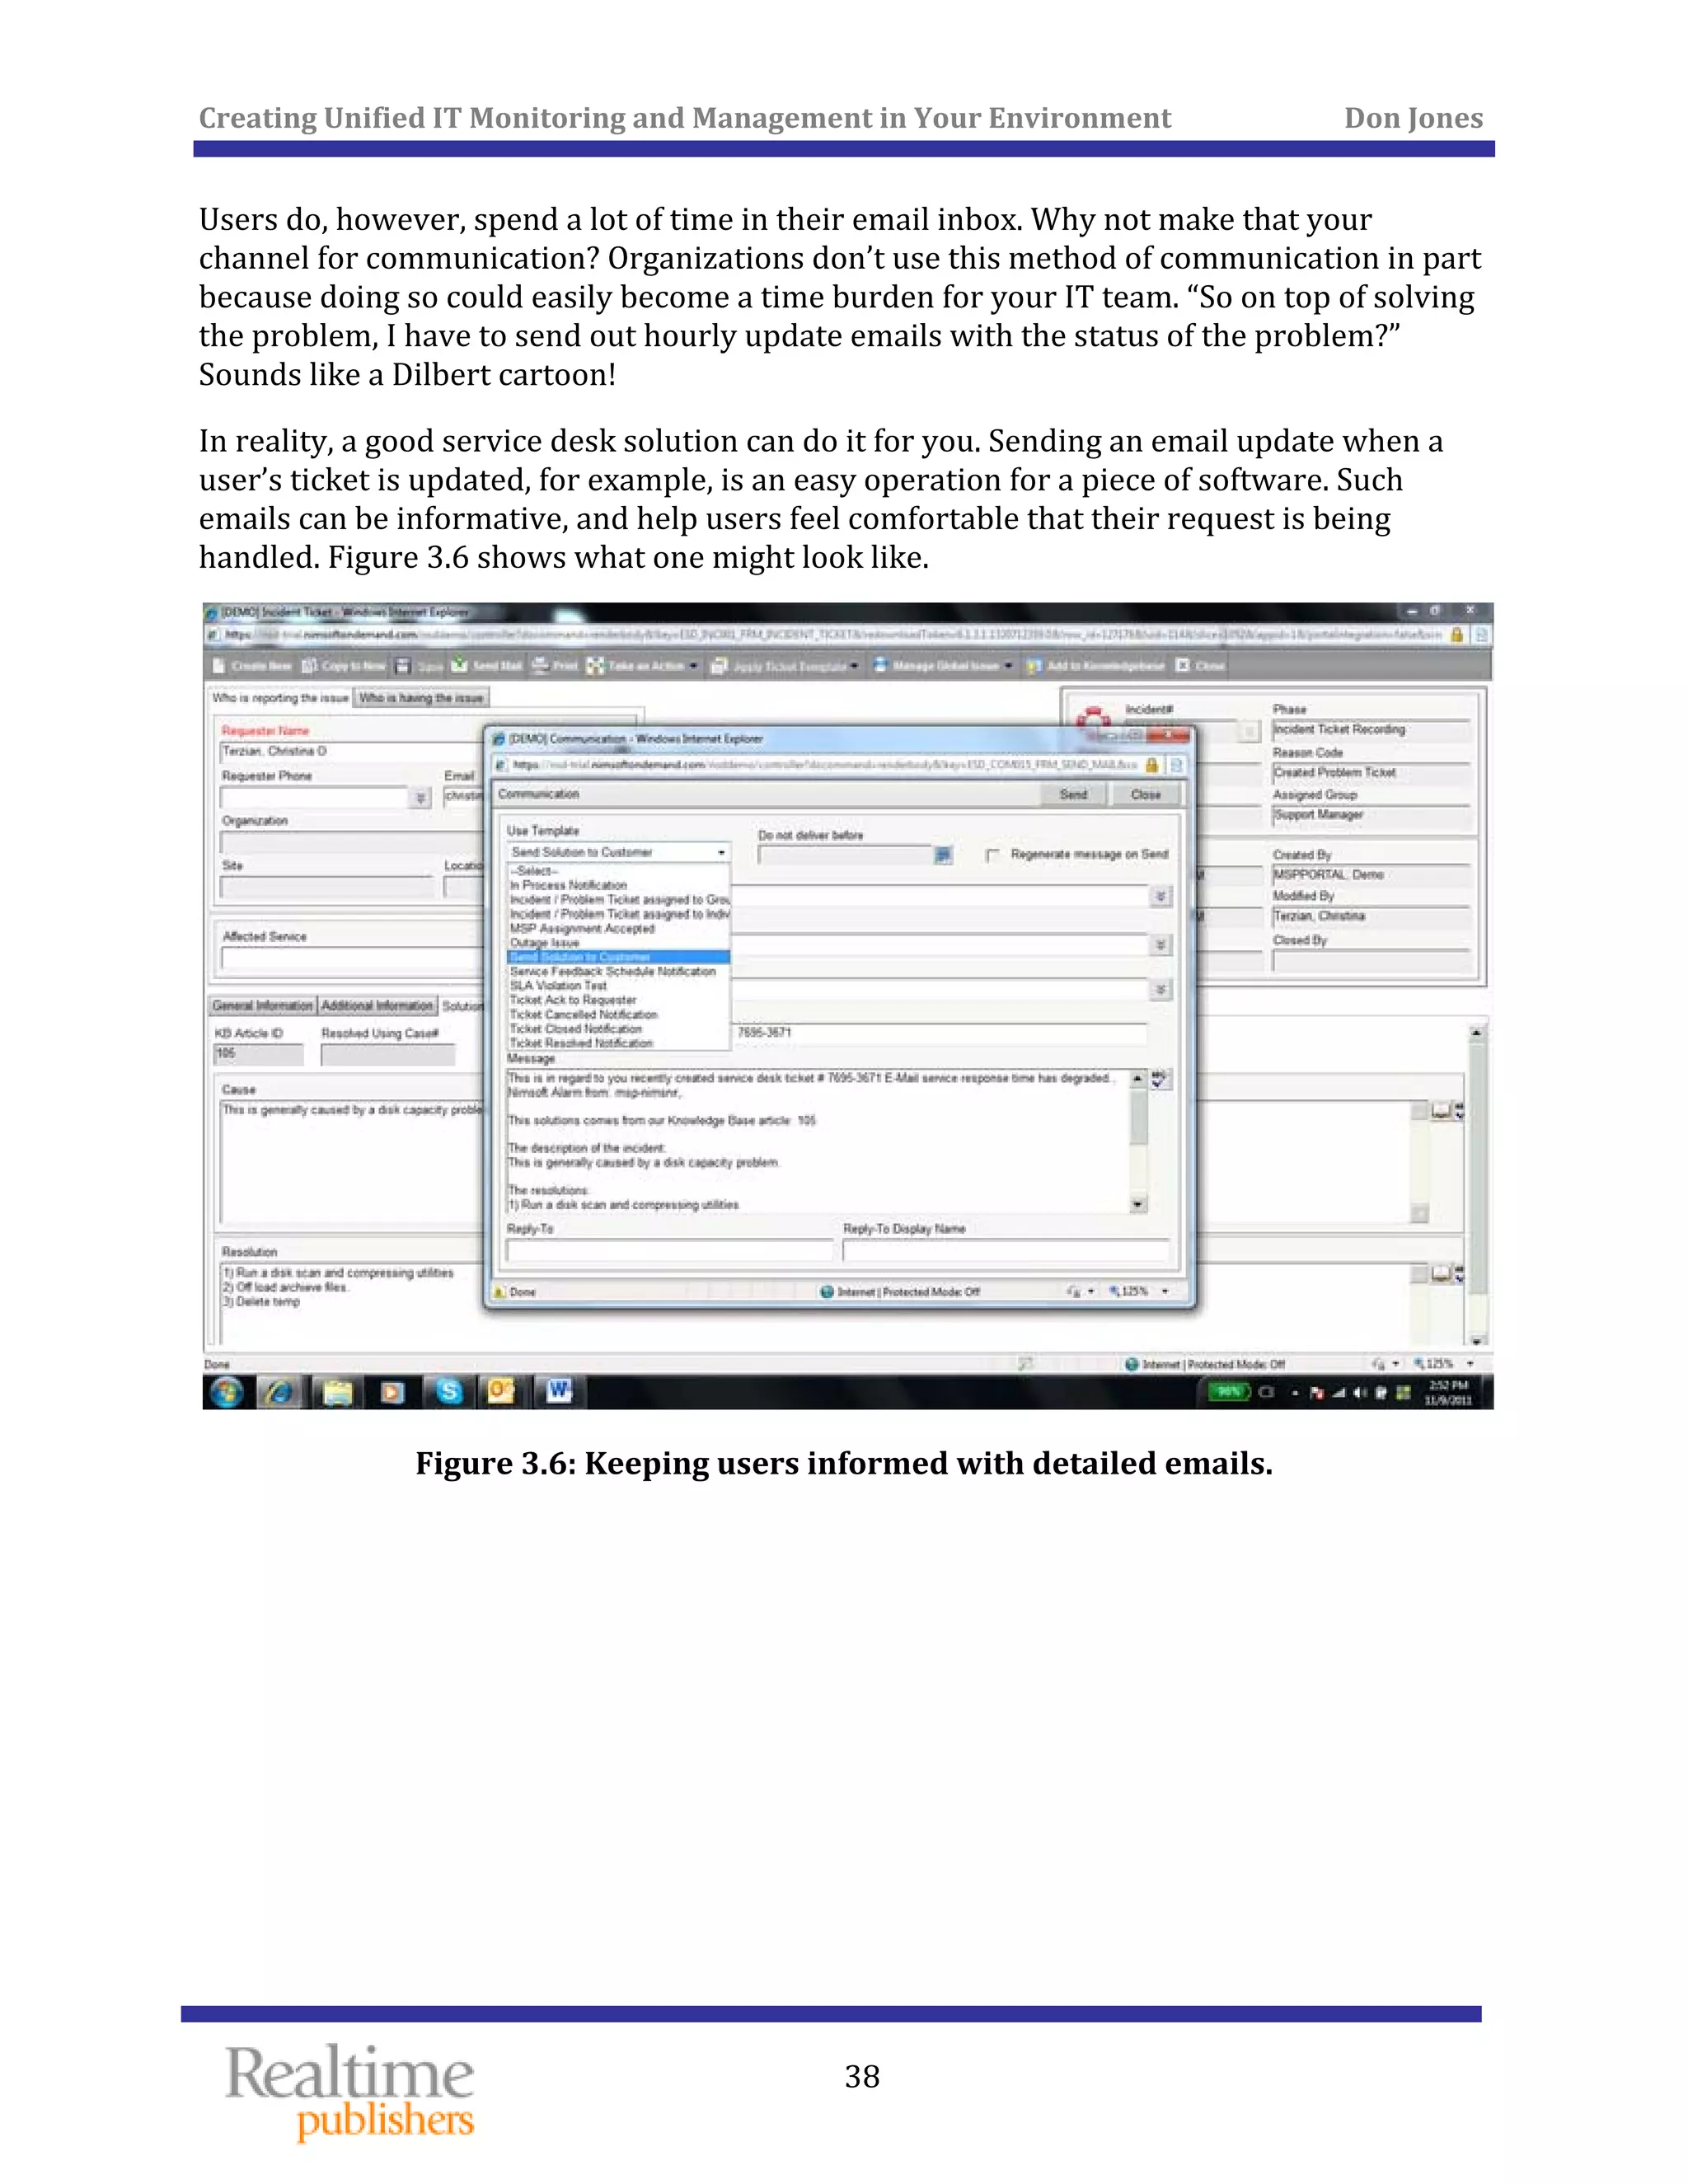
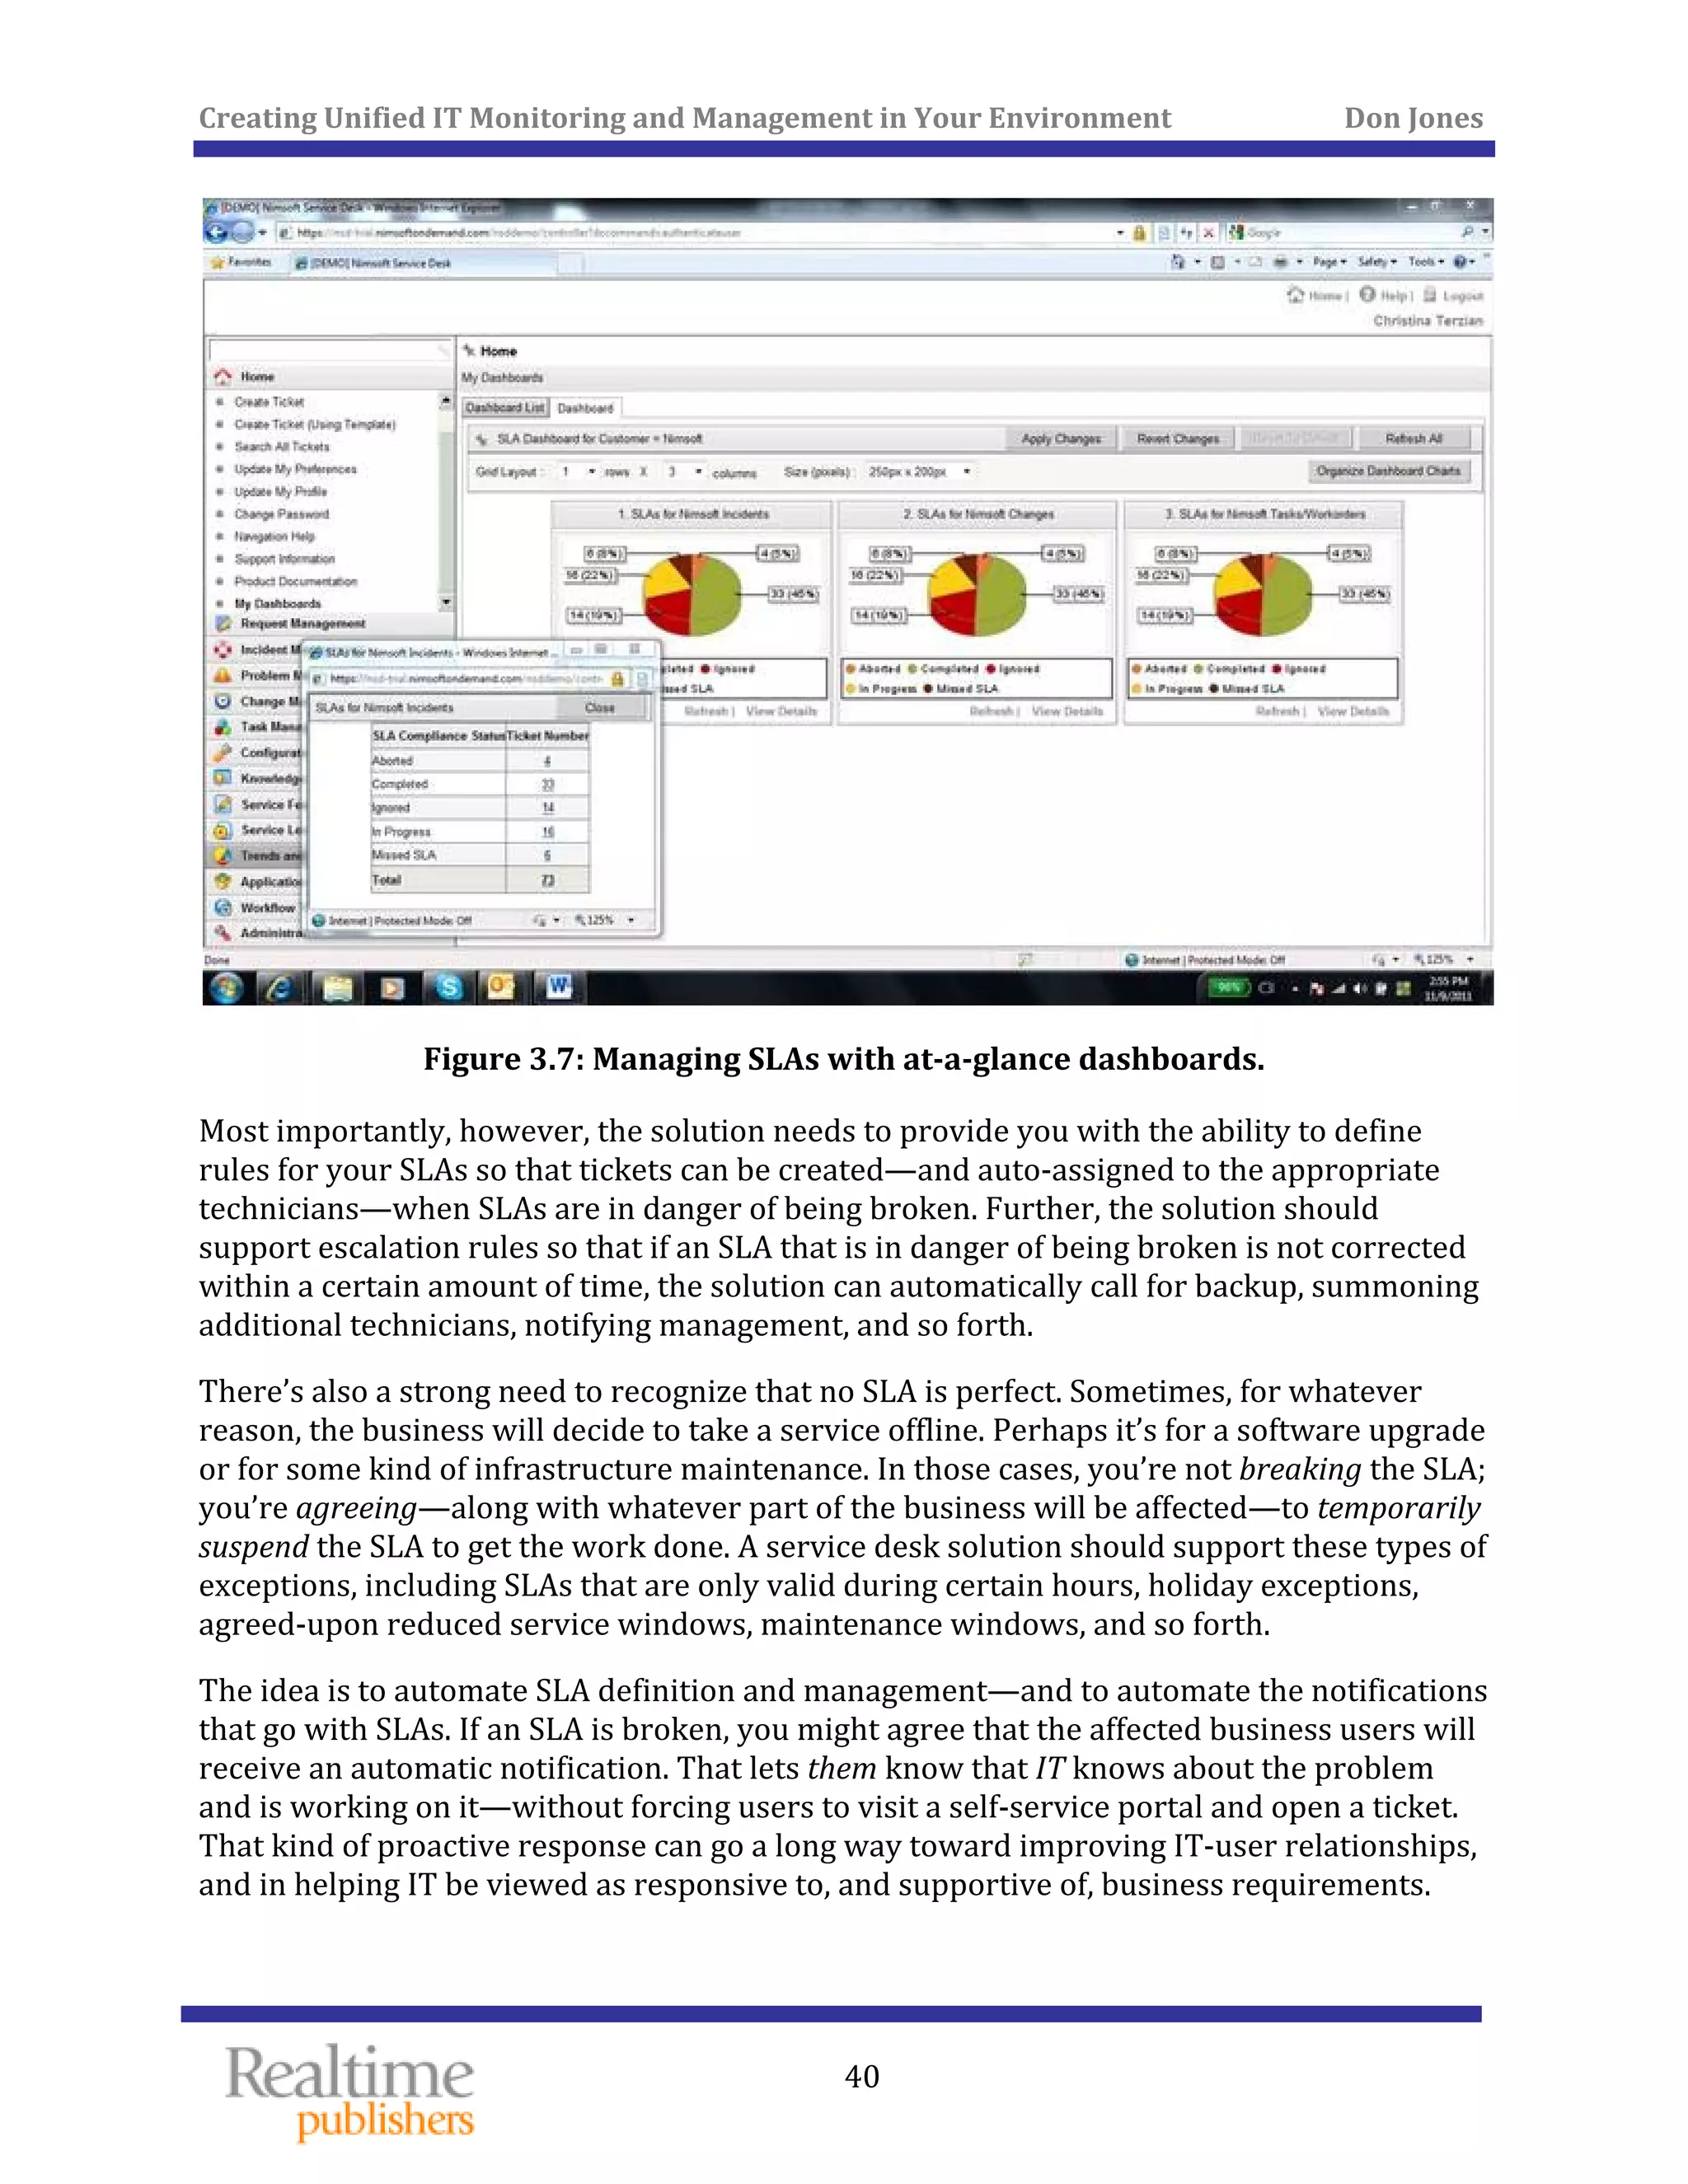
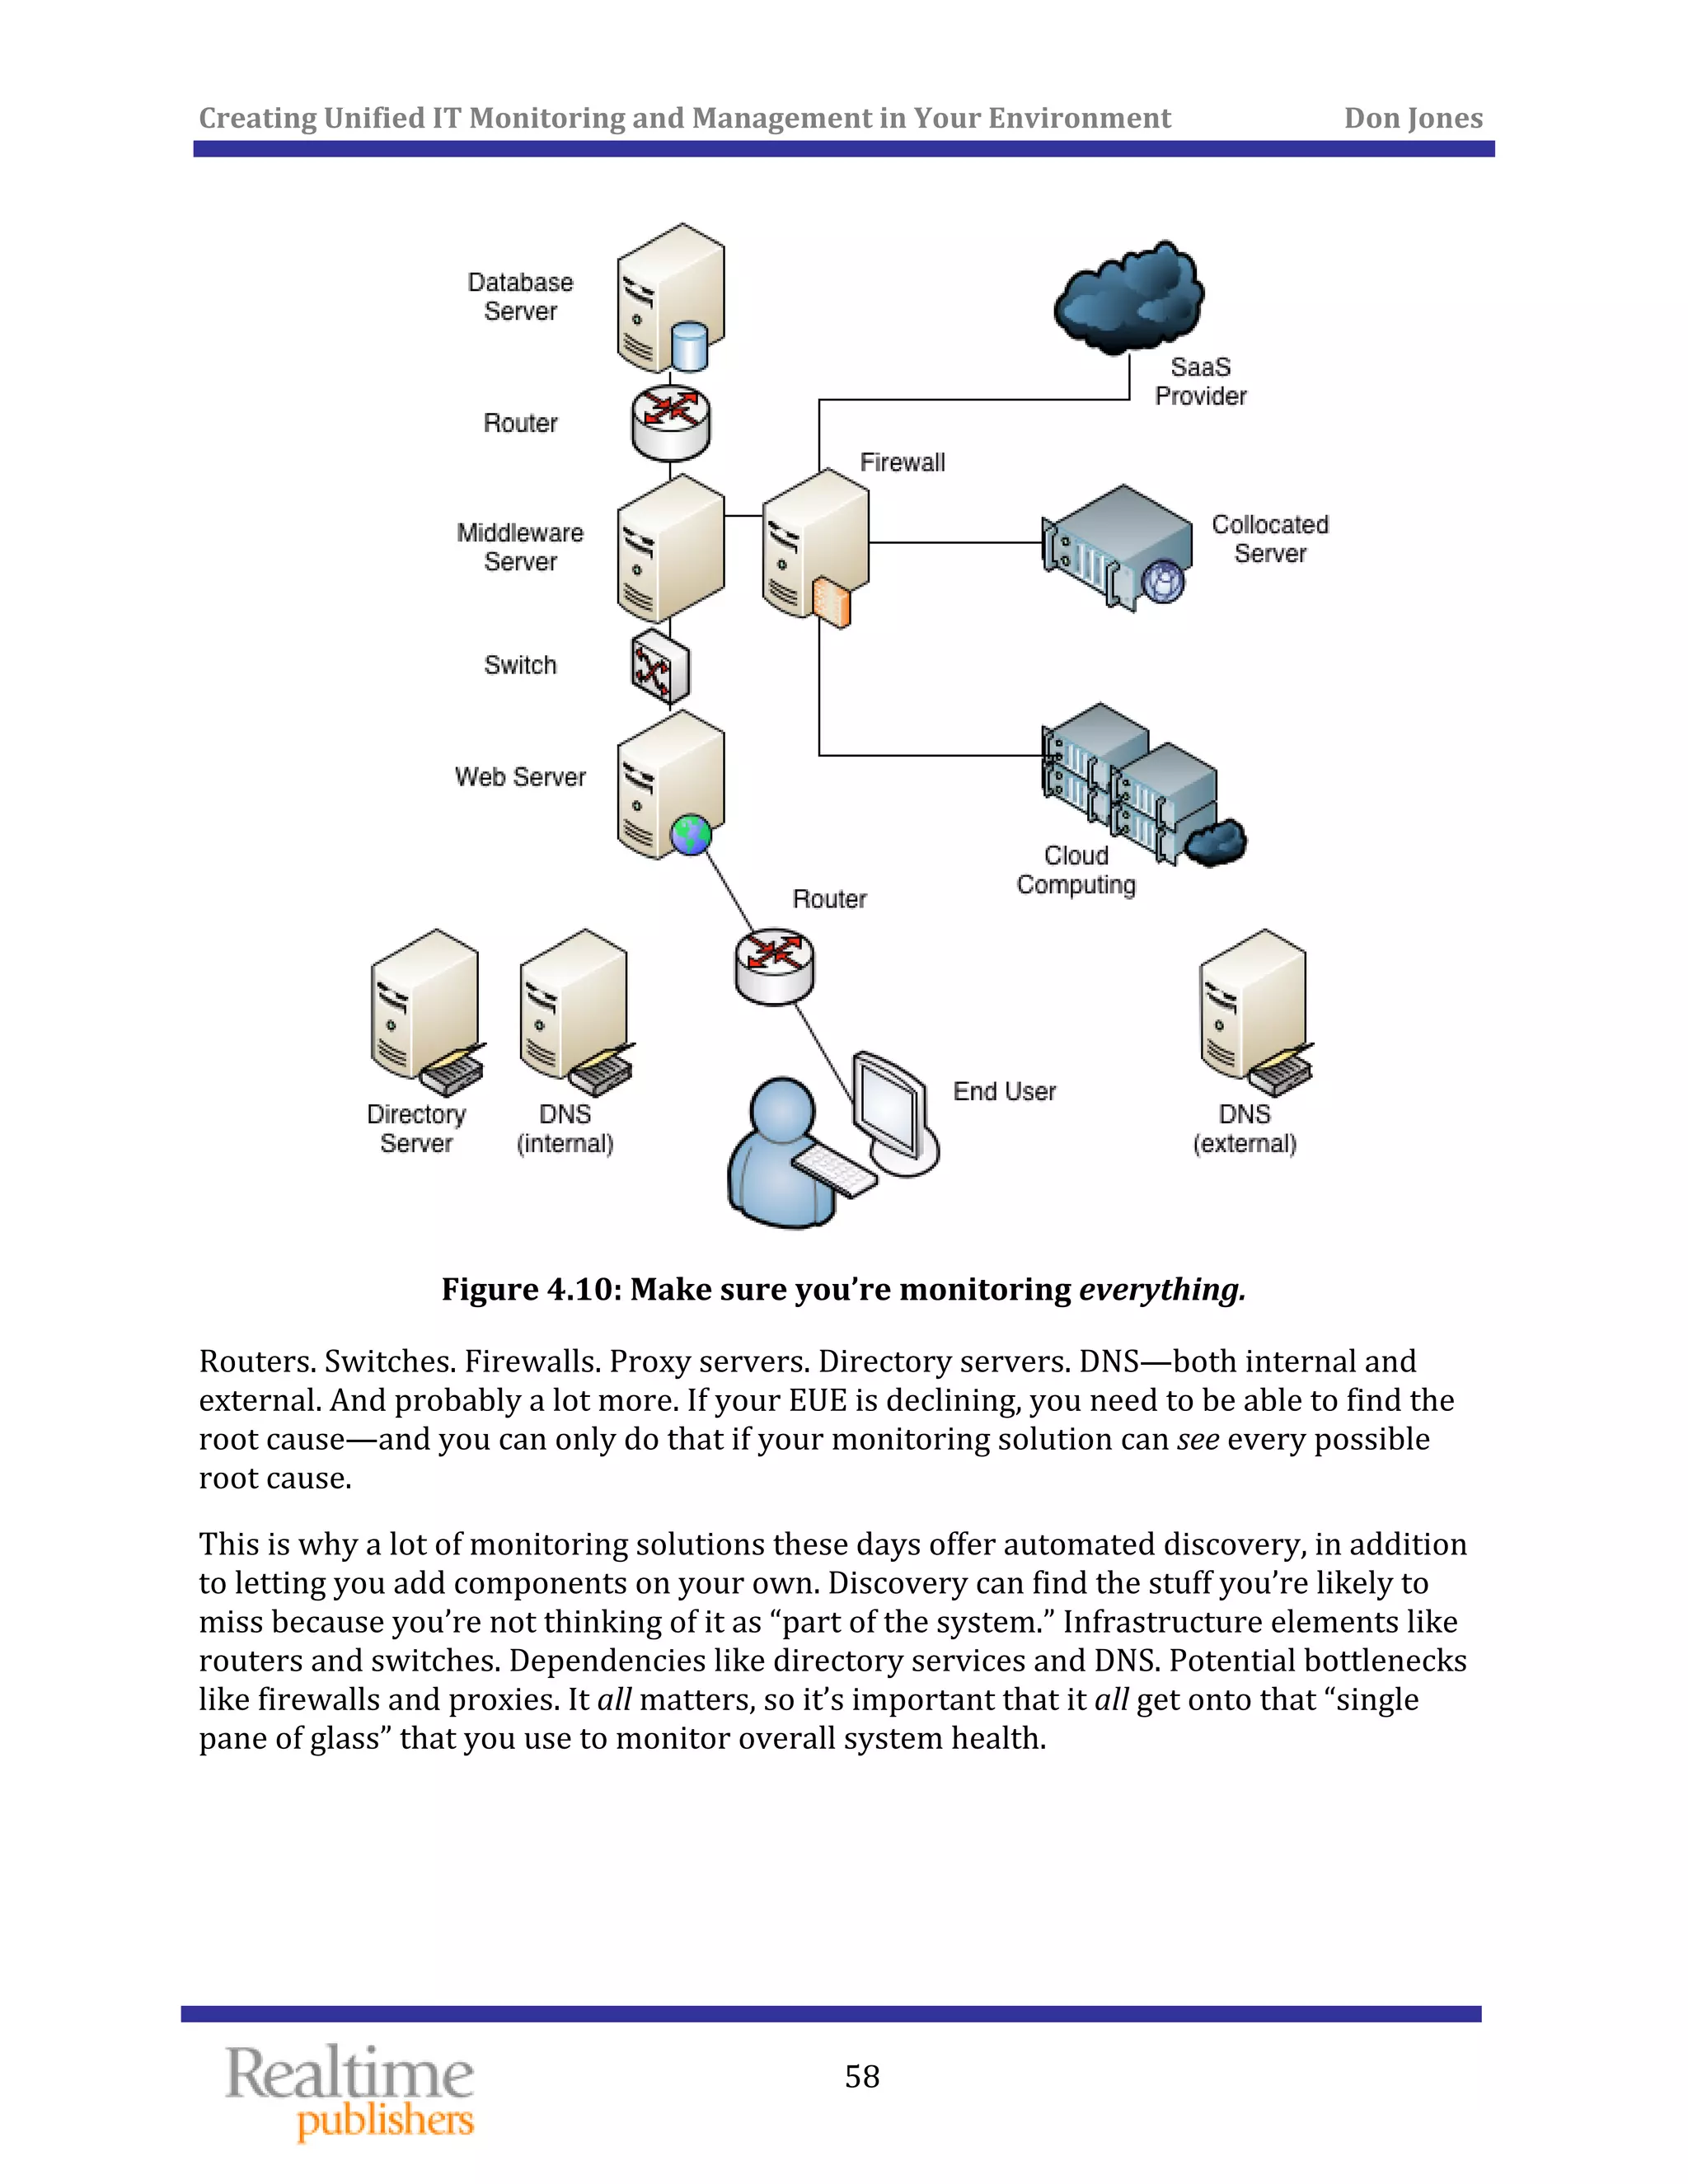
“It isn’t just the servers, of course,” Lisa told me. “It’s what’s running on those servers: 
databases, Web services, you name it. Someone else supports those different pieces, so 
there used to be a lot of time spent arguing about whose fault something was.” 
I asked her for an example of how things worked in their environment prior to 
implementing a unified management system. She laughed and brought out a file that she’d 
clearly held on to for some time. It looked like the text from a Help desk ticket’s notes. 
Here’s the complete text, with names edited; I’ve added some [editorial] notes for items 
that I had to ask Lisa to explain. 
OPENED BY HelpDesk AT 2009‐06‐14 13:34 
User states that BOS [an LOB application] is extremely slow. Have several e‐
r BOSDB02 responding slowly to pings. mails about this in the q also. Serve
ASSIGNED TO LHarte [this is Lisa] 
NOTES BY LHarte AT 2009‐06‐14 15:26 
BOSDB02 is working fine, apart from the fact that SQL is hogging 100% of the 
CPU. Passing to DBA. 
ASSIGNED TO DShields 
NOTES BY DShields AT 2009‐06‐14 16:53 
Probably the indexes again, SQL is taking longer to complete queries than it 
 tonight should. Will schedule indexes to be rebuilt
NOTES BY HelpDesk at 2009‐06‐15 10:44 
Still getting calls on this 
NOTES BY DShields AT 2009‐06‐15 11:12 
Indexes rebuilt 
ASSIGNED TO HelpDesk 
NOTES BY HelpDesk AT 2009‐06‐15 11:34 
SDB02 is still slow to ping Still getting calls that BO
ASSIGNED TO DShields 
NOTES BY DShields AT 2009‐06‐15 13:12 
SQL is still slow—looks like it is in disk IO. Fragmented disk? Need server 
support. 
ASSIGNED TO LHarte 
NOTES BY LHarte AT 2009‐06‐15 13:47 
Server disk shows less than 2% frag—not the problem. IO is slow because 
s. Maybe your DB is fragged. I’ll call you. SQL is thrashing the disk
ASSIGNED TO DShields 
Creating Unified IT Monitoring and Management in Your Environment          Don Jones 
  76
 
The conversation clearly went offline at that point because the next entry simply indicates 
“problem resolved.” Unfortunately, there was no official documentation of what went 
wrong or what was done to fix it, but Lisa explained. “We kept going back and forth 
between us—he’d see something in Performance Monitor that looked like the server was 
slow, and bounce it to me, and I’d tell him that it’s because his SQL Server was causing the 
problem and bounce it right back. I don’t even have permission to look inside SQL Server, 
and he just kept wanting to get the ticket out of his queue. 
“In the end, it actually turned out to be a problem with the SAN, which was Peter’s problem. 
Something had gone wrong with our main SAN connection and we were on a slower 
backup link, and something was wrong with that link’s configuration, so it wasn’t running 
at full speed or something. We were seeing it as slow disk IO because Windows obviously 
thinks that the SAN is just one big locally‐attached volume. We were running all kinds of 
tests on the server and in SQL Server to try and find the problem, but none of our tools 
were able to realize that the real problem was further under the hood someplace.” 
Peter recalled the incident. “It was weird because there wasn’t anything actually broken, so 
none of the tools I use to monitor the SAN gave off any alerts. The problem was a 
configuration problem on several of our hosts. The tools don’t see that as broken, of course, 
although it was causing them to access the SAN a lot slower than they’re used to. 
“The real problem was that this cropped up on about seven machines all at once. We didn’t 
correlate the problem at first, because every single machine was affected slightly 
differently because they all use the SAN for different purposes. There’s only one major 
database on that SAN, but there’s a small Web farm and a file server. So the symptoms the 
users saw were different, and the problems were all routed to different people to handle. It 
was the file server guys who brought the problem to me. They saw the disk queue length 
going up pretty dramatically, and they knew that had to be the SAN, so I got involved.” 
“That was the problem we dealt with all the time back then,” Lisa said. “We all focused 
specifically on the bit we were responsible for, but these days there are so many 
interactions and dependencies that we can’t see from a tool level that we’d get all tied up 
when a problem happened.” 
I also spoke with Kevin, who manages the company’s Help desk. He says those types of 
problems were especially trying for his team because users would keep calling and the 
Help desk had no idea what was related and what wasn’t, or what the status of anything 
was. “Users would call in with something that sounded new to whoever answered the 
phone, so they’d open a new ticket. We were probably slowing down whoever was trying to 
fix the problem just by loading new tickets on them for the same problem. But we had no 
real communication. If you answered the phone, you looked to see if there was an open 
ticket on anything that sounded similar. But there was no one place where we kept track of 
all the currently‐open problems. I finally just had a white board installed in the Help desk 
office, and outstanding problems would get written up there. So when a call came in you 
could at least look to see if the problem was already open, then look up that ticket to see 
what was happening and give some status to the user on the phone.” 
Creating Unified IT Monitoring and Management in Your Environment          Don Jones 
  77
 
I asked Lisa how things worked now, after the company had implemented a unified 
management system. “We’ve been on it for about a year now,” she told me, “and it’s 
completely different.” She showed me a ticket for a problem that had occurred recently. 
“This is what we see, now.” 
ALARM 2011‐06‐14 12:13:42 
NODE Windows Server BOSDB02 
SQL Server Instance DEFAULT 
erver response time exceeds threshold SYMPTOM: SQL S
IP: 10.10.15.212 
SQL Server database shows 34% free 
SQL Server fragmentation shows <5% 
Disk queue length <1 
Network utilization <40% 
CPU utilization <60% 
Memory utilization <75% 
RELATED ALARM 2011‐06‐14 12:10:52 
NODE Router MBS3667 
Interface fault 
“Just looking at that, I can start to guess what the problem is.” She showed me the 
monitoring console that the entire IT team now worked from, which looks similar to Figure 
6.1. “You can see that it’s basically a network diagram. It shows the servers and the services 
they run, but it also shows things like routers and switches. So when a server alarms, it’ll 
also look for alarms on any dependencies, like a router. In this case, we had a router 
interface that was going bad and starting to drop packets. That triggered an alarm right 
away to the router guy, but it also alarmed all of the servers that use that router to 
communicate because clients—and the monitoring system—saw the servers’ response 
times go up. Just having that data in front of us saves a ton of time testing for problems. The 
system basically runs a series of basic checks whenever there’s a problem, so it gets those 
preliminary steps out of the way for us.” 
Creating Unified IT Monitoring and Management in Your Environment          Don Jones 
 
78
 
Figure 6.1: Tracing alarms visually. 
She said the team spends a lot less time passing problems back and forth because it’s 
k. usually much clearer where the problem lies when the system is looking at the entire stac
“This is huge when the problem is actually outside the data center. We have a number of 
applications that interface with SalesForce.com, and whenever those guys have a problem, 
or more commonly when our ISP gets a little slow, our users see it as ‘our’ application being 
slow. But the monitoring system knows about the dependencies, and it’s usually already 
alarmed us. We’ll post a message about the affected applications on our end, and start 
calling the service provider to log a ticket with them.” 
 
Creating Unified IT Monitoring and Management in Your Environment          Don Jones 
  79
 
Posting a message, Kevin says, has helped the Help desk tremendously. “We have this Web 
portal where users can log tickets, and current system status is shown right there. So 
before they even open a ticket, they can see that we know there’s a problem. Once we 
trained them to trust us on that, they stopped logging duplicate tickets.” 
He admits that the training was a big step. “We didn’t do it initially,” he said, “but once 
users realized we were being pretty honest and consistent about posting problems, they 
started to trust us more. We had a big communications effort, and now there’s even a 
mailing list users can add themselves to so that they get a message whenever a system they 
use is affected. Being proactive cuts back on the Help desk volume a ton.” 
The benefits of a unified management system were pretty clear for this team: faster time to 
resolution, less passing the buck, and more proactive communications with their end users. 
The biggest challenge they faced? 
“A trust thing,” Lisa told me. “We had to learn to trust this new system to monitor 
everything as well as we could with the tools we were familiar with. So the first few times 
things went wrong, we went right back to what we knew to troubleshoot the problem. Once 
we realized that we were seeing the same data, we started trusting the new system more, 
and just started relying on it. We’ll still dig out the old tools if we have to dive deep into an 
affected system, but by the time we do that we know the problem is in that system, so we’re 
not wasting time. You don’t pass the buck to someone else at that point, you stay in that 
problem area until you spot the problem.” 
Fulfilling User Orders 
Kevin provides the link to the other side of the unified management story. “We’re not just 
responsible for opening tickets for problems. We also open tickets when routine changes 
need to be made.” I asked him to give me an example of how this was handled prior to the 
implem , and he pulled out an archived ticket. entation of their unified management system
OPENED BY HelpDesk AT 2010‐08‐12 15:50 
User BDOUDS needs a new SharePoint site deployed as 
iversitybid. User will be site admin. intranet/projects/un
ASSIGNED TO JHoltz 
NOTES BY JHoltz AT 2010‐08‐13 08:27 
Sent e‐mail to Bill’s manager confirming. Also sent e‐mail to Special Projects 
confirming. 
NOTES BY JHoltz AT 2010‐08‐16 11:12 
waiting to hear from Special Projects. Bill’s manager, KHICKEY, confirms. Still 
NOTES BY JHoltz AT 2010‐08‐18 11:05 
eft VM. Still waiting to hear from Special Projects. L
NOTES BY HelpDesk AT 2010‐08‐20 10:34 
User is asking for status. 
Creating Unified IT Monitoring and Management in Your Environment          Don Jones 
 
80
NOTES BY JHoltz AT 2010‐08‐20 11:34 
Tell him to call Special Projects. I just need them to confirm since this comes 
out of their budget. 
NOTES BY JHoltz AT 2010‐08‐22 13:11 
d BDOUDS as site owner. Special Projects confirmed. Set up site and assigne
STATUS SET TO RESOLVED AT 2010‐08‐22 13:12 
“That kind of thing went on all the time. Someone would call us asking for some access or 
whatever. We’d assign the ticket to someone in IT, but then they’d spend time figuring out 
who was responsible. We used to have a big book,” he added, pointing to a thick three‐ring 
binder on his shelf, “that told us who was responsible for pretty much everything. Then 
you’d wait and wait to hear back from them. This one took, what, two weeks to resolve? 
That’s insane, and the whole time the user is calling us to check on the status, when we’re 
eff 10 minutes to do once he got approval.” not the ones holding things up. This took J
And in the world of unified management? 
“It’s actually pretty cool,” Kevin said. “Now we have a big online catalog with everything a 
user might want. It’s kind of like an online store. They submit their request through there, 
and the system opens a ticket automatically. But each item is associated with a workflow, 
so IT doesn’t even hear about it until the ticket has been routed through the proper 
approvers and been approved. Once we see it, it’s a done deal, so we just implement it. For 
some things, we’re even implementing scripts that do the implementation for us, so it’s 
completely hands‐off.” The organization worked out, and documented, the desired 
workflows for each possible product. Kevin provided an example of that documentation, 
shown in Figure 6.2. “This kind of documentation is important because we worked off of 
this to implement the workflows. The business owners can come up with these flowcharts 
on their own, then we just implement them on the designated products in the catalog.” 
 
Creating Unified IT Monitoring and Management in Your Environment          Don Jones 
 
81
 
Figure 6.2: Documented workflow used to drive automated review/approvals for 
catalog requests. 
 
Creating Unified IT Monitoring and Management in Your Environment          Don Jones 
  82
 
We were discussing access permissions as an example, so I asked what happened when 
those needed to change. “They never did,” Kevin admitted. “Once you had access, you 
usually kept it until you left the company. We just didn’t keep track of it. Now, the catalog 
keeps track of it. If you don’t need something, you ‘return’ it to the store, it goes through 
whatever approvals, and we get a ticket to remove your access. Different managers also 
have to occasionally complete an attestation, which is where they review who has access to 
their resources and let us know if anyone needs to be removed, or if everyone can stay. 
We’re not the gatekeepers anymore.” 
I noted that an automated workflow wouldn’t necessarily guarantee a speedy response 
time. “Oh, users still have to wait two weeks for approvals, sometimes. But when they 
submit their request through the catalog, they can check the status of that request on their 
own. They can see that it hasn’t made it to us, and they can take it on themselves to bug 
their manager or whatever. We’re totally out of the loop until it’s approved, and they know 
that, because the request shows it hasn’t even made it to us yet.” Such a system does a 
better job of keeping users informed, and helping them to understand what’s really holding 
things up. 
A Shopping List for Unified IT Management 
I want to use this section to present a list of what I believe are the must‐have features of a 
true unified management system. As you’re evaluating solutions, make sure they offer 
these features—and make sure the features operate in a way that makes sense for your 
environment’s needs. 
• Workflow. Unified management solutions should offer workflows that can help 
automate responses and service management. Workflow construction should be as 
drag‐and‐drop as possible, involving as little programming as possible. 
• Agents. I know there’s a huge divide between people who are fine with deploying 
agents, and those who hate the idea; I’d suggest looking for a solution that supports 
both models. Agentless data collection is fine in some instances, although it can offer 
less performance and coverage than an installed agent. I think a hybrid approach is 
probably best for most organizations, and unified monitoring solutions ought to 
support that. 
• Alarm integration. When a problem arises, a unified management solution should 
obviously tell the designated individuals; it should also open a Help desk ticket and 
automatically search for related alarms from the past. Doing so will help speed up 
the time to resolution. This kind of “knowledge automation” is really crucial. 
• Approvals. As I’ve pointed out, “tickets” aren’t always for problems—sometimes 
they’re for new work, like change requests. A unified management system should 
support a review/approval workflow for these requests so that IT can be taken out 
of its traditional “gatekeeper” role and instead simply work those tickets that have 
been approved for implementation by the business. 
Creating Unified IT Monitoring and Management in Your Environment          Don Jones 
  83
 
• Discovery and deployment. A unified management solution should help you 
discover manageable nodes and services and deploy any necessary agents to 
monitor them. This discovery should happen more or less continuously, or at least 
be able to be run regularly, so that changes to your environment can be captured. 
• Routing. Tickets—whether for problems or for requests—should be automatically 
routed based on custom business rules that you can define. In other words, tickets 
should head straight to the correct implementer as quickly as possible. 
• Scheduling. A unified management system should have some kind of internal 
calendar that lets you schedule maintenance tasks. This functionality helps to 
resolve maintenance window conflicts and schedule work to happen at the right 
time. 
• Catalog. This is a key part of making a unified management solution part of a self‐
service, managed system. In addition, a catalog helps work toward bringing process 
compliance—such as ITIL compliance—into your environment. A catalog provides 
users with a list of “orderable products,” not unlike shopping at an online Web host. 
Users’ “purchases” translate into tickets, which go through review/approval prior to 
being passed to IT for implementation. 
• Communications. Users need to be able to submit requests, and users and your team 
must be able to review them from a familiar place. A Web portal is the traditional 
way to enable this communication, but systems that can integrate via users’ 
inboxes—which they’re in all the time, anyway—is even better. 
• Interface. You can’t have too many interfaces into a unified management system, 
and whatever solution you pick should offer both Web‐based and mobile‐friendly 
versions of its UI. 
• Metering. If you’re monitoring actual paying customers, you’ll need the ability to 
charge them for what they use. Even if you’re just dealing with internal “customers,” 
being able to perform “charge backs” for their IT resource consumption is going to 
be critical as business managers advance their management strategies. There’s no 
reason for IT to be seen purely as overhead when resources can—and should—be 
tracked back to the business components that are consuming them. 
• SLAs. A unified management system should assist you in both defining and 
monitoring service level agreements (SLAs) based on actual historic trends. 
• Trends. A unified management solution should include a performance database that 
lets you track historical performance trends. This database can be used to help 
define and report on SLAs as well as perform capacity planning. 
• Surveys. Closing the loop with your end users is crucial because technical SLAs 
aren’t the only way your success is being measured, whether you know it or not. 
Being able to poll users helps you define SLAs in their terms, creating more 
appropriate expectations. 
Creating Unified IT Monitoring and Management in Your Environment          Don Jones 
  84
 
• Reports. Look for reports and dashboards that provide managerial‐ and executive‐
level views of items such as workload, SLA compliance, and so forth. Heck, even 
dashboards that can be exposed to end users, helping them see that the 
environment is performing as it should, can go a long way toward helping IT be seen 
as more responsive and engaged with the business. 
• Visualization. Being able to visualize your environment can help make root cause 
analysis and problem resolution faster and easier. 
• Everything in one place. As I’ve written several times in this guide, a unified 
management system’s primary value is unity, or the ability to get all your 
performance concerns into a single place, using a single set of metrics, alarms, 
identifiers, and so forth. This singular view helps to break down the traditional 
domain‐based “silos” that IT is built around, and gets everyone focused on the root 
cause of a problem more quickly. 
• Knowledge retention. A unified management system should help your organization 
retain critical knowledge by turning Help desk tickets into an automated, searchable 
knowledge base. 
• Pre‐loading information. When an alarm generates a ticket, that ticket should 
include whatever details the unified management system can provide: IP addresses, 
response times, and so forth. The more information included in the ticket, the less 
the responder has to go look up, and the sooner they can start working on resolving 
the problem. 
This list obviously isn’t comprehensive but provides a starting point. If a potential solution 
offers these features and meets your organization’s specific needs, that solution is probably 
worth looking at in detail during an evaluation. Make sure you gain not only a “check mark” 
on these features but also a detailed explanation of how they’re implemented. Also, ensure 
that the implementation is one that will work within your organization’s requirements. 
Ways to Buy Your Unified IT 
I want to briefly outline different approaches that vendors take for delivering unified 
management solutions. Let me emphasize up front that I don’t regard any of these as 
“right” or “wrong;” there’s merely “what’s right for you,” which you’ll need to decide on 
your own. 
Typically, you’ll find that solutions of this kind are priced based on the number of nodes 
you need to manage, possibly also incorporating the number of users in your organization. 
A “node” is typically defined as any manageable device: a router, a server, and so forth. 
Some vendors are more creative than others with this portion of their licensing model; 
don’t let a complex model scare you off. In some cases, more complex license models are 
actually to your benefit because vendors are trying to precisely accommodate a wide range 
of scenarios. You should be more concerned about what you’re licensing. 
Creating Unified IT Monitoring and Management in Your Environment          Don Jones 
  85
 
For example, at one end of the spectrum, you’ll find what I call monolithic solutions. With 
these, you get—and pay for—every feature that the vendor offers, regardless of which ones 
you’ll need right away. I think it’s hugely important to make sure you’re acquiring a 
solution that can do everything you want, although I’m not sure you necessarily want to 
pay for all of that up front. In some cases, you may want to implement a solution in a 
phased approach, licensing just the functionality you need for each phase, thus allowing 
yourself to kind of “ramp up” into the full licensing and functionality of a product. The nice 
thing about monolithic solutions is that they’re often well‐integrated because everything is 
u in a single piece. delivered to yo
There are also pluggable frameworks. I tend to view big frameworks like HP OpenView as 
fitting into this kind of model. With these solutions, you buy a base product, then add in the 
various bits and pieces you need to speak to your environment. These models offer a ton of 
flexibility, of course, and if you’re going with a big enough vendor, you should be able to 
find plug‐ins for every bit of functionality you need. These solutions run the risk of 
becoming a massive do‐it‐yourself project, though, and the plug‐ins aren’t always as well‐
integrated as you might like. Licensing can also be really, really complex because you’re 
g‐ins separatoften licensing the plu ely from the base framework. 
Another model is the pay as you go approach. With this model, the solution offers all the 
functionality you might ever need, but you don’t “switch it all on” right away. Instead, you 
turn on the modules, or functionality, that you need immediately, and you just pay for that. 
As you add more responsibility to the solution, you pay a bit more. This setup is a bit more 
like a “cloud” model, where you can grow as large as you like but only pay for what you 
need right now. You’re not typically dealing with plug‐ins, or if you are, they’re usually all 
. delivered by the same solution vendor. I’m seeing more clients considering this approach
The last thing you’ll need to think about is where the solution will live. In this age of “the 
cloud,” you actually have a choice of hosting your monitoring and management solution in 
your own data center or simply purchasing it as a hosted service that lives in the vendor’s 
data center. Either way, the vendor’s agents get installed into your environment. I won’t dig 
into the “on‐premise versus hosted” debate; you probably know what’s right for you, and 
you can certainly discuss that option with whatever solution vendors you’re investigating. 
Regardless which side of that debate you’re on, I think it’s nice to have a solution that offers 
both options. 
Conclusion 
Where, there you have it: unified management. The overall idea behind this book was 
simple: really focusing on the straightforward theme of “get everything in one place, and 
get everyone on one page.” It’s only “revolutionary” compared with the disjointed approach 
that our existing technology tools have more or less forced us into. 
Creating Unified IT Monitoring and Management in Your Environment          Don Jones 
  86
 
Of course, I don’t expect you to just rush right out and start switching over to a new 
monitoring and management framework. These things can be done in small steps so that 
they create less impact on your organization and allow you to learn to use various 
techniques and features properly in an organic, rather than disruptive, fashion. 
The goal should be there: Stop wasting time with the back‐and‐forth and instead get 
yourself onto a single pane of glass for your organization’s top‐level monitoring. Integrate 
that with a Help desk system that lets you keep everyone informed and gives you the 
 need to analyze your IT performance objectively. metrics you
Good luck. 

E book creating-unified-it-monitoring-and-management-in-your-environment-chap-1-6