
More Related Content
What's hot
What's hot (20)
Similar to DTZ+Property+Times+Jakarta+Q3+2014
Similar to DTZ+Property+Times+Jakarta+Q3+2014 (20)
DTZ+Property+Times+Jakarta+Q3+2014
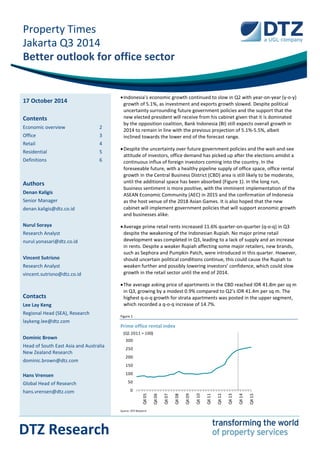
- 1. Property Times Jakarta Q3 2014 Better outlook for office sector DTZ Research 17 October 2014 Contents Economic overview 2 Office 3 Retail 4 Residential 5 Definitions 6 Authors Denan Kaligis Senior Manager denan.kaligis@dtz.co.id Nurul Soraya Research Analyst nurul.yonasari@dtz.co.id Vincent Sutrisno Research Analyst vincent.sutrisno@dtz.co.id Contacts Lee Lay Keng Regional Head (SEA), Research laykeng.lee@dtz.com Dominic Brown Head of South East Asia and Australia New Zealand Research dominic.brown@dtz.com Hans Vrensen Global Head of Research hans.vrensen@dtz.com Indonesia’s economic growth continued to slow in Q2 with year-on-year (y-o-y) growth of 5.1%, as investment and exports growth slowed. Despite political uncertainty surrounding future government policies and the support that the new elected president will receive from his cabinet given that it is dominated by the opposition coalition, Bank Indonesia (BI) still expects overall growth in 2014 to remain in line with the previous projection of 5.1%-5.5%, albeit inclined towards the lower end of the forecast range. Despite the uncertainty over future government policies and the wait-and-see attitude of investors, office demand has picked up after the elections amidst a continuous influx of foreign investors coming into the country. In the foreseeable future, with a healthy pipeline supply of office space, office rental growth in the Central Business District (CBD) area is still likely to be moderate, until the additional space has been absorbed (Figure 1). In the long run, business sentiment is more positive, with the imminent implementation of the ASEAN Economic Community (AEC) in 2015 and the confirmation of Indonesia as the host venue of the 2018 Asian Games. It is also hoped that the new cabinet will implement government policies that will support economic growth and businesses alike. Average prime retail rents increased 11.6% quarter-on-quarter (q-o-q) in Q3 despite the weakening of the Indonesian Rupiah. No major prime retail development was completed in Q3, leading to a lack of supply and an increase in rents. Despite a weaker Rupiah affecting some major retailers, new brands, such as Sephora and Pumpkin Patch, were introduced in this quarter. However, should uncertain political conditions continue, this could cause the Rupiah to weaken further and possibly lowering investors’ confidence, which could slow growth in the retail sector until the end of 2014. The average asking price of apartments in the CBD reached IDR 41.8m per sq m in Q3, growing by a modest 0.9% compared to Q2’s IDR 41.4m per sq m. The highest q-o-q growth for strata apartments was posted in the upper segment, which recorded a q-o-q increase of 14.7%. Figure 1 Prime office rental index 0 50 100 150 200 250 300 Q405 Q406 Q407 Q408 Q409 Q410 Q411 Q412 Q413 Q414 Q415 (Q1 2011 = 100) Source: DTZ Research
- 2. Jakarta Q3 2014 www.dtz.com Property Times 2 Economic overview Economic growth continues to slow Based on data from Statistics Indonesia, Indonesia’s GDP growth decreased slightly from 5.2% y-o-y in Q1 to 5.1% in Q2 (Figure 2). The slower y-o-y growth in Q2 can be attributed to slower investment and exports growth and a fall in government spending due to the delay in the disbursement of social assistance funds. Going forward, however, BI expects economic growth to remain moderate in Q3 while household consumption is lower, reflected by weaker retail sales and motor vehicle sales. Government spending is however expected to increase in H2, after a lower-than-projected budget absorption capacity in H1, due to the budget savings policy. Export growth was limited due to sluggish growth in economies worldwide while import growth continued to decelerate. At the end of Q3, the trade balance managed to record a surplus, primarily buoyed by a large non-oil/gas trade surplus. Looking ahead, non-oil/gas trade balance performance is expected to be bolstered by an increase in exports with the recommencement of mineral exports. On the other hand, with an improving domestic economic outlook, there continued to be a large influx of foreign capital. As of August 2014, foreign portfolio capital inflows to financial markets in Indonesia have reached USD14.4bn. BI decided to hold the benchmark interest rate stable at 7.50% at their meeting in September. Such policy is consistent with efforts to control inflation within the target of 3.5-5.5% in 2014 and 3.0-5.0% in 2015, as well as to reduce the current account deficit to a more sustainable level. Inflation eased in August to 4.0% from 4.5% in July, as post-Idul Fitri price pressures subsided, but went back up to 4.5% in September (Figure 3). Higher prices in September were due in part to higher administered prices related to energy subsidies. Core inflation (excluding administered prices and volatile foods 1 ), however, decelerated from 4.5% (y-o-y) in August to 4.0% (y-o-y) in September, as global commodity prices fell, domestic demand moderated and inflation expectations remained subdued. Indonesian Rupiah depreciated against USD in Q3 Both external and domestic factors contributed to the weakening of the Rupiah against the USD in Q3 (Figure 4). External factors stemmed from geopolitical uncertainties due to unrest in other parts of the world, moderating growth in the Chinese economy, as well as the possibility of acceleration in the Federal Reserve normalization policy. Domestic factors were closely related to the wait-and-see 1 Refers to inflation predominantly influenced byshocksin the foodstuffs category,such as harvests, disruptions from naturalevents or movements in domestic food commodity prices and international food commodity prices. attitude of investors concerning future government policies, including policies related to energy subsidies. It may take some time for President-elect Joko Widodo to be able to enforce his power, as it is not clear if he is able to garner the support from his cabinet which is dominated by the opposition coalition. However, BI is mindful to control the volatility of IDR current exchange rate and has promised to maintain the stability of the Rupiah in accordance with its fundamental value. Figure 2 GDP growth rate and BI rate -2% 0% 2% 4% 6% 8% Q211 Q311 Q411 Q112 Q212 Q312 Q412 Q113 Q213 Q313 Q413 Q114 Q214 GDP growth (q-o-q) GDP growth (y-o-y) BI rate Source: BI, Statistics Indonesia, DTZ Research *Q3 14 GDP growth figures are not available yet. Figure 3 Inflation rate 0% 1% 2% 3% 4% 5% 6% 7% 8% 9% Q311 Q411 Q112 Q212 Q312 Q412 Q113 Q213 Q313 Q413 Q114 Q214 Q314 Source: Statistics Indonesia, DTZ Research Figure 4 Rupiah exchange rate, IDR per USD 6,000 8,000 10,000 12,000 14,000 Q311 Q411 Q112 Q212 Q312 Q412 Q113 Q213 Q313 Q413 Q114 Q214 Q314 Source: BI, Statistics Indonesia, DTZ Research
- 3. Jakarta Q3 2014 www.dtz.com Property Times 3 Office Surge in foreign investments boost office demand According to the Investment Coordinating Board (BKPM), total Foreign Direct Investment (FDI) realisation climbed 16.9% y-o-y to IDR78.0 trillion in Q2. This surge of FDI was likely to have boosted the demand for new office space, with net absorption increasing to about 21,500 sq m in Q3. Previously in H1, net absorption was zero. Occupancy increased slightly to 95.5% In line with the increase in net absorption, average office occupancy in the Jakarta CBD area increased slightly from 95.0% in Q2 to 95.5% in Q3, based on a basket of existing buildings tracked by DTZ Research. Upcoming office buildings outside the CBD are also filling up very fast, notably TB Simatupang, as occupiers seek more affordable office space to accommodate their businesses. Besides more affordable rents, occupiers will also consider locations with lifestyle amenities that are away from congested areas as well as areas with sufficient supporting infrastructure or easy access. Therefore, the development of Grade A office towers outside the CBD, especially in the Puri, Kemayoran, Pluit, and Pantai Indah Kapuk (PIK) areas, are increasing as developers plan to provide alternative spaces for the rising number of Small and Medium Enterprises (SMEs), which could increase further following the planned implementation of the AEC in 2015. Meanwhile, hosting the Asian Games in 2018 will mean that the development of infrastructure and supporting buildings around Jakarta and Greater Jakarta will be hastened, with the MRT development expected to be completed prior to the start of the Games. Enquiries for new space continued to be strong, especially from companies expanding or establishing new operations. For instance, Italian-based insurance company Generali acquired most of the space in Grand Rubina Park before it is even completed, renaming it as Generali Tower. No signs of slowdown in rental growth In view of the tight supply and increased demand, average monthly CBD office rents increased by a further 2.7% q-o-q to approximately IDR309,000 per sq m in Q3 (Figure 5). Meanwhile, as the electricity tariff is raised as part of the government’s plan to reduce energy subsidies over time, landlords could increase service charge by 10% yearly. High pre-commitment for upcoming office supply Going forward, at least 100,000 sq m of new Grade A office space is expected to be completed by the end of 2014, with another 700,000 sq m to be completed in 2015 (Table 1). The pipeline supply will be concentrated mainly in the Gatot Subroto area (Figure 6). Demand for these upcoming Grade A office buildings is strong, reflected by an average pre- commitment rate of above 70%. Figure 5 Prime office rental index 0 50 100 150 200 250 300 Q405 Q406 Q407 Q408 Q409 Q410 Q411 Q412 Q413 Q414 Q415 (Q1 2011 = 100) Source: DTZ Research Table 1 Major upcoming office developments Name of development Location Gross area (sq m) Est year of completion Lippo Kuningan HR Rasuna Said 31,000 2014 Generali Tower HR Rasuna Said 33,000 2014 The Convergence HR Rasuna Said 36,000 2014 Sahid Sudirman Centre Sudirman 146,500 2015 MSIG Tower Sudirman 70,000 2015 The Capital Tower @St Regis Gatot Subroto 91,000 2015 Centennial Tower Gatot Subroto 148,300 2015 Source: DTZ Research Figure 6 Pipeline office supply, gross floor area, sq m (000s) - 100 200 300 400 Kuningan Sudirman Gatot Subroto 2014 2015 Source: DTZ Research
- 4. Jakarta Q3 2014 www.dtz.com Property Times 4 Retail No completion in Q3 while average rent increases No prime retail development was completed in Q3, both in the CBD and non-CBD areas. Total retail stock in Jakarta therefore remained the same at about 2.4 million sq m. The average asking rental rate of Jakarta’s prime shopping malls increased 11.3% q-o-q to approximately IDR 538,000 per sq m per month in Q3 (Figure 7). This was largely driven by the lack of new supply as well as strong demand from mid-upper class retailers, mostly in apparel. New brands were introduced in Q3, even though some major retailers were affected by the weakening of the Rupiah against USD. These new brands included Sephora, a French cosmetic and body care store now located in Plaza Indonesia and Kota Kasablanka, as well as Pumpkin Patch, a children’s fashion brand from New Zealand in Plaza Indonesia. Meanwhile, average service charge was recorded at about IDR130,000 per sq m per month in Q3, an increase of 22.4% q-o-q. This was likely due to the increase in electricity tariffs in July and September. Going forward, an estimated 14,000 sq m is expected to be completed in Q4 (Figure 8). This comprises the extension at Mall Kelapa Gading 3, targeted to finish by the end of October, and Titanium Square Mall. Pulomas X Venture, which was originally supposed to be completed this year, is on hold indefinitely. Other retail malls currently under construction and expected to be completed in 2015 and 2016 include Pantai Indah Kapuk - Lifestyle Mall, One Bel Park, Holland Village, SOHO Pancoran Shopping Center, Neo SOHO, Puri Botanical Mall, Puri Indah Mixed Used Development Mall and Grand Cipulir (Table 2). Retail rents expected to continue to grow Despite political uncertainties that could cause further weakening of the Rupiah, lowering investors’ confidence and hence slow down retail sector growth until the end of 2014, the retail market in Jakarta is expected to continue to grow moderately, driven by the performance of the clothing apparels and food and beverage sectors. Demand for retail space will be driven by these retailers, who are expected to continue their dominance over leasing activity in the next quarter. Premium quality supermarket operators are also expected to contribute to retail demand in Jakarta in the next few months. In addition, the planned implementation of the AEC in 2015 could attract more investments into Indonesia, including investments into the retail sector. Figure 7 Asking rental index of major Jakarta malls 90 100 110 120 130 140 Q311 Q411 Q112 Q212 Q312 Q412 Q113 Q213 Q313 Q114 Q214 Q314 (Q1 2011=100) Source: DTZ Research Figure 8 Retail supply, sq m (000s) 0 50 100 150 200 250 300 2004 2005 2006 2007 2008 2009 2010 2011 2012 2013 2014 Completed supply New supply Source: DTZ Research Table 2 Major upcoming retail developments Name of development Location Est area (sq m) Est year of Completion Mall Kelapa Gading 3 Extension Kelapa Gading 9,000 2014 Titanium Square Mall Pasar Rebo 5,000 2014 Pantai Indah Kapuk - Lifestyle Mall Pantai Indah Kapuk 30,000 2015 Neo SOHO Tanjung Duren 40,000 2015 One Bel Park Fatmawati 28,000 2015 Puri Indah Mixed Use Development Puri Indah 60,000 2016 Holland Village Cempaka Putih 50,000 2016 Puri Botanical Mall Joglo 50,000 2016 Grand Cipulir Cipulir 40,000 2016 Source: DTZ Research
- 5. Jakarta Q3 2014 www.dtz.com Property Times 5 Residential Average asking price within CBD increased According to a basket of existing properties tracked by DTZ Research, the average asking price of apartments in Jakarta’s CBD reached IDR41.8m per sq m in Q3, increasing by 0.9%, compared to IDR41.4m per sq m in Q2 (Figure 9). In Q3, the highest q-o-q growth in prices for strata apartments and high-rise apartments was posted in the upper segment, followed by those in the middle-up segment. Only the middle-up and upper segments registered q-o-q increases in asking prices in Q3. Asking prices of apartments in the upper segment increased 14.7% q-o-q, while those of apartments in the middle-up segment grew by a slight 1.2% q-o-q in Q3. Going forward, there will be an additional supply of 3,190 units in Jakarta in the period to 2016 (Table 3). The pipeline supply is mostly located in South Jakarta, with two projects in Central Jakarta. Most of the upcoming projects are in the middle-up and upper segments, except for one super high- end project, Langham Residence, in Central Jakarta. Modest growth in asking rents The increase in average asking price was also followed by an increase in average rents. Overall average monthly rents grew marginally by 0.3% q-o-q to around IDR217,000 per sq m (Figure 9). The highest q-o-q increase of 21% in condominium rents in Q3 was observed in the upper segment. Within the middle segment, following a q-o-q increase of 12.5% in Q2, average rents for such apartments rose by a smaller 1.1% q-o-q to around IDR143,000 per sq m per month. Average asking rents are expected to continue to increase so as to accommodate the rising demand from the possible surge of FDI and inflow of foreign expatriates when the AEC is implemented. Asking rents for condominiums are also likely to rise as landlords pass on the additional costs of an increase in electricity tariffs to tenants. Figure 9 CBD apartment asking price and rental indices 50 100 150 200 250 300 Q311 Q411 Q112 Q212 Q312 Q412 Q113 Q213 Q313 Q413 Q114 Q214 Q314 Asking price Asking rent Source: DTZ Research Table 3 Major upcoming residential developments Name of development Location No. of units Est year of Completion Sudirman Suite Sudirman 414 2014 Sudirman Terrace Sudirman 400 2014 Sky Garden Setiabudi 726 2015 Ciputra World II Prof. Dr. Satrio 349 2015 Gayanti City Gatot Subroto 360 2016 Casa Domaine KH Mas Mansur 323 2016 Sudirman Hill Benhil (via Sudirman) 375 2017 Verde 2 Setiabudi 186 2017 Langham Residence SCBD 57 2017 Source: DTZ Research
- 6. Jakarta Q3 2014 www.dtz.com Property Times 6 Definitions Development pipeline/potential supply: Comprises two elements: 1. Floor space in the course of development, defined as buildings being constructed or comprehensively refurbished. 2. Schemes with the potential to be built in the future, having secured planning permission/development certification. Net absorption: The change in the total occupied or let floor space over a specified period of time, either positive or negative. Net supply: The change in the total floor space over a specified period of time, either positive or negative. It excludes floor spaces that are not available for occupation due to refurbishment or redevelopment, but includes new supply. New supply refers to total floor space/units which are ready for occupation. Ready for occupation means practical completion, where either the building has been issued with a Temporary Occupation Permit or Certificate of Statutory Completion (CSC). Prelet/pre-commit: A development leased or sold prior to completion. Prime office rent: The highest rent that could be achieved for a typical building/unit of the highest quality and specification in the best location to a tenant with a good (i.e. secure) covenant. (NB. This is a gross rent, including service charge or tax, and is based on a standard lease, excluding exceptional deals for that particular market). Major malls: Purpose-leased shopping center with Net Lettable area (NLA) of at least 20,000 sq m that have good tenancy-mix as well as retailers/ brands and developed by reputable developer in Jakarta. Stock: Total accommodation in the private sector both occupied and vacant. Take-up: Floor space acquired for occupation or investment, including the following: 1. Offices let to an eventual occupier. 2. Developments pre-let or sold. (NB. This includes subleases.) Take-up also refers to units transacted in the residential market. Occupancy rate: Total space currently occupied or not available to let as a percentage of the total stock of floor space. (NB. This excludes shadow space which is space made available for sub-leasing).
- 7. Jakarta Q3 2014 www.dtz.com Property Times 7 Other DTZ Research Reports Other research reports can be downloaded from www.dtz.com/research. These include: Occupier Perspective Updates on occupational markets from an occupier perspective, with commentary, analysis, charts and data. Global Occupancy Costs Offices Global Occupancy Costs Logistics Occupier Perspective - User Guide to The Americas Occupier Perspective - User Guide to Asia Pacific Occupier Perspective - User Guide to EMEA Occupier Perspective - Global User Guide Global Office Review India Office Demand and Trends Survey 2013-14 Sweden Computer Games Developers November 2013 Property Times Regular updates on occupational markets from a landlord perspective, with commentary, charts, data and forecasts. Coverage includes Asia Pacific, Baltics, Bangkok, Barcelona, Bengaluru, Berlin, Brisbane, Brussels, Budapest, Central London, Chennai, Chicago, Delhi, East China, Europe, Frankfurt, Geneva, Guangzhou & Central China, Hamburg, Helsinki, Ho Chi Minh City, Hong Kong, Hyderabad, Jakarta, Japan, Kolkata, Kuala Lumpur, Los Angeles, Luxembourg, Lyon, Madrid, Manhattan, Melbourne, Milan, Mumbai, North China, Paris, Poland, Prague, Pune, Rome, San Francisco, Seoul, Singapore, South & West China, Stockholm, Sydney, Taipei, Toronto, Ukraine, UK, Warsaw, Washington. Investment Market Update Regular updates on investment market activity, with commentary, significant deals, charts, data and forecasts. Coverage includes Asia Pacific, Australia, Belgium, Czech Republic, Europe, France, Germany, Italy, Japan, Mainland China, South East Asia, Spain, Sweden, UK, US. Money into Property For more than 35 years, this has been DTZ's flagship research report, analysing invested stock and capital flows into real estate markets across the world. It measures the development and structure of the global investment market. Available for Global, Asia Pacific, Europe and UK. Foresight Quarterly commentary, analysis and insight into our in- house data forecasts, including the DTZ Fair Value Index™. Available for Global, Asia Pacific, Europe and UK. In addition we publish an annual outlook report. Insight Thematic, ad hoc, topical and thought leading reports on areas and issues of specific interest and relevance to real estate markets. Great Wall of Money – October 2014 German Open Ended Funds – October 2014 Insight Singapore medical suites – September 2014 China Insight Establishing the Capital Economic Region – Aug 2014 Insight European Transaction Based Price Index Q2 2014 Insight European Nursing homes – July 2014 Insight GB Retail Property Health Index (RPHI) – July 2014 Insight Beijing TMT Office Occupier Survey – June 2014 Net Debt Funding Gap – May 2014 China Insight Office Pipeline and Dynamics – May 2014 Insight Deflation and Commercial Property – March 2014 Insight Tokyo Retail Market 2014 China Investment Market Sentiment Survey – January 2014 DTZ Research Data Services For more detailed data and information, the following are available for subscription. Please contact graham.bruty@dtz.com for more information. Property Market Indicators Time series of commercial and industrial market data in Asia Pacific and Europe. Real Estate Forecasts, including the DTZ Fair Value Index TM Five-year rolling forecasts of commercial and industrial markets in Asia Pacific, Europe and the USA. Investment Transaction Database Aggregated overview of investment activity in Asia Pacific and Europe. Money into Property DTZ’s flagship research product for over 35 years providing capital markets data covering capital flows, size, structure, ownership, developments and trends, and findings of annual investor and lender intention surveys.
- 8. www.dtz.com Property Times 8 DTZ Research DTZ Research Contacts Global Head of Forecasting Fergus Hicks Phone: +44 (0)20 3296 2307 Email: fergus.hicks@dtz.com DTZ Business Contacts Chief Executive, Asia Pacific Henry Arundel Phone: +61 (0)2 9492 8818 Email: henry.arundel@dtz.com Executive Chairman, SEA Edmund Tie Phone: +65 6393 2388 Email: edmund.tie@dtz.com Chief Executive, SEA Ho Tian Lam Phone: +65 6393 2338 Email: tianlam.ho@dtz.com Business Space/Occupier Services Kan Kum Wah Phone: +62 21 576 3838 Email: kumwah.kan@dtz.com Investment Kan Kum Wah Phone: +62 21 576 3838 Email: kumwah.kan@dtz.com Property Facilities and Property Management Denan Kaligis Phone: +62 21 576 3838 Email: denan.kaligis@dtz.co.id Consulting and Research Denan Kaligis Phone: +62 21 576 3838 Email: denan.kaligis@dtz.co.id Valuation Kan Kum Wah Phone: +62 21 576 3838 Email: kumwah.kan@dtz.com Putri Ayutik Phone: +62 21 576 3838 Email: putri.ayutik@dtz.co.id Jisca Tjan Phone: +62 21 576 3838 Email: jisca.tjan@dtz.co.id Residential Jisca Tjan Phone: +62 21 576 3838 Email: jisca.tjan@dtz.co.id Retail Jisca Tjan Phone: +62 21 576 3838 Email: jisca.tjan@dtz.co.id DISCLAIMER This report should not be relied upon as a basis for entering into transactions without seeking specific, qualified, professional advice. Whilst facts have been rigorously checked, DTZ can take no responsibility for any damage or loss suffered as a result of any inadvertent inaccuracy within this report. Information contained herein should not, in whole or part, be published, reproduced or referred to without prior approval. Any such reproduction should be credited to DTZ. © DTZ October 2014