SlideShare a Scribd company logo
1 of 10
Download to read offline
T e a m D r a g o n T u r t l e s : A T & T v . V e r i z o n | 1
AT&T v. Verizon: Battle of the Telecom Titans
Team: Dragon Turtles
Jacob Albers, Alejandra Avila, Merveille Kazimoto, Claire Kelly, Dan Lev
Introduction
1. Economy wide & Industry Wide Analysis
a. A number of macroeconomic factors are currently affecting the telecommunications
industry. Due to how critical telecommunications are to infrastructure, the U.S.
regulations and decisions can have a huge impact upon the telecommunications industry.
For example, the United States Department of Justice declared that it would move to
block AT&T’s attempt to purchase T-Mobile in 2011; a merger that would have AT&T
by far the largest American telecommunications company in terms of assets, market
share, and coverage. That decision has effectively signaled to the telecommunications
industry that the current state of competition between the top four companies will not be
allowed to merge with one another - forcing the smaller companies to expend further
resources to increase their market share The revelation from the release of NSA
documents by Eric Snowden revealed the collusion of the U.S. government with large
telecommunications corporations such as AT&T and Verizon to implement massive
cyber-spying programs throughout the past decade. This revelation has placed heavy
scrutiny and distrust on these companies by both stockholders and the public at large. It is
unclear how this might exactly affect AT&T and Verizon in the years to come, but in the
short-term, stockholders have demanded further transparency as to government demands
(Business Insider, 2013).
b. The telecommunications industry is currently in the midst of a massive battle for survival.
The two largest competitors, AT&T and Verizon, hold 65% of the overall market share
(27.9% and 37.2% respectively in 2014) while Sprint and T-Mobile are ferociously vying
for third place (12.3% and 9.5% of market share, respectively). Desperately, both have
slashed their prices in order to draw as many customers from their competitors as
possible. These tactics have not only put pressure upon these two smaller firms, but upon
the larger firms as well. Both AT&T and Verizon’s stock growth has largely remained
stagnant over the past couple years, and the One question that we endeavor to answer is
which of these companies, AT&T or Verizon, has better weathered this storm in recent
years?
Besides external pressures from direct competitors, both these
telecommunications giants have been attempting to expand their operations in terms of
both new geographic regions and new industries. Both companies have spent billions of
dollars to purchase smaller peripheral or affiliate companies (Qualcomm and Cricket for
AT&T, Hughes Telematics Inc. and Alltel for Verizon) over the past several years.
AT&T has taken a riskier, more expansive approach by spending $48.5 billion to
purchase DirecTV. With the purchase of DirecTV, AT&T has jumped from 5 million
subscribers to its U-verse service to 25 million overall to become the second largest
provider of TV cable provider. However, it remains to be seen if AT&T can hold or build
upon this new user base in the coming years. Additionally, AT&T is expanding heavily
into Mexico, purchasing Iusacell and planning to invest $3 billion there in the coming
years. However, the company faces stiff competition from existing Mexican
T e a m D r a g o n T u r t l e s : A T & T v . V e r i z o n | 2
telecommunication companies, America Movil and Telefonica - and will likely take
operating losses in this area, at least in the short term. As for Verizon, they made the
significant move in 2013 of repurchasing their 45% of their stock from UK telecom firm
Vodafone. The following year, they capitalized on this reduction of shares by paying out
record high dividends.
Dupont Analysis:
1. When doing the Dupont Analysis for AT&T and Verizon, one must keep in mind that these are
large-scale service companies that have a relatively high amount of leverage with customers
considering the limited number of options in the market and the necessity of the service. From the
Fig. 2, one can see that there is little difference between the Asset Turnover ratio of both
companies - both generally hover between 40-50%. The Net Profit Margin for these two
companies is more volatile. In AT&T’s case jumping from 16.2 % to 3.3 % and in Verizon’s case
varying from 19.5% to 9.5%. These large fluctuations suggest some variation in the predominant
strategy of these telecommunications companies.
Ratio Analysis:
1. Return On Equity
Fig. 1: Return on Equity (Net Income / Average Stockholder’s Equity).
a. AT&T’s return on equity has fluctuated greatly over the last five years from as much as
ten cents return in 2013 and as little as two cents return in 2011. This large variance can
be explained by AT&T’s large fluctuation in net income. In 2010 and 2013, AT&T had a
net income of 18 and 20 billion respectively. According to their 2010 annual report, a
timely sale of nonstrategic assets and favorable tax resolutions was the driving force
behind a 35 billion dollar gain. In 2013, due to the sale of their advertising solutions
segment. This was a large part of a 20 billion dollar decrease in annual expenses resulting
in that 20 billion dollar net income. As a result, the return on equity in these years was
substantially higher than in years where there was smaller profits such as 2011.
b. Verizon had a much steadier return on equity. From 2010 to 2012, Verizon’s return on
equity varied by three hundredths of a percent. The return on equity more than doubled
from .062 in 2012 to .131 in 2013. This rise could be accredited to Verizon’s acquisition
of Vodafone for 130 billion dollars. That acquisition caused Verizon’s income to double
T e a m D r a g o n T u r t l e s : A T & T v . V e r i z o n | 3
in 2013. Verizon’s ROE remained at an elevated level in 2014 at .110. This is because
they implemented a stock buyback that drastically cut their stockholder’s equity. It is
interesting to see a ROE remain at a heightened level in subsequent years because of a
dramatic rise in income one year and a dramatic drop in stockholder’s equity the next
year.
2. Net Profit Margin
Fig. 2: Net Profit Margin (Net Income / Net Sales)
a. AT&T’s net profit margin fluctuated similarly to their return on equity in that it was
directly related to net income. Their net sales are very consistent rising about 1.5%
annually. In years where net income spiked, so did net profit margin. In years where net
income fell, so did net profit margin. Again, that explains why 2010 and 2013 had such
high net profit margins and 2011 had the lowest net profit margin.
b. Verizon’s net profit margin decreased annually from 2010 to 2012. This is because
Verizon’s sales were growing at about 4% annually while their net income remained
stagnant. In 2013 Verizon’s net income doubled with the Vodafone deal while sales
stayed stagnant. This resulted in Verizon’s NPM more than doubling from .091 in 2012
to .195 in 2013. Once their net income returned to a more typical level in 2014 so did
their NPM. In 2014, it came back down to .094 which is much more typical of Verizon’s
five year NPM average.
3. Asset Turnover
T e a m D r a g o n T u r t l e s : A T & T v . V e r i z o n | 4
Fig. 3: Asset Turnover (Net Sales / Average Total Assets)
The asset turnover ratio is an efficiency ratio that measures a company's ability to generate sales
from its assets by comparing net sales with average total assets. In other words, this ratio shows how
efficiently a company can use its assets to generate sales. The total asset turnover ratio calculates net
sales as a percentage of assets to show how many sales are generated from each dollar of company
assets. Since neither AT&T nor Verizon is a manufacturing company, this analysis focuses only on
the total asset turnover rather than the fixed asset turnover.
Over the past five years, both AT&T’s and Verizon’s asset turnover ratios remained consistently
similar with very slight differences, except in 2014 where the difference was significant. Verizon
reported slightly higher asset turnover ratios than AT&T from the year 2010 to the year 2012.
However, in 2013 AT&T took the lead reporting a higher asset turnover than Verizon. In 2013,
Verizon’s assets decreased as compared to the previous three years as a decline in regulatory fees was
partially offset by an increase in revenue related to upgrade fees, hence decreasing that year’s asset
turnover. In 2014, Verizon reported a considerable increase in asset turnover from 44% to 55%, this
time a significantly higher asset turnover ratio than AT&T’s 45%. Verizon’s increase in asset
turnover ratio is credited to the increase in assets resulting from an increase in equipment sales under
both the traditional subsidy model and Verizon Edge.
4. Financial Leverage
The financial leverage ratio is a measure of how much assets a company holds relative to its equity. A
high financial leverage ratio means that the company is using debt and other liabilities to finance its
assets, and everything else being equal, is more risky than a company with a lower leverage.
Fig. 4: Financial Leverage (Average Total Assets / Average Total Stockholders Equity)
From the graph above, it can be seen that there is no significant difference between the two
company’s financial leverages over the past five years, with year 2014 as the exception. In both year
2010 and 2011, Verizon reported relatively higher financial leverage than AT&T. In 2012 and 2013,
AT&T took the lead with a little higher financial leverage relative to its peer Verizon. Nonetheless, in
2014, Verizon undergone an epic rise in its financial leverage, dramatically outshining its primary
rival AT&T. This spike is attributed to the acquisition of Vodafone's 45 percent indirect interest in
T e a m D r a g o n T u r t l e s : A T & T v . V e r i z o n | 5
Verizon Wireless. Since financial leverage ratio is a ratio between average total assets and average
stockholders’ equity, Vodafone’s acquisition lowered the stockholders’ equity (the denominator of
the financial leverage ratio formula) from 95,416 in 2013 to 13,676 in 2014, thus raising the ratio in
2014. Furthermore, the buyout of Vodafone's stake in Verizon Wireless adds leverage to the company
during a seemingly tough time when the wireless industry is reaching maturity and growth is slowing
down.
5. Annual Revenue Growth
Fig. 5: Annual Revenue Growth (%) ( (current revenue / last year revenue) – 1)
a. Over the past five years, Verizon has had an steady increase in its annual revenue growth.
In 2010, Verizon had a negative annual revenue growth of 1.2% but experienced a
growth of 2.8% in 2011 to an annual revenue growth of 2%. As time continued, Verizon
has experienced a steady increase in revenue growth, except for 2013 when it declined by
0.4%. According to its 2014 annual report, over the last five years Verizon has increased
their number of subscribers for both internet and video which has resulted in their overall
annual revenue growth.
b. In contrast, AT&T has had a fluctuating annual revenue growth experiencing gains and
losses. Its 2010 annual revenue growth of 1.4% increased to 2% in 2011 and fell to 0.6%
in 2012. Since 2012, AT&T’s annual revenue growth has steadily increased. The 2014
annual report explains that AT&T is facing challenging competition from competitors,
such as Verizon, as well as an increase in regulation of broadland services which can be
the cause of the fluctuation in annual revenue growth.
c. The annual revenue growth rate for AT&T and Verizon was calculated by dividing the
operating revenues expense of the current year by that of the previous year and then
converting the result into a percentage. For example, the operating revenue for Verizon in
2014 was 127,079 and 120,550 in 2013, which yield an annual revenue growth of 1.054.
The annual revenue growth of 1.054 translates to 5.4%.
6. Working Capital Ratio
T e a m D r a g o n T u r t l e s : A T & T v . V e r i z o n | 6
a. In comparison to AT&T, Verizon has had more working capital over the last five years
even though it has had more fluctuation. In 2013 Verizon experienced an increase of
1.911, from a ratio in 2012 of 0.788 to a ratio of 2.625 in 2013. The increase in 2013 is
most likely a result of Verizon gaining more tangible current liabilities to pay the dues
owed to Vodafone for the stock purchase agreements of September 2, 2013. Another
factor that could explain the 2013 increase could be Verizon acquiring EdgeCast
Networks and upLynk.
b. In contrast, AT&T has been able to maintain a relatively stable working capital ratio
ranging from 0.598 to 0.859. The company has been able to preserve the ratio of its
current assets to total current liabilities between 50% and 100%.
c. The working capital ratio for each company was calculated by dividing the current assets
by the total current liabilities. For example, the current assets for AT&T for 2014 was
32,028 and the total current liabilities was 37,282. The working capital ratio was 0.859.
7. Return On Assets (ROA)
T e a m D r a g o n T u r t l e s : A T & T v . V e r i z o n | 7
Fig. 7: Return On Assets (Net Income / Average Total Assets)
a. Return on Assets (ROA) is calculated by dividing net income by average total assets. The
Return on Assets is used by financial “analysts, investors, and creditors” to “measure of
profitability and management effectiveness, independent of financing strategy.” (pg.250)
b. The heightened Return on Assets in 2010 for AT&T (7.5%) was due to the sales of
“nonstrategic assets and favorable resolution of income tax matters.” The purchase of
Qualcomm, Inc. for 1.93 billion in 2011 resulted in a decrease in assets. A newly purchased
asset may have a negative effect on the overall net operating income of the combined
company, thereby reducing the return on assets. The ROA was 1.5% in 2011. In 2013,
AT&T reduced expenses by $20 billion. The “expense decrease was primarily due to the
sale of our Advertising Solutions segment and lower amortization of intangibles for
customer lists related to acquisitions, offset by increased depreciation associated with
ongoing capital spending for network upgrades and expansion.” A reduction in company
expenses increased net income during the period. AT&T also purchased Cricket Wireless
for 1.2 billion in 2013. This transaction reduced average total assets. However, the net
income is still higher than average total assets, so the Return on Assets remains relatively
high. In 2014, the decrease in Return of Assets is due to the fluctuations in net income and
a steady increase in average total assets.
c. The ROA was 4.6% in 2010. Verizon was able to increase its customer base and net income
during that period. The ROA slightly decreased to 4.4% in 2011. On July 2012, Verizon
purchased HUGHES Telematics, Inc. “for approximately $12 per share in cash for a total
acquisition price of $0.6 billion.” This transaction resulted in a decrease in total average
assets. The ROA was 4.7%. Compared to the ROA from the previous year, the Return on
Assets slightly increased. The acquisition increased Verizon’s “ability to bring more
telematics offerings to market for existing and new customers.” The purchase helped
increase income. Any potential loss from the purchase of HUGHES Telematics, Inc. was
not particularly felt in Verizon’s growth. The Return on Assets was 8.6% in 2013. The
company had acquired EdgeCast Networks & upLynk. In 2014, the Return on Assets was
5.1%. During that time, Verizon purchased Omnitel. The company experienced a gain of
$1.9 billion by selling “Omnitel interest in Equity in earnings of unconsolidated business
of unconsolidated businesses on” the income statement.
8. Dividend Payout Ratio
T e a m D r a g o n T u r t l e s : A T & T v . V e r i z o n | 8
a. AT&T has paid between 9.5 billion and 10.2 billion dollars in dividends over the past
five years. The only reason their dividend payout ratio varies is due to their sporadic year
to year net income.
b. Between 2010 and 2012, Verizon paid about the same amount of dividends annually, and
because their net income was also consistent for those three years, the dividend payout
ratio was about the same. It was 53 cents in 2010, 54 cent in 2011, and 50 cents in 2012.
In 2013, they paid 5.9 billion dollars in dividends, but that was not nearly enough to
offset the doubling of the net income that year from the Vodafone deal. As a result, the
dividend payout ratio dropped to 25 cents. In 2014, after buying back the shares from the
Vodafone deal, Verizon decided to raise their dividend payout by 2 billion dollars to 7.8
billion. Once they were in control of their shares, they felt it was safe to pay out a higher
dividend. This resulted in a higher dividend payout ratio of 65 cents.
9. Debt-to-Equity Ratio
a. AT&T’s Debt-to-Equity Ratio has steadily increased over the past 5 years from 1.41 to
2.37. This is due in part to consistent yearly declines in Stockholder’s Equity, and in part
to consistent yearly increases in Liabilities. This suggests that AT&T has been
increasingly aggressive in using debt to finance its growth over time - but since these
changes have been gradual and still within the standard bounds of the telecommunication
industry.
T e a m D r a g o n T u r t l e s : A T & T v . V e r i z o n | 9
b. Verizon’s Debt-to-Equity Ratio has remained largely steady and only growing slightly
over time (between 1.53 and 1.87). However, due to the repurchase of a significant
amount of their stock from Vodafone, the Stockholder’s equity for Verizon dropped
significantly (~89%) in 2014. This raised their D/E ratio to 16.02 - allowing them to pay
their remaining stockholders far higher dividends per share, but also greatly increasing
the risk that each individual stockholder is liable for (considering the health of Verizon’s
other metrics, this is not a significant issue).
10. Earnings Per Share Ratio
a. AT&T’s earnings per share have risen and fallen over the past 5 years, with the low at $ 0
.66 and the high at $ 3.39. These fluctuations are likely due to the fluctuations in net
income as detailed above in other ratios.
b. Verizon’s earnings per share have initially fallen over the period of 2010 to 2012 ($ 0.90
to $ 0.31). However, they have risen significantly over 2013-2014 to $ 2.42, peaking at $
4.01. While precise cause may be difficult to pinpoint, the purchase of Vodafone’s stock
and the subsequent dividends payout is likely the strongest factor in the sizeable increase
in EPS.
c. Neither company shows very consistent numbers in this area, so EPS should not be
considered as a deciding factor of which is the preferred company one should in.
11.
Accounting Analysis:
A. Depreciation Methods & Timescales
a. AT&T and Verizon both use straight-line method depreciation.
Item Depreciated AT&T (Lives)Amounts in
Million
Verizon (Lives)Amounts in
Million
Land (Indefinite) 1,567 (Indefinite) 763
Buildings and
Improvements
(10-44) 32,204 (15-45) 25,209
Central Office Equipment (3-10) 89,857 (3-15) 129,619
T e a m D r a g o n T u r t l e s : A T & T v . V e r i z o n | 10
Cable, Wiring, Conduit (15-50) 72,766 (11-50) 54,797
Work In Progress (Indefinite) 3,053 (Indefinite) 4,580
Misc. Equipment (3-15) 74,244 (3-20) 9,166
Software (3-5) 8,604 N/A
Verizon is increasing its net income in the short term due to the fact that they have longer estimated lives
of their assets. This leads to Verizon having less annual expenses for comparable items to AT&T because
Verizon spreads out the depreciation of those items over slightly more years.
B. Inventory Valuation Methods
Both AT&T and Verizon use FIFO as required by GAAP for financial reporting. Therefore, there
should be no discrepancies between the two due to inventory valuation.
C. Allowances for Uncollectable Accounts (dollars in millions)
Year Verizon AT&T
2010 1,246 1,334
2011 1,026 1,136
2012 972 1,117
2013 993 954
2014 1,095 1,032
5. Given the prior information, Verizon is our preferred company for the following reasons. First,
Verizon has been able to maintain a higher annual growth rate than AT&T and as a result has a larger
user base. Verizon has also been able to maintain a higher current ratio, which means they have more
tangible assets. Lastly, taking into consideration the current volatile industry climate, Verizon has taken a
more conservative approach of using assets to repurchase stock from Vodafone and pay back shareholders
while AT&T has taken a more risky approach by aggressively expanding, buying Direct TV, and
expanding its services into Mexico.
6. The stock price for Verizon over the past two years remains steadily between $45 to $50. The
stock price for AT&T for the past two years is between $32 and $38. Without a dramatic shock to the
economy, we would expect the value of the stock for the companies to remain relatively stable. We are
assuming that markets are efficient.

More Related Content

What's hot

How T-Mobile & Sprint will win Deal Approval
How T-Mobile & Sprint will win Deal ApprovalHow T-Mobile & Sprint will win Deal Approval
How T-Mobile & Sprint will win Deal Approvalthomas paulson
 
TMUS Bull-Case November 2020 Update
TMUS Bull-Case November 2020 UpdateTMUS Bull-Case November 2020 Update
TMUS Bull-Case November 2020 Updatethomas paulson
 
Corporate Reporting Analysis: Cable & Wireless / UK Fixed line
Corporate Reporting Analysis: Cable & Wireless / UK Fixed lineCorporate Reporting Analysis: Cable & Wireless / UK Fixed line
Corporate Reporting Analysis: Cable & Wireless / UK Fixed lineChris Corbishley
 
Final CFA Challenge Trinity University Team Submission
Final CFA Challenge Trinity University Team SubmissionFinal CFA Challenge Trinity University Team Submission
Final CFA Challenge Trinity University Team SubmissionEmilio Vernaza
 
Strategic planning document for at
Strategic planning document for atStrategic planning document for at
Strategic planning document for atSamuel Gibbs
 
What do you believe are the greatest challenges facing the sector or industry...
What do you believe are the greatest challenges facing the sector or industry...What do you believe are the greatest challenges facing the sector or industry...
What do you believe are the greatest challenges facing the sector or industry...rohitsengupta83
 
At&T Pitch
At&T PitchAt&T Pitch
At&T Pitchvlazarescu
 
alltel 4Q 04_Earningsrelease
alltel  4Q 04_Earningsreleasealltel  4Q 04_Earningsrelease
alltel 4Q 04_Earningsreleasefinance27
 

What's hot (13)

How T-Mobile & Sprint will win Deal Approval
How T-Mobile & Sprint will win Deal ApprovalHow T-Mobile & Sprint will win Deal Approval
How T-Mobile & Sprint will win Deal Approval
 
TMUS Bull-Case November 2020 Update
TMUS Bull-Case November 2020 UpdateTMUS Bull-Case November 2020 Update
TMUS Bull-Case November 2020 Update
 
VZ Financial Report
VZ Financial Report VZ Financial Report
VZ Financial Report
 
Corporate Reporting Analysis: Cable & Wireless / UK Fixed line
Corporate Reporting Analysis: Cable & Wireless / UK Fixed lineCorporate Reporting Analysis: Cable & Wireless / UK Fixed line
Corporate Reporting Analysis: Cable & Wireless / UK Fixed line
 
Final CFA Challenge Trinity University Team Submission
Final CFA Challenge Trinity University Team SubmissionFinal CFA Challenge Trinity University Team Submission
Final CFA Challenge Trinity University Team Submission
 
T-Mobile Report-Posting
T-Mobile Report-PostingT-Mobile Report-Posting
T-Mobile Report-Posting
 
Strategic planning document for at
Strategic planning document for atStrategic planning document for at
Strategic planning document for at
 
What do you believe are the greatest challenges facing the sector or industry...
What do you believe are the greatest challenges facing the sector or industry...What do you believe are the greatest challenges facing the sector or industry...
What do you believe are the greatest challenges facing the sector or industry...
 
Abhinav presettation
Abhinav presettationAbhinav presettation
Abhinav presettation
 
Media Update - July 2011
Media Update - July 2011Media Update - July 2011
Media Update - July 2011
 
Report
ReportReport
Report
 
At&T Pitch
At&T PitchAt&T Pitch
At&T Pitch
 
alltel 4Q 04_Earningsrelease
alltel  4Q 04_Earningsreleasealltel  4Q 04_Earningsrelease
alltel 4Q 04_Earningsrelease
 

Viewers also liked

O mundo em 2013 e a ameaça de uma nova guerra mundial
O mundo em 2013 e a ameaça de uma nova guerra mundialO mundo em 2013 e a ameaça de uma nova guerra mundial
O mundo em 2013 e a ameaça de uma nova guerra mundialFernando Alcoforado
 
김은성조장Ppt01
김은성조장Ppt01김은성조장Ppt01
김은성조장Ppt01Jane Kim
 
Como quitar una verruga
Como quitar una verrugaComo quitar una verruga
Como quitar una verrugaaturalessa
 
Departure from org and gicca
Departure from org and giccaDeparture from org and gicca
Departure from org and giccaeb1corredoura
 
Experiencias significativas cb
Experiencias significativas cbExperiencias significativas cb
Experiencias significativas cbdaalvale
 
Biologiya 11-klas-balan-2011
Biologiya 11-klas-balan-2011Biologiya 11-klas-balan-2011
Biologiya 11-klas-balan-2011freegdz
 
Avanço tecnológico, baixo crescimento econômico e desemprego em massa marcas ...
Avanço tecnológico, baixo crescimento econômico e desemprego em massa marcas ...Avanço tecnológico, baixo crescimento econômico e desemprego em massa marcas ...
Avanço tecnológico, baixo crescimento econômico e desemprego em massa marcas ...Fernando Alcoforado
 
Presentatie project marketing_en_eventorganisatie
Presentatie project marketing_en_eventorganisatiePresentatie project marketing_en_eventorganisatie
Presentatie project marketing_en_eventorganisatieThomas Geysemans
 
Lecciones del shuljan aruj -1-Primera Parte -.
Lecciones del shuljan aruj -1-Primera Parte -.Lecciones del shuljan aruj -1-Primera Parte -.
Lecciones del shuljan aruj -1-Primera Parte -.milton que te importa ....
 

Viewers also liked (11)

O mundo em 2013 e a ameaça de uma nova guerra mundial
O mundo em 2013 e a ameaça de uma nova guerra mundialO mundo em 2013 e a ameaça de uma nova guerra mundial
O mundo em 2013 e a ameaça de uma nova guerra mundial
 
김은성조장Ppt01
김은성조장Ppt01김은성조장Ppt01
김은성조장Ppt01
 
Como quitar una verruga
Como quitar una verrugaComo quitar una verruga
Como quitar una verruga
 
Departure from org and gicca
Departure from org and giccaDeparture from org and gicca
Departure from org and gicca
 
Experiencias significativas cb
Experiencias significativas cbExperiencias significativas cb
Experiencias significativas cb
 
Projeto AFT 2012
Projeto AFT 2012Projeto AFT 2012
Projeto AFT 2012
 
Biologiya 11-klas-balan-2011
Biologiya 11-klas-balan-2011Biologiya 11-klas-balan-2011
Biologiya 11-klas-balan-2011
 
Requisito para el examen extraordinario
Requisito para el examen extraordinarioRequisito para el examen extraordinario
Requisito para el examen extraordinario
 
Avanço tecnológico, baixo crescimento econômico e desemprego em massa marcas ...
Avanço tecnológico, baixo crescimento econômico e desemprego em massa marcas ...Avanço tecnológico, baixo crescimento econômico e desemprego em massa marcas ...
Avanço tecnológico, baixo crescimento econômico e desemprego em massa marcas ...
 
Presentatie project marketing_en_eventorganisatie
Presentatie project marketing_en_eventorganisatiePresentatie project marketing_en_eventorganisatie
Presentatie project marketing_en_eventorganisatie
 
Lecciones del shuljan aruj -1-Primera Parte -.
Lecciones del shuljan aruj -1-Primera Parte -.Lecciones del shuljan aruj -1-Primera Parte -.
Lecciones del shuljan aruj -1-Primera Parte -.
 

Similar to dragonturtles FA project

1COMPARISON OF AT&T & VERIZONRunning head COMPARISON OF .docx
1COMPARISON OF AT&T & VERIZONRunning head COMPARISON OF .docx1COMPARISON OF AT&T & VERIZONRunning head COMPARISON OF .docx
1COMPARISON OF AT&T & VERIZONRunning head COMPARISON OF .docxhyacinthshackley2629
 
Telecommunication Industry- Ratio Analysis
Telecommunication Industry- Ratio AnalysisTelecommunication Industry- Ratio Analysis
Telecommunication Industry- Ratio AnalysisLiza Dsouza
 
Running Head AT&T AND TIME WARNER 1AT&T AND TIME WARNER.docx
Running Head AT&T AND TIME WARNER 1AT&T AND TIME WARNER.docxRunning Head AT&T AND TIME WARNER 1AT&T AND TIME WARNER.docx
Running Head AT&T AND TIME WARNER 1AT&T AND TIME WARNER.docxtoddr4
 
Us wireless market_q3_2012_update_nov_2012_chetan_sharma_consulting
Us wireless market_q3_2012_update_nov_2012_chetan_sharma_consultingUs wireless market_q3_2012_update_nov_2012_chetan_sharma_consulting
Us wireless market_q3_2012_update_nov_2012_chetan_sharma_consultingGustavo Kahil
 
Supply Chain Metrics That Matter: A Focus on Aerospace & Defense Companies 2017
Supply Chain Metrics That Matter: A Focus on Aerospace & Defense Companies 2017Supply Chain Metrics That Matter: A Focus on Aerospace & Defense Companies 2017
Supply Chain Metrics That Matter: A Focus on Aerospace & Defense Companies 2017Lora Cecere
 
The Deloitte M&A Index 2016
The Deloitte M&A Index 2016The Deloitte M&A Index 2016
The Deloitte M&A Index 2016Deloitte UK
 
The Deloitte M&A Index 2016
The Deloitte M&A Index 2016The Deloitte M&A Index 2016
The Deloitte M&A Index 2016Deloitte UK
 
PwC Entertainment, media and communications deal insightsQ3 2015
PwC Entertainment, media and communications deal insightsQ3 2015PwC Entertainment, media and communications deal insightsQ3 2015
PwC Entertainment, media and communications deal insightsQ3 2015PwC
 
Nibc 2016 mba-m fin - true north investments - ppt
Nibc 2016   mba-m fin - true north investments - pptNibc 2016   mba-m fin - true north investments - ppt
Nibc 2016 mba-m fin - true north investments - pptJohn McGlynn
 
OI Challenges in the Brazilian economic crysis
OI  Challenges in the Brazilian economic crysisOI  Challenges in the Brazilian economic crysis
OI Challenges in the Brazilian economic crysisDimitar Bozov
 
Nibc 2016 [graduate] - [pepper waves] - ppt
Nibc 2016   [graduate] - [pepper waves] - pptNibc 2016   [graduate] - [pepper waves] - ppt
Nibc 2016 [graduate] - [pepper waves] - pptPeter Hsiung
 
Dragon Fund_Sector Update
Dragon Fund_Sector UpdateDragon Fund_Sector Update
Dragon Fund_Sector UpdateSara Golshahr
 
T Mobile's Opportunity to win Sprint and 5G
T Mobile's Opportunity to win Sprint and 5GT Mobile's Opportunity to win Sprint and 5G
T Mobile's Opportunity to win Sprint and 5Gthomas paulson
 
Defensive Contractor Industry Analysis 2013
Defensive Contractor Industry Analysis 2013Defensive Contractor Industry Analysis 2013
Defensive Contractor Industry Analysis 2013Sid Aggarwal
 

Similar to dragonturtles FA project (18)

1COMPARISON OF AT&T & VERIZONRunning head COMPARISON OF .docx
1COMPARISON OF AT&T & VERIZONRunning head COMPARISON OF .docx1COMPARISON OF AT&T & VERIZONRunning head COMPARISON OF .docx
1COMPARISON OF AT&T & VERIZONRunning head COMPARISON OF .docx
 
Telecommunication Industry- Ratio Analysis
Telecommunication Industry- Ratio AnalysisTelecommunication Industry- Ratio Analysis
Telecommunication Industry- Ratio Analysis
 
Running Head AT&T AND TIME WARNER 1AT&T AND TIME WARNER.docx
Running Head AT&T AND TIME WARNER 1AT&T AND TIME WARNER.docxRunning Head AT&T AND TIME WARNER 1AT&T AND TIME WARNER.docx
Running Head AT&T AND TIME WARNER 1AT&T AND TIME WARNER.docx
 
Us wireless market_q3_2012_update_nov_2012_chetan_sharma_consulting
Us wireless market_q3_2012_update_nov_2012_chetan_sharma_consultingUs wireless market_q3_2012_update_nov_2012_chetan_sharma_consulting
Us wireless market_q3_2012_update_nov_2012_chetan_sharma_consulting
 
Supply Chain Metrics That Matter: A Focus on Aerospace & Defense Companies 2017
Supply Chain Metrics That Matter: A Focus on Aerospace & Defense Companies 2017Supply Chain Metrics That Matter: A Focus on Aerospace & Defense Companies 2017
Supply Chain Metrics That Matter: A Focus on Aerospace & Defense Companies 2017
 
Tmobile-OmarS
Tmobile-OmarSTmobile-OmarS
Tmobile-OmarS
 
The Deloitte M&A Index 2016
The Deloitte M&A Index 2016The Deloitte M&A Index 2016
The Deloitte M&A Index 2016
 
The Deloitte M&A Index 2016
The Deloitte M&A Index 2016The Deloitte M&A Index 2016
The Deloitte M&A Index 2016
 
PwC Entertainment, media and communications deal insightsQ3 2015
PwC Entertainment, media and communications deal insightsQ3 2015PwC Entertainment, media and communications deal insightsQ3 2015
PwC Entertainment, media and communications deal insightsQ3 2015
 
Nibc 2016 mba-m fin - true north investments - ppt
Nibc 2016   mba-m fin - true north investments - pptNibc 2016   mba-m fin - true north investments - ppt
Nibc 2016 mba-m fin - true north investments - ppt
 
OI Challenges in the Brazilian economic crysis
OI  Challenges in the Brazilian economic crysisOI  Challenges in the Brazilian economic crysis
OI Challenges in the Brazilian economic crysis
 
Nibc 2016 [graduate] - [pepper waves] - ppt
Nibc 2016   [graduate] - [pepper waves] - pptNibc 2016   [graduate] - [pepper waves] - ppt
Nibc 2016 [graduate] - [pepper waves] - ppt
 
Dragon Fund_Sector Update
Dragon Fund_Sector UpdateDragon Fund_Sector Update
Dragon Fund_Sector Update
 
TIME INCORPORATED
TIME INCORPORATEDTIME INCORPORATED
TIME INCORPORATED
 
SBAC Writeup PDF
SBAC Writeup PDFSBAC Writeup PDF
SBAC Writeup PDF
 
T Mobile's Opportunity to win Sprint and 5G
T Mobile's Opportunity to win Sprint and 5GT Mobile's Opportunity to win Sprint and 5G
T Mobile's Opportunity to win Sprint and 5G
 
Defensive Contractor Industry Analysis 2013
Defensive Contractor Industry Analysis 2013Defensive Contractor Industry Analysis 2013
Defensive Contractor Industry Analysis 2013
 
Industry Analysis
Industry AnalysisIndustry Analysis
Industry Analysis
 

dragonturtles FA project

  • 1. T e a m D r a g o n T u r t l e s : A T & T v . V e r i z o n | 1 AT&T v. Verizon: Battle of the Telecom Titans Team: Dragon Turtles Jacob Albers, Alejandra Avila, Merveille Kazimoto, Claire Kelly, Dan Lev Introduction 1. Economy wide & Industry Wide Analysis a. A number of macroeconomic factors are currently affecting the telecommunications industry. Due to how critical telecommunications are to infrastructure, the U.S. regulations and decisions can have a huge impact upon the telecommunications industry. For example, the United States Department of Justice declared that it would move to block AT&T’s attempt to purchase T-Mobile in 2011; a merger that would have AT&T by far the largest American telecommunications company in terms of assets, market share, and coverage. That decision has effectively signaled to the telecommunications industry that the current state of competition between the top four companies will not be allowed to merge with one another - forcing the smaller companies to expend further resources to increase their market share The revelation from the release of NSA documents by Eric Snowden revealed the collusion of the U.S. government with large telecommunications corporations such as AT&T and Verizon to implement massive cyber-spying programs throughout the past decade. This revelation has placed heavy scrutiny and distrust on these companies by both stockholders and the public at large. It is unclear how this might exactly affect AT&T and Verizon in the years to come, but in the short-term, stockholders have demanded further transparency as to government demands (Business Insider, 2013). b. The telecommunications industry is currently in the midst of a massive battle for survival. The two largest competitors, AT&T and Verizon, hold 65% of the overall market share (27.9% and 37.2% respectively in 2014) while Sprint and T-Mobile are ferociously vying for third place (12.3% and 9.5% of market share, respectively). Desperately, both have slashed their prices in order to draw as many customers from their competitors as possible. These tactics have not only put pressure upon these two smaller firms, but upon the larger firms as well. Both AT&T and Verizon’s stock growth has largely remained stagnant over the past couple years, and the One question that we endeavor to answer is which of these companies, AT&T or Verizon, has better weathered this storm in recent years? Besides external pressures from direct competitors, both these telecommunications giants have been attempting to expand their operations in terms of both new geographic regions and new industries. Both companies have spent billions of dollars to purchase smaller peripheral or affiliate companies (Qualcomm and Cricket for AT&T, Hughes Telematics Inc. and Alltel for Verizon) over the past several years. AT&T has taken a riskier, more expansive approach by spending $48.5 billion to purchase DirecTV. With the purchase of DirecTV, AT&T has jumped from 5 million subscribers to its U-verse service to 25 million overall to become the second largest provider of TV cable provider. However, it remains to be seen if AT&T can hold or build upon this new user base in the coming years. Additionally, AT&T is expanding heavily into Mexico, purchasing Iusacell and planning to invest $3 billion there in the coming years. However, the company faces stiff competition from existing Mexican
  • 2. T e a m D r a g o n T u r t l e s : A T & T v . V e r i z o n | 2 telecommunication companies, America Movil and Telefonica - and will likely take operating losses in this area, at least in the short term. As for Verizon, they made the significant move in 2013 of repurchasing their 45% of their stock from UK telecom firm Vodafone. The following year, they capitalized on this reduction of shares by paying out record high dividends. Dupont Analysis: 1. When doing the Dupont Analysis for AT&T and Verizon, one must keep in mind that these are large-scale service companies that have a relatively high amount of leverage with customers considering the limited number of options in the market and the necessity of the service. From the Fig. 2, one can see that there is little difference between the Asset Turnover ratio of both companies - both generally hover between 40-50%. The Net Profit Margin for these two companies is more volatile. In AT&T’s case jumping from 16.2 % to 3.3 % and in Verizon’s case varying from 19.5% to 9.5%. These large fluctuations suggest some variation in the predominant strategy of these telecommunications companies. Ratio Analysis: 1. Return On Equity Fig. 1: Return on Equity (Net Income / Average Stockholder’s Equity). a. AT&T’s return on equity has fluctuated greatly over the last five years from as much as ten cents return in 2013 and as little as two cents return in 2011. This large variance can be explained by AT&T’s large fluctuation in net income. In 2010 and 2013, AT&T had a net income of 18 and 20 billion respectively. According to their 2010 annual report, a timely sale of nonstrategic assets and favorable tax resolutions was the driving force behind a 35 billion dollar gain. In 2013, due to the sale of their advertising solutions segment. This was a large part of a 20 billion dollar decrease in annual expenses resulting in that 20 billion dollar net income. As a result, the return on equity in these years was substantially higher than in years where there was smaller profits such as 2011. b. Verizon had a much steadier return on equity. From 2010 to 2012, Verizon’s return on equity varied by three hundredths of a percent. The return on equity more than doubled from .062 in 2012 to .131 in 2013. This rise could be accredited to Verizon’s acquisition of Vodafone for 130 billion dollars. That acquisition caused Verizon’s income to double
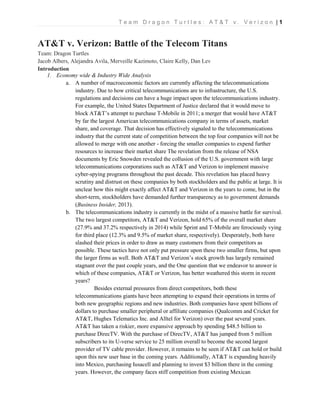
  • 3. T e a m D r a g o n T u r t l e s : A T & T v . V e r i z o n | 3 in 2013. Verizon’s ROE remained at an elevated level in 2014 at .110. This is because they implemented a stock buyback that drastically cut their stockholder’s equity. It is interesting to see a ROE remain at a heightened level in subsequent years because of a dramatic rise in income one year and a dramatic drop in stockholder’s equity the next year. 2. Net Profit Margin Fig. 2: Net Profit Margin (Net Income / Net Sales) a. AT&T’s net profit margin fluctuated similarly to their return on equity in that it was directly related to net income. Their net sales are very consistent rising about 1.5% annually. In years where net income spiked, so did net profit margin. In years where net income fell, so did net profit margin. Again, that explains why 2010 and 2013 had such high net profit margins and 2011 had the lowest net profit margin. b. Verizon’s net profit margin decreased annually from 2010 to 2012. This is because Verizon’s sales were growing at about 4% annually while their net income remained stagnant. In 2013 Verizon’s net income doubled with the Vodafone deal while sales stayed stagnant. This resulted in Verizon’s NPM more than doubling from .091 in 2012 to .195 in 2013. Once their net income returned to a more typical level in 2014 so did their NPM. In 2014, it came back down to .094 which is much more typical of Verizon’s five year NPM average. 3. Asset Turnover
  • 4. T e a m D r a g o n T u r t l e s : A T & T v . V e r i z o n | 4 Fig. 3: Asset Turnover (Net Sales / Average Total Assets) The asset turnover ratio is an efficiency ratio that measures a company's ability to generate sales from its assets by comparing net sales with average total assets. In other words, this ratio shows how efficiently a company can use its assets to generate sales. The total asset turnover ratio calculates net sales as a percentage of assets to show how many sales are generated from each dollar of company assets. Since neither AT&T nor Verizon is a manufacturing company, this analysis focuses only on the total asset turnover rather than the fixed asset turnover. Over the past five years, both AT&T’s and Verizon’s asset turnover ratios remained consistently similar with very slight differences, except in 2014 where the difference was significant. Verizon reported slightly higher asset turnover ratios than AT&T from the year 2010 to the year 2012. However, in 2013 AT&T took the lead reporting a higher asset turnover than Verizon. In 2013, Verizon’s assets decreased as compared to the previous three years as a decline in regulatory fees was partially offset by an increase in revenue related to upgrade fees, hence decreasing that year’s asset turnover. In 2014, Verizon reported a considerable increase in asset turnover from 44% to 55%, this time a significantly higher asset turnover ratio than AT&T’s 45%. Verizon’s increase in asset turnover ratio is credited to the increase in assets resulting from an increase in equipment sales under both the traditional subsidy model and Verizon Edge. 4. Financial Leverage The financial leverage ratio is a measure of how much assets a company holds relative to its equity. A high financial leverage ratio means that the company is using debt and other liabilities to finance its assets, and everything else being equal, is more risky than a company with a lower leverage. Fig. 4: Financial Leverage (Average Total Assets / Average Total Stockholders Equity) From the graph above, it can be seen that there is no significant difference between the two company’s financial leverages over the past five years, with year 2014 as the exception. In both year 2010 and 2011, Verizon reported relatively higher financial leverage than AT&T. In 2012 and 2013, AT&T took the lead with a little higher financial leverage relative to its peer Verizon. Nonetheless, in 2014, Verizon undergone an epic rise in its financial leverage, dramatically outshining its primary rival AT&T. This spike is attributed to the acquisition of Vodafone's 45 percent indirect interest in
  • 5. T e a m D r a g o n T u r t l e s : A T & T v . V e r i z o n | 5 Verizon Wireless. Since financial leverage ratio is a ratio between average total assets and average stockholders’ equity, Vodafone’s acquisition lowered the stockholders’ equity (the denominator of the financial leverage ratio formula) from 95,416 in 2013 to 13,676 in 2014, thus raising the ratio in 2014. Furthermore, the buyout of Vodafone's stake in Verizon Wireless adds leverage to the company during a seemingly tough time when the wireless industry is reaching maturity and growth is slowing down. 5. Annual Revenue Growth Fig. 5: Annual Revenue Growth (%) ( (current revenue / last year revenue) – 1) a. Over the past five years, Verizon has had an steady increase in its annual revenue growth. In 2010, Verizon had a negative annual revenue growth of 1.2% but experienced a growth of 2.8% in 2011 to an annual revenue growth of 2%. As time continued, Verizon has experienced a steady increase in revenue growth, except for 2013 when it declined by 0.4%. According to its 2014 annual report, over the last five years Verizon has increased their number of subscribers for both internet and video which has resulted in their overall annual revenue growth. b. In contrast, AT&T has had a fluctuating annual revenue growth experiencing gains and losses. Its 2010 annual revenue growth of 1.4% increased to 2% in 2011 and fell to 0.6% in 2012. Since 2012, AT&T’s annual revenue growth has steadily increased. The 2014 annual report explains that AT&T is facing challenging competition from competitors, such as Verizon, as well as an increase in regulation of broadland services which can be the cause of the fluctuation in annual revenue growth. c. The annual revenue growth rate for AT&T and Verizon was calculated by dividing the operating revenues expense of the current year by that of the previous year and then converting the result into a percentage. For example, the operating revenue for Verizon in 2014 was 127,079 and 120,550 in 2013, which yield an annual revenue growth of 1.054. The annual revenue growth of 1.054 translates to 5.4%. 6. Working Capital Ratio
  • 6. T e a m D r a g o n T u r t l e s : A T & T v . V e r i z o n | 6 a. In comparison to AT&T, Verizon has had more working capital over the last five years even though it has had more fluctuation. In 2013 Verizon experienced an increase of 1.911, from a ratio in 2012 of 0.788 to a ratio of 2.625 in 2013. The increase in 2013 is most likely a result of Verizon gaining more tangible current liabilities to pay the dues owed to Vodafone for the stock purchase agreements of September 2, 2013. Another factor that could explain the 2013 increase could be Verizon acquiring EdgeCast Networks and upLynk. b. In contrast, AT&T has been able to maintain a relatively stable working capital ratio ranging from 0.598 to 0.859. The company has been able to preserve the ratio of its current assets to total current liabilities between 50% and 100%. c. The working capital ratio for each company was calculated by dividing the current assets by the total current liabilities. For example, the current assets for AT&T for 2014 was 32,028 and the total current liabilities was 37,282. The working capital ratio was 0.859. 7. Return On Assets (ROA)
  • 7. T e a m D r a g o n T u r t l e s : A T & T v . V e r i z o n | 7 Fig. 7: Return On Assets (Net Income / Average Total Assets) a. Return on Assets (ROA) is calculated by dividing net income by average total assets. The Return on Assets is used by financial “analysts, investors, and creditors” to “measure of profitability and management effectiveness, independent of financing strategy.” (pg.250) b. The heightened Return on Assets in 2010 for AT&T (7.5%) was due to the sales of “nonstrategic assets and favorable resolution of income tax matters.” The purchase of Qualcomm, Inc. for 1.93 billion in 2011 resulted in a decrease in assets. A newly purchased asset may have a negative effect on the overall net operating income of the combined company, thereby reducing the return on assets. The ROA was 1.5% in 2011. In 2013, AT&T reduced expenses by $20 billion. The “expense decrease was primarily due to the sale of our Advertising Solutions segment and lower amortization of intangibles for customer lists related to acquisitions, offset by increased depreciation associated with ongoing capital spending for network upgrades and expansion.” A reduction in company expenses increased net income during the period. AT&T also purchased Cricket Wireless for 1.2 billion in 2013. This transaction reduced average total assets. However, the net income is still higher than average total assets, so the Return on Assets remains relatively high. In 2014, the decrease in Return of Assets is due to the fluctuations in net income and a steady increase in average total assets. c. The ROA was 4.6% in 2010. Verizon was able to increase its customer base and net income during that period. The ROA slightly decreased to 4.4% in 2011. On July 2012, Verizon purchased HUGHES Telematics, Inc. “for approximately $12 per share in cash for a total acquisition price of $0.6 billion.” This transaction resulted in a decrease in total average assets. The ROA was 4.7%. Compared to the ROA from the previous year, the Return on Assets slightly increased. The acquisition increased Verizon’s “ability to bring more telematics offerings to market for existing and new customers.” The purchase helped increase income. Any potential loss from the purchase of HUGHES Telematics, Inc. was not particularly felt in Verizon’s growth. The Return on Assets was 8.6% in 2013. The company had acquired EdgeCast Networks & upLynk. In 2014, the Return on Assets was 5.1%. During that time, Verizon purchased Omnitel. The company experienced a gain of $1.9 billion by selling “Omnitel interest in Equity in earnings of unconsolidated business of unconsolidated businesses on” the income statement. 8. Dividend Payout Ratio
  • 8. T e a m D r a g o n T u r t l e s : A T & T v . V e r i z o n | 8 a. AT&T has paid between 9.5 billion and 10.2 billion dollars in dividends over the past five years. The only reason their dividend payout ratio varies is due to their sporadic year to year net income. b. Between 2010 and 2012, Verizon paid about the same amount of dividends annually, and because their net income was also consistent for those three years, the dividend payout ratio was about the same. It was 53 cents in 2010, 54 cent in 2011, and 50 cents in 2012. In 2013, they paid 5.9 billion dollars in dividends, but that was not nearly enough to offset the doubling of the net income that year from the Vodafone deal. As a result, the dividend payout ratio dropped to 25 cents. In 2014, after buying back the shares from the Vodafone deal, Verizon decided to raise their dividend payout by 2 billion dollars to 7.8 billion. Once they were in control of their shares, they felt it was safe to pay out a higher dividend. This resulted in a higher dividend payout ratio of 65 cents. 9. Debt-to-Equity Ratio a. AT&T’s Debt-to-Equity Ratio has steadily increased over the past 5 years from 1.41 to 2.37. This is due in part to consistent yearly declines in Stockholder’s Equity, and in part to consistent yearly increases in Liabilities. This suggests that AT&T has been increasingly aggressive in using debt to finance its growth over time - but since these changes have been gradual and still within the standard bounds of the telecommunication industry.
  • 9. T e a m D r a g o n T u r t l e s : A T & T v . V e r i z o n | 9 b. Verizon’s Debt-to-Equity Ratio has remained largely steady and only growing slightly over time (between 1.53 and 1.87). However, due to the repurchase of a significant amount of their stock from Vodafone, the Stockholder’s equity for Verizon dropped significantly (~89%) in 2014. This raised their D/E ratio to 16.02 - allowing them to pay their remaining stockholders far higher dividends per share, but also greatly increasing the risk that each individual stockholder is liable for (considering the health of Verizon’s other metrics, this is not a significant issue). 10. Earnings Per Share Ratio a. AT&T’s earnings per share have risen and fallen over the past 5 years, with the low at $ 0 .66 and the high at $ 3.39. These fluctuations are likely due to the fluctuations in net income as detailed above in other ratios. b. Verizon’s earnings per share have initially fallen over the period of 2010 to 2012 ($ 0.90 to $ 0.31). However, they have risen significantly over 2013-2014 to $ 2.42, peaking at $ 4.01. While precise cause may be difficult to pinpoint, the purchase of Vodafone’s stock and the subsequent dividends payout is likely the strongest factor in the sizeable increase in EPS. c. Neither company shows very consistent numbers in this area, so EPS should not be considered as a deciding factor of which is the preferred company one should in. 11. Accounting Analysis: A. Depreciation Methods & Timescales a. AT&T and Verizon both use straight-line method depreciation. Item Depreciated AT&T (Lives)Amounts in Million Verizon (Lives)Amounts in Million Land (Indefinite) 1,567 (Indefinite) 763 Buildings and Improvements (10-44) 32,204 (15-45) 25,209 Central Office Equipment (3-10) 89,857 (3-15) 129,619
  • 10. T e a m D r a g o n T u r t l e s : A T & T v . V e r i z o n | 10 Cable, Wiring, Conduit (15-50) 72,766 (11-50) 54,797 Work In Progress (Indefinite) 3,053 (Indefinite) 4,580 Misc. Equipment (3-15) 74,244 (3-20) 9,166 Software (3-5) 8,604 N/A Verizon is increasing its net income in the short term due to the fact that they have longer estimated lives of their assets. This leads to Verizon having less annual expenses for comparable items to AT&T because Verizon spreads out the depreciation of those items over slightly more years. B. Inventory Valuation Methods Both AT&T and Verizon use FIFO as required by GAAP for financial reporting. Therefore, there should be no discrepancies between the two due to inventory valuation. C. Allowances for Uncollectable Accounts (dollars in millions) Year Verizon AT&T 2010 1,246 1,334 2011 1,026 1,136 2012 972 1,117 2013 993 954 2014 1,095 1,032 5. Given the prior information, Verizon is our preferred company for the following reasons. First, Verizon has been able to maintain a higher annual growth rate than AT&T and as a result has a larger user base. Verizon has also been able to maintain a higher current ratio, which means they have more tangible assets. Lastly, taking into consideration the current volatile industry climate, Verizon has taken a more conservative approach of using assets to repurchase stock from Vodafone and pay back shareholders while AT&T has taken a more risky approach by aggressively expanding, buying Direct TV, and expanding its services into Mexico. 6. The stock price for Verizon over the past two years remains steadily between $45 to $50. The stock price for AT&T for the past two years is between $32 and $38. Without a dramatic shock to the economy, we would expect the value of the stock for the companies to remain relatively stable. We are assuming that markets are efficient.