SlideShare a Scribd company logo
1 of 5
Philip Addison – 4/6/2016
Time Warner Incorporated NYSE: TWX
Current Recommendation: BUY
INDUSTRY: MEDIA ENTERTAINMENT
Description:
Time Warner is an American multinational multimedia and
entertainment conglomerate with assets such as HBO, Warner
Brothers and DC Comics. With major operations in film and
television, it is the third largest television networks and film
entertainment company in terms of revenue.
BUY Recommendation
After thoroughly analysing the company, I
recommend buying the stock or even better,
purchasing a call option in the near future. This
view is fuelled by the fact with ever increasing free
cash flows and a lower cost of capital than ROIC,
TWX will see an increase in share price. The
diminishing number of shares outstanding will also
play a role in this. Having said that, it may be
prudent to further investigate other companies in
the same industry. They mostly have better
fundamentals than TWX which does not even beat
the market.
Key Points
- 5 year stock price is
upward facing signifying
growth
- In 2011, management
decided to focus on
maximizing efficiency by
cutting overhead costs.
This was an effort to
increase margins
- Stock price has since by
fuelled by this effort but
further analysis will show
that it is slowing down
- Although stock price has
been increasing at a faster
rate than the S&P 500, it
still lags behind
competition
Financial Management
The horizontal trend
analysis (2011-2015) shows
a bit of a hit and miss
approach to Time Warner’s
finances for the period.
Although management was
meeting their goal of
increasing margins, 2014
took a big hit and the
company has still not seen
2011 revenue numbers. The
table below shows that in
all but one of the years,
Gross Income has grown. Sales growth also shows a positive
correlation with COGS growth.
Technical Analysis
Vertical trend
analysisforthe
past 10 shows how
Time Warner has
gradually
decreasedits
proportionof
intangible assetsas
well asitsNetPPE,
whilstincreasingits
OtherLong Term
Assetsand
Accounts
Receivables.
Evidence also
pointstowardsthe greaterreliance of debtuse inthe firmas Total Liabilities encompassagreaterportionof the
balance sheet.
Time Warner has faced a tumultuous time in the past five years. After
reaching an all-time 5 year high revenue of 29.8 billion in FY2013,
FY2016 is still trying to recover from the losses suffered in FY2014 and
FY2015. Stock price has gradually increased over the past five years at a
pace quicker than the S&P 500 as shown on page 5. The 5 day moving
average and average number of shares traded indicates that whilst TWX
might be stable in the midterm, it will increase in the long run.
ROA & ROE
 Since the recession in 2008,
ROE has been steadily
increasing albeit at a slower
rate than the market.
 ROE reached an all-time
high of 16.23% due to the
decreasing amount of
shareholders equity and the
increasing amount of net
income attributable to them.
 In comparison to its
competitors, Time Warner
boasts the third highest ROA
numbers at 6% behind Walt
Disney’s 9.51% and
Twentieth Century Fox’s
16.6%
 Since the recession, Time
Warner has always posted
gradual increases in its ROA
with the 4 other major
competitors all posting losses
at some stage.
Risk Analysis
TWX operates in a highly
competitive, consumer driven and
rapidly changing environment. As
reported in the fundamental
analysis, macroeconomic factors
can greatly affect firm and
industry performance. With the
advent of the internet of things,
more and more consumers are
switching from traditional cable
based viewing systems to a more
online medium. Furthermore, with
a high proportion of assets being
intangible, management is
expecting to incur significant
legal fees involving resolution,
defence and creation of IP.
Price to Earnings (P/E)
 When compared to the
industry, Time Warner has
had an inferior price to
earnings ratio in each of the
past 10 years as shown in
Exhibit 4.3.
 A negative EPS of -11.21
during the crisis of 2008
meant that there was no P/E
ratio for that year.
 As share price has increased,
so too has Earnings per
share. This can be attributed
to the diminishing number of
shares outstanding in the
market as shown in Exhibit
4.1. EPS has increased in
each of the past 7 years with
the P/E ratio declining three
times in 2011, 2013 and
2015.
 Compared to its 4 major
competitors, Time Warner
has the second worst P/E
ratio with investors willing to
pay $13.74 for every dollar
as shown in Exhibit 4.2
Time Warner Inc
Comcast Corp
Time Warner Cable Inc
Walt Disney Co
Twenty-First Century Fox Inc
Price to Book Value (P/BV)
 Time Warner has the lowest
P/BV of any of its 4 major
competitors with investors
only willing to pay a 2.23
premium as opposed to Time
Warner Cable Inc’s 5.83, as
shown in Exhibit 3.2.
 Although Time Warner has
increased its price to book
value ratio consistently after
2008, it has however, lagged
behind the industry in each
of those years as shown in
Exhibit 3.3.
$0
$1,000,000,000
$2,000,000,000
$3,000,000,000
$4,000,000,000
$5,000,000,000
$6,000,000,000
$7,000,000,000
2016 2017 2018 2019 2020
Future Free Cash Flow for TWX
FCF
Current
Month
Last
Month
Two
Months
Ago
Three
Months
Ago
Strong Buy 8 8 8 8
Buy 20 20 18 18
Hold 10 10 10 10
Underperfo
rm
0 0 0 0
Sell 0 0 0 0
Recommendation Trends
Company Valuation
At present, Time Warner is undervalued relative
to its intrinsic stock price value. The company
valuation was fuelled by assumptions that I
made in part to reflect how past performance
can have an impact on future performance. This
why I chose a growth rate constant of 4.57% in
revenue as that was the 5 year average. With an
increasing free cash flow, Time Warner will
gradually start to see financial numbers it had
before the recession. With a cost of capital that
is less than its ROIC,Time Warner can expect
to see an increase in its stock price over the
coming years. Exhibit (?) shows further details
on how the valuation process was carried out.
Upgrades & Downgrades History
Analyst Opinion
Common consensus
amongst brokers is that
Time Warner is expected
to appreciate in value over
the coming years.
Moreover, 2 brokers
expect it to outperform
relative to the market
although neither one has
stated whether it expects
them to outperform their
industry peers. Given the
fundamental analysis
however, this would seem unlikely.
Figure 1.1 shows how optimistic people are about TWX.
Date ResearchFirm Action From To
Feb 5, 2016 Telsey Advisory Group Initiated Outperform
Jan 14, 2016 Drexel Hamilton Initiated Buy
Nov 5, 2015 CreditAgricole Downgrade Buy Outperform
Nov 5, 2015 BofA/Merrill Downgrade Buy Neutral
Nov 5, 2015 Wells Fargo Downgrade Outperform Market Perform
Oct 20, 2015 Pivotal Research Group Initiated Buy
Aug 20, 2015 Bernstein Downgrade Outperform Mkt Perform
Apr 28, 2015 CreditAgricole Initiated Buy
Mar 5, 2015 Deutsche Bank Initiated Buy
Jan 16, 2015 Stifel Downgrade Buy Hold
TIME INCORPORATED

More Related Content

What's hot

Pivotal Research: US TV Update April 2012
Pivotal Research: US TV Update April 2012Pivotal Research: US TV Update April 2012
Pivotal Research: US TV Update April 2012Brian Crotty
 
Endo An Underappreciated Platform
Endo An Underappreciated PlatformEndo An Underappreciated Platform
Endo An Underappreciated PlatformLester Goh
 
SSIF Performance Update for Investment Committee - FY2015
SSIF Performance Update for Investment Committee - FY2015SSIF Performance Update for Investment Committee - FY2015
SSIF Performance Update for Investment Committee - FY2015Greg Poapst
 
The Deloitte CFO Survey: 2013 Q2 results
The Deloitte CFO Survey: 2013 Q2 resultsThe Deloitte CFO Survey: 2013 Q2 results
The Deloitte CFO Survey: 2013 Q2 resultsDeloitte UK
 
Valuation Insights: Second Quarter 2017
Valuation Insights: Second Quarter 2017Valuation Insights: Second Quarter 2017
Valuation Insights: Second Quarter 2017Duff & Phelps
 
Tricumen / Capital Markets: Regions 1Q16_open 260516
Tricumen / Capital Markets: Regions 1Q16_open 260516Tricumen / Capital Markets: Regions 1Q16_open 260516
Tricumen / Capital Markets: Regions 1Q16_open 260516Tricumen Ltd
 
CMC Markets Trading Smart Series: Company Fundamentals
CMC Markets Trading Smart Series: Company FundamentalsCMC Markets Trading Smart Series: Company Fundamentals
CMC Markets Trading Smart Series: Company FundamentalsCMCMarketsSG
 
Corporate Loans to Manage Rate Sensitivity_-_White_Paper
Corporate Loans to Manage Rate Sensitivity_-_White_PaperCorporate Loans to Manage Rate Sensitivity_-_White_Paper
Corporate Loans to Manage Rate Sensitivity_-_White_PaperAllan Smallwood, CFA
 
Realty income-investor-presentation-4 q16
Realty income-investor-presentation-4 q16Realty income-investor-presentation-4 q16
Realty income-investor-presentation-4 q16realtyincome2016
 
FRCG Assignment of Atul ltd
FRCG Assignment of Atul ltdFRCG Assignment of Atul ltd
FRCG Assignment of Atul ltdSounak Bhadra
 
2005 Outlook Sectors and themes - Executive Summary
2005 Outlook Sectors and themes - Executive Summary2005 Outlook Sectors and themes - Executive Summary
2005 Outlook Sectors and themes - Executive SummaryRichard Woolhouse
 
Abacus Weath Partners Investment slideshow
Abacus Weath Partners Investment slideshowAbacus Weath Partners Investment slideshow
Abacus Weath Partners Investment slideshowAbacus Wealth Partners
 
Allied Motion Changing Mix And Refinancing Opportunity Set Up 60% Return Pote...
Allied Motion Changing Mix And Refinancing Opportunity Set Up 60% Return Pote...Allied Motion Changing Mix And Refinancing Opportunity Set Up 60% Return Pote...
Allied Motion Changing Mix And Refinancing Opportunity Set Up 60% Return Pote...Lester Goh
 

What's hot (20)

Pivotal Research: US TV Update April 2012
Pivotal Research: US TV Update April 2012Pivotal Research: US TV Update April 2012
Pivotal Research: US TV Update April 2012
 
Endo An Underappreciated Platform
Endo An Underappreciated PlatformEndo An Underappreciated Platform
Endo An Underappreciated Platform
 
SSIF Performance Update for Investment Committee - FY2015
SSIF Performance Update for Investment Committee - FY2015SSIF Performance Update for Investment Committee - FY2015
SSIF Performance Update for Investment Committee - FY2015
 
RGR Executive Summary
RGR Executive SummaryRGR Executive Summary
RGR Executive Summary
 
The Deloitte CFO Survey: 2013 Q2 results
The Deloitte CFO Survey: 2013 Q2 resultsThe Deloitte CFO Survey: 2013 Q2 results
The Deloitte CFO Survey: 2013 Q2 results
 
Autoparts Initiation 2013
Autoparts Initiation 2013Autoparts Initiation 2013
Autoparts Initiation 2013
 
Distressed_White_Paper_Draft_02-16-2010
Distressed_White_Paper_Draft_02-16-2010Distressed_White_Paper_Draft_02-16-2010
Distressed_White_Paper_Draft_02-16-2010
 
Shareholder Activism
Shareholder ActivismShareholder Activism
Shareholder Activism
 
Uk 2018 report
Uk 2018 reportUk 2018 report
Uk 2018 report
 
Valuation Insights: Second Quarter 2017
Valuation Insights: Second Quarter 2017Valuation Insights: Second Quarter 2017
Valuation Insights: Second Quarter 2017
 
Localiza_Initiate_Oct06
Localiza_Initiate_Oct06Localiza_Initiate_Oct06
Localiza_Initiate_Oct06
 
Tricumen / Capital Markets: Regions 1Q16_open 260516
Tricumen / Capital Markets: Regions 1Q16_open 260516Tricumen / Capital Markets: Regions 1Q16_open 260516
Tricumen / Capital Markets: Regions 1Q16_open 260516
 
CMC Markets Trading Smart Series: Company Fundamentals
CMC Markets Trading Smart Series: Company FundamentalsCMC Markets Trading Smart Series: Company Fundamentals
CMC Markets Trading Smart Series: Company Fundamentals
 
P&P Initiation 2016
P&P Initiation 2016P&P Initiation 2016
P&P Initiation 2016
 
Corporate Loans to Manage Rate Sensitivity_-_White_Paper
Corporate Loans to Manage Rate Sensitivity_-_White_PaperCorporate Loans to Manage Rate Sensitivity_-_White_Paper
Corporate Loans to Manage Rate Sensitivity_-_White_Paper
 
Realty income-investor-presentation-4 q16
Realty income-investor-presentation-4 q16Realty income-investor-presentation-4 q16
Realty income-investor-presentation-4 q16
 
FRCG Assignment of Atul ltd
FRCG Assignment of Atul ltdFRCG Assignment of Atul ltd
FRCG Assignment of Atul ltd
 
2005 Outlook Sectors and themes - Executive Summary
2005 Outlook Sectors and themes - Executive Summary2005 Outlook Sectors and themes - Executive Summary
2005 Outlook Sectors and themes - Executive Summary
 
Abacus Weath Partners Investment slideshow
Abacus Weath Partners Investment slideshowAbacus Weath Partners Investment slideshow
Abacus Weath Partners Investment slideshow
 
Allied Motion Changing Mix And Refinancing Opportunity Set Up 60% Return Pote...
Allied Motion Changing Mix And Refinancing Opportunity Set Up 60% Return Pote...Allied Motion Changing Mix And Refinancing Opportunity Set Up 60% Return Pote...
Allied Motion Changing Mix And Refinancing Opportunity Set Up 60% Return Pote...
 

Viewers also liked

Resumen de todas las exposiciones del semestre de gestion del th
Resumen de todas las exposiciones del semestre de gestion del thResumen de todas las exposiciones del semestre de gestion del th
Resumen de todas las exposiciones del semestre de gestion del thGloria Cepeda
 
Blake Jensen's Visual Communication Portfolio
Blake Jensen's Visual Communication PortfolioBlake Jensen's Visual Communication Portfolio
Blake Jensen's Visual Communication PortfolioBlake Jensen
 
Hunters International - Company Profile
Hunters International - Company ProfileHunters International - Company Profile
Hunters International - Company ProfileAlicia Khor
 
Inventory Planning Logic
Inventory Planning LogicInventory Planning Logic
Inventory Planning LogicDan Shank, CPIM
 

Viewers also liked (6)

Resumen de todas las exposiciones del semestre de gestion del th
Resumen de todas las exposiciones del semestre de gestion del thResumen de todas las exposiciones del semestre de gestion del th
Resumen de todas las exposiciones del semestre de gestion del th
 
Blake Jensen's Visual Communication Portfolio
Blake Jensen's Visual Communication PortfolioBlake Jensen's Visual Communication Portfolio
Blake Jensen's Visual Communication Portfolio
 
Fiks ppt
Fiks pptFiks ppt
Fiks ppt
 
CV HAFNI 2
CV HAFNI 2CV HAFNI 2
CV HAFNI 2
 
Hunters International - Company Profile
Hunters International - Company ProfileHunters International - Company Profile
Hunters International - Company Profile
 
Inventory Planning Logic
Inventory Planning LogicInventory Planning Logic
Inventory Planning Logic
 

Similar to TIME INCORPORATED

Aerospace and Defense Value Creators Report 2015
Aerospace and Defense Value Creators Report 2015Aerospace and Defense Value Creators Report 2015
Aerospace and Defense Value Creators Report 2015Seda Eskiler
 
Creating value through law firm mergers
Creating value through law firm mergersCreating value through law firm mergers
Creating value through law firm mergersIan Kehoe
 
2016Q1 SCFG Commentary with Snapshot
2016Q1 SCFG Commentary with Snapshot2016Q1 SCFG Commentary with Snapshot
2016Q1 SCFG Commentary with SnapshotDrew Beja
 
The Deloitte M&A Index 2016
The Deloitte M&A Index 2016The Deloitte M&A Index 2016
The Deloitte M&A Index 2016Deloitte UK
 
The Deloitte M&A Index 2016
The Deloitte M&A Index 2016The Deloitte M&A Index 2016
The Deloitte M&A Index 2016Deloitte UK
 
Mien Phi Tai 10 Bai Assignment Mau Tu Moi Chu De
Mien Phi Tai 10 Bai Assignment Mau Tu Moi Chu DeMien Phi Tai 10 Bai Assignment Mau Tu Moi Chu De
Mien Phi Tai 10 Bai Assignment Mau Tu Moi Chu DeEssay24h Viết thuê Essay
 
2015Q1 SCFG Commentary_with Snapshot
2015Q1 SCFG Commentary_with Snapshot2015Q1 SCFG Commentary_with Snapshot
2015Q1 SCFG Commentary_with SnapshotDrew Beja
 
Avant garde wealth mgmt - Quarterly letter - 1306
Avant garde wealth mgmt - Quarterly letter - 1306Avant garde wealth mgmt - Quarterly letter - 1306
Avant garde wealth mgmt - Quarterly letter - 1306Gaurav Jalan
 
IntroductionThe company that has been researched is the Toyota .docx
IntroductionThe company that has been researched is the Toyota .docxIntroductionThe company that has been researched is the Toyota .docx
IntroductionThe company that has been researched is the Toyota .docxmariuse18nolet
 
1COMPARISON OF AT&T & VERIZONRunning head COMPARISON OF .docx
1COMPARISON OF AT&T & VERIZONRunning head COMPARISON OF .docx1COMPARISON OF AT&T & VERIZONRunning head COMPARISON OF .docx
1COMPARISON OF AT&T & VERIZONRunning head COMPARISON OF .docxhyacinthshackley2629
 
Fauji Fertilizer
Fauji  Fertilizer Fauji  Fertilizer
Fauji Fertilizer ArSu Ali
 
Supply Chain Metrics That Matter: A Focus on Aerospace & Defense Companies 2017
Supply Chain Metrics That Matter: A Focus on Aerospace & Defense Companies 2017Supply Chain Metrics That Matter: A Focus on Aerospace & Defense Companies 2017
Supply Chain Metrics That Matter: A Focus on Aerospace & Defense Companies 2017Lora Cecere
 
Investment/Technical Analyst
Investment/Technical AnalystInvestment/Technical Analyst
Investment/Technical AnalystFinancialBuzzGuru
 
English - 5 - Strategic benchmarking in the supply chain triangle.
English - 5 - Strategic benchmarking in the supply chain triangle.English - 5 - Strategic benchmarking in the supply chain triangle.
English - 5 - Strategic benchmarking in the supply chain triangle.Bram Desmet
 

Similar to TIME INCORPORATED (20)

Aerospace and Defense Value Creators Report 2015
Aerospace and Defense Value Creators Report 2015Aerospace and Defense Value Creators Report 2015
Aerospace and Defense Value Creators Report 2015
 
US
USUS
US
 
Creating value through law firm mergers
Creating value through law firm mergersCreating value through law firm mergers
Creating value through law firm mergers
 
Finance
FinanceFinance
Finance
 
2016Q1 SCFG Commentary with Snapshot
2016Q1 SCFG Commentary with Snapshot2016Q1 SCFG Commentary with Snapshot
2016Q1 SCFG Commentary with Snapshot
 
The Deloitte M&A Index 2016
The Deloitte M&A Index 2016The Deloitte M&A Index 2016
The Deloitte M&A Index 2016
 
The Deloitte M&A Index 2016
The Deloitte M&A Index 2016The Deloitte M&A Index 2016
The Deloitte M&A Index 2016
 
Mien Phi Tai 10 Bai Assignment Mau Tu Moi Chu De
Mien Phi Tai 10 Bai Assignment Mau Tu Moi Chu DeMien Phi Tai 10 Bai Assignment Mau Tu Moi Chu De
Mien Phi Tai 10 Bai Assignment Mau Tu Moi Chu De
 
2015Q1 SCFG Commentary_with Snapshot
2015Q1 SCFG Commentary_with Snapshot2015Q1 SCFG Commentary_with Snapshot
2015Q1 SCFG Commentary_with Snapshot
 
Wrhe 4 q2004 letter
Wrhe 4 q2004 letterWrhe 4 q2004 letter
Wrhe 4 q2004 letter
 
US Strategy Weekly
US Strategy Weekly US Strategy Weekly
US Strategy Weekly
 
Avant garde wealth mgmt - Quarterly letter - 1306
Avant garde wealth mgmt - Quarterly letter - 1306Avant garde wealth mgmt - Quarterly letter - 1306
Avant garde wealth mgmt - Quarterly letter - 1306
 
IntroductionThe company that has been researched is the Toyota .docx
IntroductionThe company that has been researched is the Toyota .docxIntroductionThe company that has been researched is the Toyota .docx
IntroductionThe company that has been researched is the Toyota .docx
 
1COMPARISON OF AT&T & VERIZONRunning head COMPARISON OF .docx
1COMPARISON OF AT&T & VERIZONRunning head COMPARISON OF .docx1COMPARISON OF AT&T & VERIZONRunning head COMPARISON OF .docx
1COMPARISON OF AT&T & VERIZONRunning head COMPARISON OF .docx
 
Fauji Fertilizer
Fauji  Fertilizer Fauji  Fertilizer
Fauji Fertilizer
 
Supply Chain Metrics That Matter: A Focus on Aerospace & Defense Companies 2017
Supply Chain Metrics That Matter: A Focus on Aerospace & Defense Companies 2017Supply Chain Metrics That Matter: A Focus on Aerospace & Defense Companies 2017
Supply Chain Metrics That Matter: A Focus on Aerospace & Defense Companies 2017
 
RENT Report
RENT ReportRENT Report
RENT Report
 
2. opxs (15 may 2019)
2. opxs (15 may 2019)2. opxs (15 may 2019)
2. opxs (15 may 2019)
 
Investment/Technical Analyst
Investment/Technical AnalystInvestment/Technical Analyst
Investment/Technical Analyst
 
English - 5 - Strategic benchmarking in the supply chain triangle.
English - 5 - Strategic benchmarking in the supply chain triangle.English - 5 - Strategic benchmarking in the supply chain triangle.
English - 5 - Strategic benchmarking in the supply chain triangle.
 

TIME INCORPORATED

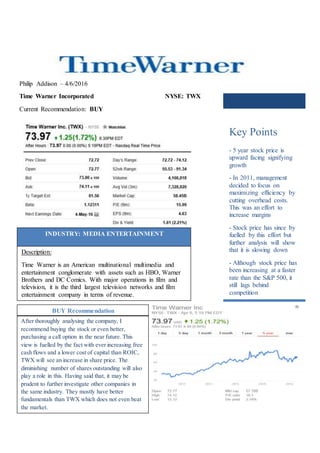
  • 1. Philip Addison – 4/6/2016 Time Warner Incorporated NYSE: TWX Current Recommendation: BUY INDUSTRY: MEDIA ENTERTAINMENT Description: Time Warner is an American multinational multimedia and entertainment conglomerate with assets such as HBO, Warner Brothers and DC Comics. With major operations in film and television, it is the third largest television networks and film entertainment company in terms of revenue. BUY Recommendation After thoroughly analysing the company, I recommend buying the stock or even better, purchasing a call option in the near future. This view is fuelled by the fact with ever increasing free cash flows and a lower cost of capital than ROIC, TWX will see an increase in share price. The diminishing number of shares outstanding will also play a role in this. Having said that, it may be prudent to further investigate other companies in the same industry. They mostly have better fundamentals than TWX which does not even beat the market. Key Points - 5 year stock price is upward facing signifying growth - In 2011, management decided to focus on maximizing efficiency by cutting overhead costs. This was an effort to increase margins - Stock price has since by fuelled by this effort but further analysis will show that it is slowing down - Although stock price has been increasing at a faster rate than the S&P 500, it still lags behind competition
  • 2. Financial Management The horizontal trend analysis (2011-2015) shows a bit of a hit and miss approach to Time Warner’s finances for the period. Although management was meeting their goal of increasing margins, 2014 took a big hit and the company has still not seen 2011 revenue numbers. The table below shows that in all but one of the years, Gross Income has grown. Sales growth also shows a positive correlation with COGS growth. Technical Analysis Vertical trend analysisforthe past 10 shows how Time Warner has gradually decreasedits proportionof intangible assetsas well asitsNetPPE, whilstincreasingits OtherLong Term Assetsand Accounts Receivables. Evidence also pointstowardsthe greaterreliance of debtuse inthe firmas Total Liabilities encompassagreaterportionof the balance sheet. Time Warner has faced a tumultuous time in the past five years. After reaching an all-time 5 year high revenue of 29.8 billion in FY2013, FY2016 is still trying to recover from the losses suffered in FY2014 and FY2015. Stock price has gradually increased over the past five years at a pace quicker than the S&P 500 as shown on page 5. The 5 day moving average and average number of shares traded indicates that whilst TWX might be stable in the midterm, it will increase in the long run.
  • 3. ROA & ROE  Since the recession in 2008, ROE has been steadily increasing albeit at a slower rate than the market.  ROE reached an all-time high of 16.23% due to the decreasing amount of shareholders equity and the increasing amount of net income attributable to them.  In comparison to its competitors, Time Warner boasts the third highest ROA numbers at 6% behind Walt Disney’s 9.51% and Twentieth Century Fox’s 16.6%  Since the recession, Time Warner has always posted gradual increases in its ROA with the 4 other major competitors all posting losses at some stage. Risk Analysis TWX operates in a highly competitive, consumer driven and rapidly changing environment. As reported in the fundamental analysis, macroeconomic factors can greatly affect firm and industry performance. With the advent of the internet of things, more and more consumers are switching from traditional cable based viewing systems to a more online medium. Furthermore, with a high proportion of assets being intangible, management is expecting to incur significant legal fees involving resolution, defence and creation of IP. Price to Earnings (P/E)  When compared to the industry, Time Warner has had an inferior price to earnings ratio in each of the past 10 years as shown in Exhibit 4.3.  A negative EPS of -11.21 during the crisis of 2008 meant that there was no P/E ratio for that year.  As share price has increased, so too has Earnings per share. This can be attributed to the diminishing number of shares outstanding in the market as shown in Exhibit 4.1. EPS has increased in each of the past 7 years with the P/E ratio declining three times in 2011, 2013 and 2015.  Compared to its 4 major competitors, Time Warner has the second worst P/E ratio with investors willing to pay $13.74 for every dollar as shown in Exhibit 4.2 Time Warner Inc Comcast Corp Time Warner Cable Inc Walt Disney Co Twenty-First Century Fox Inc Price to Book Value (P/BV)  Time Warner has the lowest P/BV of any of its 4 major competitors with investors only willing to pay a 2.23 premium as opposed to Time Warner Cable Inc’s 5.83, as shown in Exhibit 3.2.  Although Time Warner has increased its price to book value ratio consistently after 2008, it has however, lagged behind the industry in each of those years as shown in Exhibit 3.3.
  • 4. $0 $1,000,000,000 $2,000,000,000 $3,000,000,000 $4,000,000,000 $5,000,000,000 $6,000,000,000 $7,000,000,000 2016 2017 2018 2019 2020 Future Free Cash Flow for TWX FCF Current Month Last Month Two Months Ago Three Months Ago Strong Buy 8 8 8 8 Buy 20 20 18 18 Hold 10 10 10 10 Underperfo rm 0 0 0 0 Sell 0 0 0 0 Recommendation Trends Company Valuation At present, Time Warner is undervalued relative to its intrinsic stock price value. The company valuation was fuelled by assumptions that I made in part to reflect how past performance can have an impact on future performance. This why I chose a growth rate constant of 4.57% in revenue as that was the 5 year average. With an increasing free cash flow, Time Warner will gradually start to see financial numbers it had before the recession. With a cost of capital that is less than its ROIC,Time Warner can expect to see an increase in its stock price over the coming years. Exhibit (?) shows further details on how the valuation process was carried out. Upgrades & Downgrades History Analyst Opinion Common consensus amongst brokers is that Time Warner is expected to appreciate in value over the coming years. Moreover, 2 brokers expect it to outperform relative to the market although neither one has stated whether it expects them to outperform their industry peers. Given the fundamental analysis however, this would seem unlikely. Figure 1.1 shows how optimistic people are about TWX. Date ResearchFirm Action From To Feb 5, 2016 Telsey Advisory Group Initiated Outperform Jan 14, 2016 Drexel Hamilton Initiated Buy Nov 5, 2015 CreditAgricole Downgrade Buy Outperform Nov 5, 2015 BofA/Merrill Downgrade Buy Neutral Nov 5, 2015 Wells Fargo Downgrade Outperform Market Perform Oct 20, 2015 Pivotal Research Group Initiated Buy Aug 20, 2015 Bernstein Downgrade Outperform Mkt Perform Apr 28, 2015 CreditAgricole Initiated Buy Mar 5, 2015 Deutsche Bank Initiated Buy Jan 16, 2015 Stifel Downgrade Buy Hold