
Recommended
More Related Content
Viewers also liked
Viewers also liked (11)
Similar to K-pop Twitter Analysis
Similar to K-pop Twitter Analysis (20)
K-pop Twitter Analysis
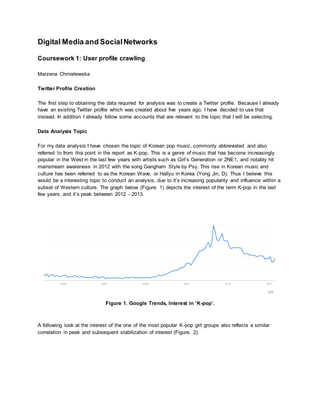
- 1. Digital Media and SocialNetworks Coursework 1: User profile crawling Marzena Chmielewska Twitter Profile Creation The first step to obtaining the data required for analysis was to create a Twitter profile. Because I already have an existing Twitter profile which was created about five years ago, I have decided to use that instead. In addition I already follow some accounts that are relevant to the topic that I will be selecting. Data Analysis Topic For my data analysis I have chosen the topic of Korean pop music, commonly abbreviated and also referred to from this point in the report as K-pop. This is a genre of music that has become increasingly popular in the West in the last few years with artists such as Girl’s Generation or 2NE1, and notably hit mainstream awareness in 2012 with the song Gangham Style by Psy. This rise in Korean music and culture has been referred to as the Korean Wave, or Hallyu in Korea (Yong Jin, D). Thus I believe this would be a interesting topic to conduct an analysis, due to it’s increasing popularity and influence within a subset of Western culture. The graph below (Figure. 1) depicts the interest of the term K-pop in the last few years, and it’s peak between 2012 - 2013. Figure 1. Google Trends, Interest in ‘K-pop’. A following look at the interest of the one of the most popular K-pop girl groups also reflects a similar correlation in peak and subsequent stabilization of interest (Figure. 2).
- 2. Figure 2. Google Trends, Interest in ‘Girl’s Generation’. Profiles followed for the needs of the analysis: Username Following Followers Ailee (@itzailee) 212 768,000 에릭남 (Eric Nam) 382 175,000 SNSD Korean (Girls Generation) (@snsdkorean) 22 155,000 GOT7(@GOT7Official) 46 663,000 Kim Hyun Ah (@4M_hyunah) 47 471,000 PSY(@psy_oppa) 616 3,920,000 K.will(@Thsm1) 154 299,000 allkpop(@allkpop) 524 2,100,000 G-Dragon(@IBGDRGN) 109 4,130,000 Taeyang(@realtaeyang) 96 1,800,000 To have variety of profiles, I chose both more popular and less popular artists. As it can be seen, the bigger the artist got in the West (PSY, GDragon are both fairly known abroad) have more followers than artists who are mainly known in their homeland (look at: K.Will or Eric Nam). Recently aside of music, some artists are recognised due to their influence in fashion and therefore make the K-pop industry more known to bigger circles of people - even if a lot of fashion lovers do not listen to his music, a lot of them know GDragon for his famous fashion looks for the most prestigious fashion magazines in the West (Maeland, A. 2014).
- 3. Data Retrieval After establishing the Twitter account that I would use as the basis for my analysis I proceeded to implement code to retrieve the relevant data that I believed would be sufficient for analysis. This consisted of retrieving different elements such as information about followers and the profiles that I am following. The data was retrieved using various packages in R. For the network graphs the package used was networkD3 (d3network in previous versions of R) based on JavaScript network graph creation code. Script 1: Script 2:
- 4. Script 3: Graph Analysis Through the following graphs I can establish different trends about my social influence and the correlate this to the topic.
- 5. The figure above shows my profile and users who follow me back. Because the profile was created a long time ago and used for a while, the amount of followers is way higher than was needed for the analysis. The graph is directed and centralised due to the type of data portrayed above. Graph shown above though, shows the out degree of the network. All of the account connected to my user profile here, are profiles that I follow as well as their usernames and their followers count. As we can see it’s still one node degree with all of the profiles due to the nature of the dataset analysed.
- 6. Because the network is varied as are the types of profiles I follow, the graph created for the network of following and their followers is indeed big and complicated. Due to my various interests and connections, the actual network is not centralised and strongly connected. Social Behaviour and Influence Some conclusions can also be derived about my social behaviour. From looking at the graphs I can determine that many of the profiles I follow are connected to a lot of user profiles. Especially when it comes to the profiles of artists, the amount of users observing them (even if their profiles are mainly in their native language which is Korean) are gaining in popularity among people from all around the world. The most popular western K-pop news and celebrity gossip site named allkpop has 2.1M followers; aside of having readers on their actual website and Facebook fan page. The biggest network on the left is mentioned above @allkpop profile, which is connected to 2 profiles which i also follow. Aside of that there is high amount of loose connections and high degrees between other edges. The graph was generated to show how big, compared to other users that my profile follows, is the profile which posts about celebrity only happening between korean celebrities. References Yong Jin, D. 2012.Hallyu 2.0: The New Korean Wave in the Creative Industry. University of Michigan International Institute Journal Volume 2 Fall 2012. Google Trends.2015.Google Trends.[Online]Available at: https://www.google.co.uk/trends/.[Accessed 03 April 2015]
- 7. @Swirlingetiude.2015.Marzena (@Swirlingetiude) on Twitter [Online] Available at: https://twitter.com/Swirlingetiude. [Accessed 03 April 2015] R Studio - httr network visualisation [Online]Available at: http://blog.rstudio.org/2014/12/18/htmlwidgets- javascript-data-visualization-for-r/[Accessed 02 April 2015] Maeland, A. 2014. The HYPEBEAST Magazine Issue 6 - G-Dragon’s Global Coup [Online]Available at: http://hypebeast.com/2014/3/the-hypebeast-magazine-issue-6-g-dragons-global-coup.[Accessed 03 April 2015]