Distribucion de poblaciones
•Download as DOCX, PDF•
0 likes•209 views
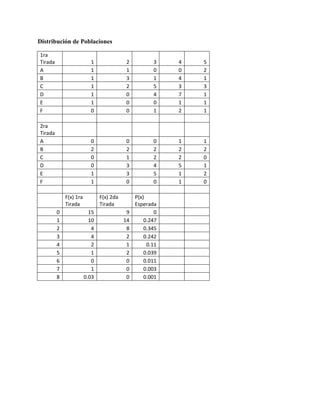
The document contains data from two distributions of populations. The first distribution shows the populations counts for 6 groups labeled A through F. The second distribution shows the population counts for the same 6 groups from a second trial. Tables also show the expected probability distribution and the probability distributions observed in each of the two trials.
Report
Share
Report
Share

Recommended
Distribucion de poblaciones nel
The document appears to contain results from two drawings labeled the 1st drawing and 2nd drawing. It includes numbers labeled A through F for the 1st drawing, A through E for the 2nd drawing, and expected and observed probability values for outcomes labeled 0 through 7 for both drawings.
fix point 16 Qam demapper-Presentation_Linked_in
This document summarizes a presentation on implementing a fixed point software low-complexity soft demapper. The goals were to simulate the demapper algorithm with a turbo decoder and analyze communication performance compared to an optimal demapper. The demapper calculates log likelihood ratios of received symbols by finding the closest constellation point with a flipped bit. Simulation results showed the proposed demapper achieving similar error rate performance as the optimal demapper, with reduced complexity by computing fewer distances. In conclusion, the presentation demonstrated understanding and software implementation of the sub-optimal demapper, with performance matching the optimal approach.
Binary numbersystem
This document introduces common number systems used in computer science, including decimal, binary, octal, and hexadecimal. It discusses how computers use binary to represent quantities and how to convert between number bases. Key topics covered include counting in binary, converting between decimal and binary, binary addition and multiplication, common powers of 2 used in computing, and representing fractions in binary.
numbers system
The document discusses positional number systems such as decimal, binary, hexadecimal, and octal. It explains that in a positional number system, the value of a number is determined by the place value of its digits. For example, in the decimal number 325, the 3 is worth 3*100=300, the 2 is worth 2*10=20, and the 5 is worth 5*1=5, so their sum is 325. The document then explains how to convert between decimal, binary, hexadecimal, and octal representations using place value and by grouping binary digits into fixed-width blocks.
Mapa de Vegetation UPR Humacao
This document is a receipt for a purchase made at a store. It details that on January 15th, 2023 a customer bought 3 items for a total of $47.98. The items included 2 t-shirts for $19.99 each and 1 pair of shoes for $7.99.
Encuesta
This document is a letter from a student requesting a leave of absence from their university studies. The student explains that they have been struggling with their mental health, including anxiety and depression. They are taking a semester off to focus on treatment and recovery in order to return to their studies in a stronger position to succeed.
Climatograma
This document is a receipt for a purchase made at a store. It details that on January 15th, 2023 a customer bought 3 items for a total of $47.98. The items included 2 t-shirts for $19.99 each and 1 pair of shoes for $7.99.
Metodo Cientifico y Analisis de Lectura
This document is a receipt for a purchase made at a store. It details that on January 15th, 2022 a customer bought 3 items for a total of $47.98. The items included 2 t-shirts for $19.98 each and 1 pair of shoes for $8.
Estadística Básica I
This document contains 34 rows of numeric data. Each row includes values for tree quadrant, distance, azimuth, radians, sine, cosine, and x and y coordinates.
Estadistica Basica I
This document appears to contain data from a survey including azimuth, distance, x and y coordinates, and sine and cosine values for 32 separate points. For each point, it provides the azimuth, distance, and projected x and y coordinates based on trigonometric calculations of sine and cosine.
Estadistica Basica II
This document contains measurements of tree diameters at breast height (DBH) in centimeters for several trees, ranging from 4.5 centimeters to 21.5 centimeters. The measurements are listed without labels to identify individual trees.
Grafica de temperatura y de humedad en cada estación del Bosque Seco de Guanica
El documento presenta datos sobre la temperatura y el porcentaje de humedad en cinco estaciones boscosas en Guanica. La temperatura varió de 84.6 a 91.1 grados y el porcentaje de humedad varió de 49.4 a 66.6. El Matoral de la Costa tuvo la temperatura más alta de 91.1 grados y El Llano tuvo el porcentaje de humedad más bajo de 49.4.
Grafica de de Humedad en cada estación del Bosque Seco de Guanica
El documento muestra los porcentajes de humedad en cinco estaciones diferentes en un bosque seco en Guanica. El bosque desiduo y la plantación de caobas tuvieron los mayores porcentajes de humedad alrededor del 66%, mientras que el llano tuvo el menor porcentaje de humedad a aproximadamente el 49%.
Estadistica basica I
The document contains measurements of distance, azimuth, and calculated x and y coordinates for 32 trees across 4 quadrants. The measurements are organized by quadrant, tree number, distance, azimuth, and calculated values for radians, sine, cosine, x coordinate, and y coordinate.
Mapa de vegetacion
The document contains measurements of the distance and azimuth from trees to a central point in 4 different quadrants. For each tree, it lists the quadrant, tree number, distance, azimuth, radians, sine, cosine, and x and y coordinates. There are a total of 32 trees measured across the 4 quadrants.
Grafica Wind Chill y % de Humedad en estaciones de Mt. Britton
El documento presenta datos sobre el viento, la temperatura y la humedad en tres estaciones. Muestra que la temperatura de viento disminuyó levemente de la estación de inicio a la de la torre, mientras que el porcentaje de humedad aumentó del 84.5% al 100%. También incluye un gráfico que relaciona el viento frío y el porcentaje de humedad en las estaciones.
Estadistica Basica II
El documento presenta datos sobre el diámetro a la altura del pecho (DBH) y la edad de cinco árboles. Muestra una gráfica lineal que relaciona el aumento promedio anual del DBH con respecto a la edad del árbol, con una ecuación de regresión lineal de y = 1.23x + 0.24. El documento fue preparado por Gilberto Mayo y contiene dos páginas.
Climatograma
Este documento presenta la precipitación y temperatura normales mensuales para Aguadilla, Puerto Rico de enero a diciembre. La precipitación varía de 2.71 pulgadas en febrero a 7.26 pulgadas en mayo, mientras que la temperatura varía de 83.7 grados Fahrenheit en enero a 89.1 grados en julio y agosto.
Grafica de humedad en cada estacion Bosque Seco de Guanica
El documento muestra los porcentajes de humedad en cinco estaciones diferentes. Las estaciones de bosque desiduo, plantación de caobas y sumidero tenían los mayores porcentajes de humedad entre el 65-66%, mientras que el matoral de la costa y el llano tenían niveles más bajos de 56.4% y 49.4% respectivamente.
Grafica de de_humedad_en_cada_estacion
El documento muestra los porcentajes de humedad en cinco estaciones diferentes. Las estaciones de bosque desiduo, plantación de caobas y sumidero tenían los mayores porcentajes de humedad entre el 65-66%, mientras que el matoral de la costa y el llano tenían niveles más bajos de 56.4% y 49.4% respectivamente.
More Related Content
More from gmayo
Encuesta
This document is a letter from a student requesting a leave of absence from their university studies. The student explains that they have been struggling with their mental health, including anxiety and depression. They are taking a semester off to focus on treatment and recovery in order to return to their studies in a stronger position to succeed.
Climatograma
This document is a receipt for a purchase made at a store. It details that on January 15th, 2023 a customer bought 3 items for a total of $47.98. The items included 2 t-shirts for $19.99 each and 1 pair of shoes for $7.99.
Metodo Cientifico y Analisis de Lectura
This document is a receipt for a purchase made at a store. It details that on January 15th, 2022 a customer bought 3 items for a total of $47.98. The items included 2 t-shirts for $19.98 each and 1 pair of shoes for $8.
Estadística Básica I
This document contains 34 rows of numeric data. Each row includes values for tree quadrant, distance, azimuth, radians, sine, cosine, and x and y coordinates.
Estadistica Basica I
This document appears to contain data from a survey including azimuth, distance, x and y coordinates, and sine and cosine values for 32 separate points. For each point, it provides the azimuth, distance, and projected x and y coordinates based on trigonometric calculations of sine and cosine.
Estadistica Basica II
This document contains measurements of tree diameters at breast height (DBH) in centimeters for several trees, ranging from 4.5 centimeters to 21.5 centimeters. The measurements are listed without labels to identify individual trees.
Grafica de temperatura y de humedad en cada estación del Bosque Seco de Guanica
El documento presenta datos sobre la temperatura y el porcentaje de humedad en cinco estaciones boscosas en Guanica. La temperatura varió de 84.6 a 91.1 grados y el porcentaje de humedad varió de 49.4 a 66.6. El Matoral de la Costa tuvo la temperatura más alta de 91.1 grados y El Llano tuvo el porcentaje de humedad más bajo de 49.4.
Grafica de de Humedad en cada estación del Bosque Seco de Guanica
El documento muestra los porcentajes de humedad en cinco estaciones diferentes en un bosque seco en Guanica. El bosque desiduo y la plantación de caobas tuvieron los mayores porcentajes de humedad alrededor del 66%, mientras que el llano tuvo el menor porcentaje de humedad a aproximadamente el 49%.
Estadistica basica I
The document contains measurements of distance, azimuth, and calculated x and y coordinates for 32 trees across 4 quadrants. The measurements are organized by quadrant, tree number, distance, azimuth, and calculated values for radians, sine, cosine, x coordinate, and y coordinate.
Mapa de vegetacion
The document contains measurements of the distance and azimuth from trees to a central point in 4 different quadrants. For each tree, it lists the quadrant, tree number, distance, azimuth, radians, sine, cosine, and x and y coordinates. There are a total of 32 trees measured across the 4 quadrants.
Grafica Wind Chill y % de Humedad en estaciones de Mt. Britton
El documento presenta datos sobre el viento, la temperatura y la humedad en tres estaciones. Muestra que la temperatura de viento disminuyó levemente de la estación de inicio a la de la torre, mientras que el porcentaje de humedad aumentó del 84.5% al 100%. También incluye un gráfico que relaciona el viento frío y el porcentaje de humedad en las estaciones.
Estadistica Basica II
El documento presenta datos sobre el diámetro a la altura del pecho (DBH) y la edad de cinco árboles. Muestra una gráfica lineal que relaciona el aumento promedio anual del DBH con respecto a la edad del árbol, con una ecuación de regresión lineal de y = 1.23x + 0.24. El documento fue preparado por Gilberto Mayo y contiene dos páginas.
Climatograma
Este documento presenta la precipitación y temperatura normales mensuales para Aguadilla, Puerto Rico de enero a diciembre. La precipitación varía de 2.71 pulgadas en febrero a 7.26 pulgadas en mayo, mientras que la temperatura varía de 83.7 grados Fahrenheit en enero a 89.1 grados en julio y agosto.
Grafica de humedad en cada estacion Bosque Seco de Guanica
El documento muestra los porcentajes de humedad en cinco estaciones diferentes. Las estaciones de bosque desiduo, plantación de caobas y sumidero tenían los mayores porcentajes de humedad entre el 65-66%, mientras que el matoral de la costa y el llano tenían niveles más bajos de 56.4% y 49.4% respectivamente.
Grafica de de_humedad_en_cada_estacion
El documento muestra los porcentajes de humedad en cinco estaciones diferentes. Las estaciones de bosque desiduo, plantación de caobas y sumidero tenían los mayores porcentajes de humedad entre el 65-66%, mientras que el matoral de la costa y el llano tenían niveles más bajos de 56.4% y 49.4% respectivamente.
More from gmayo (20)
Grafica de temperatura y de humedad en cada estación del Bosque Seco de Guanica
Grafica de temperatura y de humedad en cada estación del Bosque Seco de Guanica
Grafica de de Humedad en cada estación del Bosque Seco de Guanica
Grafica de de Humedad en cada estación del Bosque Seco de Guanica
Grafica Wind Chill y % de Humedad en estaciones de Mt. Britton
Grafica Wind Chill y % de Humedad en estaciones de Mt. Britton
Grafica de humedad en cada estacion Bosque Seco de Guanica
Grafica de humedad en cada estacion Bosque Seco de Guanica
Distribucion de poblaciones
- 1. Distribución de Poblaciones<br />1ra Tirada12345A11002B13141C12533D10471E10011F00121 2ra Tirada A00011B22222C01220D03451E13512F10010 F(x) 1ra TiradaF(x) 2da TiradaP(x) Esperada 01590 110140.247 2480.345 3420.242 4210.11 5120.039 6000.011 7100.003 80.0300.001<br /> P(x)1ra tiradaP(x) Esperada00010.420.24720.280.34530.110.24240.110.1150.060.03960.030.011700.00380.030.001<br /> P(x)2da TiradaP(x) Esperada00010.250.24720.390.34530.220.24240.060.1150.030.03960.060.011700.003800.001<br /> P(x)1ra tiradaP(x)2da TiradaP(x) Esperada000010.420.250.24720.280.390.34530.110.220.24240.110.060.1150.060.030.03960.030.060.0117000.00380.0300.001<br />