Download to read offline

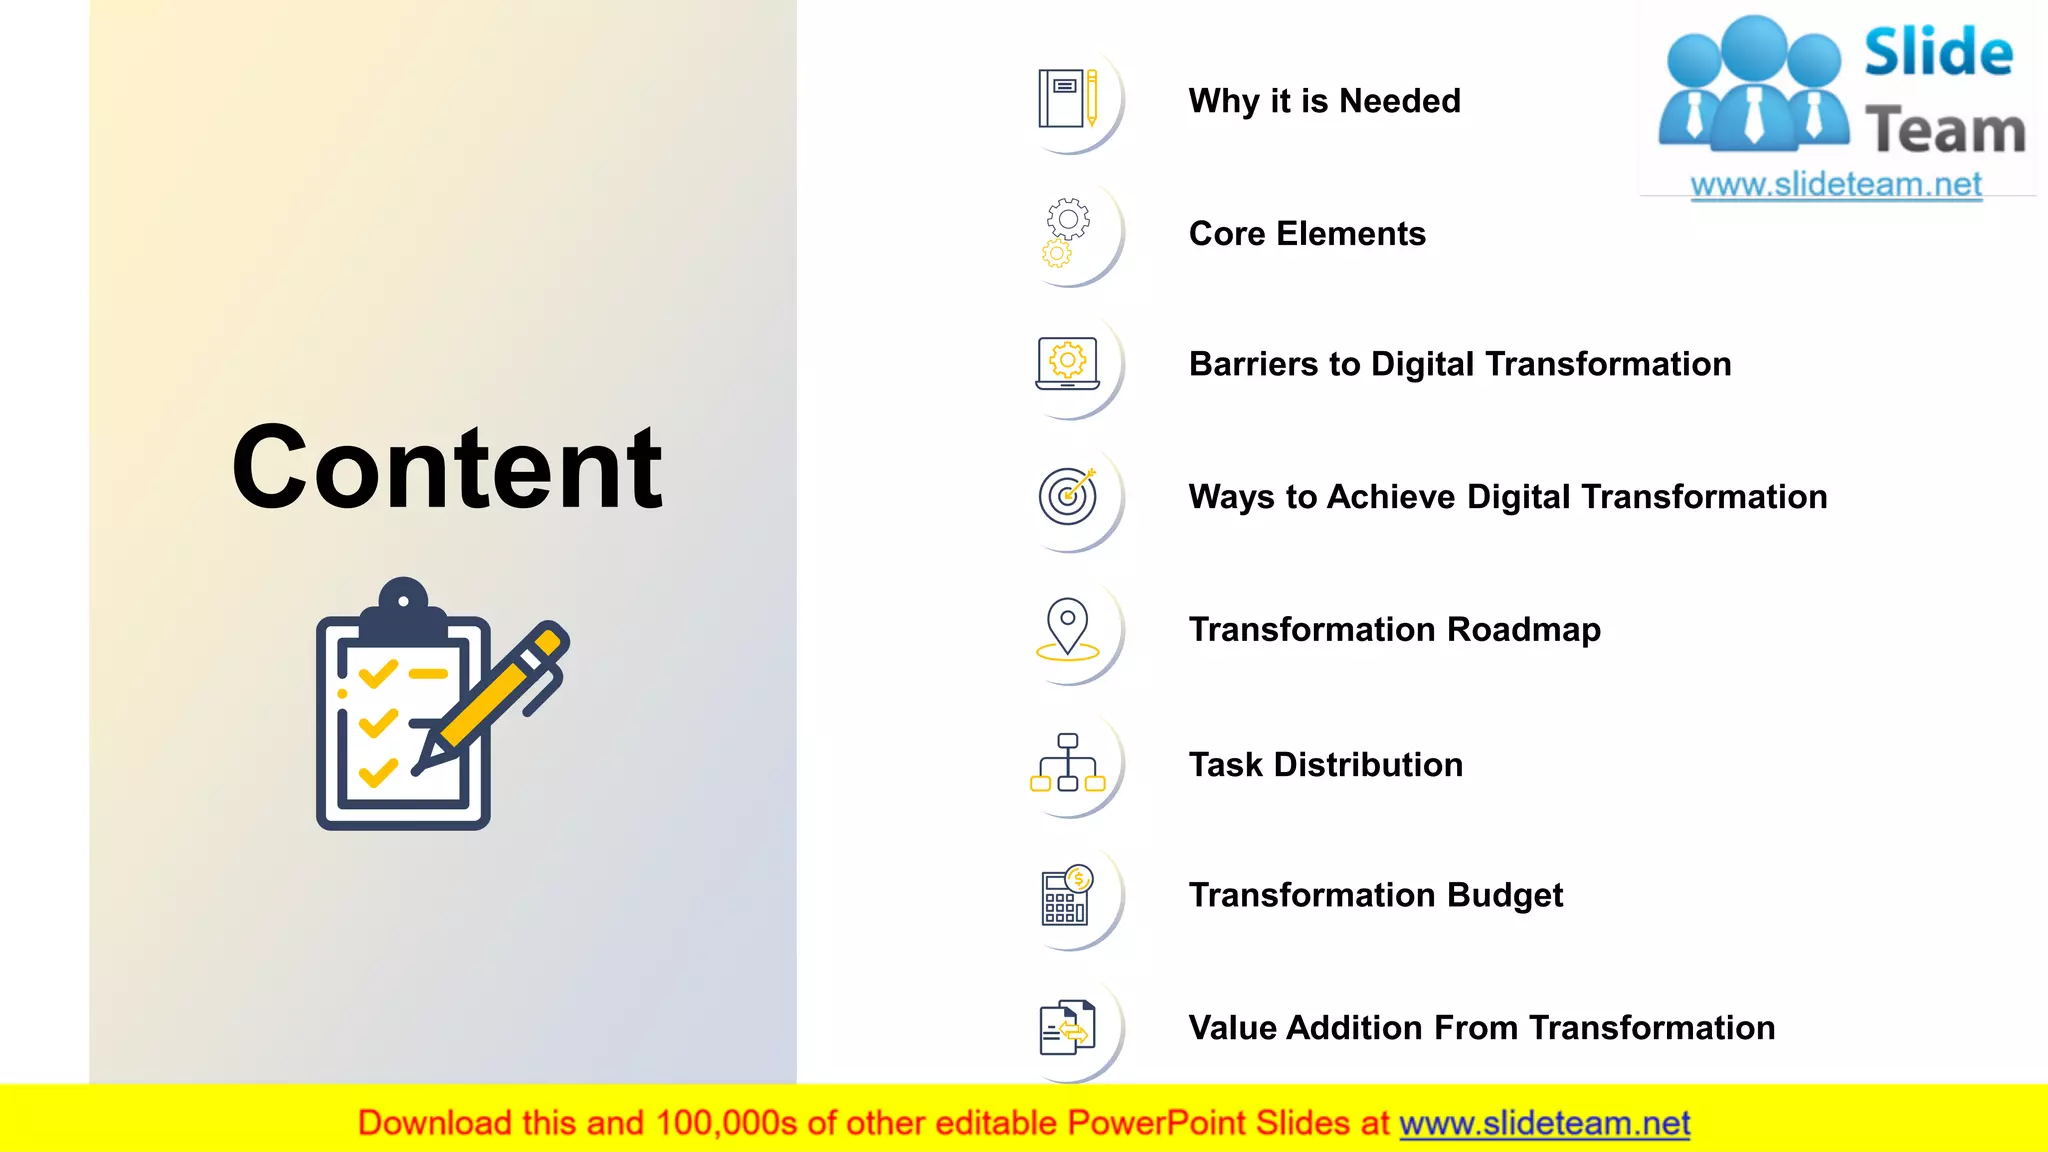
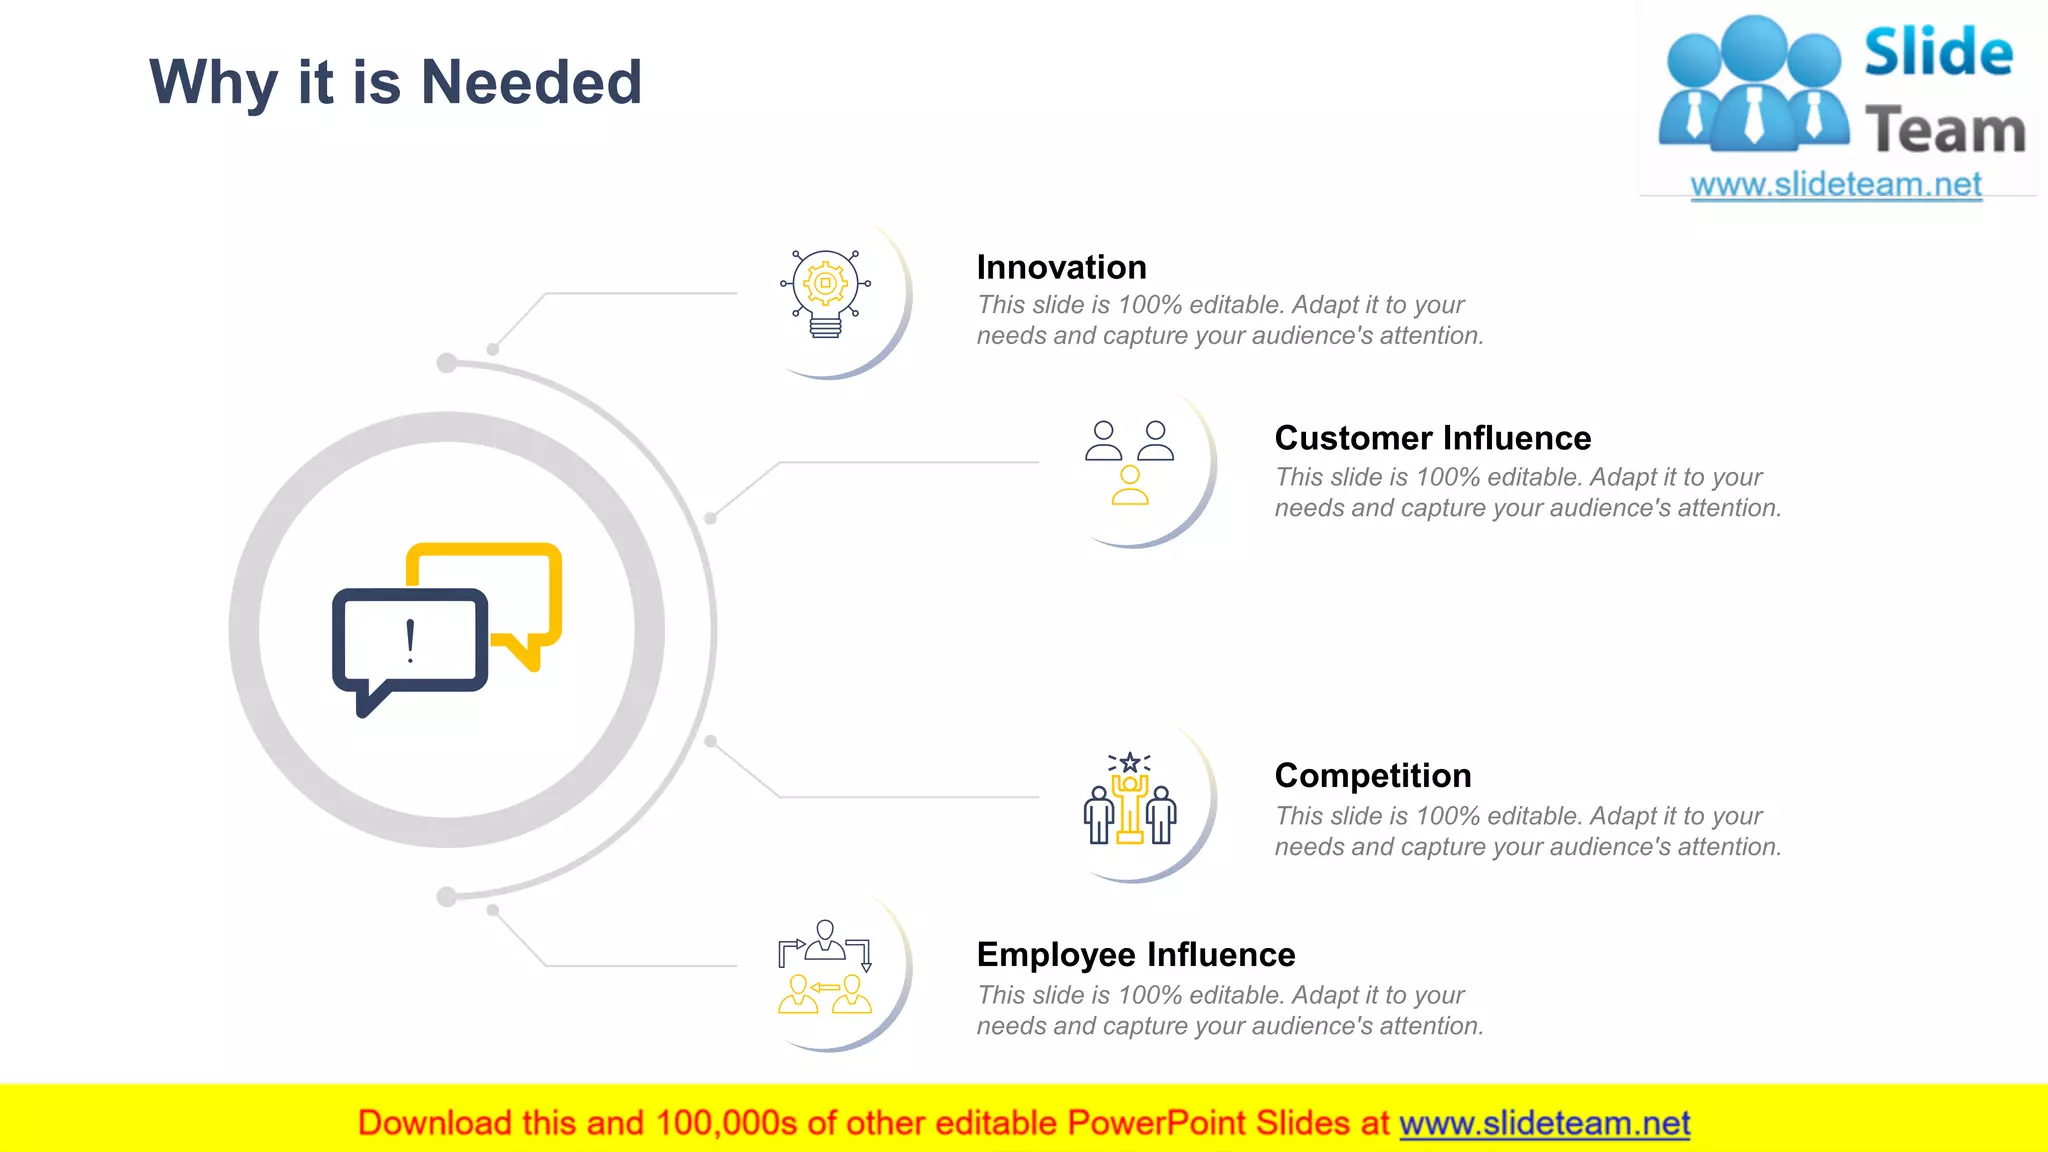
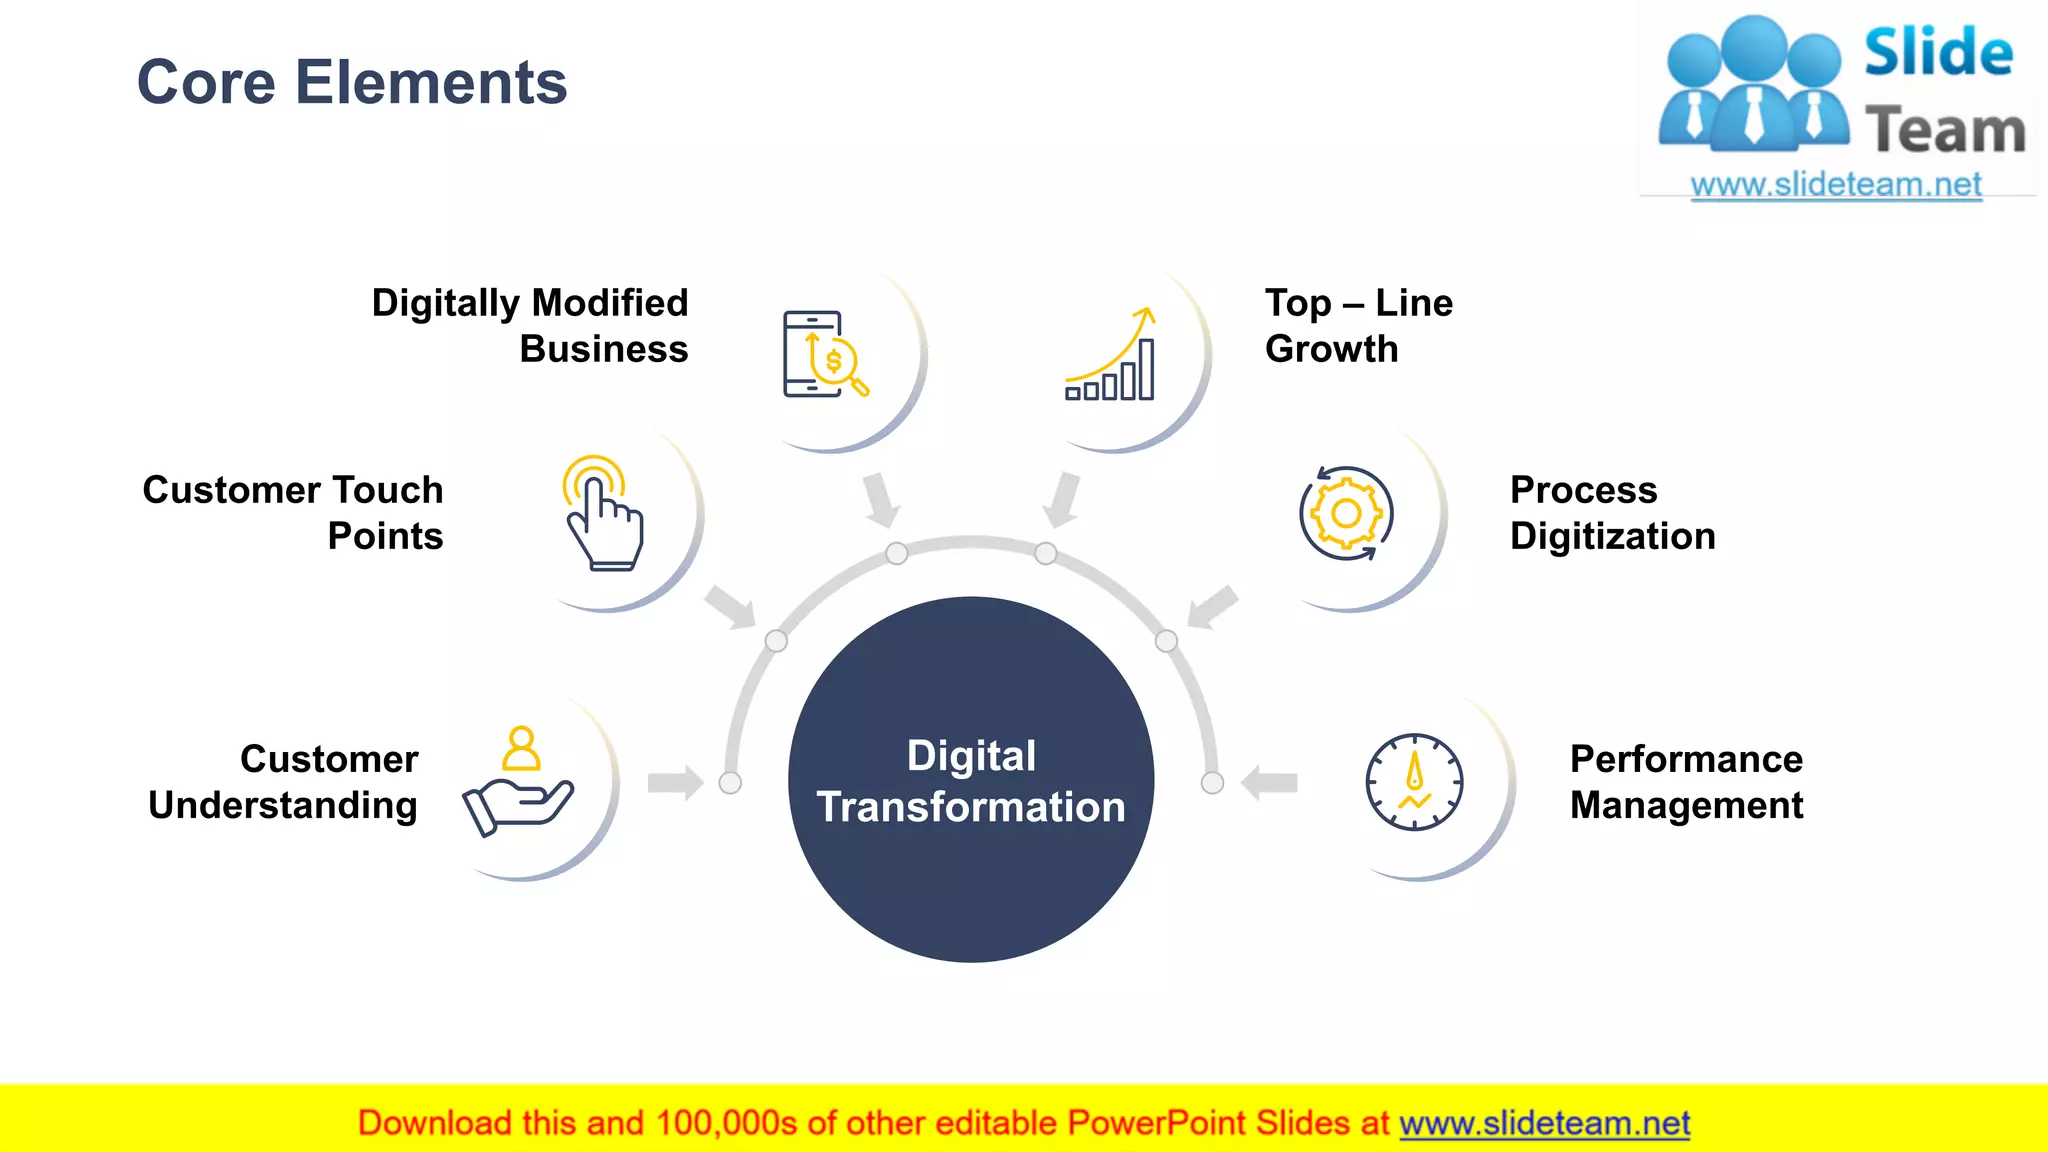
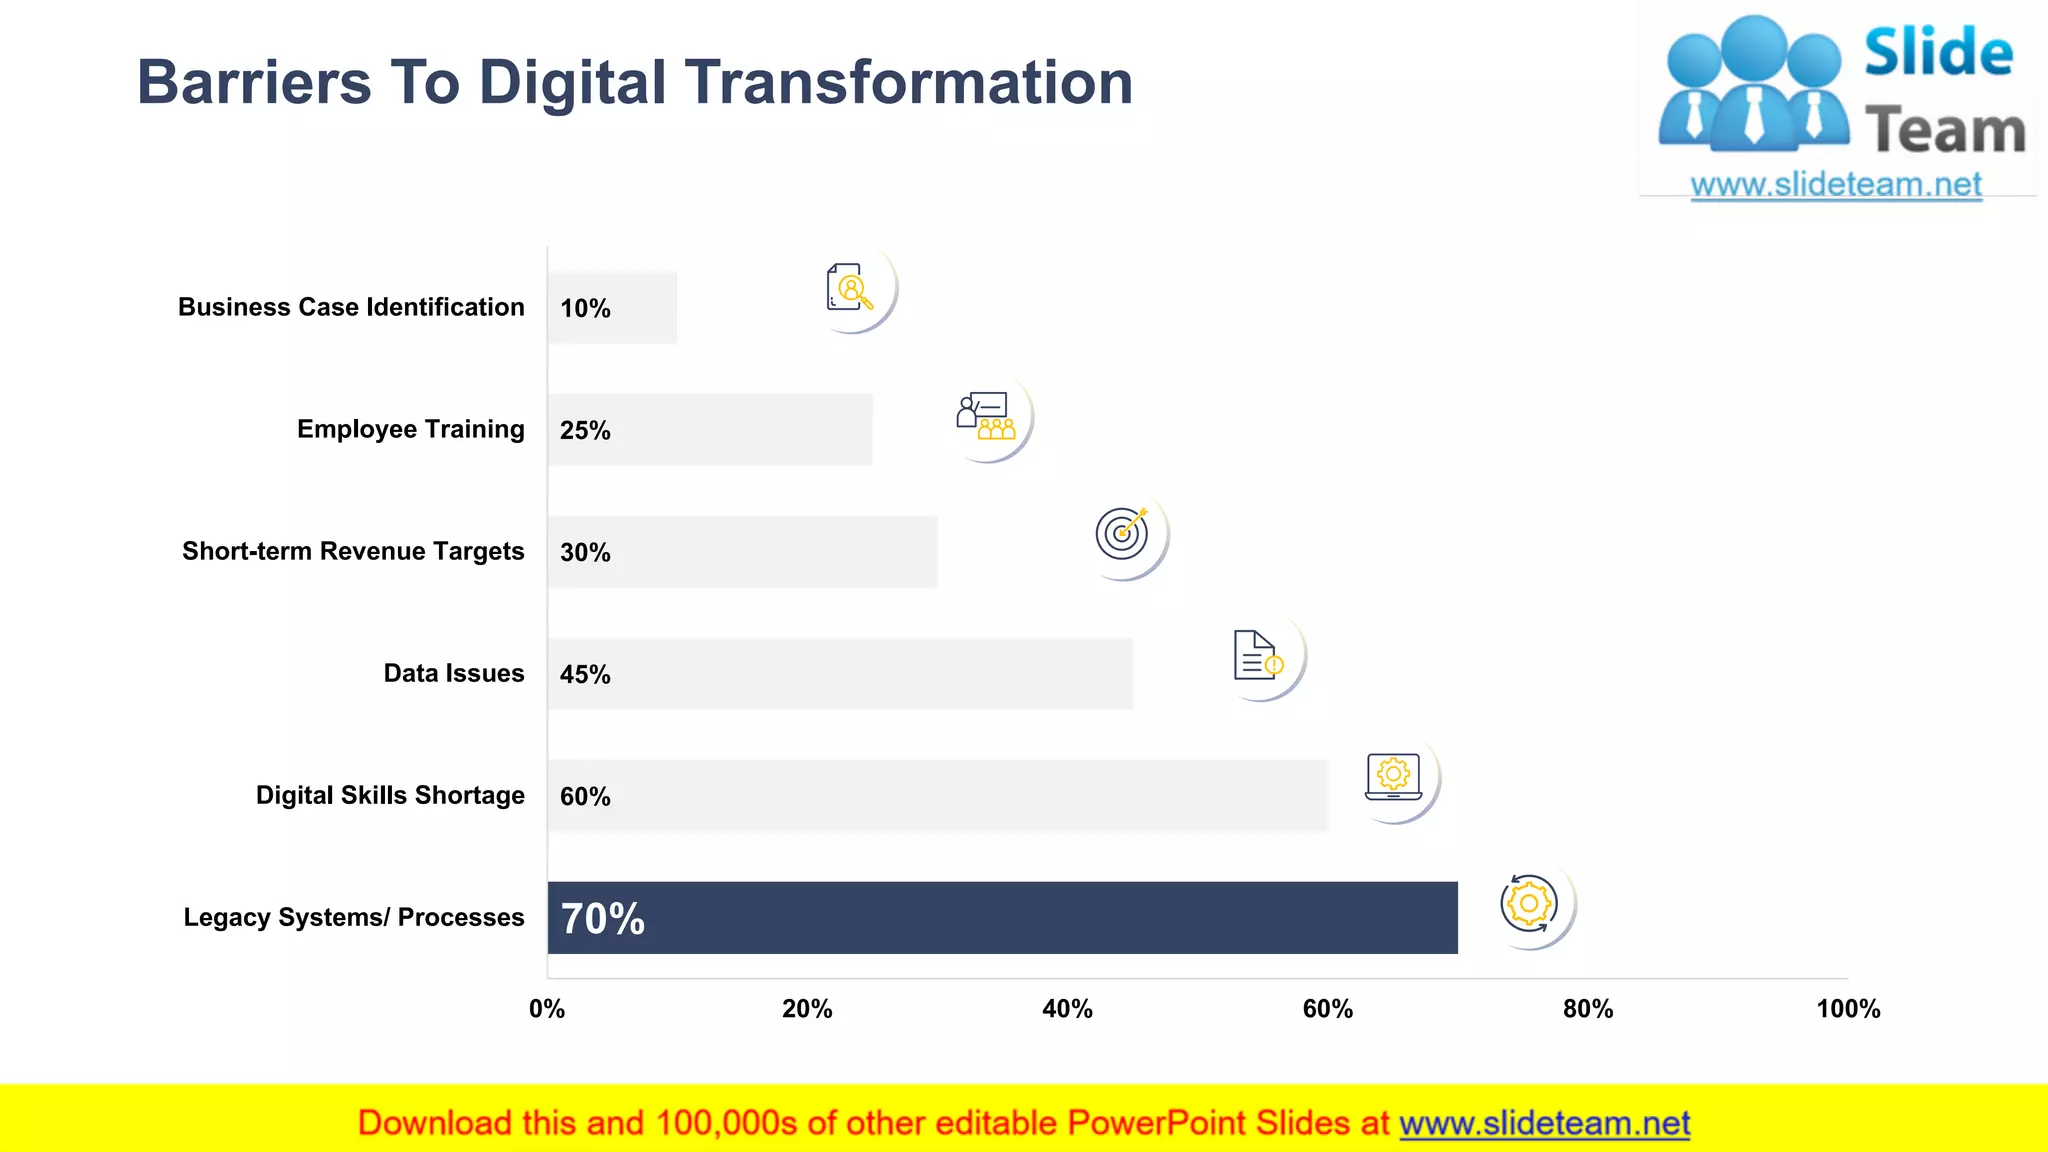
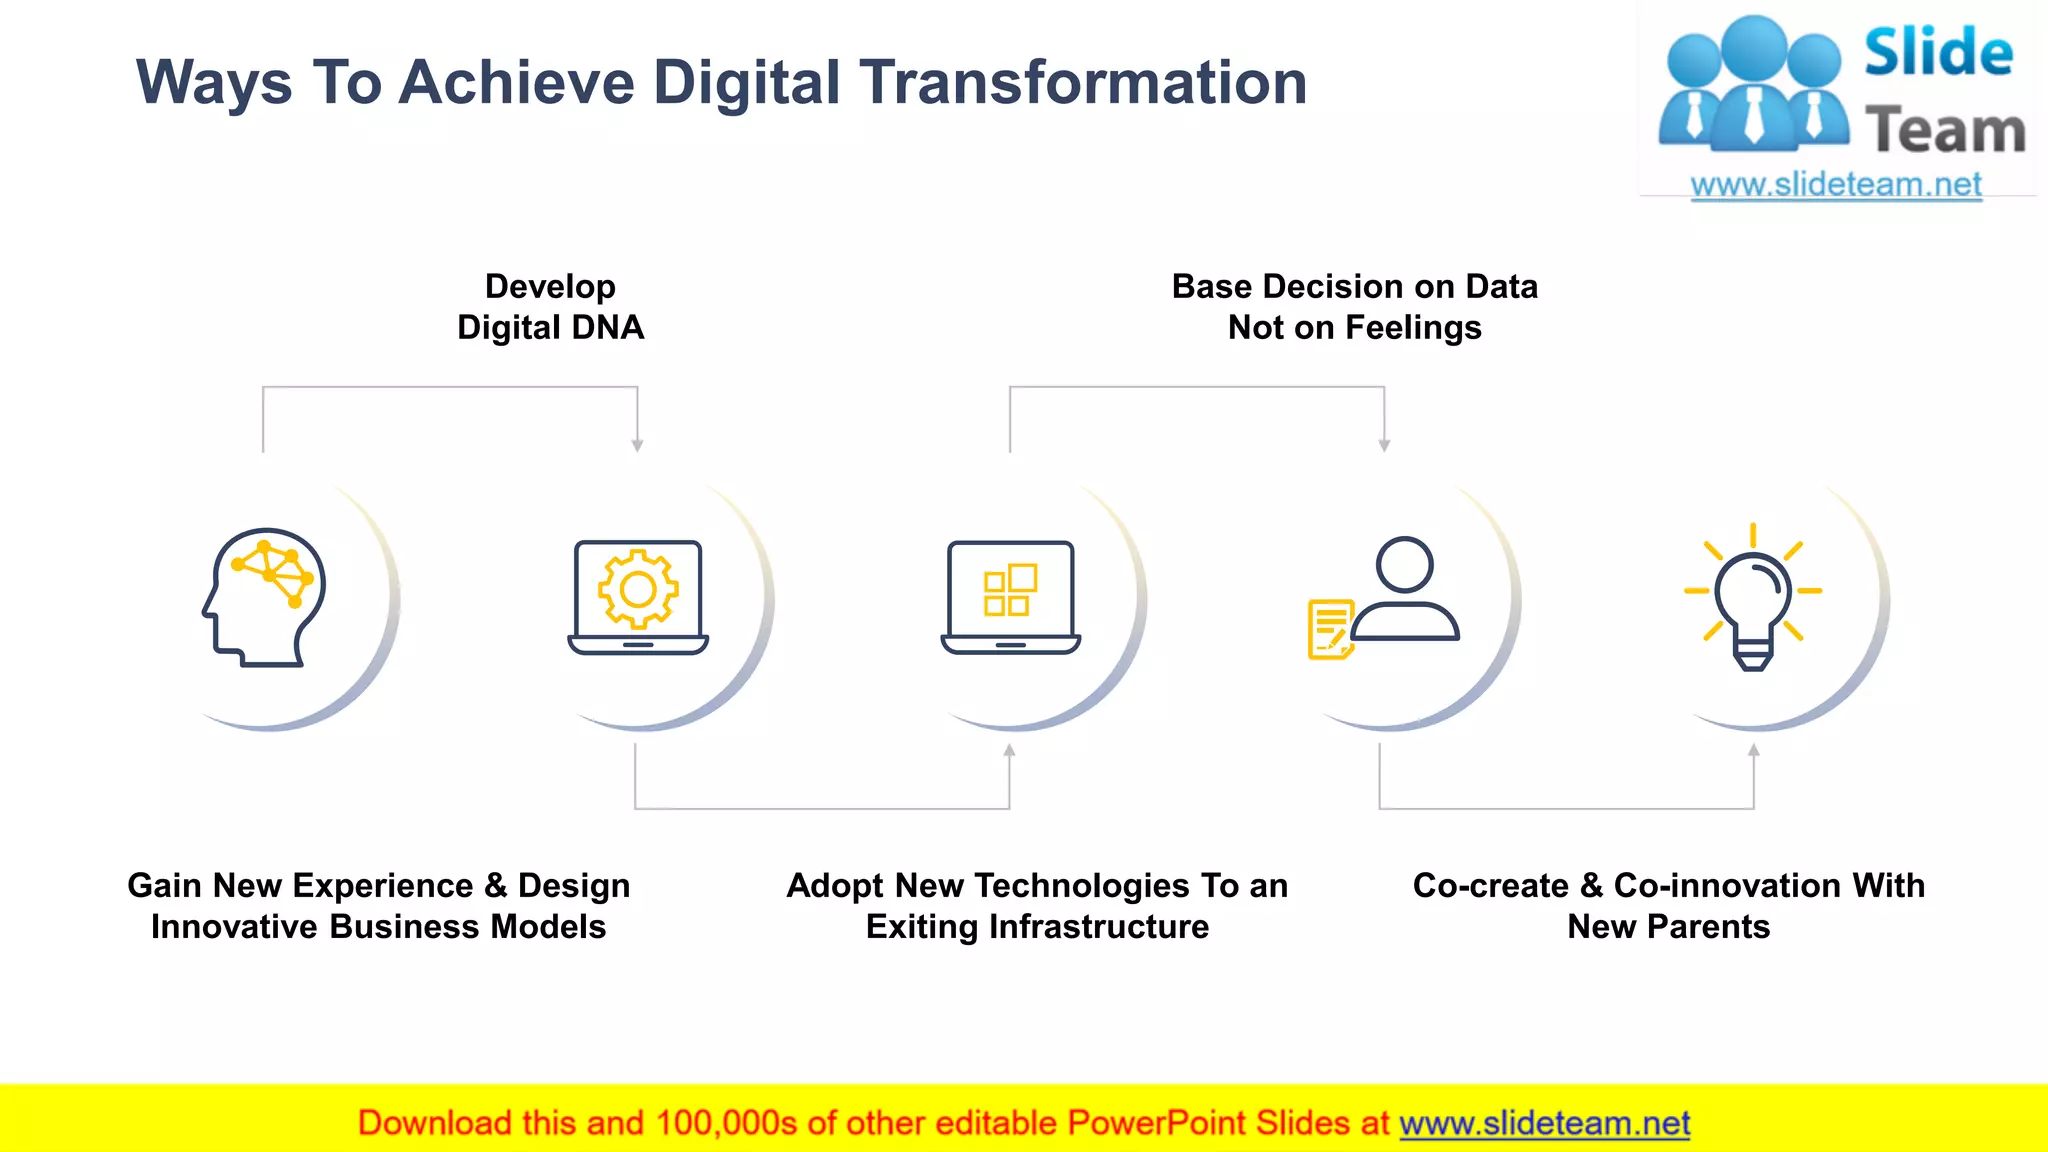
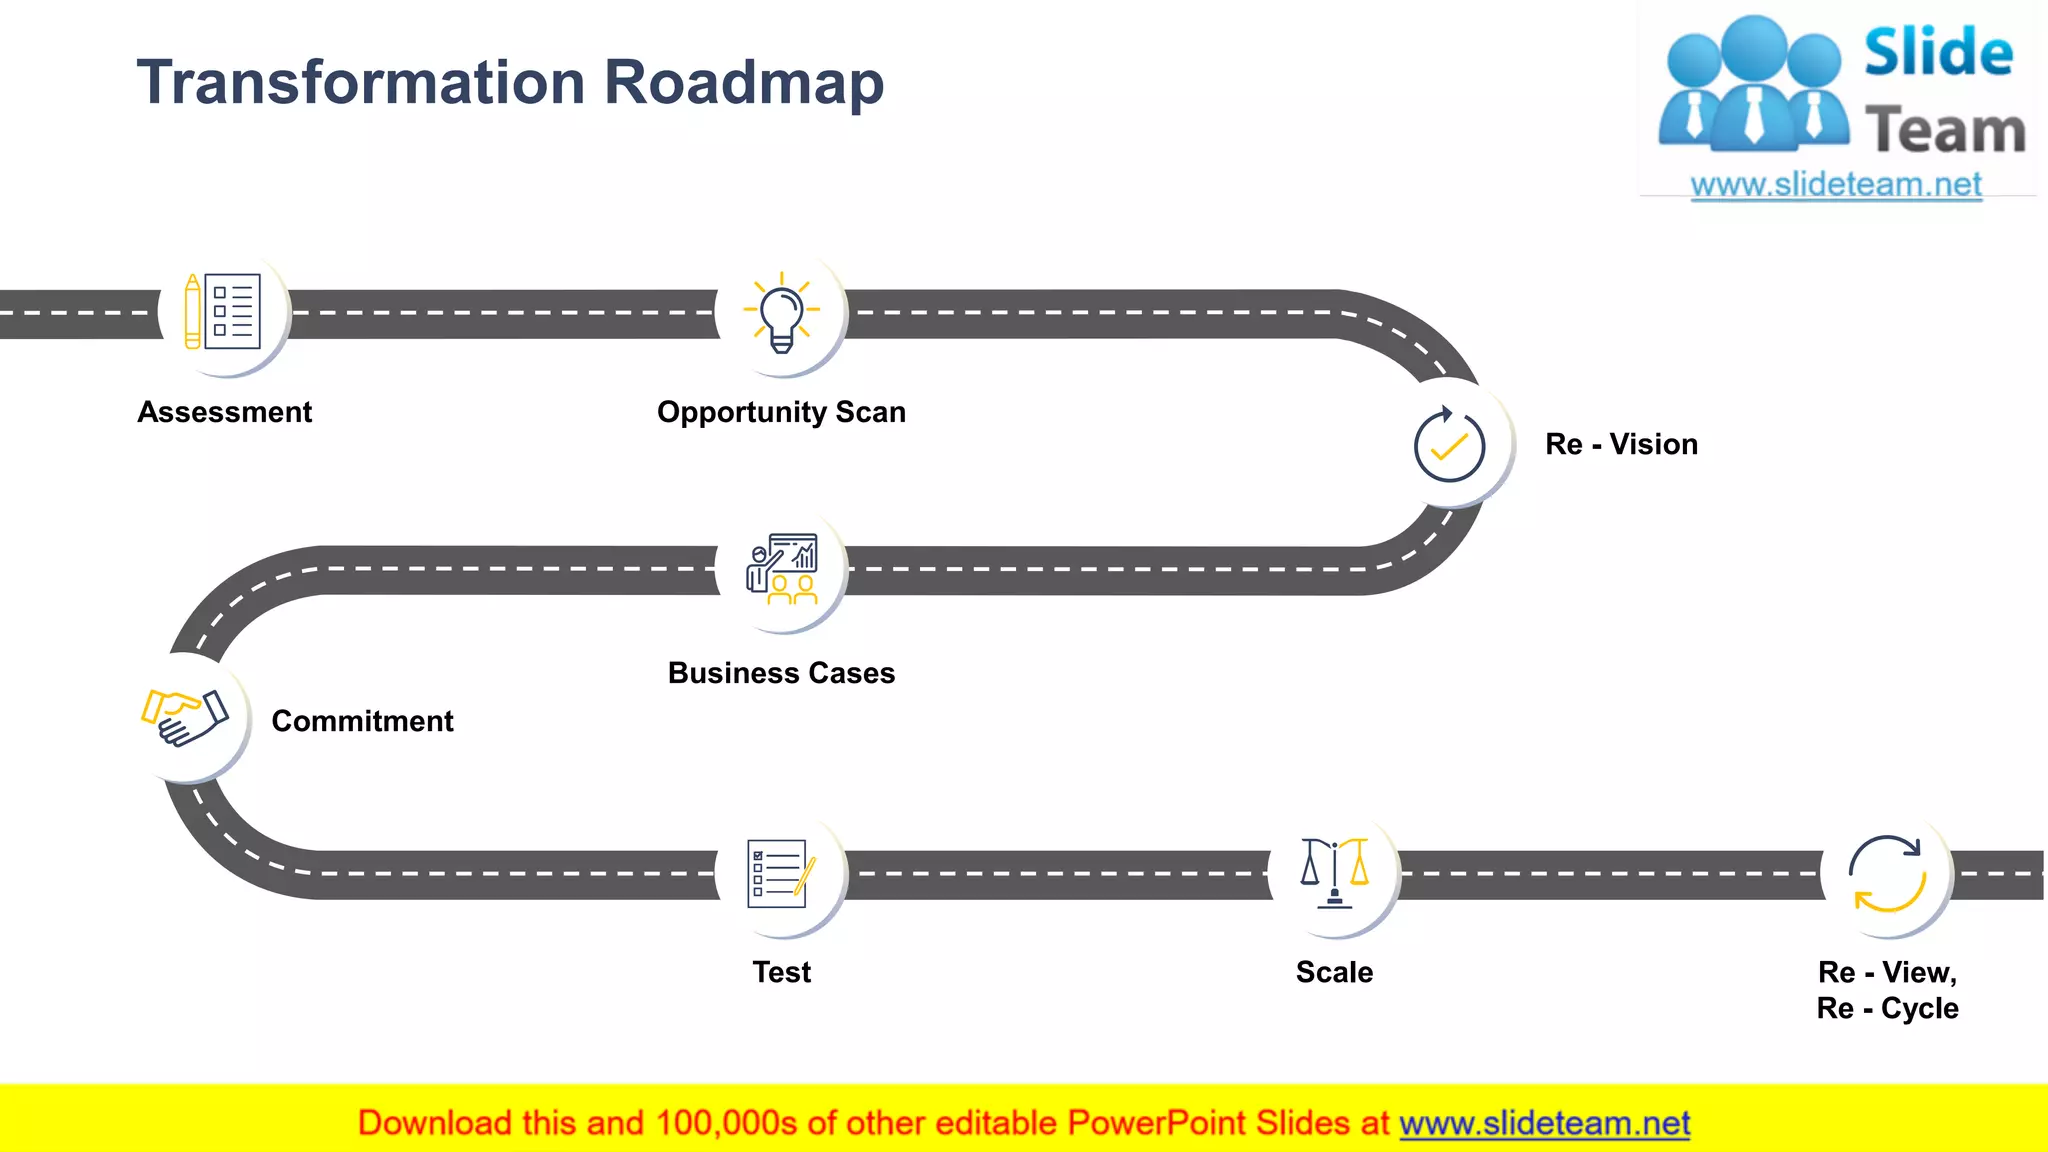
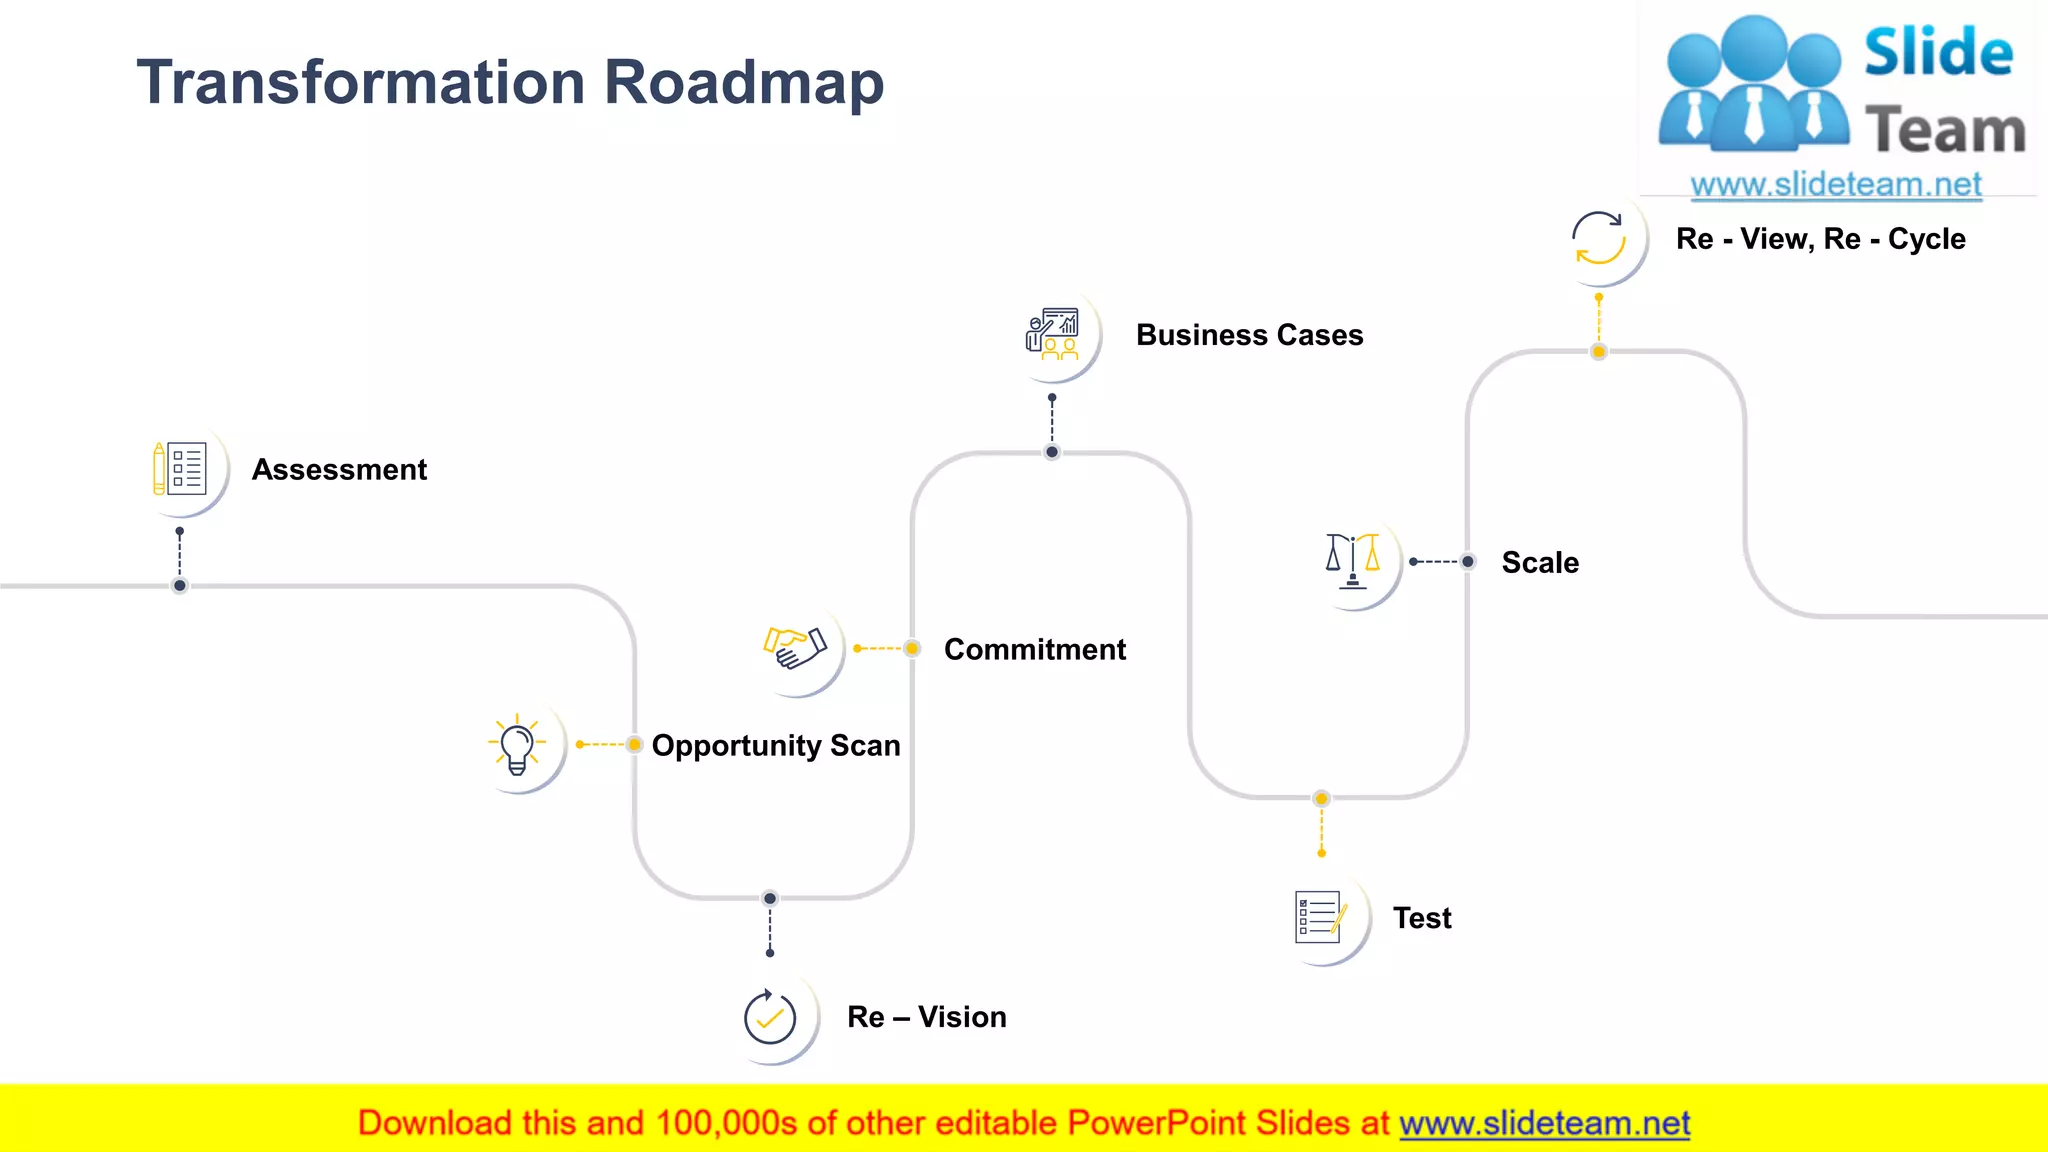
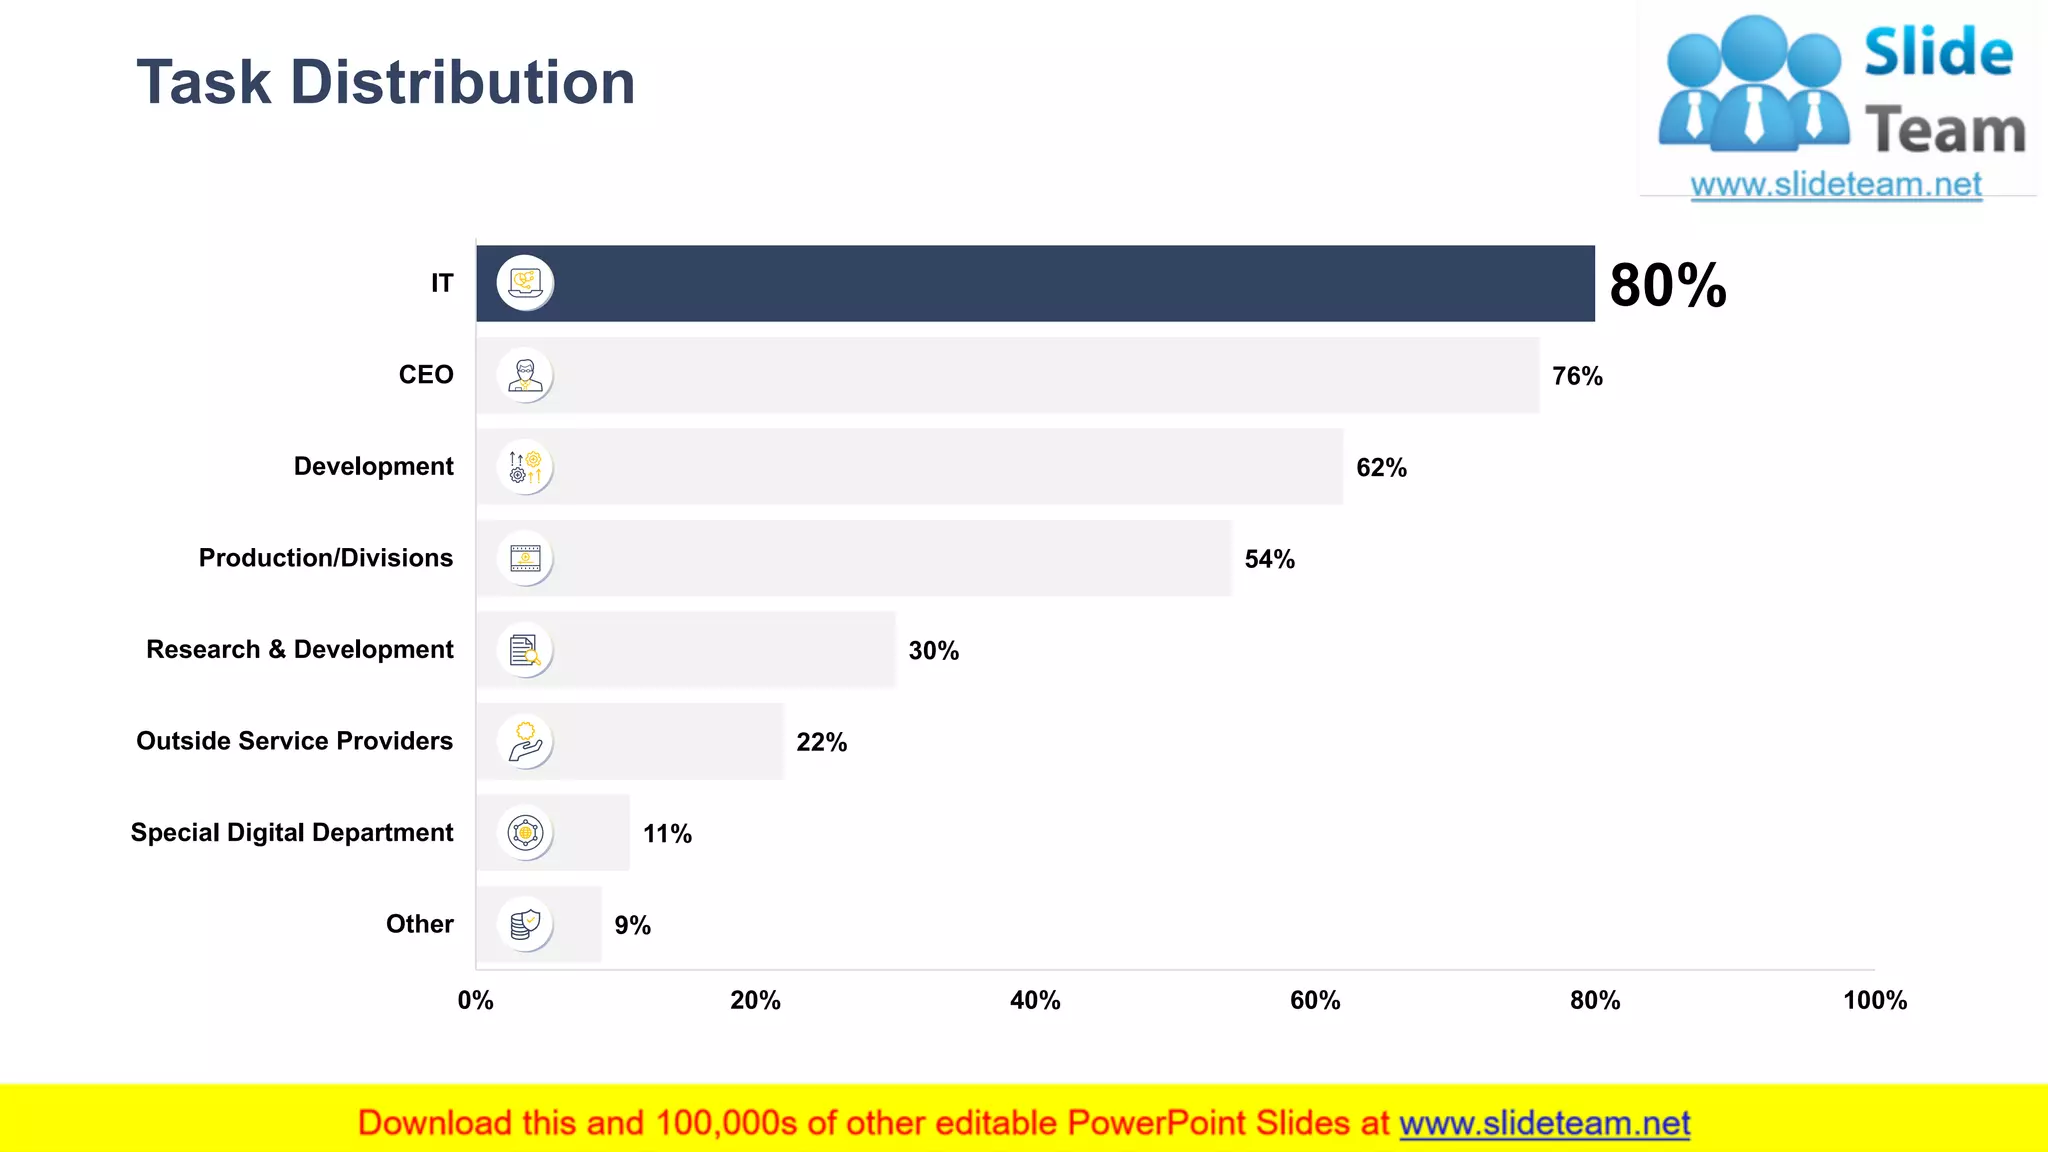
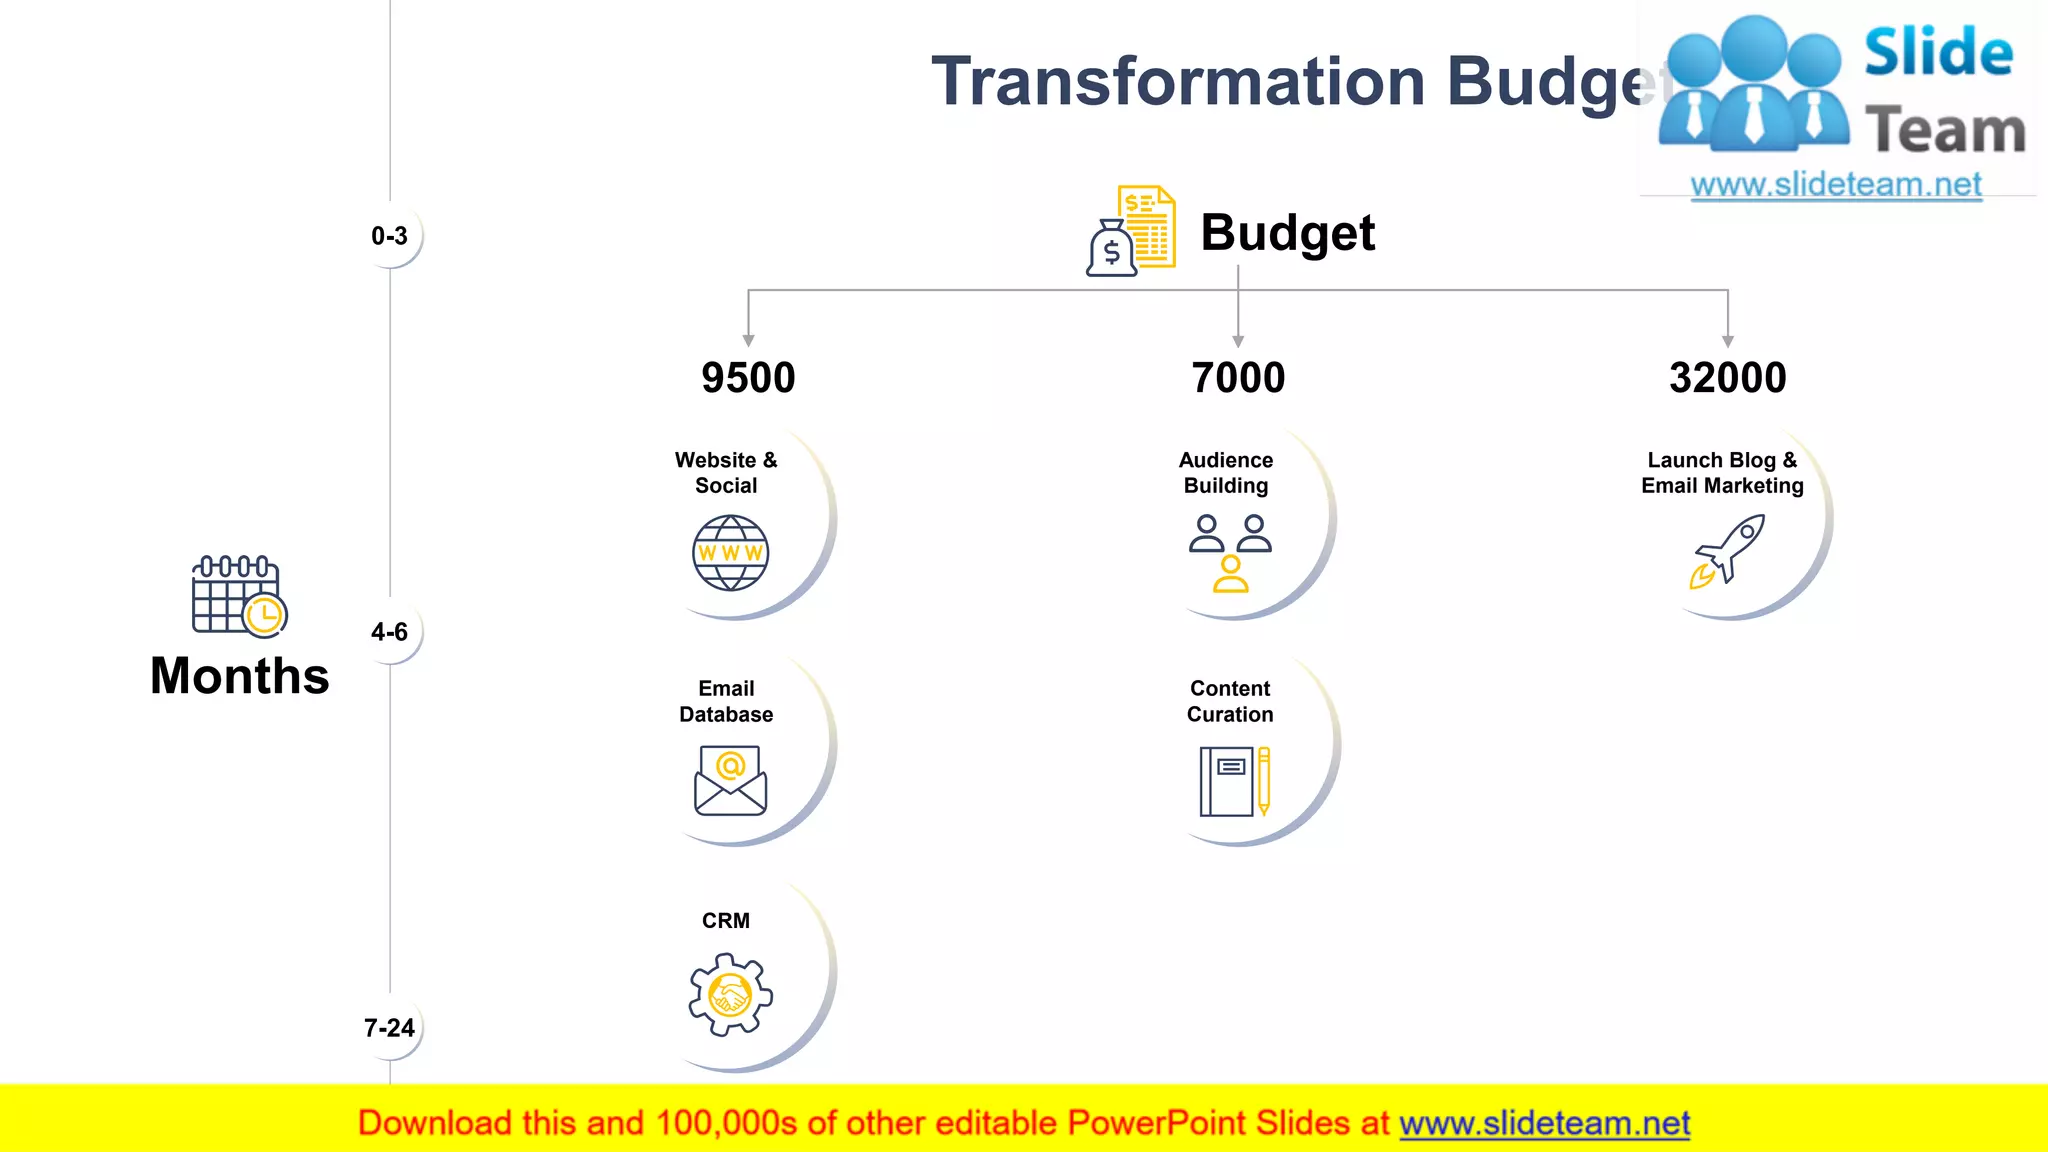
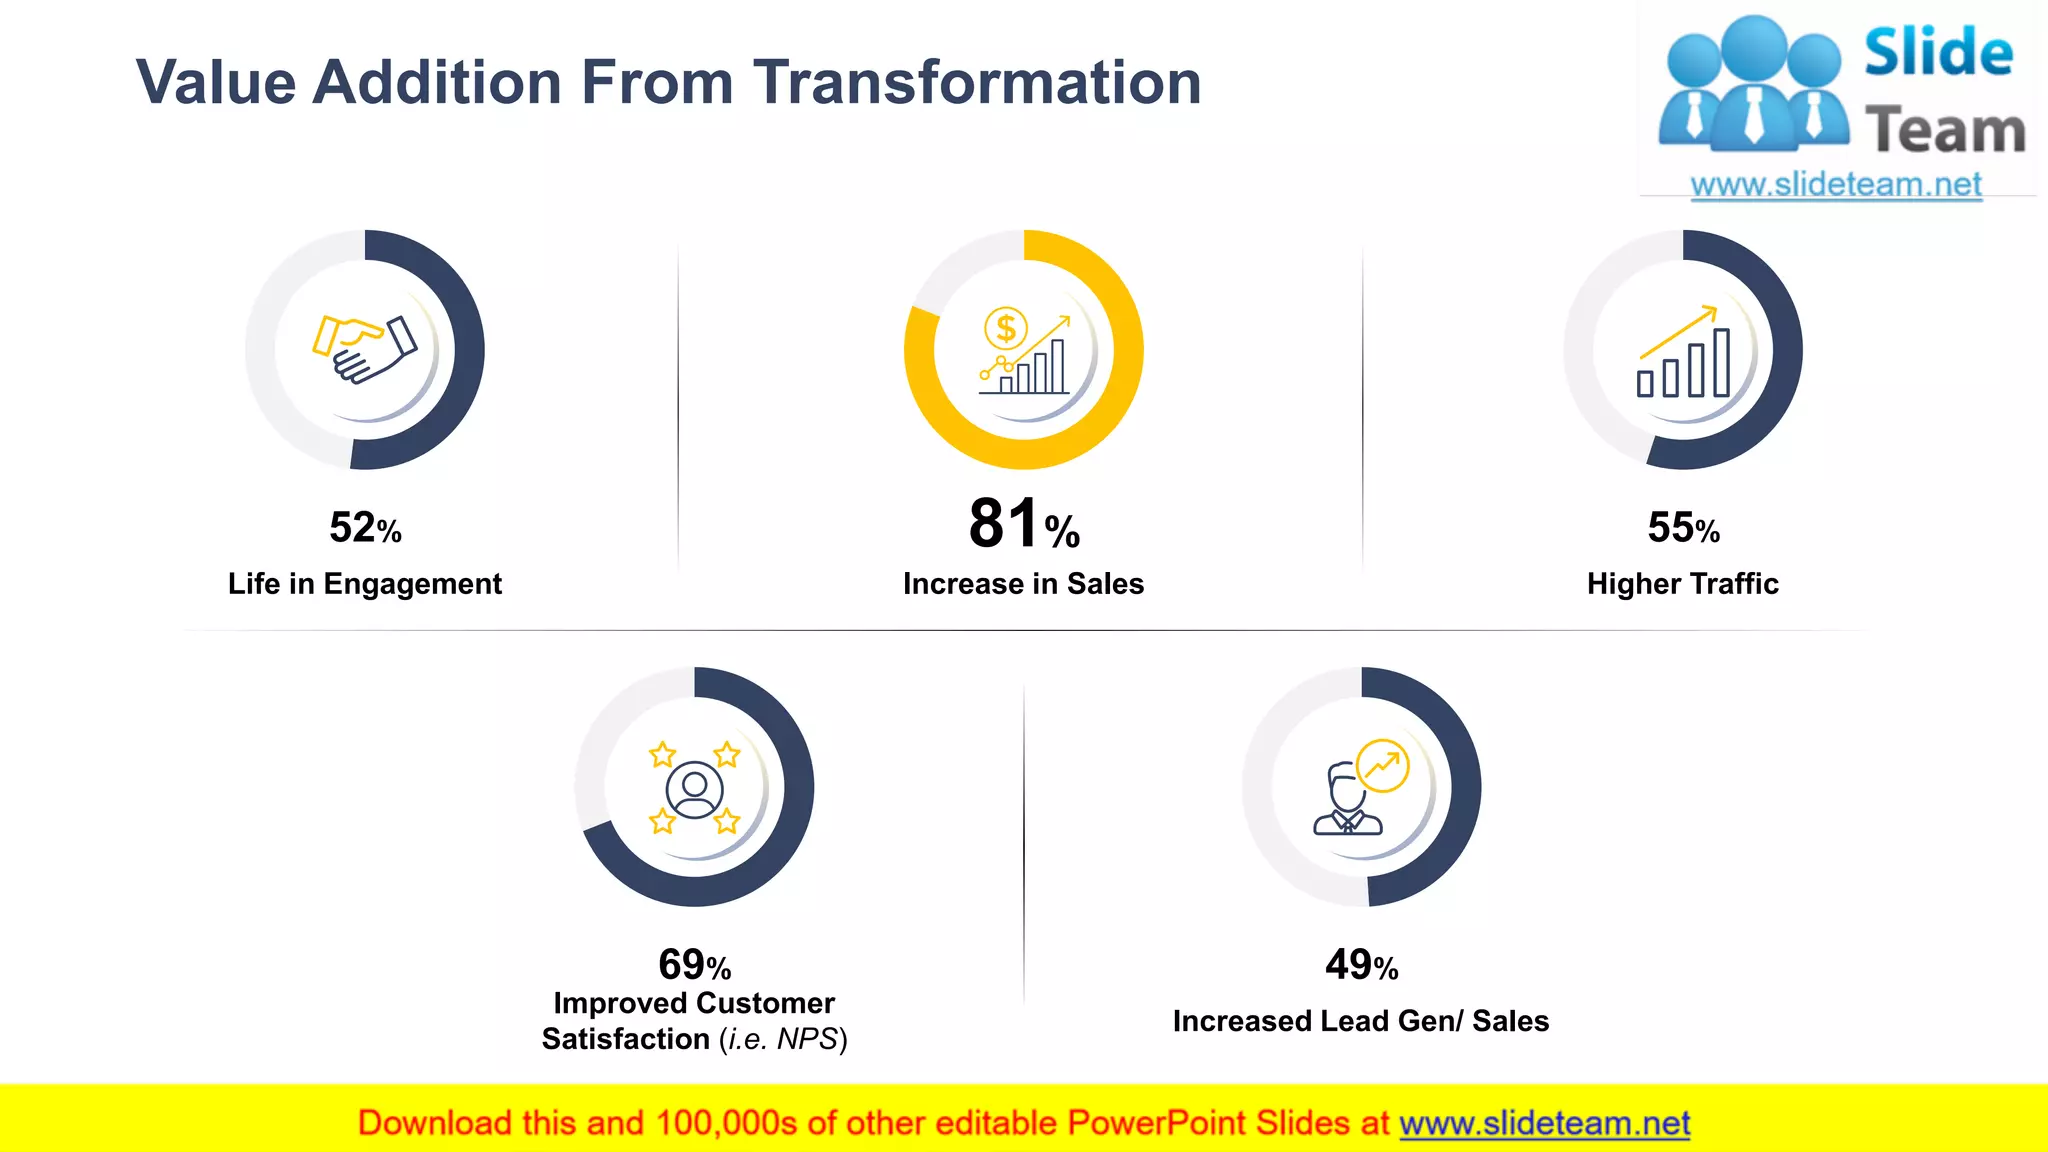


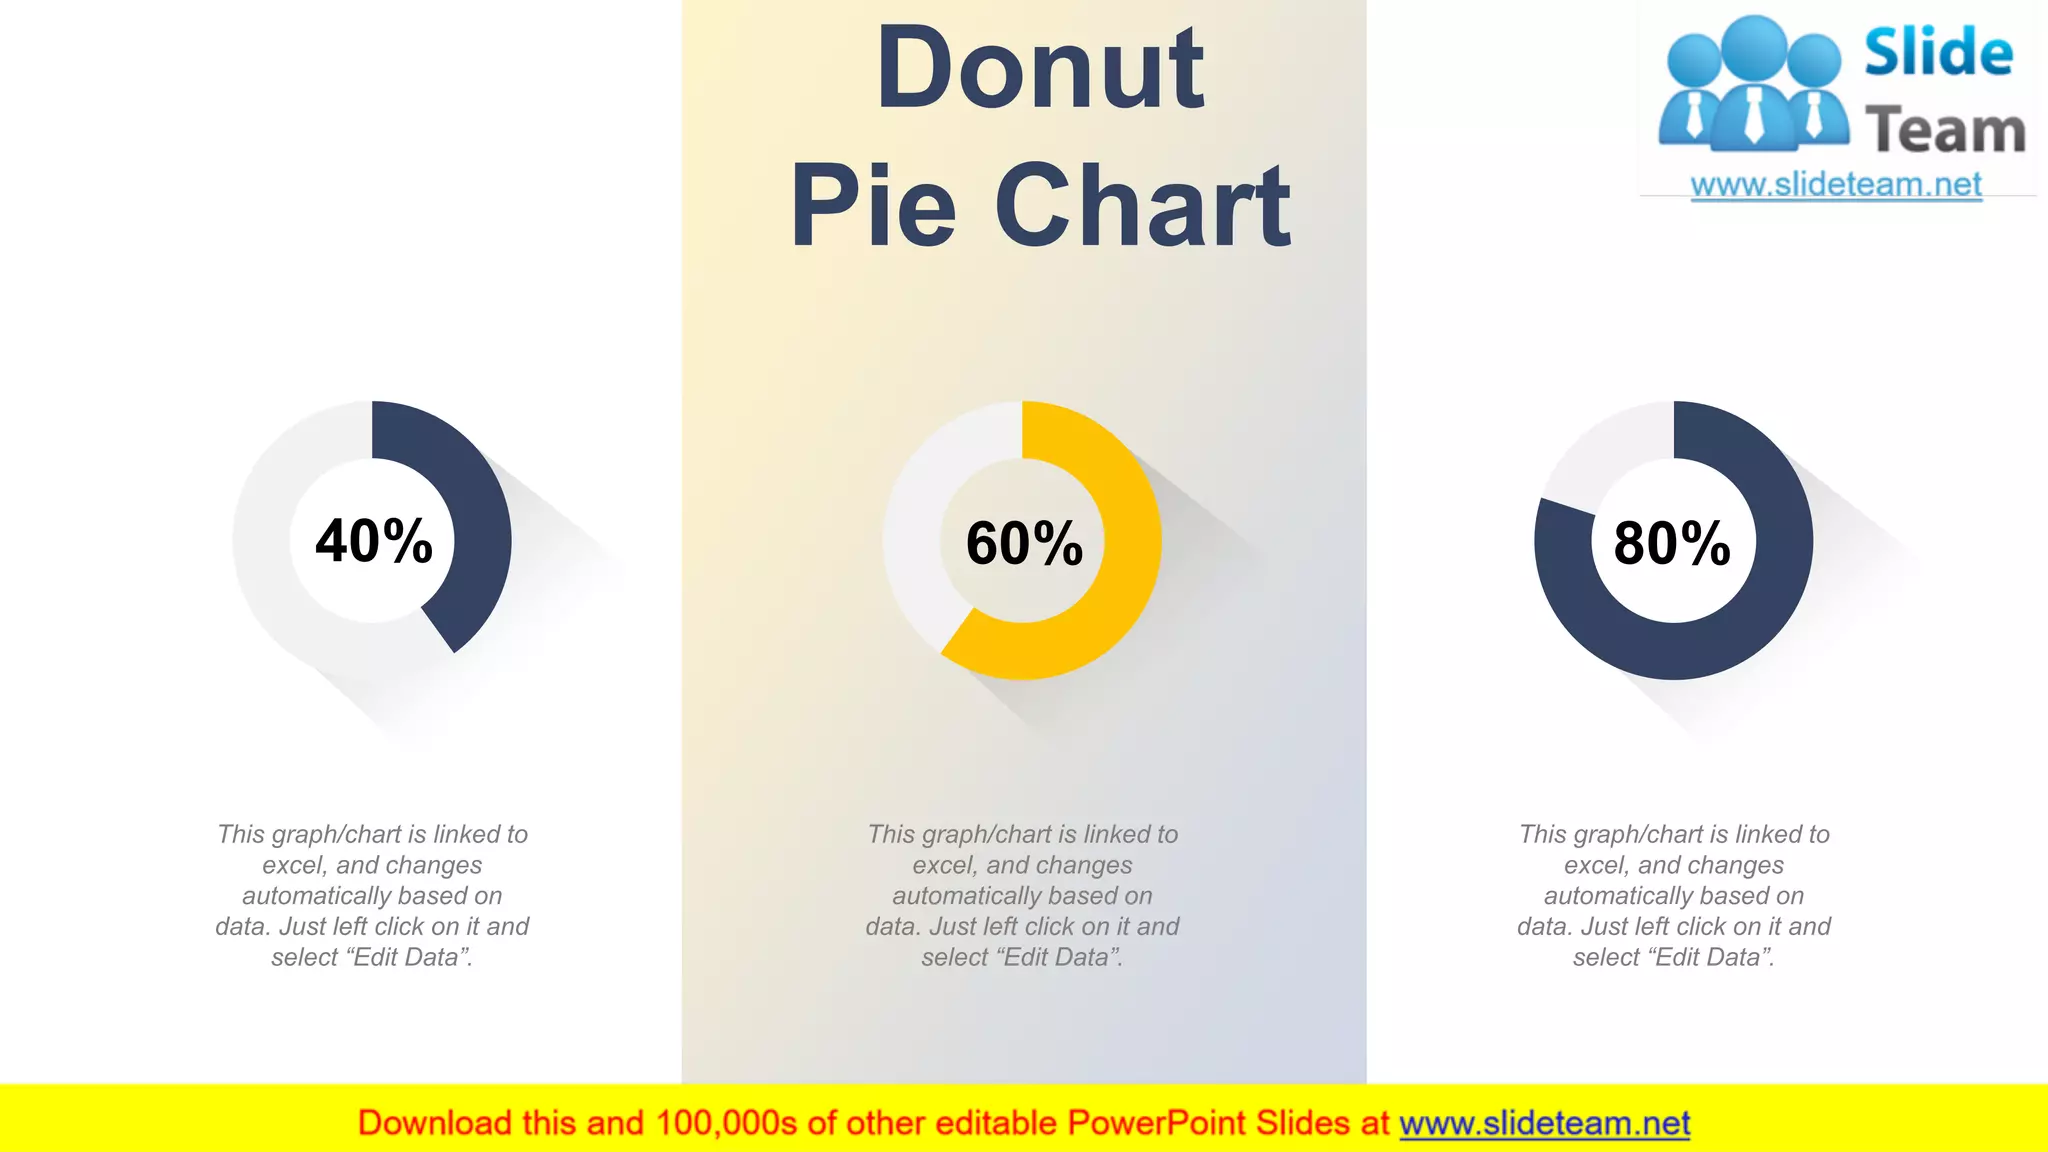
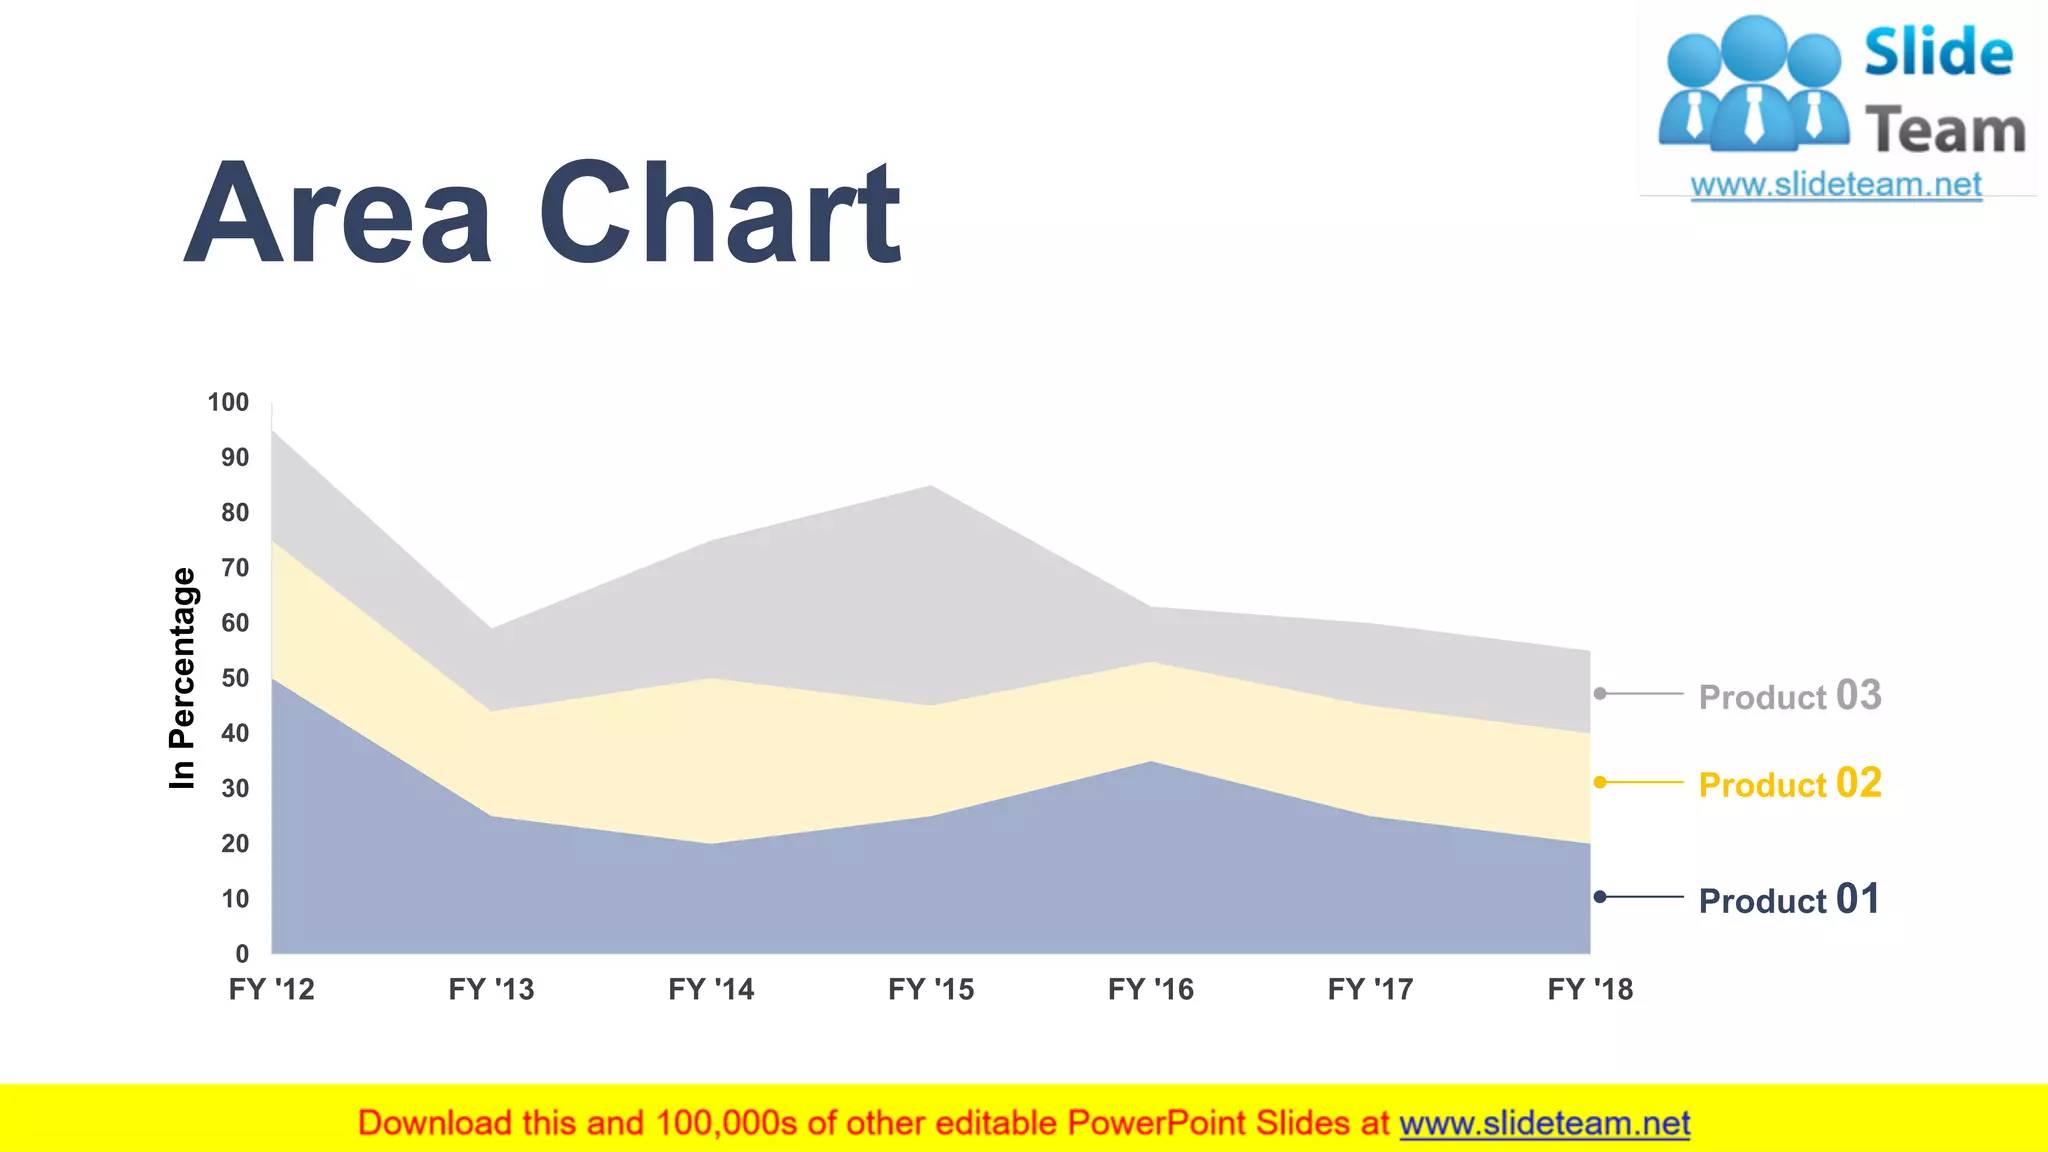


The document outlines a digital innovation strategy, emphasizing the need for transformation and identifying core elements, barriers, and methods to achieve digital transformation. It includes insights on task distribution, transformation budgets, and the value derived from transformation. Various editable slides focus on customer influence, competition, and employee involvement in the innovation process.


![Moho Pro 14.4 Crack for MacOS Works Until 2050 [Latest] pptx](https://cdn.slidesharecdn.com/ss_thumbnails/softwareoverview-251207192639-797289c4-thumbnail.jpg?width=640&height=640&fit=bounds)
![AnyTrans for iOS 8.9.14.20251127 With Crack for MacOS [Latest] pptx](https://cdn.slidesharecdn.com/ss_thumbnails/softwareoverview-251207190907-2316965f-thumbnail.jpg?width=640&height=640&fit=bounds)
![Soundtoys Mac v5.5.5.0 Crack for MacOS Full Version [Latest] pptx](https://cdn.slidesharecdn.com/ss_thumbnails/softwareoverview-251207193711-91d8ae6b-thumbnail.jpg?width=640&height=640&fit=bounds)


![Driver Easy Pro Key 7.1.0.2641 Full Mac Crack Free Activated Download [2026]....](https://cdn.slidesharecdn.com/ss_thumbnails/software-251207185324-b2fb71b4-thumbnail.jpg?width=640&height=640&fit=bounds)
![Wondershare Filmora 15.0.11 Crack for Mac Key Full Download [Latest] pptx](https://cdn.slidesharecdn.com/ss_thumbnails/software-251207184836-1d16ba16-thumbnail.jpg?width=640&height=640&fit=bounds)
![PowerISO 9.2 Mac Crack + Serial Key Free Download 2026 [Latest] Software.pptx](https://cdn.slidesharecdn.com/ss_thumbnails/software-251207185653-5d5700e6-thumbnail.jpg?width=640&height=640&fit=bounds)


