Diagrama de Nyquist Plot Solucion Problema #2
•Download as DOCX, PDF•
0 likes•109 views

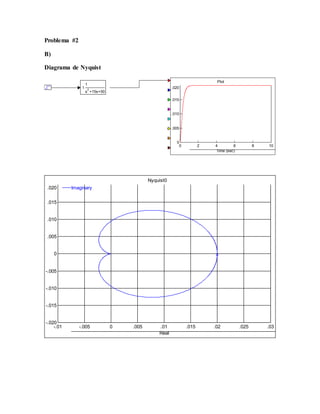
This diagram shows the Nyquist plot of a transfer function with a pole at s = -15 and a zero at s = -50. The Nyquist plot traces out a clockwise loop in the left half of the complex plane as time increases, indicating that the system is stable.

Recommended
More Related Content
Viewers also liked
Viewers also liked (20)
Recently uploaded
Recently uploaded (20)
Diagrama de Nyquist Plot Solucion Problema #2
- 1. Problema #2 B) Diagrama de Nyquist Plot Time (sec) 0 2 4 6 8 10 0 .005 .010 .015 .0201 1 s 2 +15s+50 Nyquist0 Real -.01 -.005 0 .005 .01 .015 .02 .025 .03 -.020 -.015 -.010 -.005 0 .005 .010 .015 .020 Imaginary