
Download to read offline

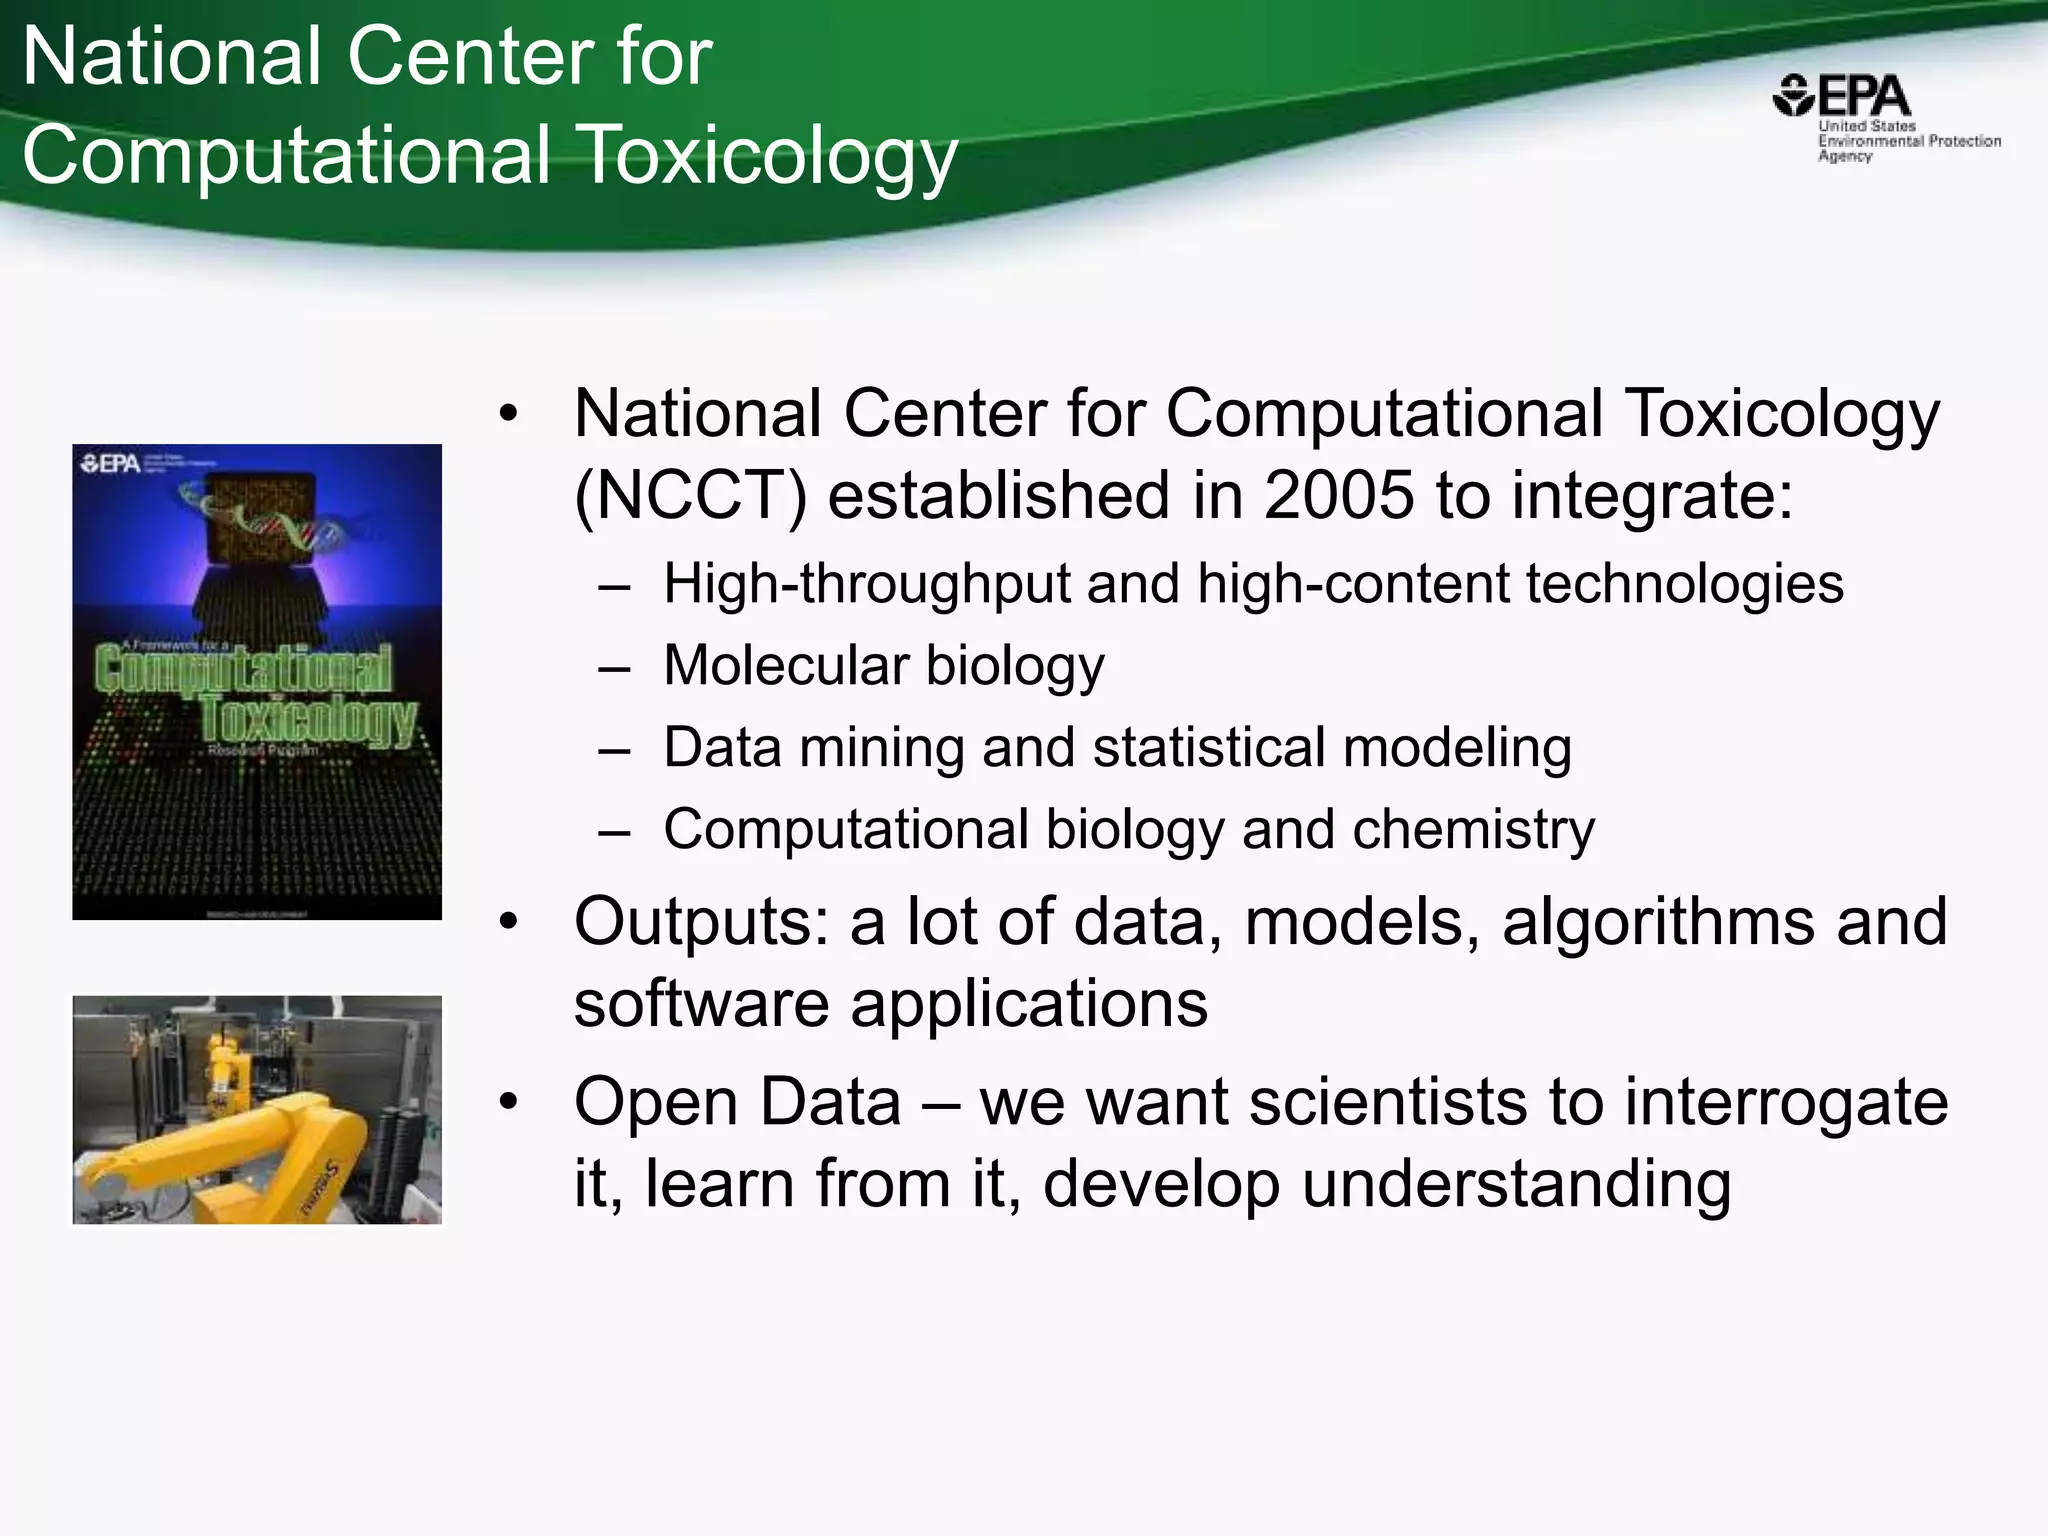
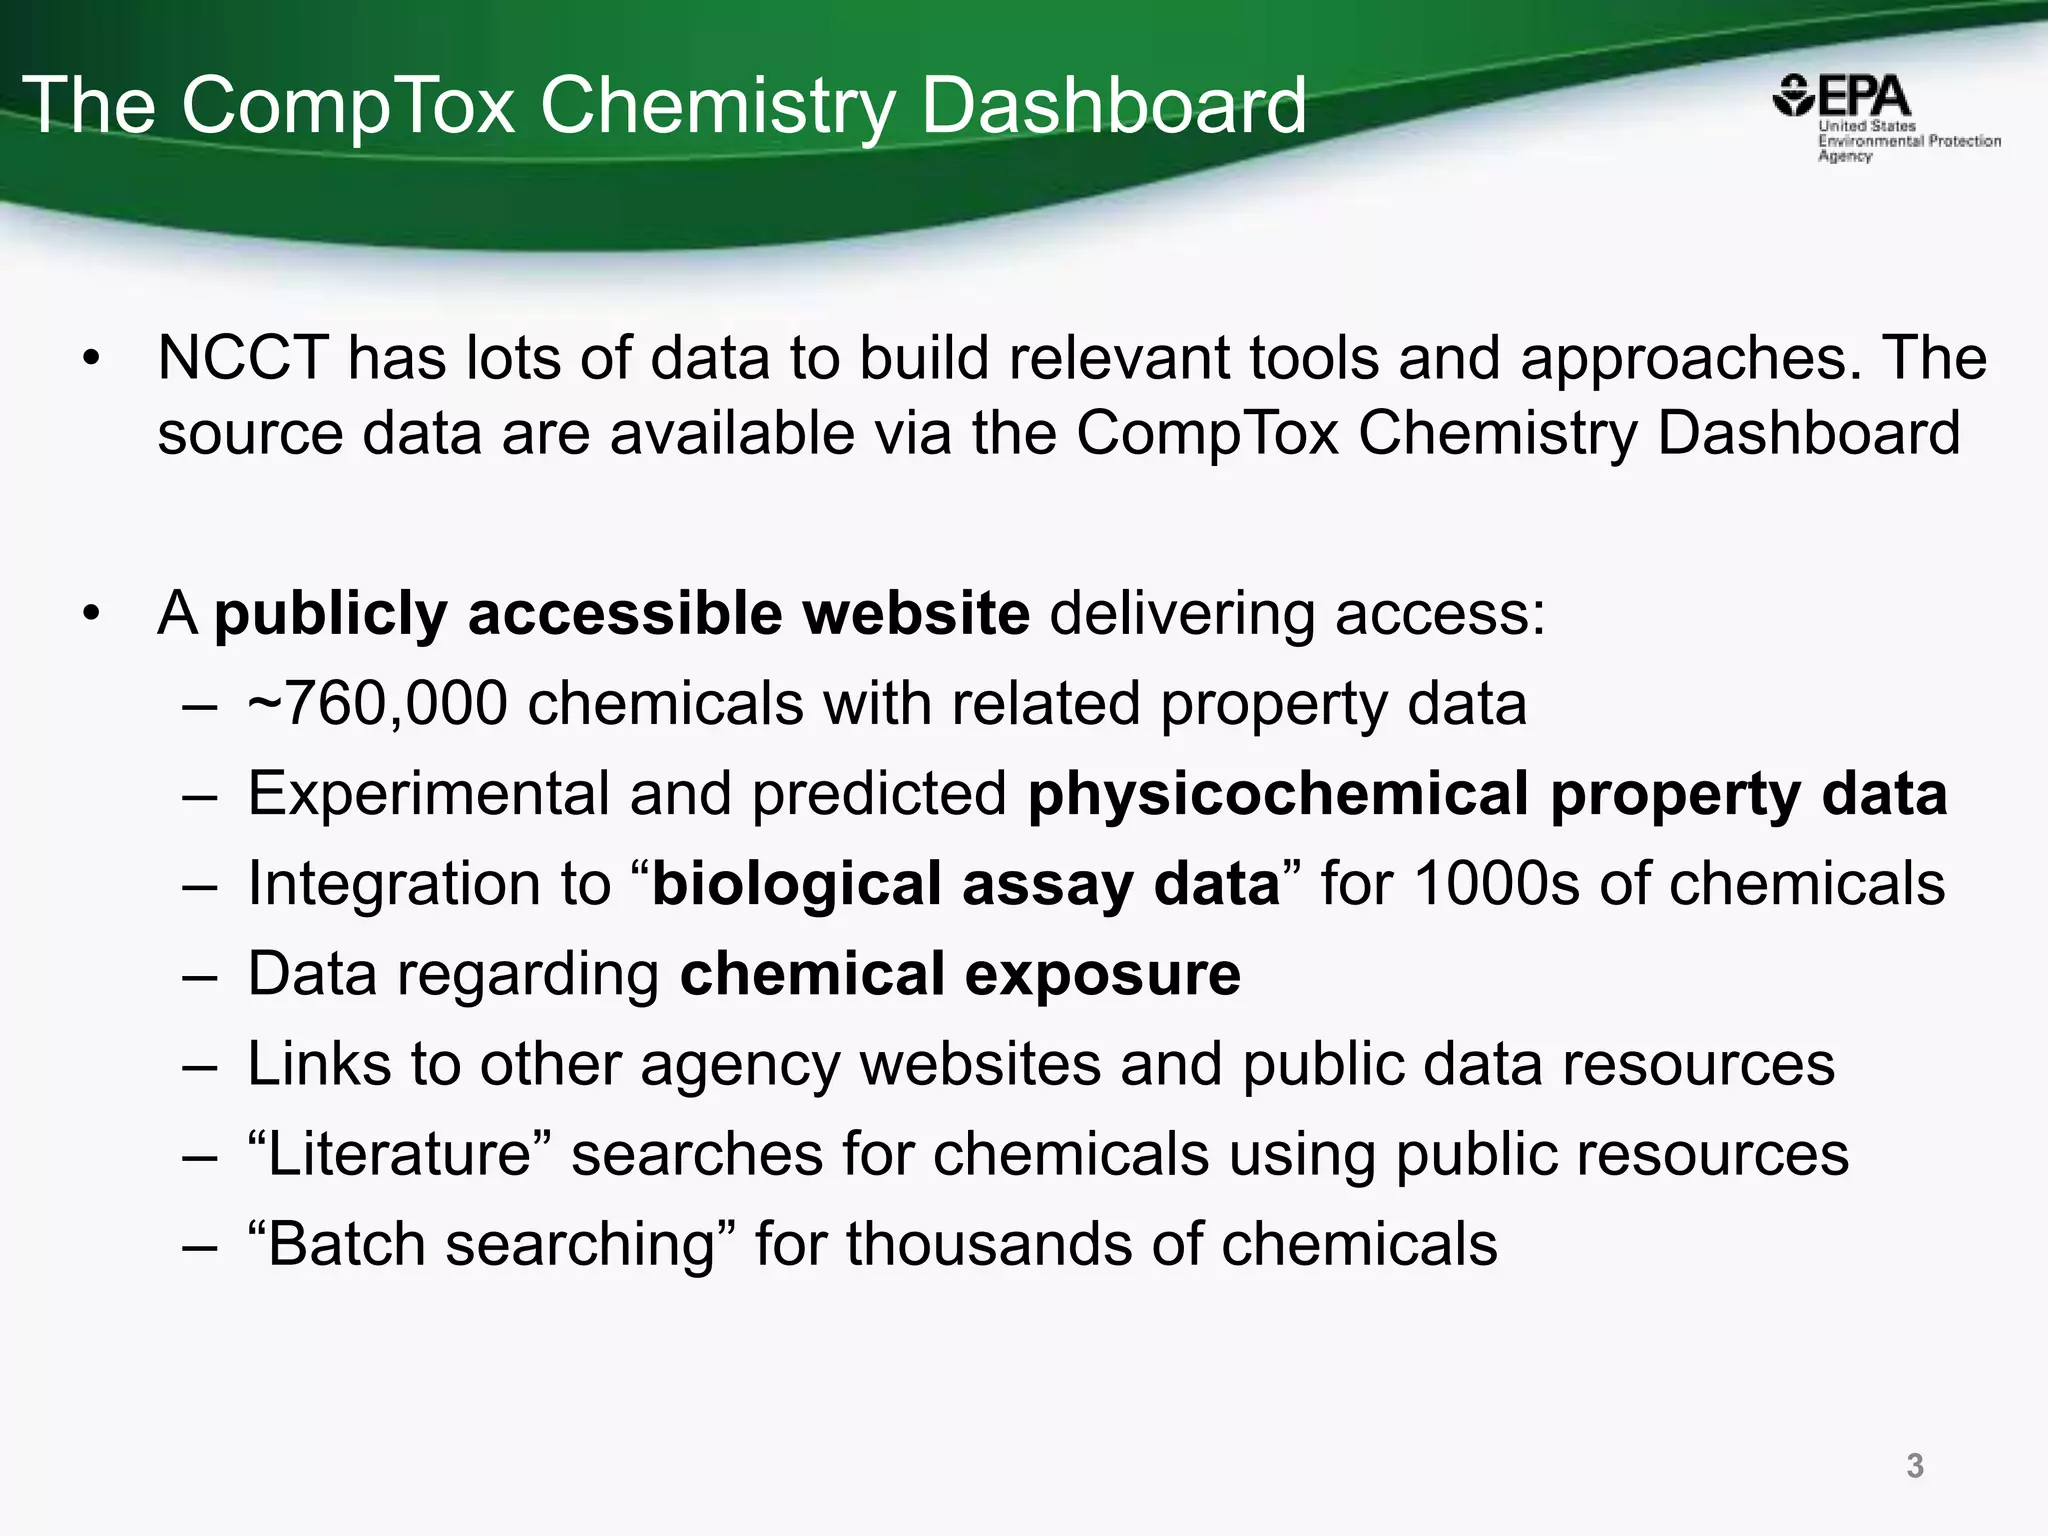
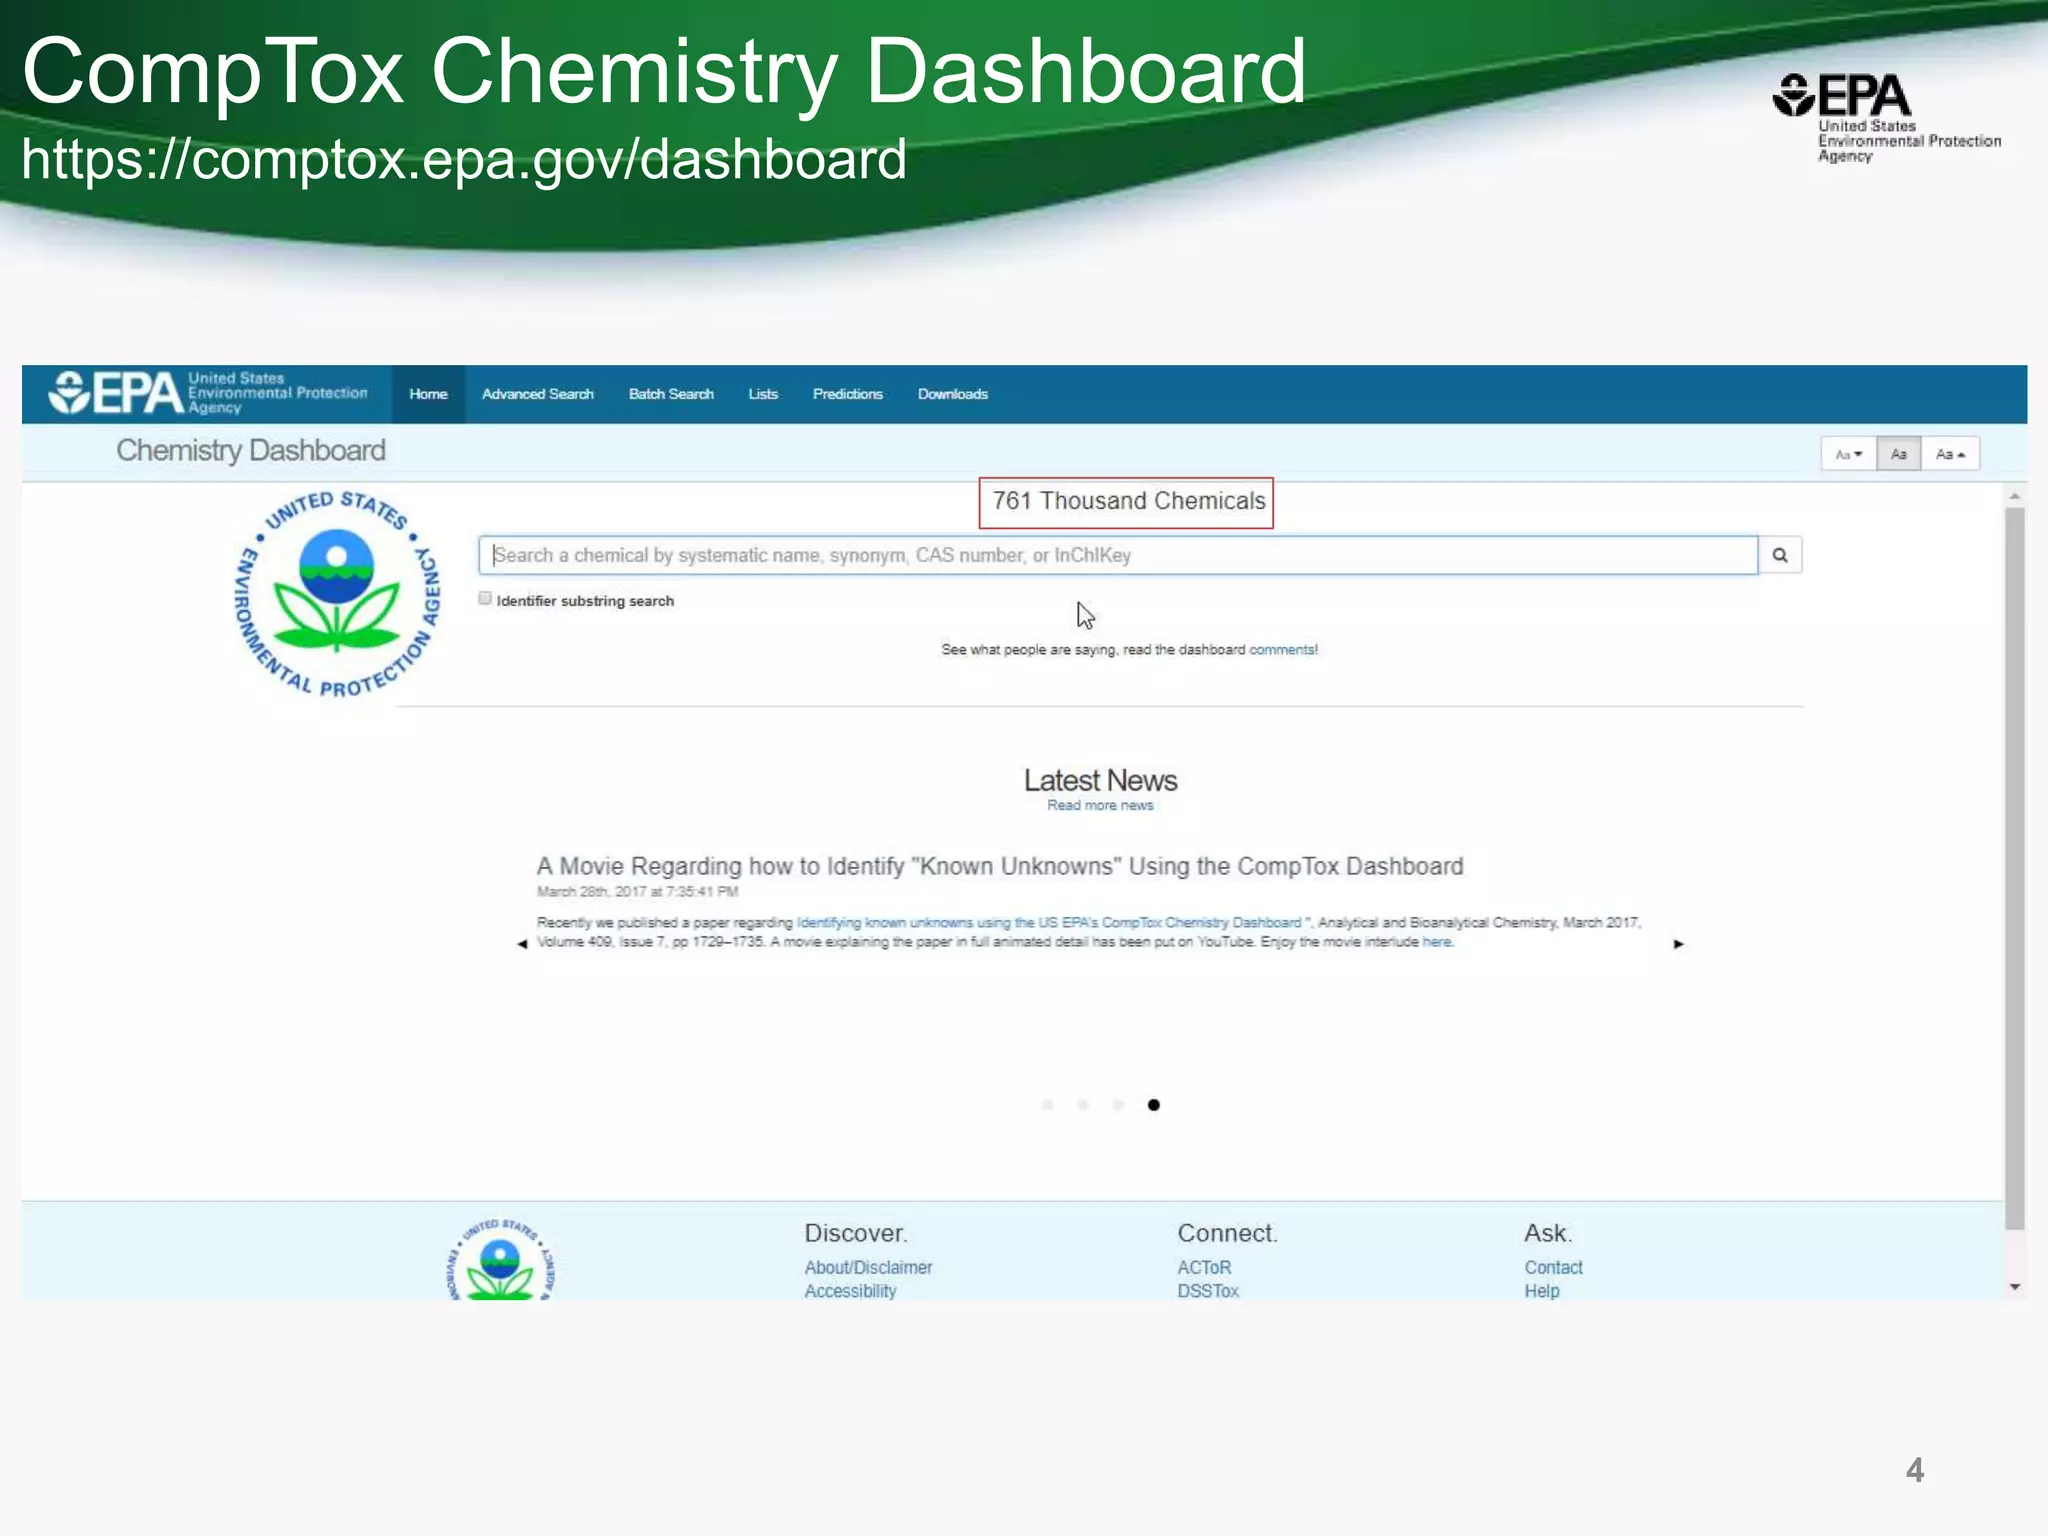
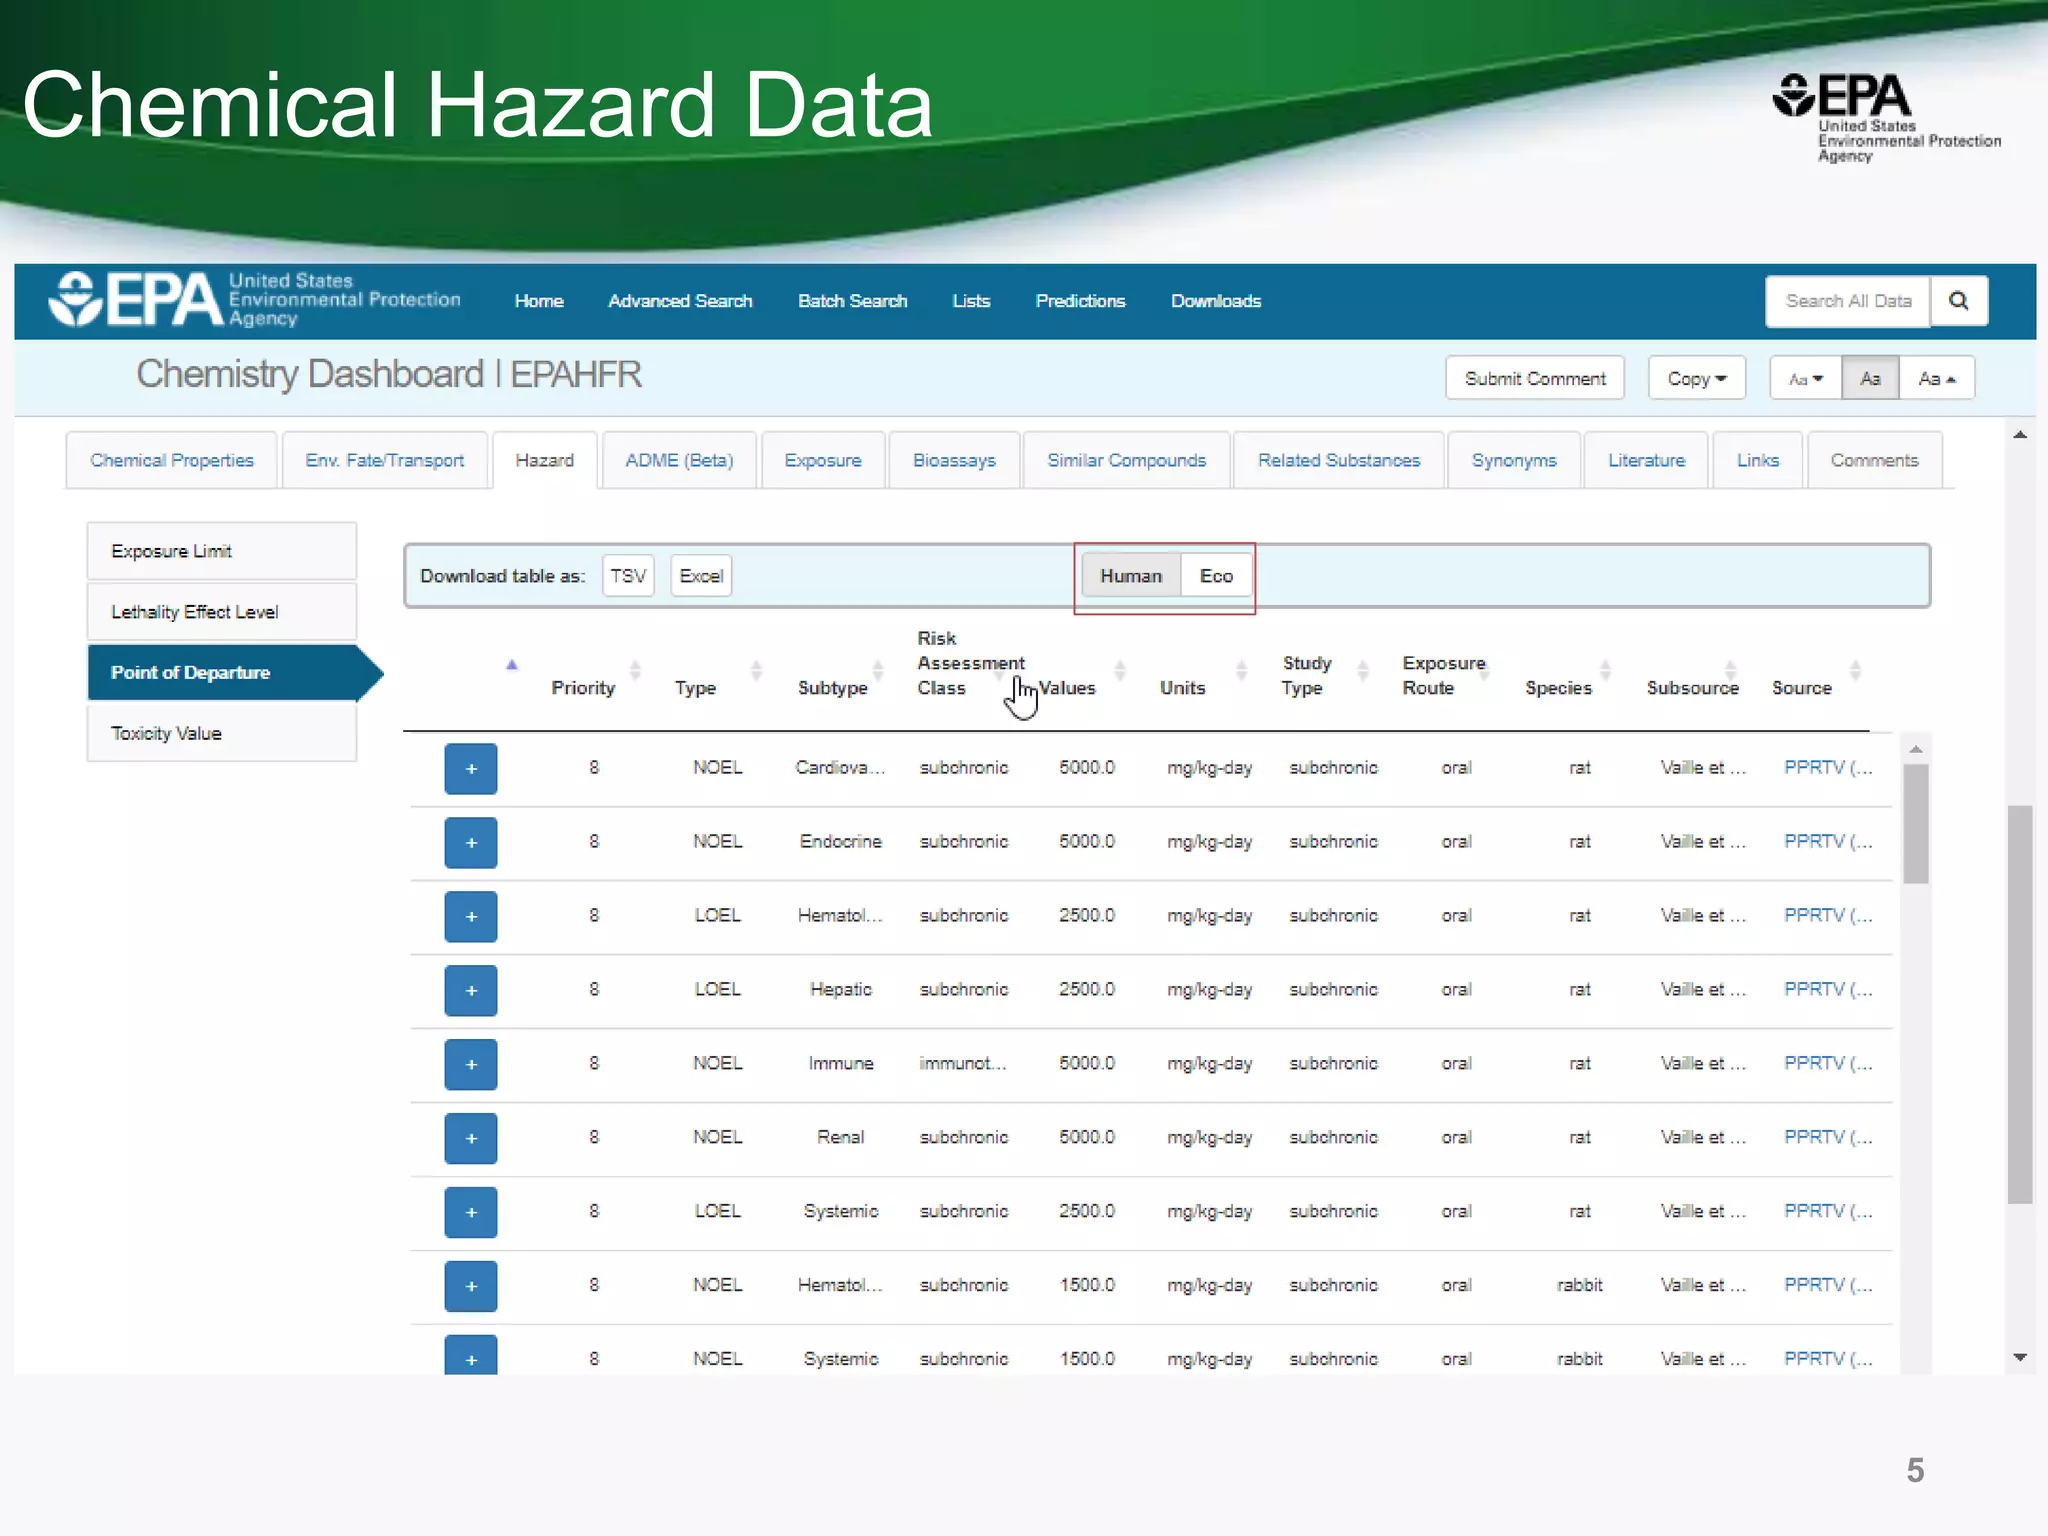
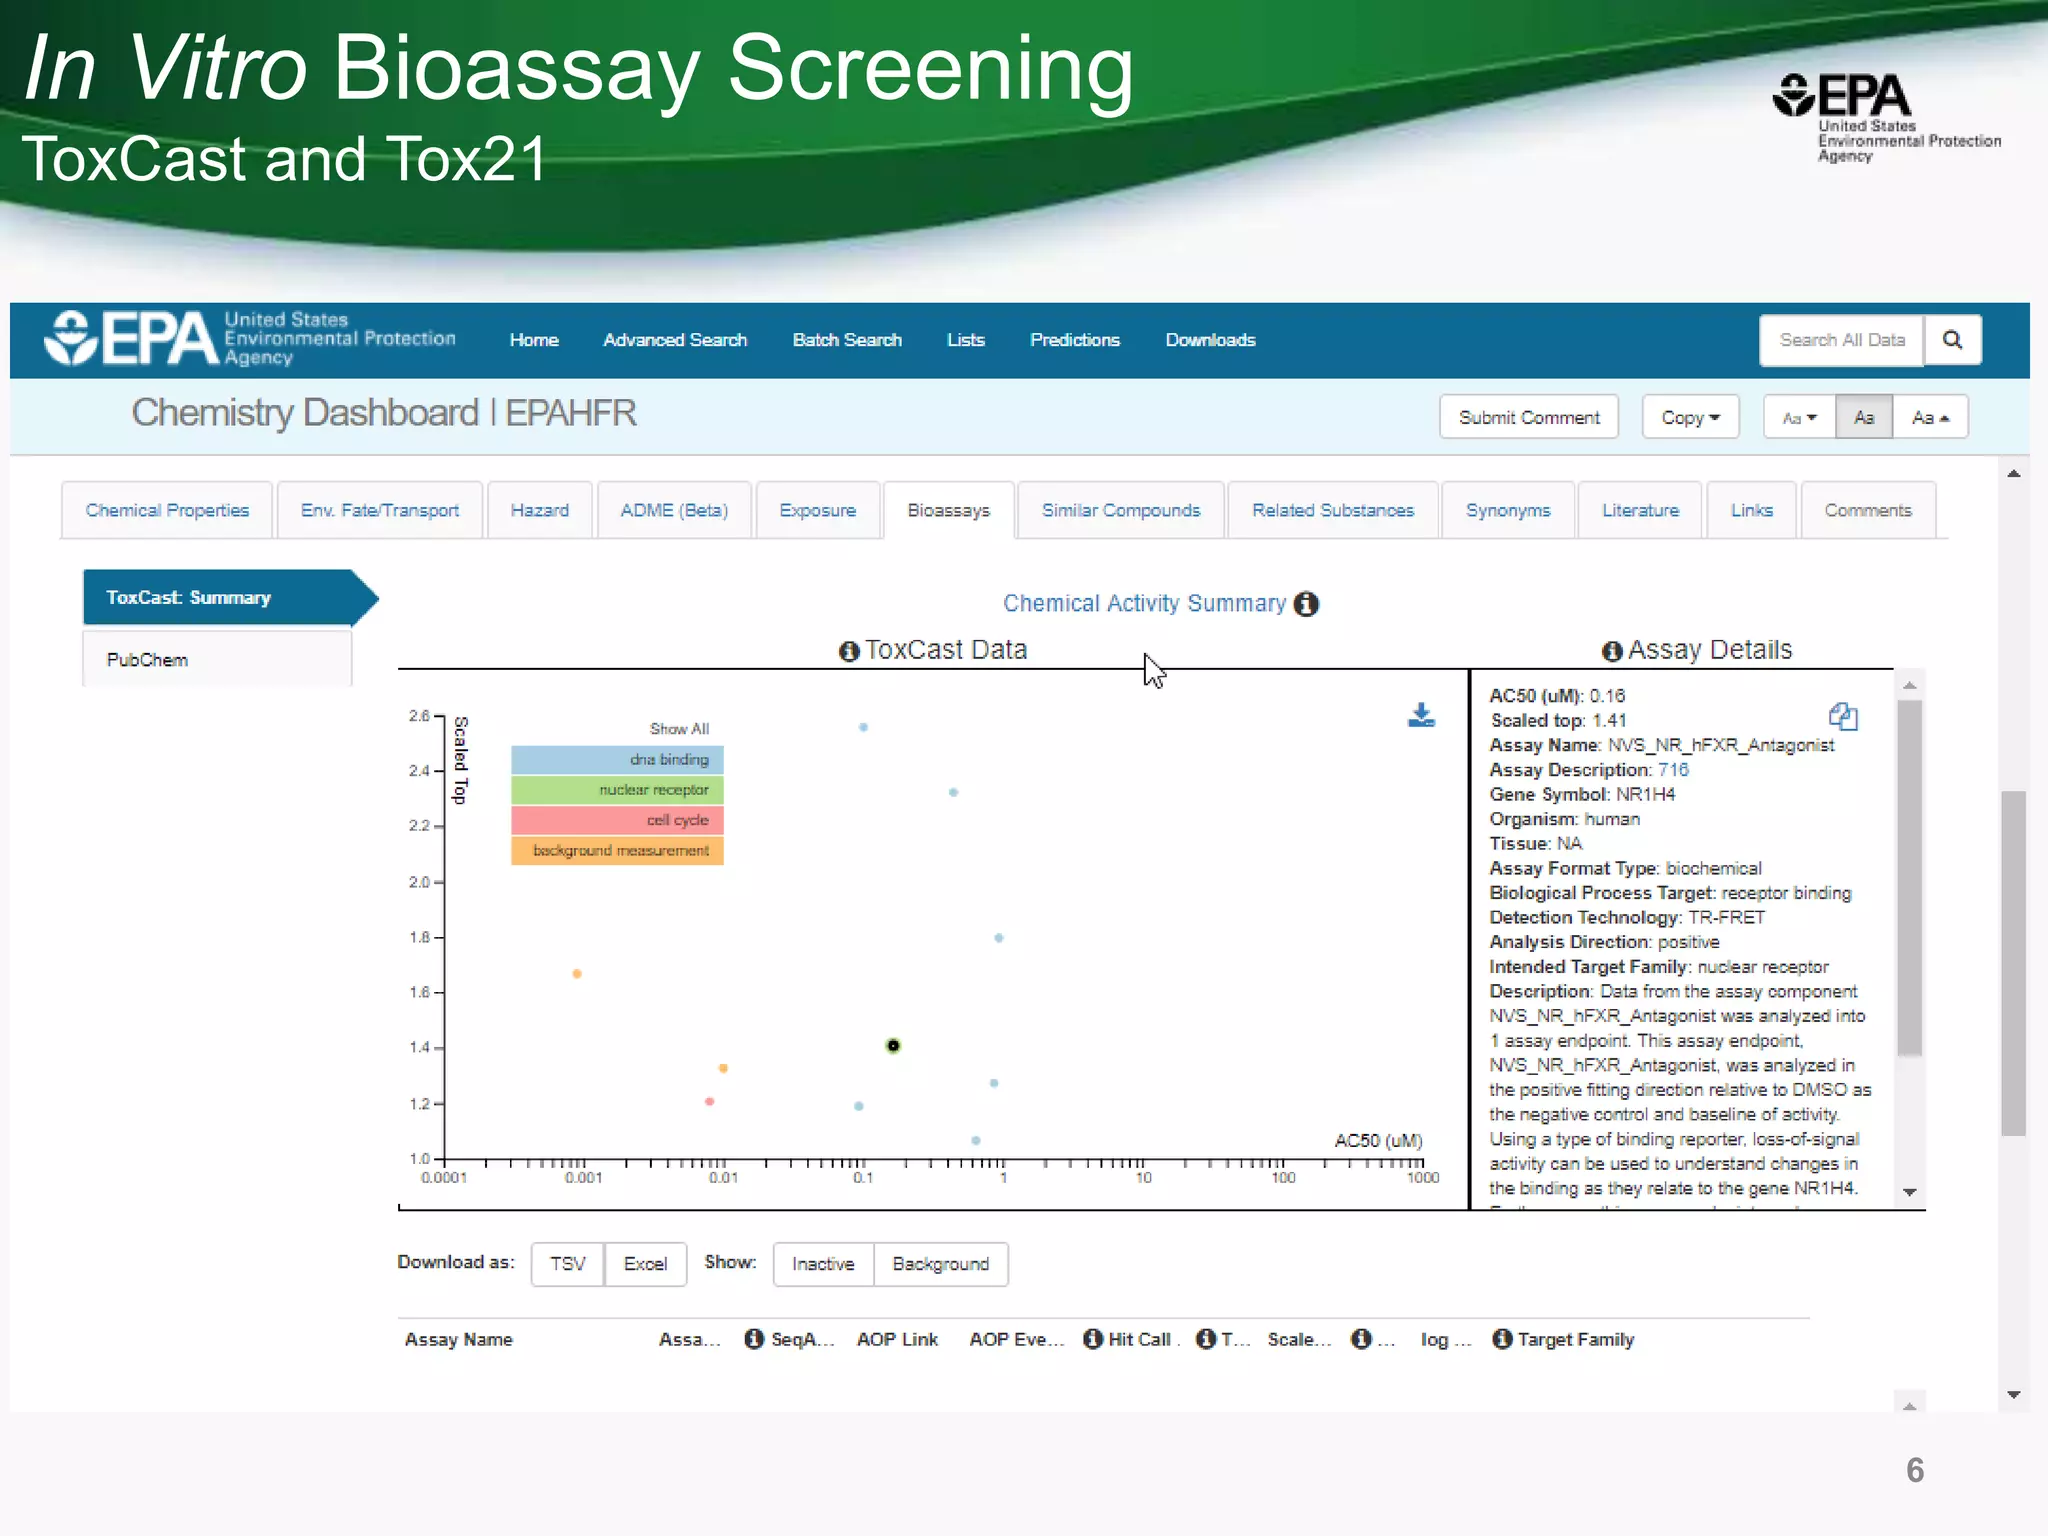
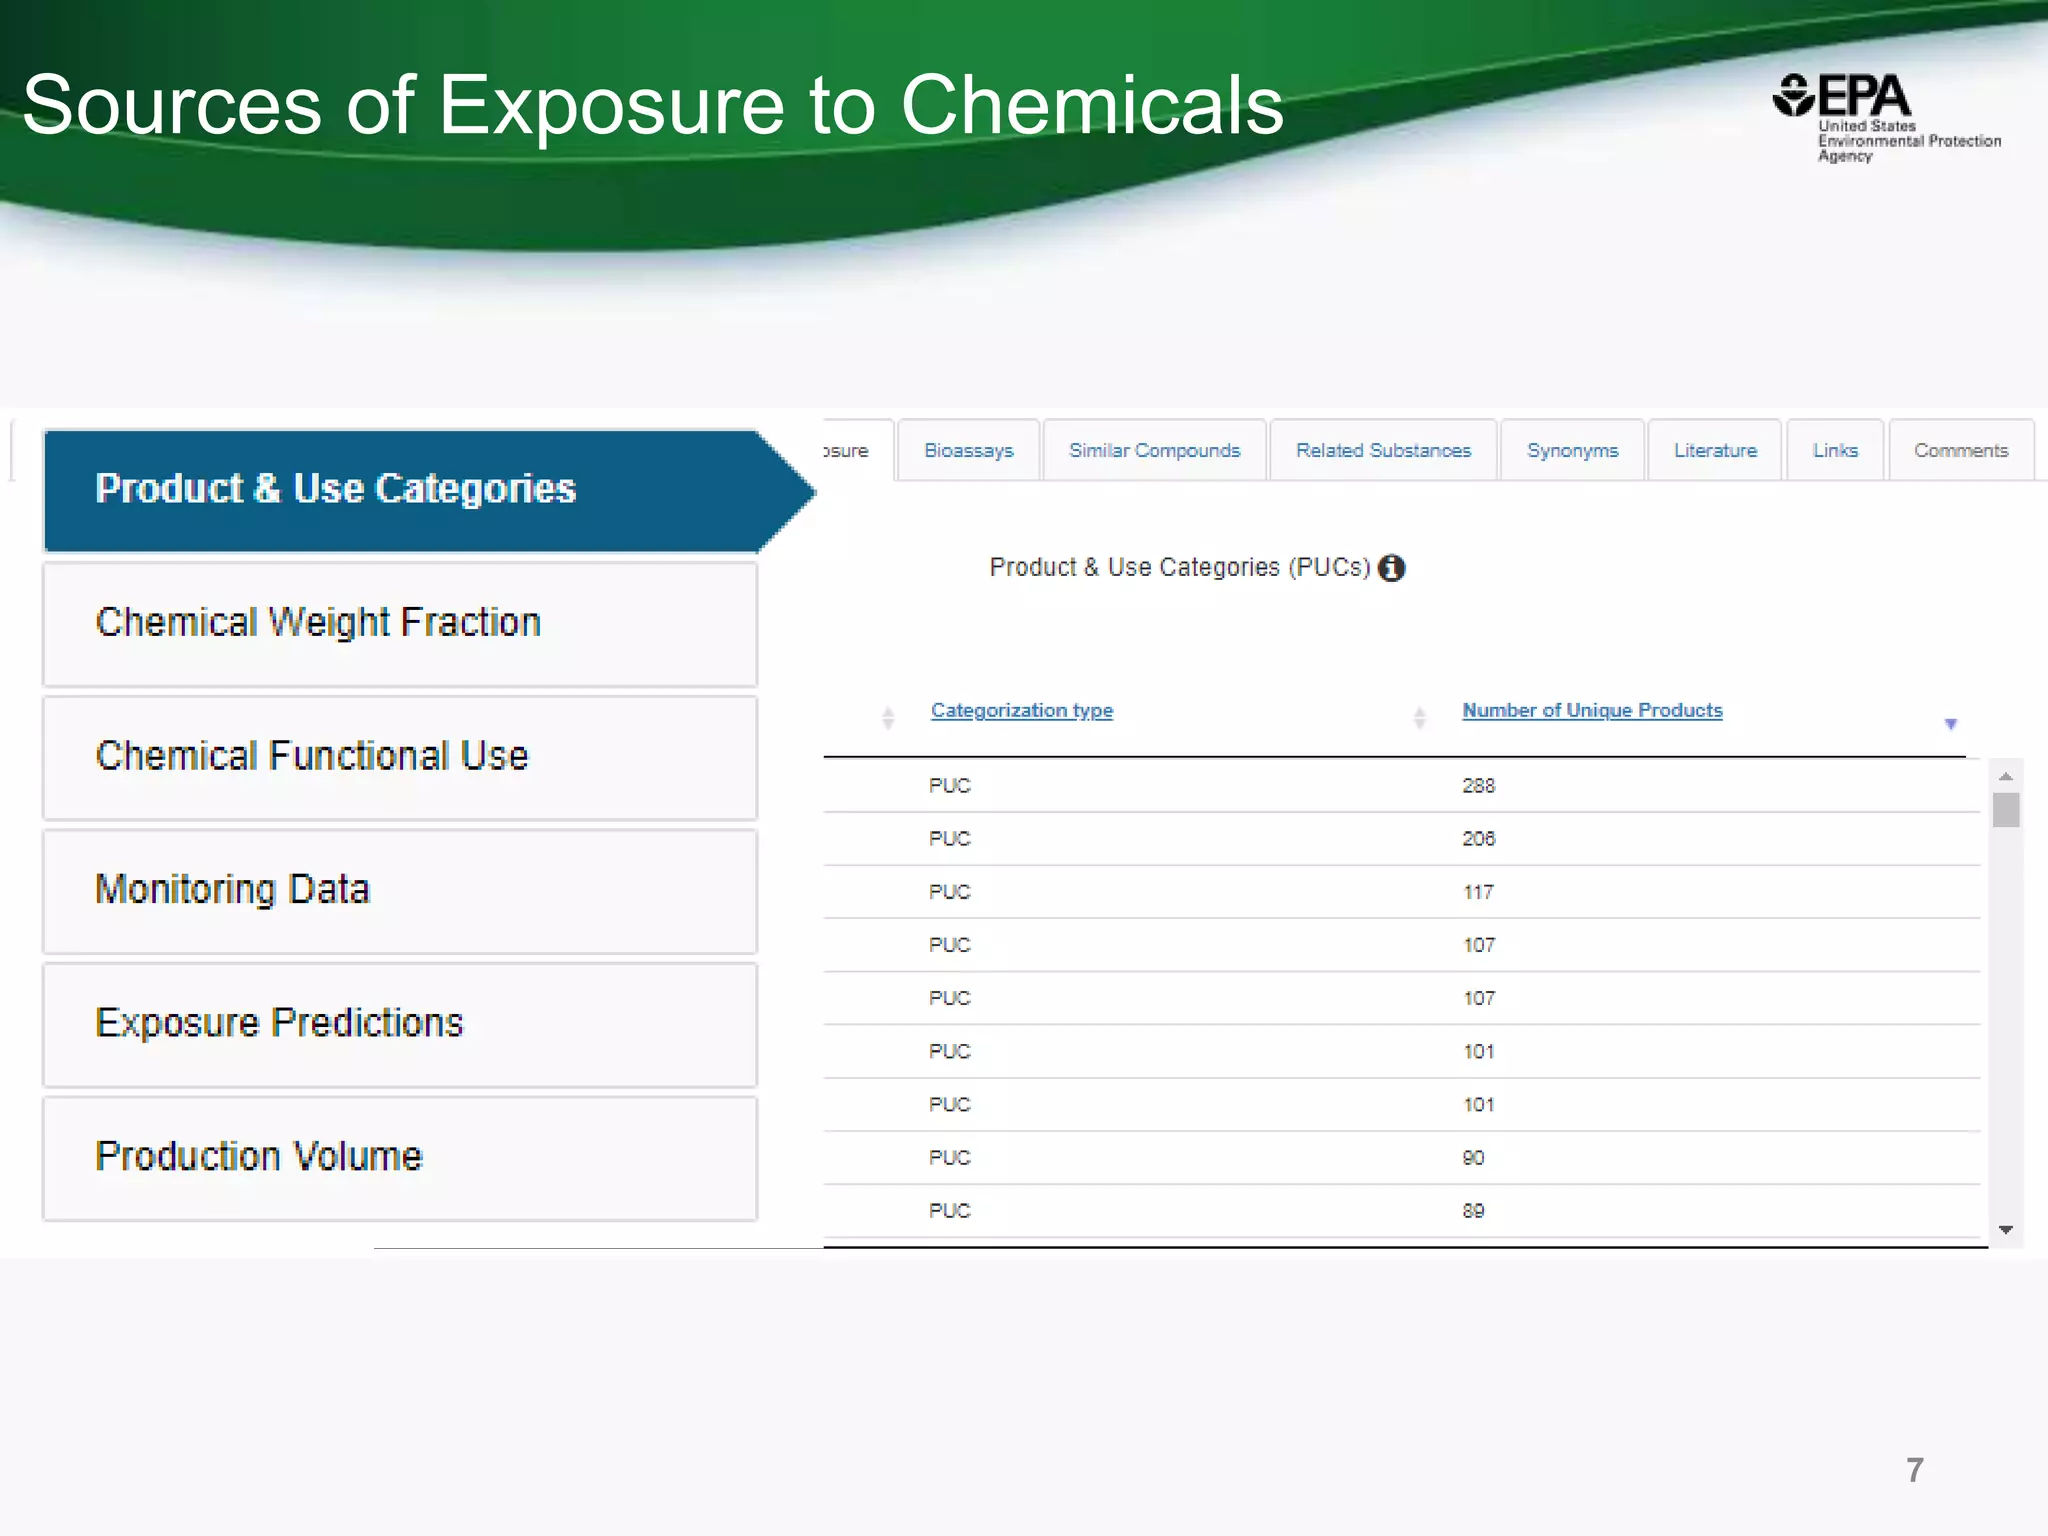
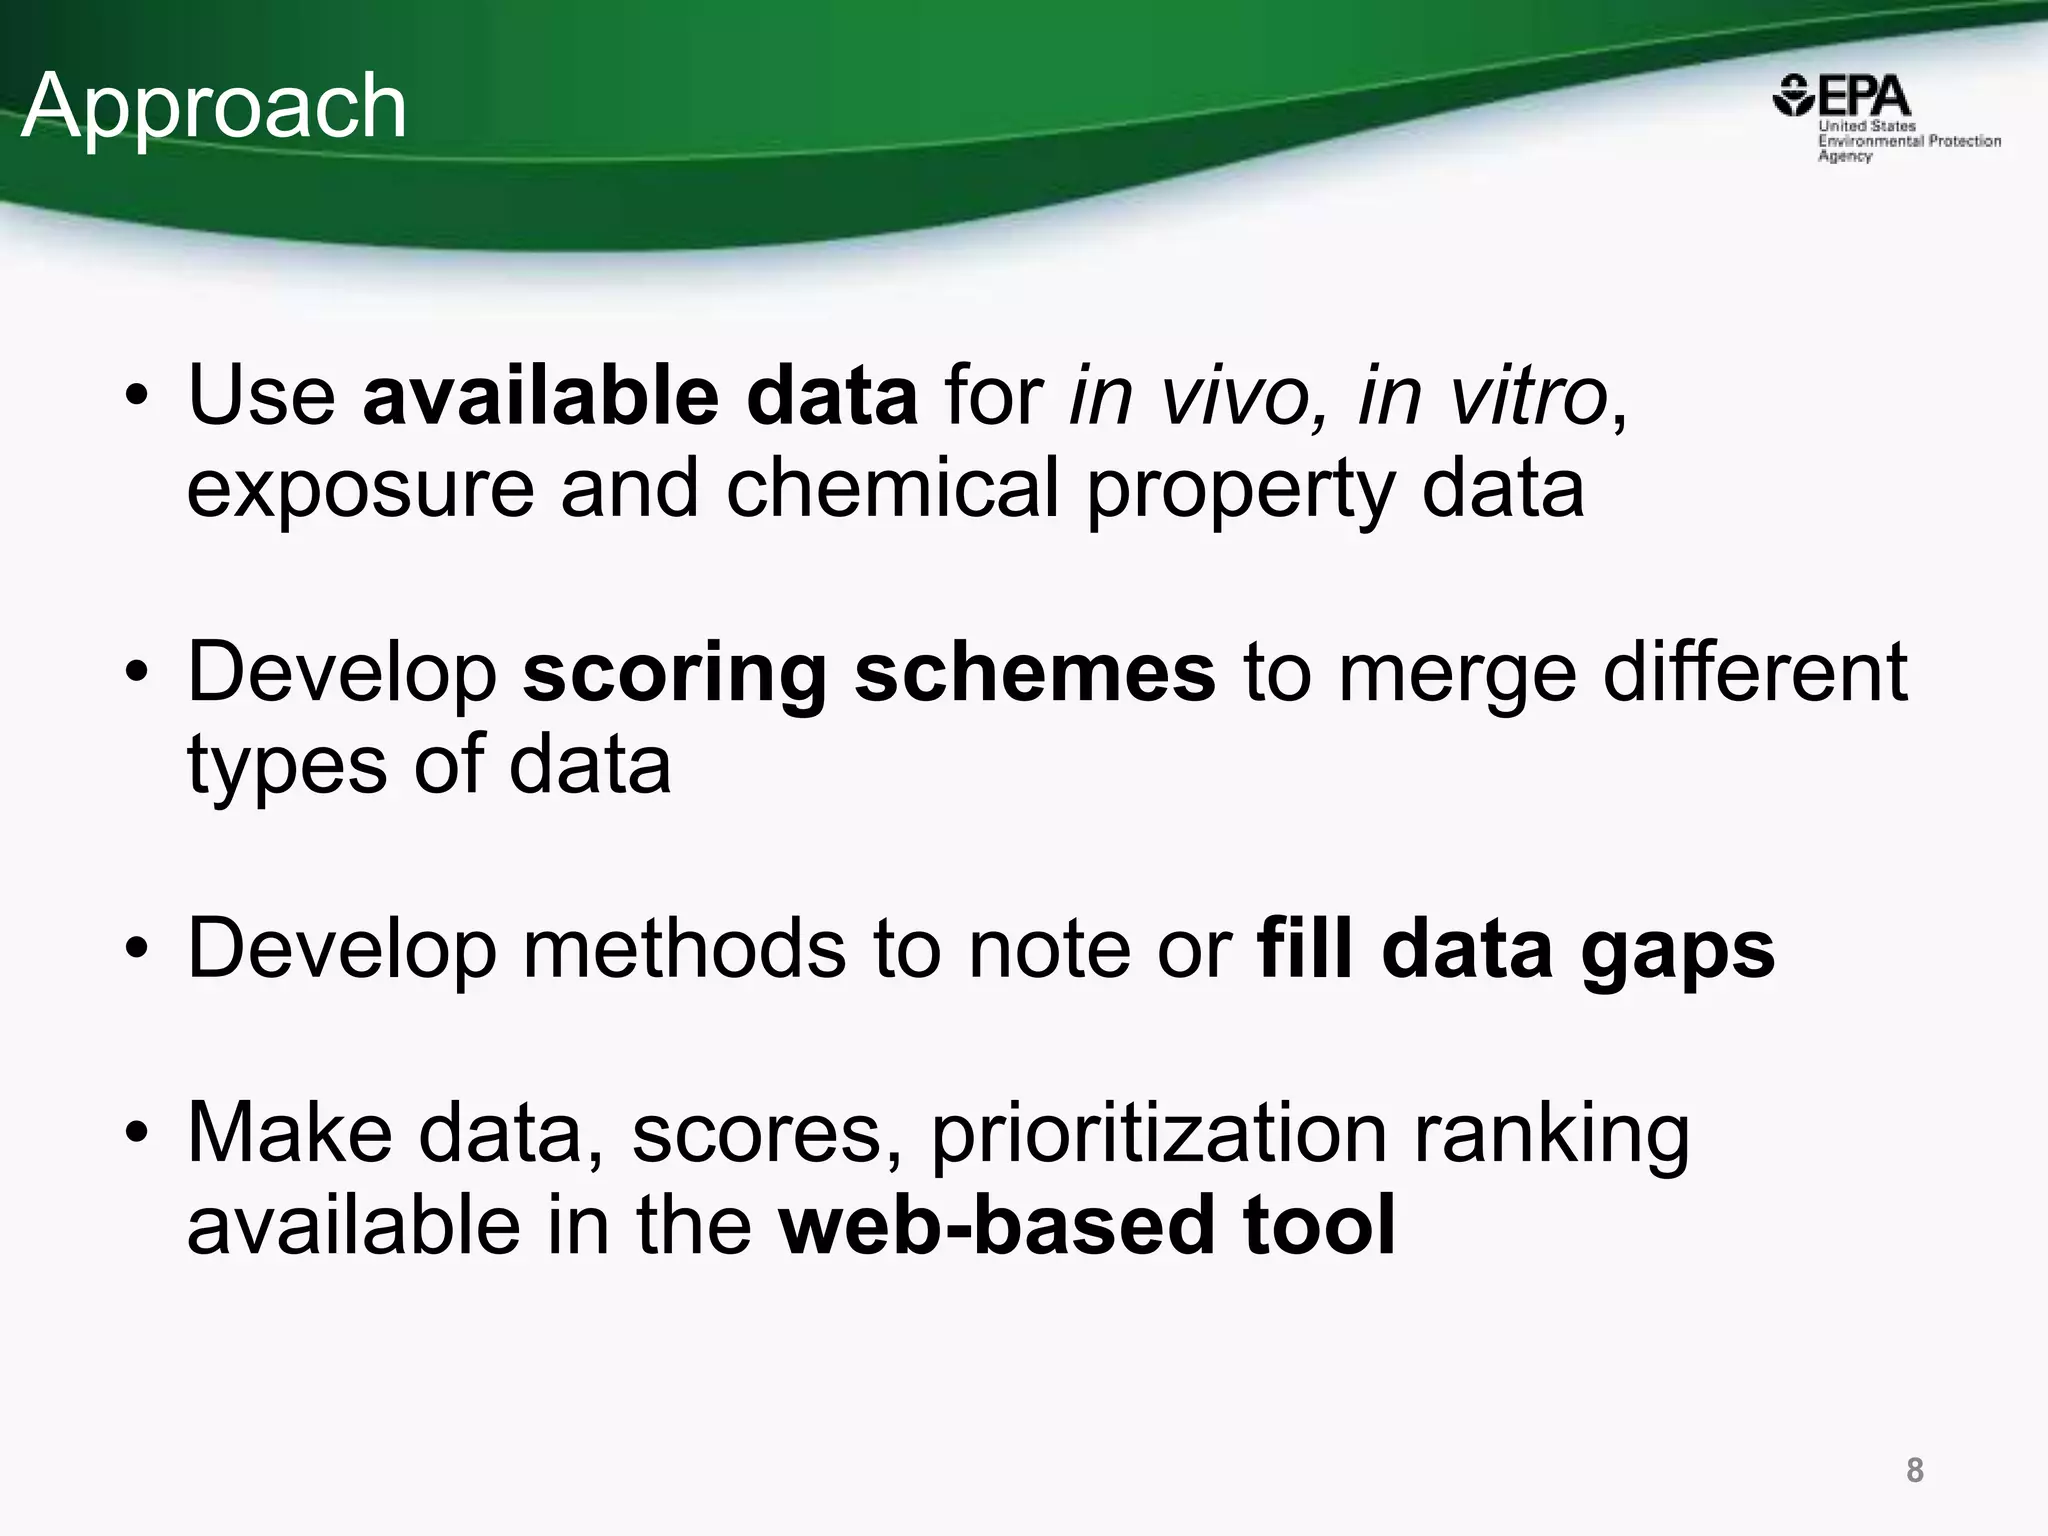
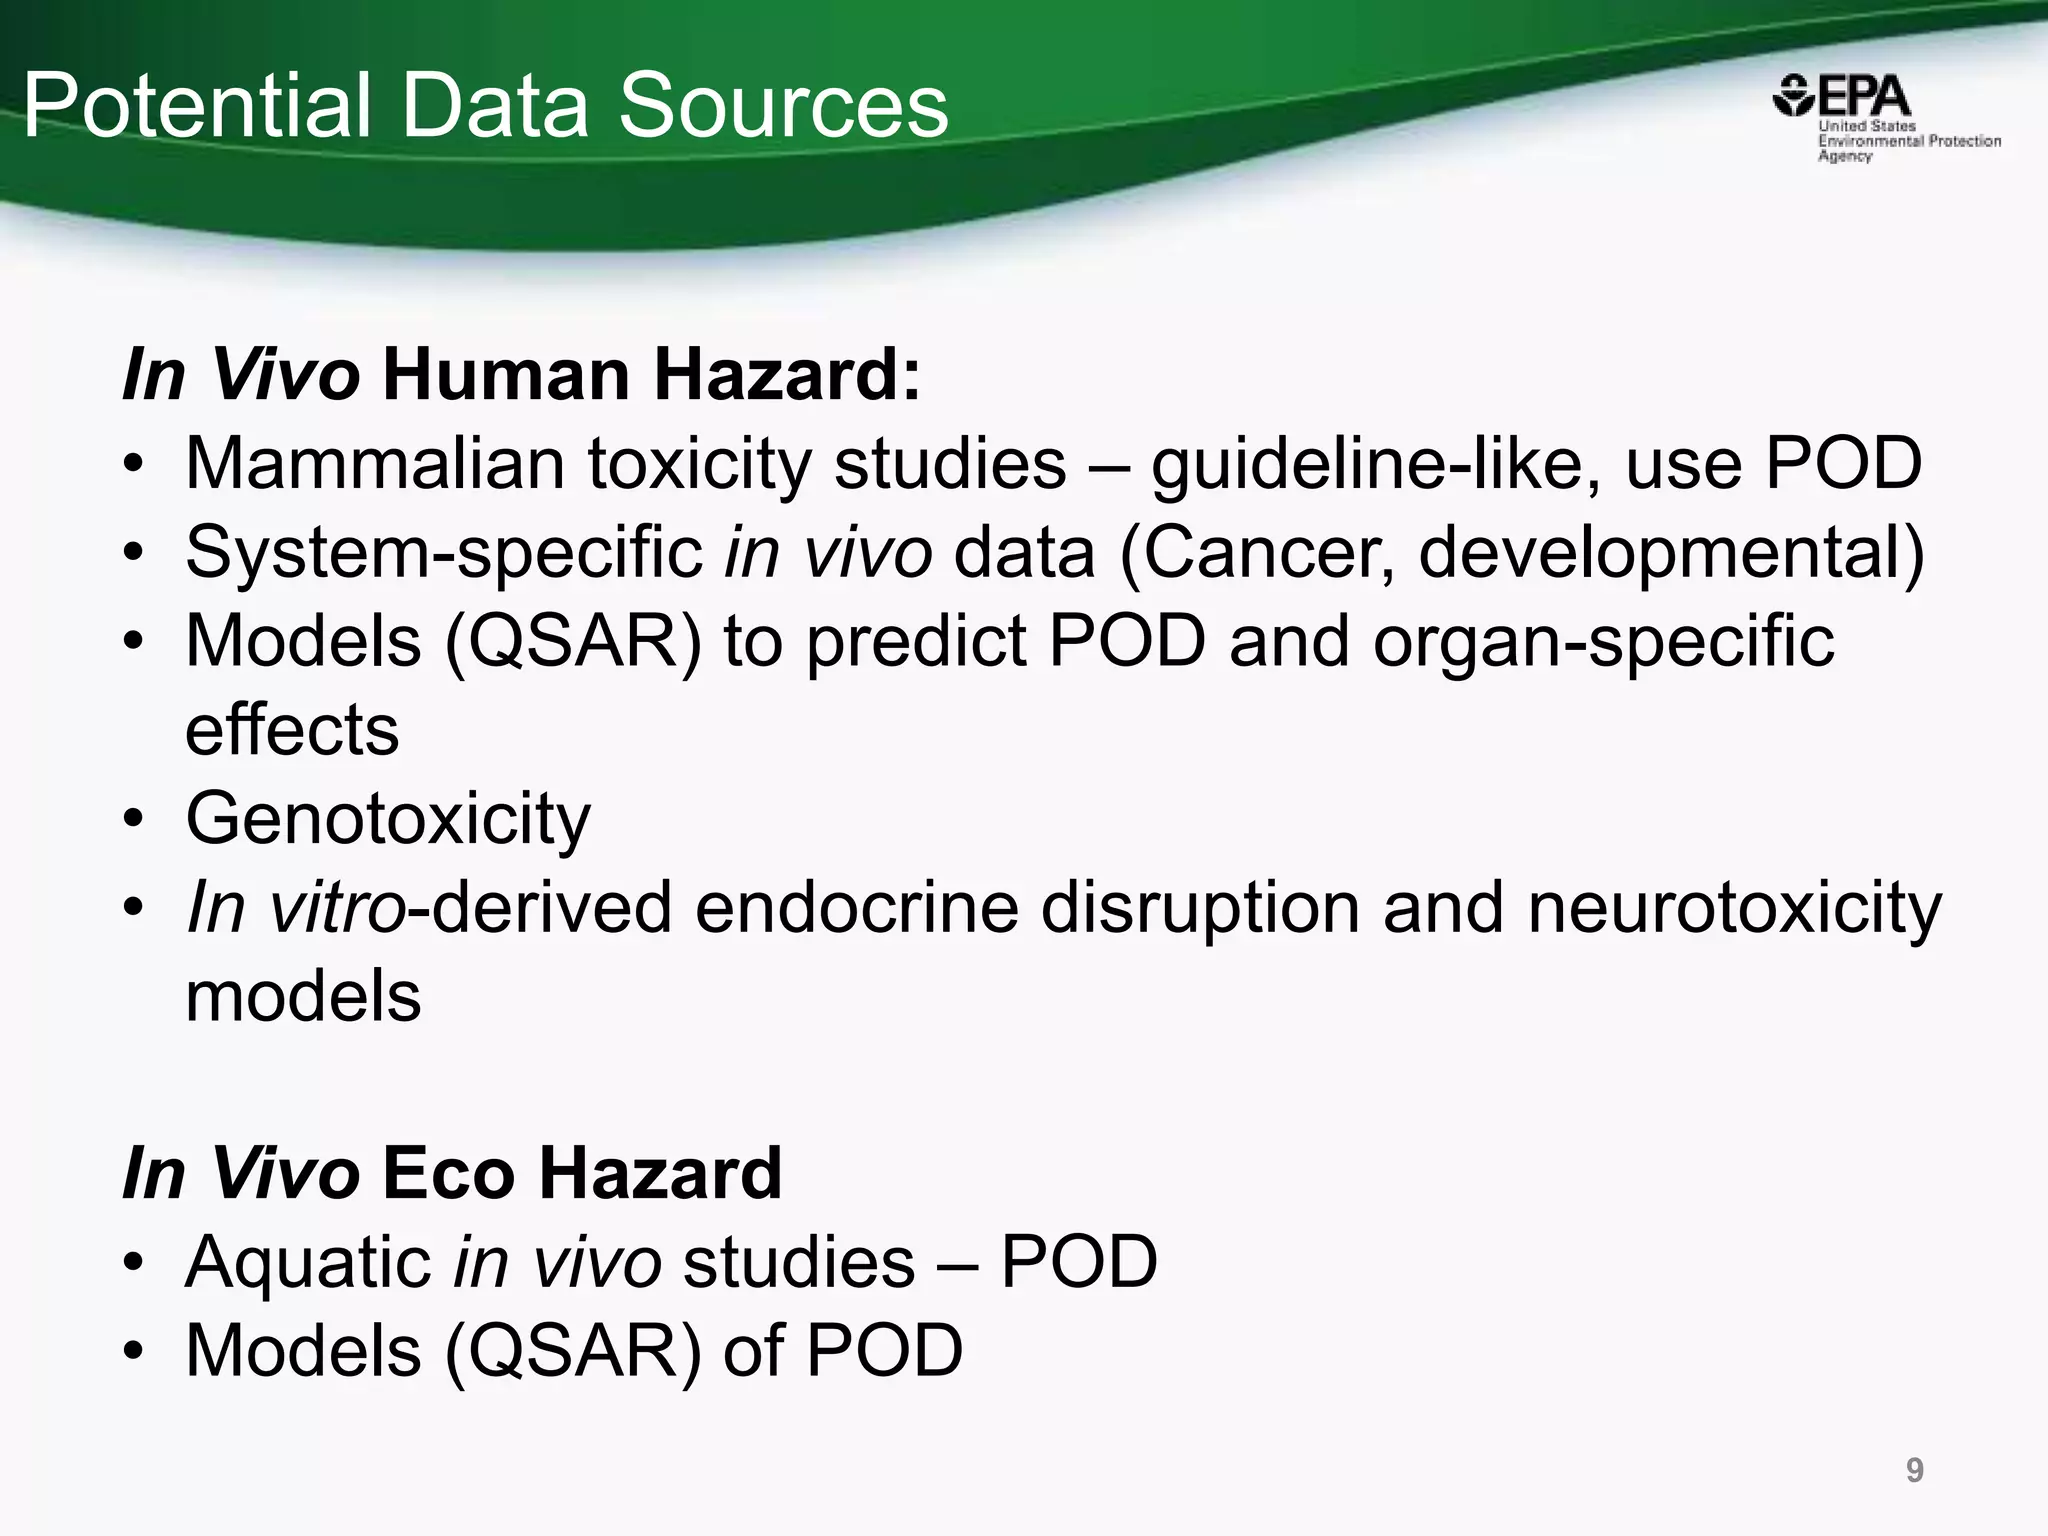
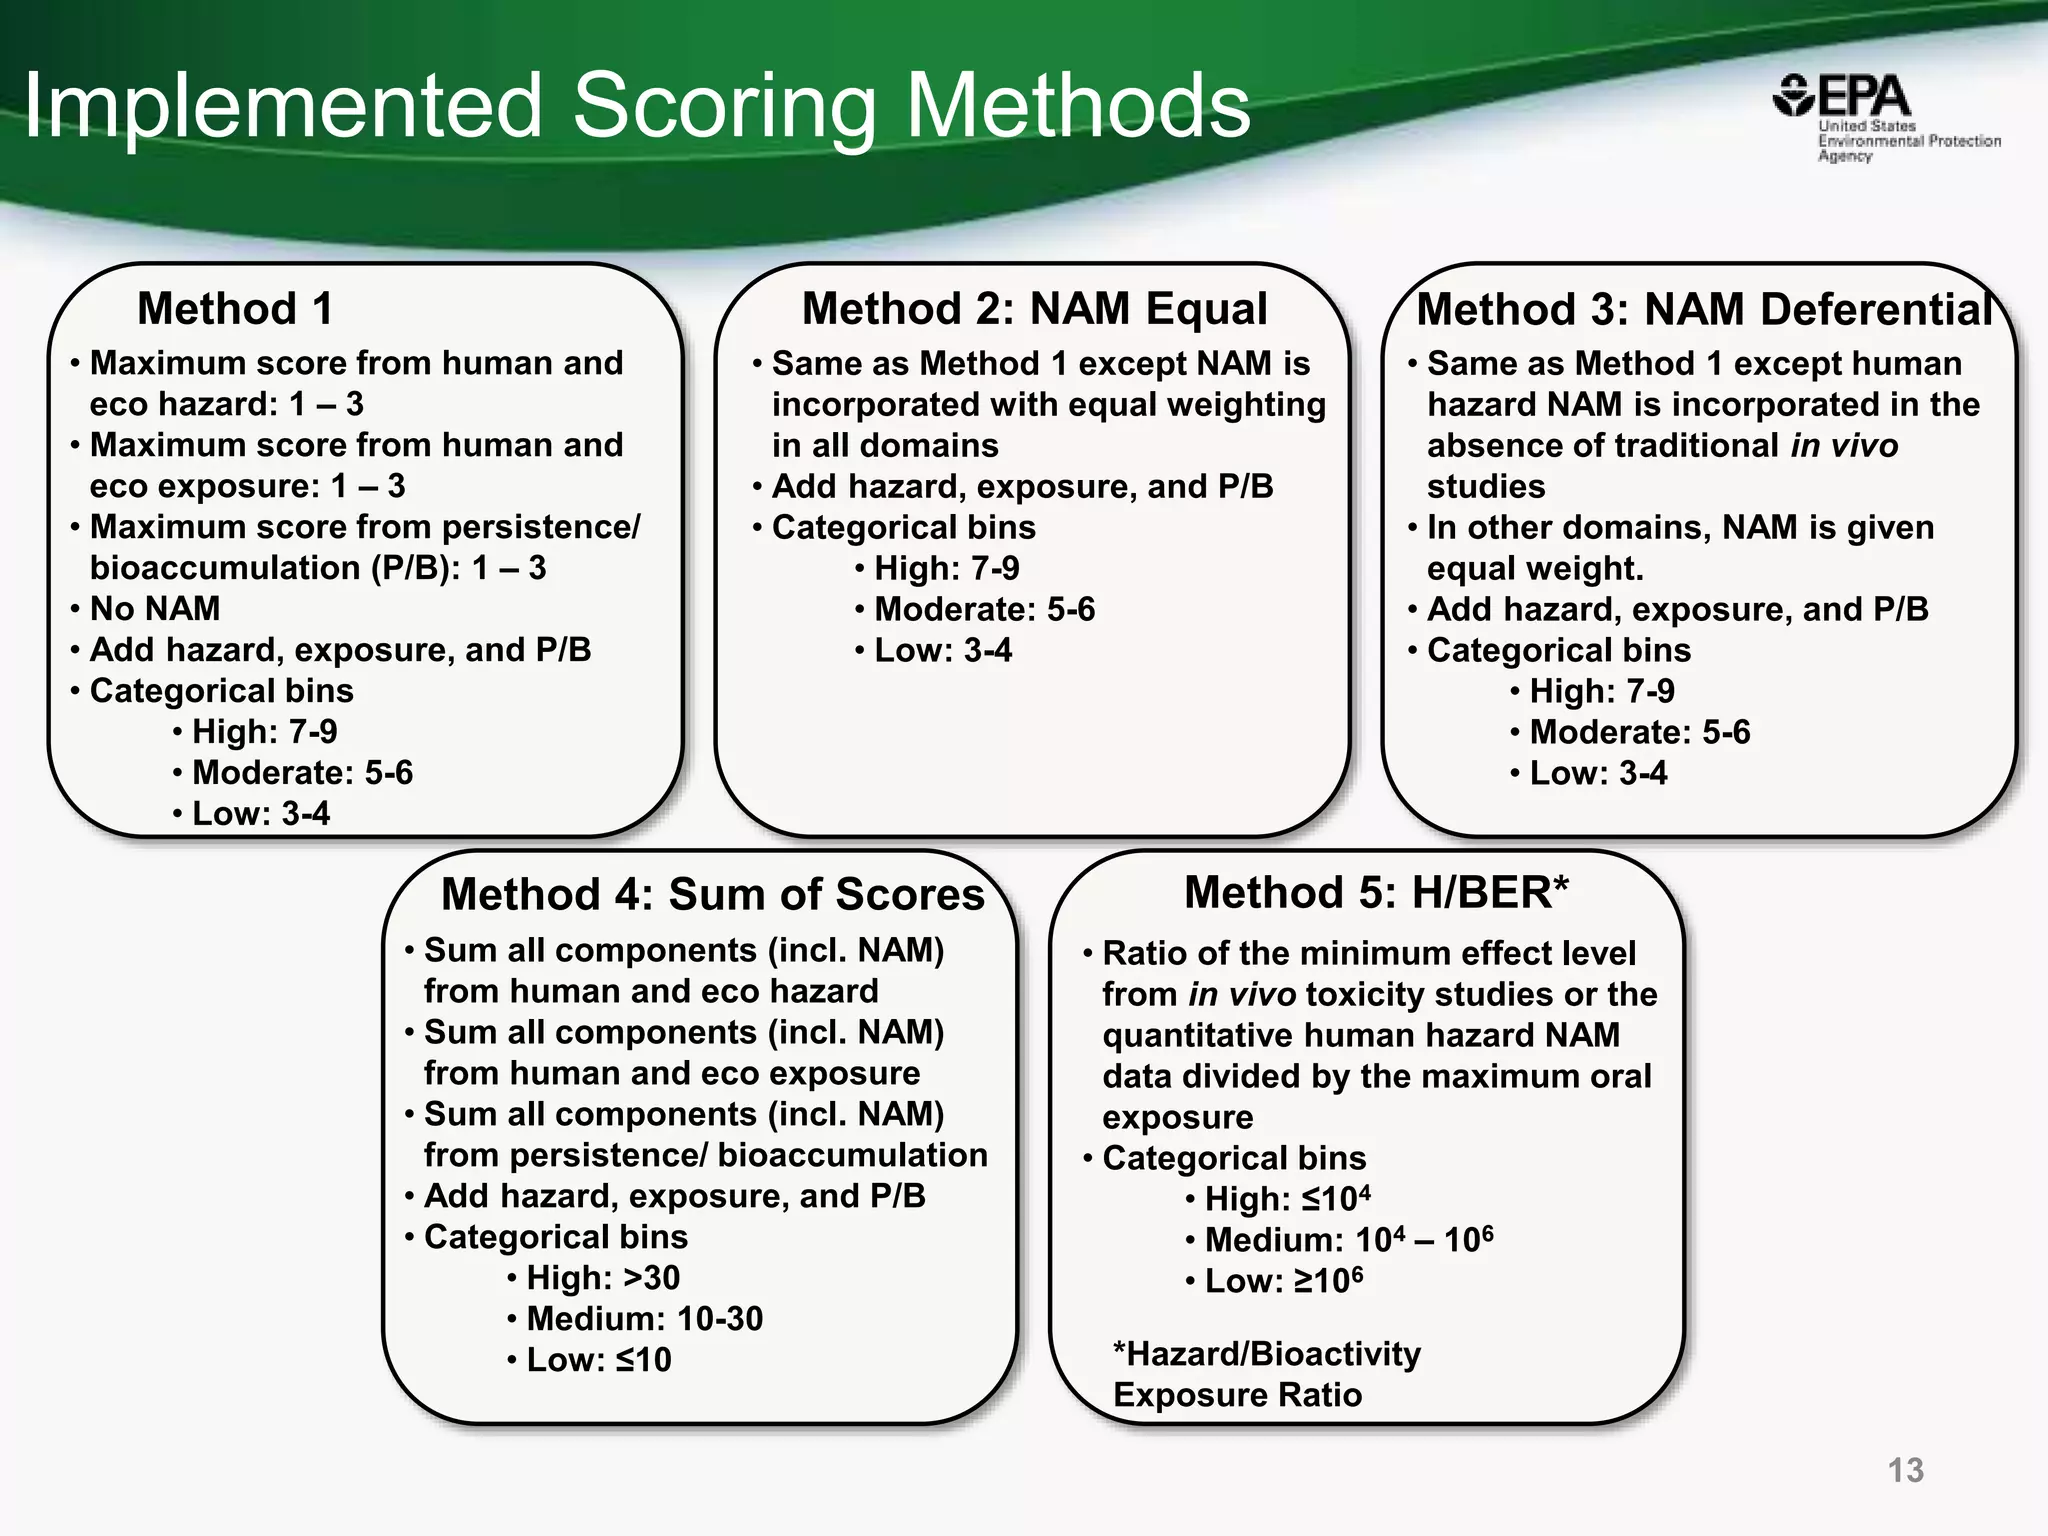
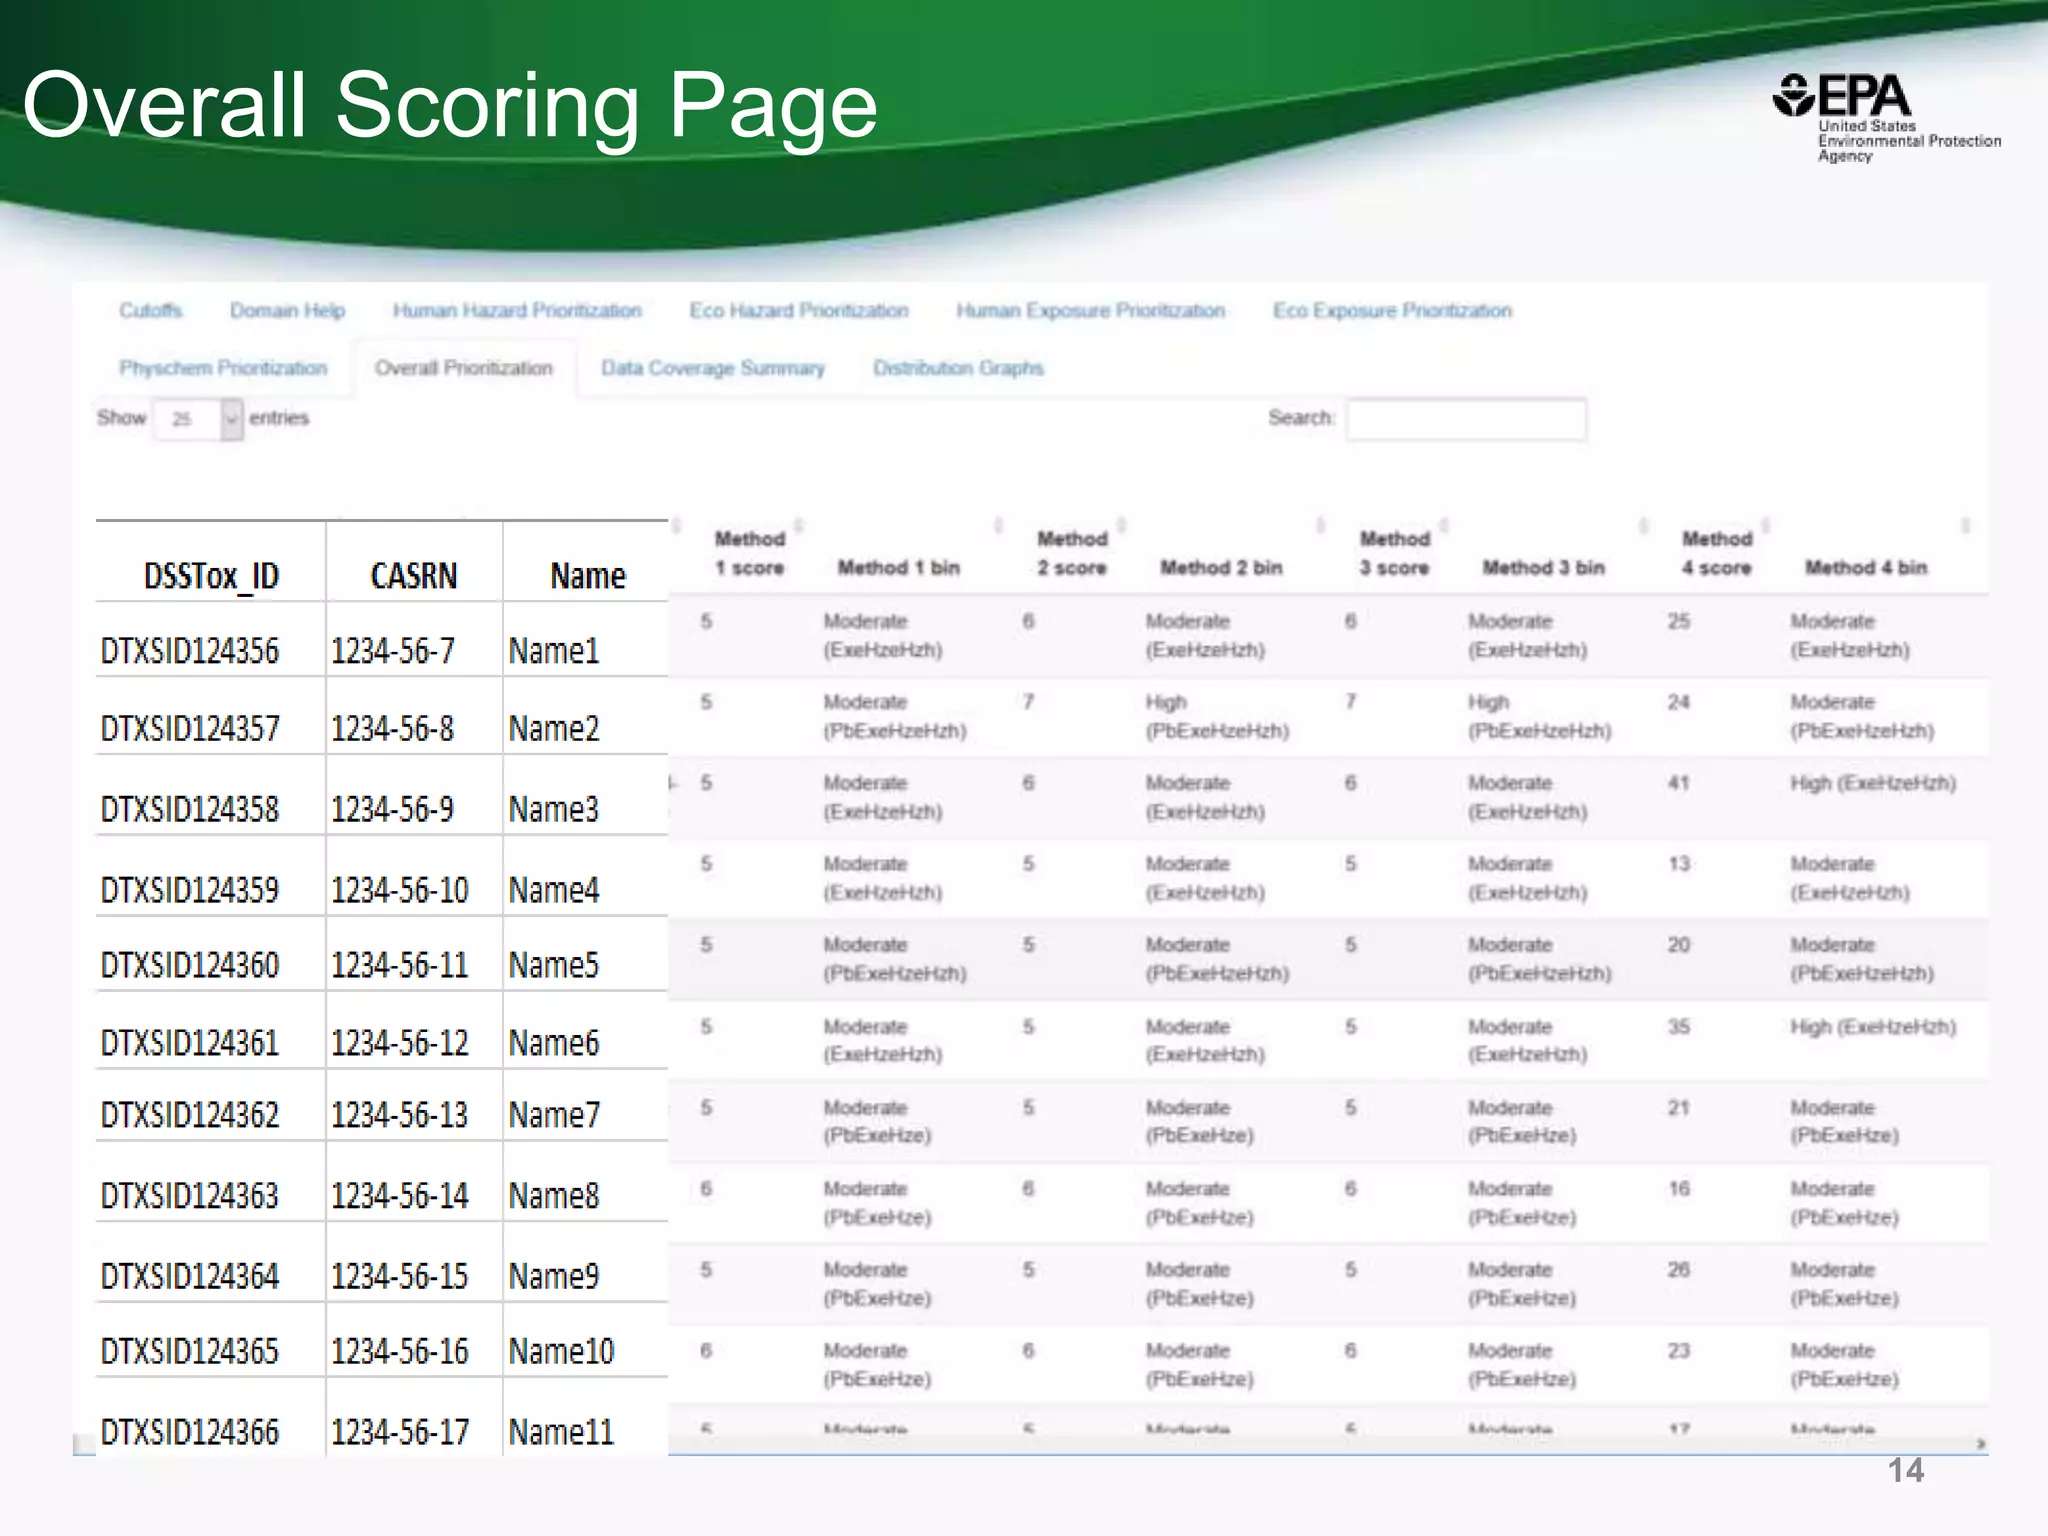
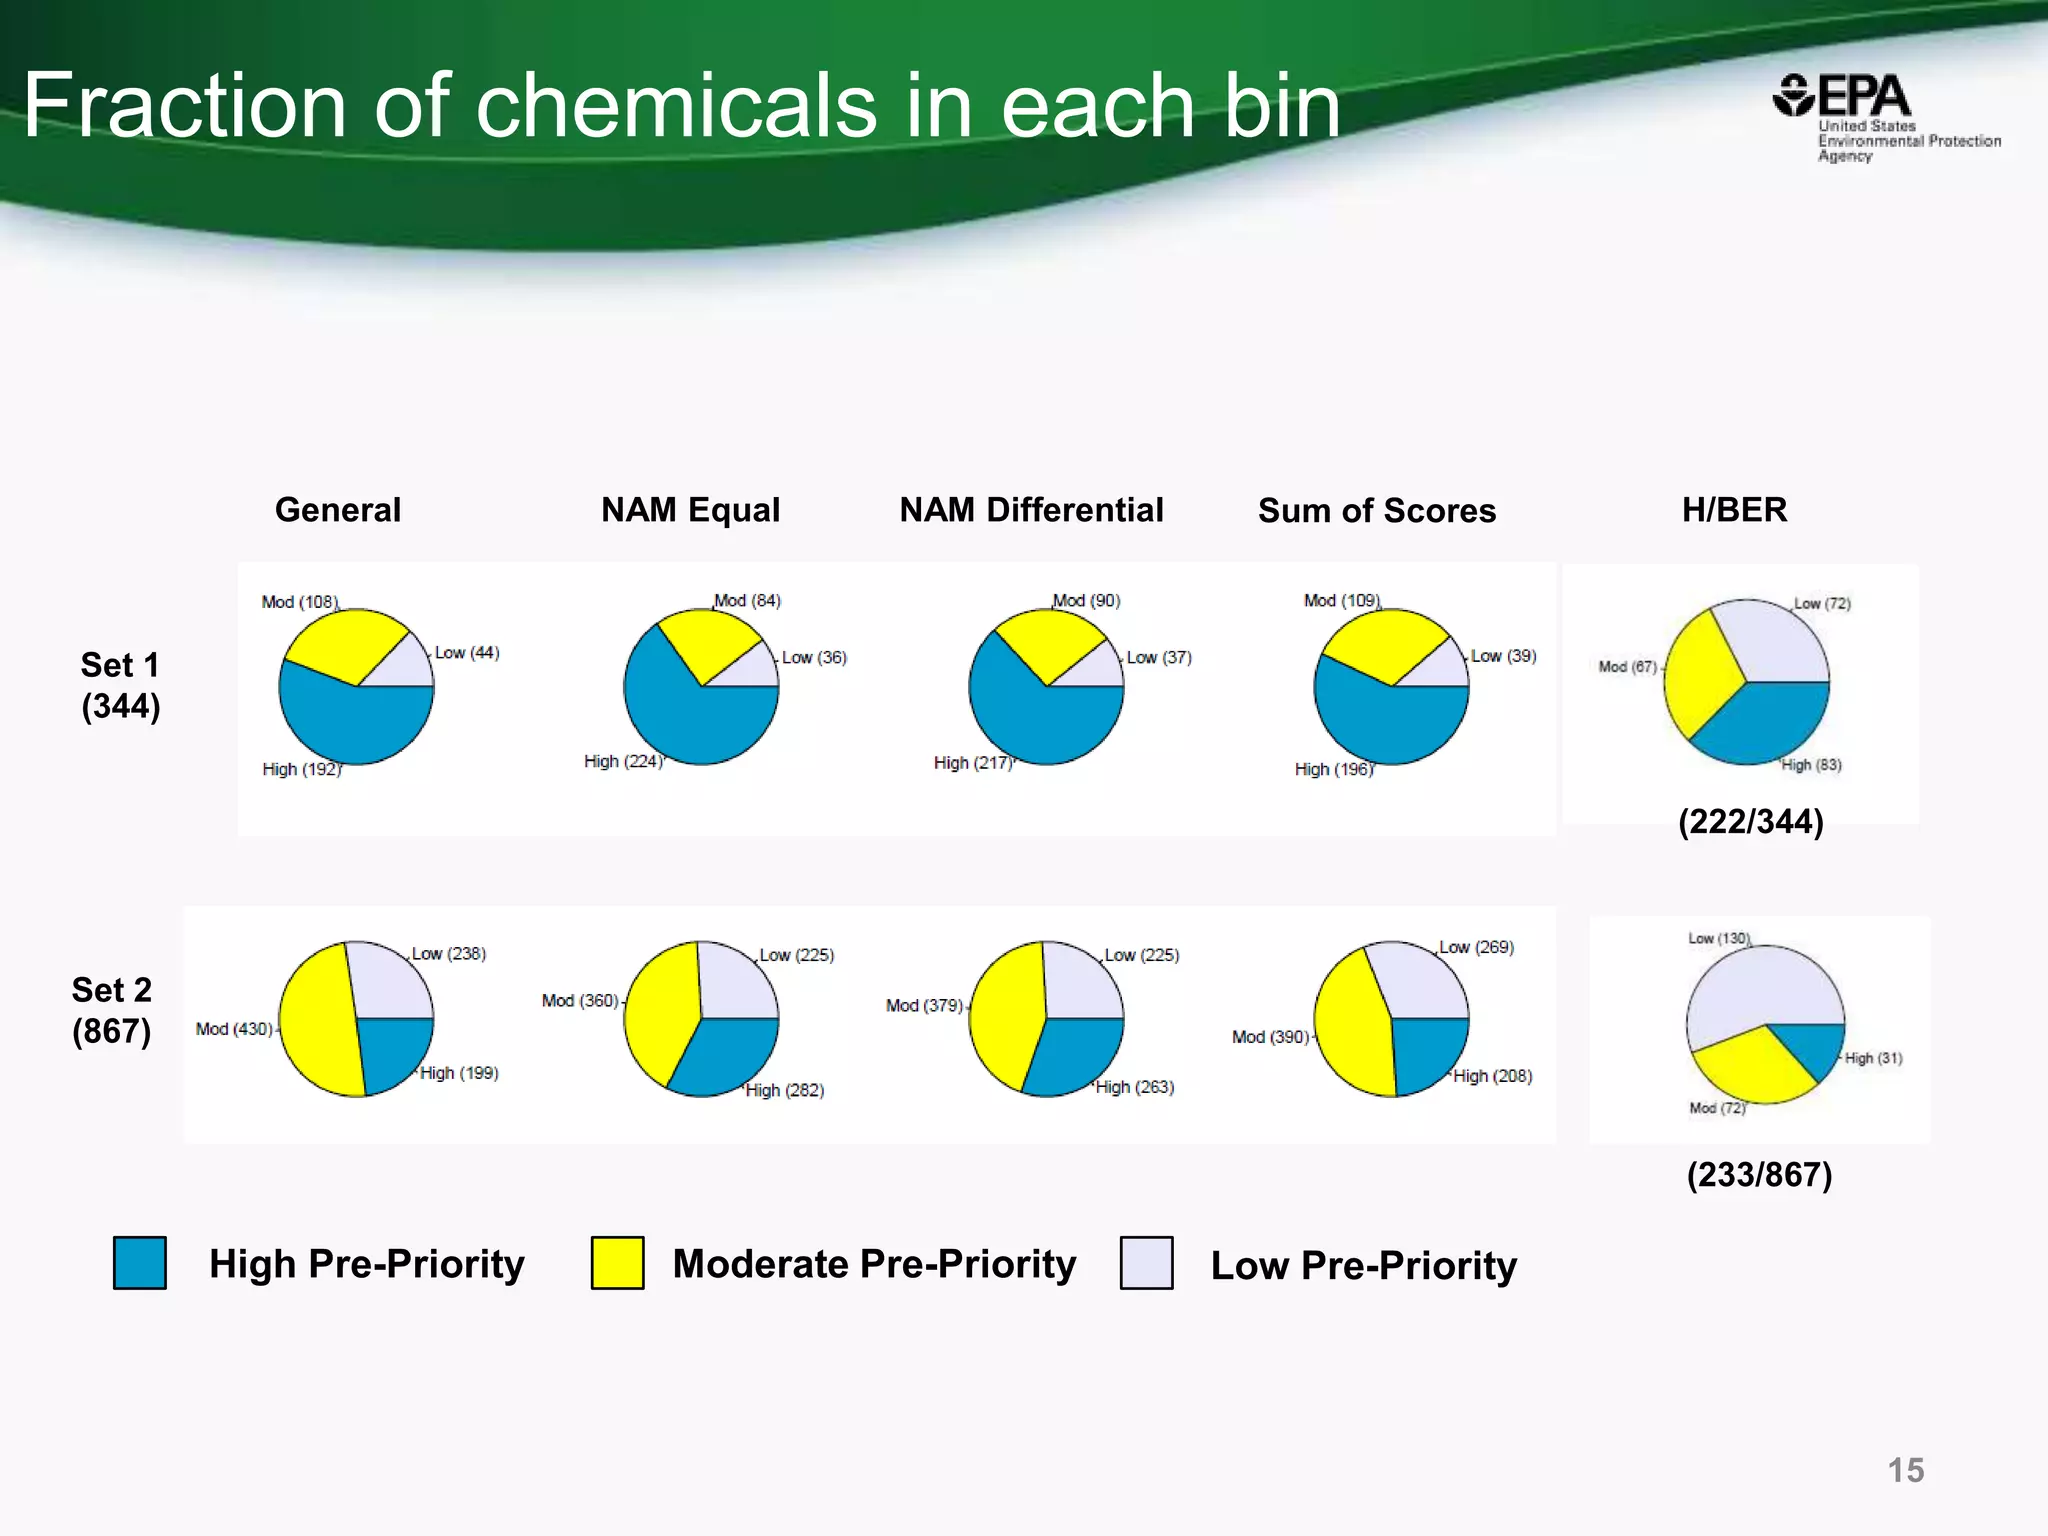
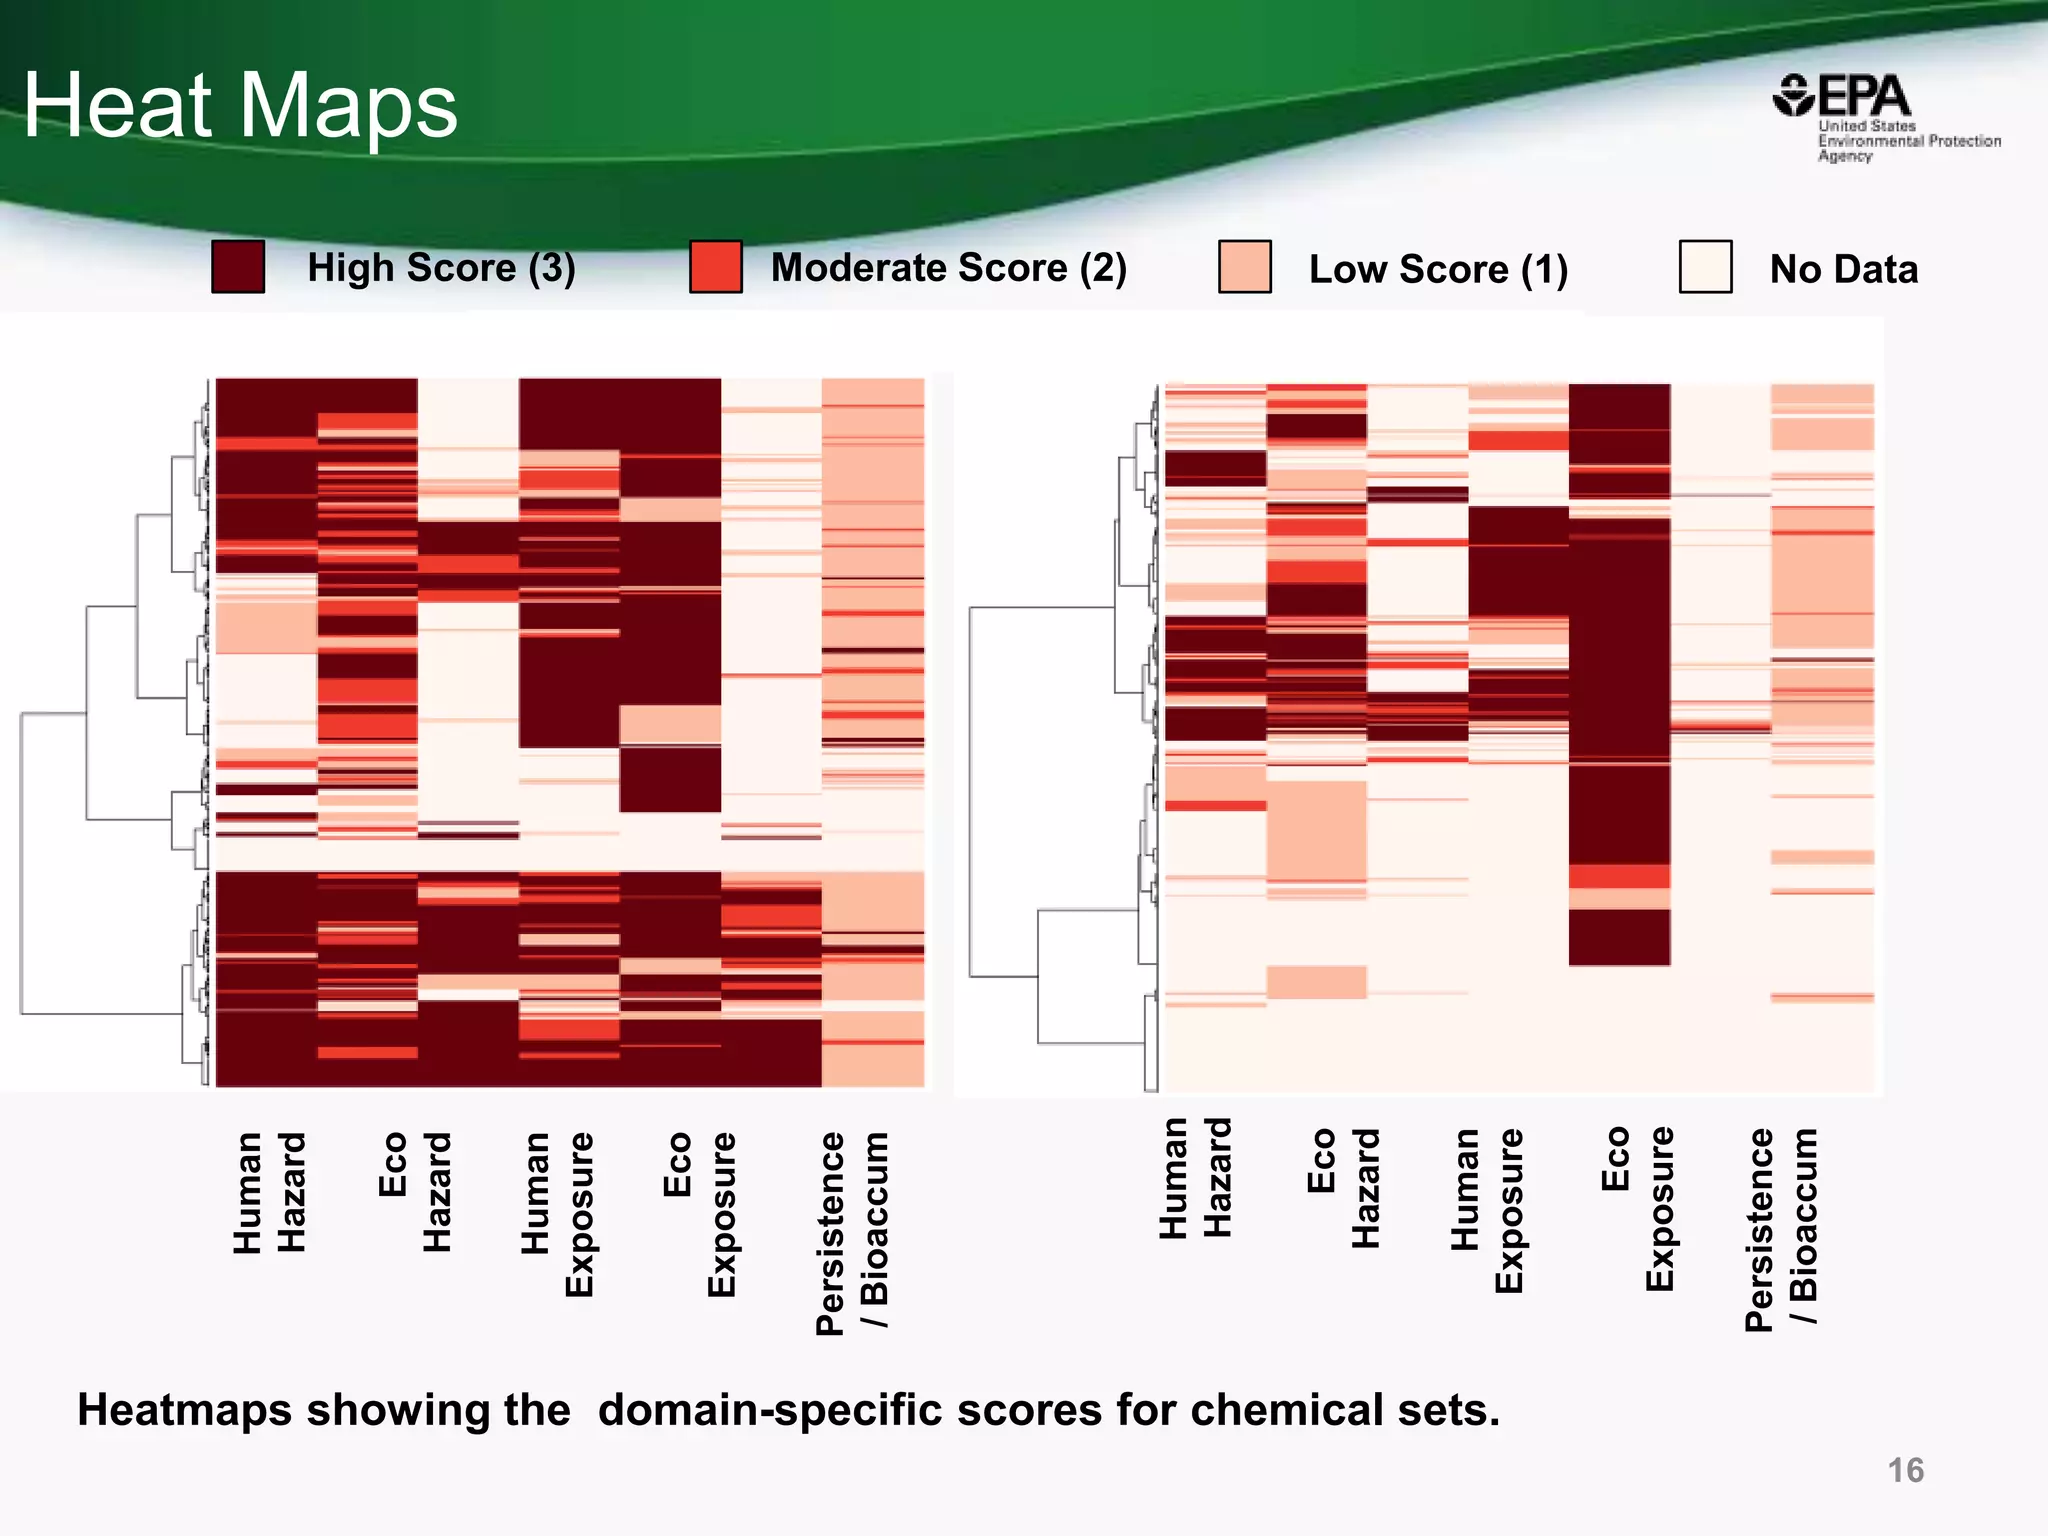
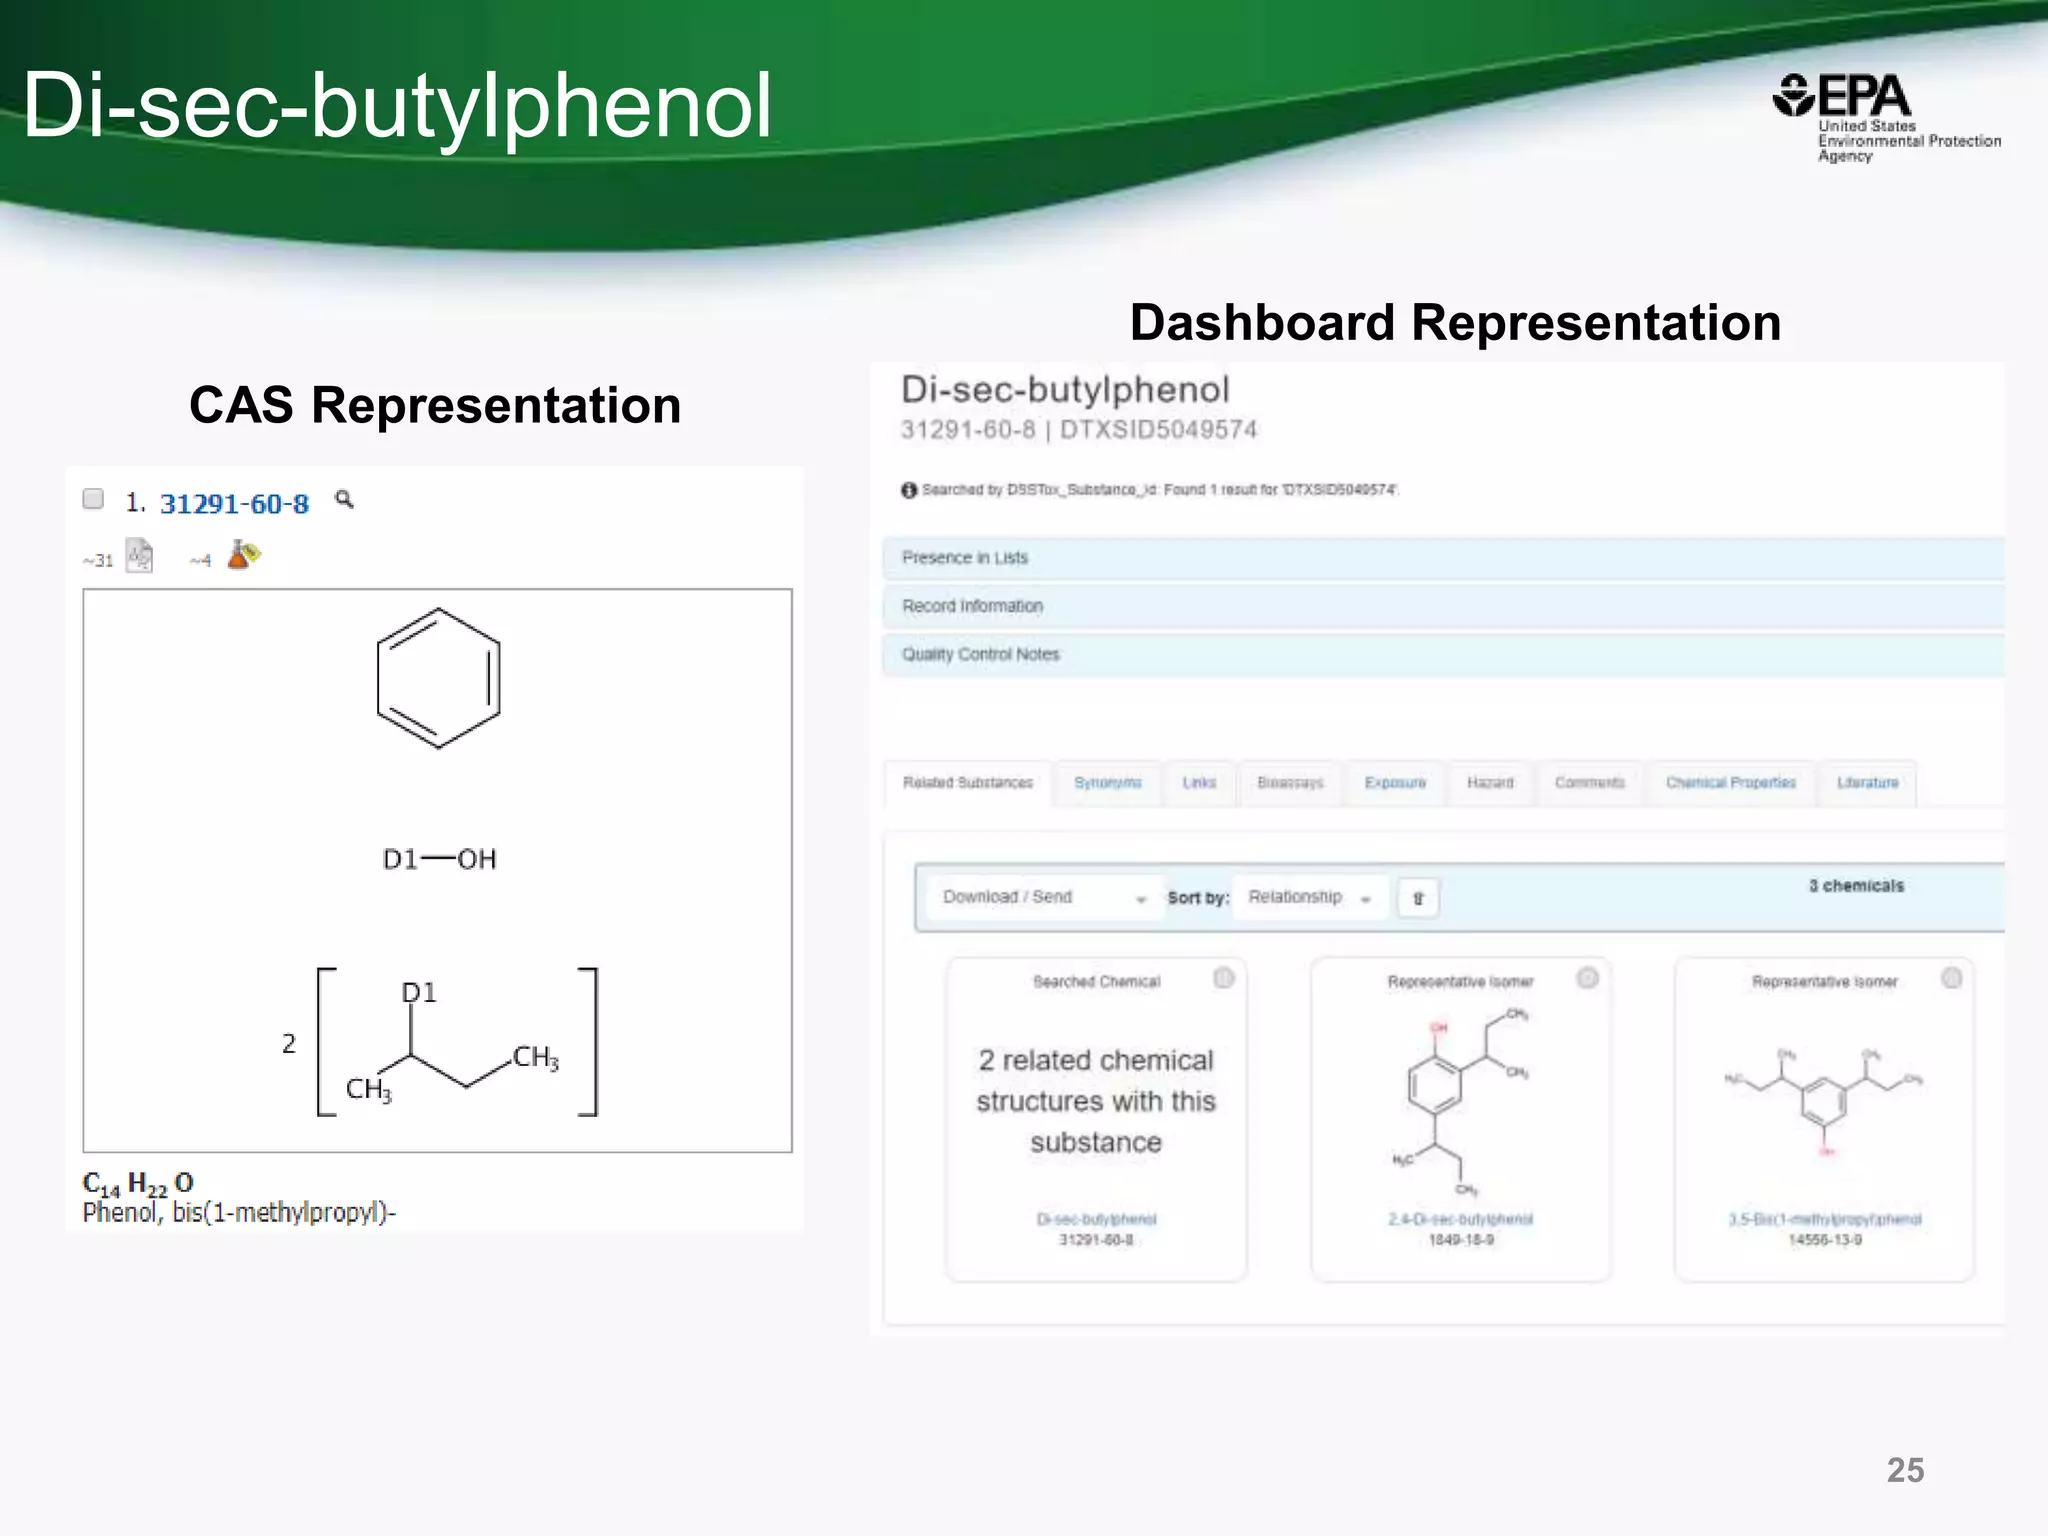
This document discusses the development of a web-based tool by the National Center for Computational Toxicology (NCCT) aimed at integrating traditional and novel methodologies for assessing chemical safety decisions. It outlines the functionalities of the Comptox Chemistry Dashboard, which provides access to a vast range of chemical data and scoring systems to evaluate hazards and exposures. The document emphasizes the importance of data integration and scoring in prioritizing chemicals for risk assessment.


