Download to read offline


![Case Study [1]
Z, Zhao et Al./Yahoo Inc
Online Experimentation Diagnosis and Troubleshooting Beyond AA Validation
DSAA 2016
● User ID is assigned Test ID
● Test ID labels whether user receives
treatment or control
● Traffic splitter consistently exposes users
the correct variant (treatment or control)
● Necessary to provide a consistent
experience in order to measure the long
term effect of the treatment
Intention:
● 4% User IDs lacked a valid Test ID
● Some users interacted with components
of both control AND treatment
● Treatment group experience was a mixture
of treatment and control
Observation:
● Likely underestimate the treatment effect
Consequences:](https://image.slidesharecdn.com/michaellindon-detectingincorrectlyimplementedexperimentsfinaldeck-200701231553/75/Detecting-incorrectly-implemented-experiments-5-2048.jpg)
![Case Study [2]
● Increasing number of carousel items
increases user engagement
Intention:
● User engagement negatively affected!?
● Users were engaged so long, accidentally
classified (algorithmically) as bots, and
removed from the analysis
Observation:
● Incorrect data processing logic, intended
to remove non human visitors from
analysis, removed human visitors from the
analysis
● Metric change caused by bug, not
treatment effect
Consequences:
A, Fabijan et Al./
Diagnosing Sample Ratio Mismatch in Online Controlled Experiments /
KDD 2019](https://image.slidesharecdn.com/michaellindon-detectingincorrectlyimplementedexperimentsfinaldeck-200701231553/75/Detecting-incorrectly-implemented-experiments-6-2048.jpg)
![Case Study [3]
● New protocol to delivering push
notifications
● Expected increase in reliability of message
delivery
Intention:
● Significant improvements in totally
unrelated call metrics
● Fraction of successfully connected calls
increased
● Treatment affected telemetry loss rate
Observation:
● Increase in metrics not caused by
treatment effect
● Caused by a side effect of treatment,
improving telemetry loss rate
● Biased telemetry
Consequences:
P, Dmitriev et Al./Analysis and Experimentation Team/Microsoft
A Dirty Dozen: Twelve Common Metric Interpretation Pitfalls in Online Controlled
Experiments](https://image.slidesharecdn.com/michaellindon-detectingincorrectlyimplementedexperimentsfinaldeck-200701231553/75/Detecting-incorrectly-implemented-experiments-7-2048.jpg)


![n_treatment = 821588
n_control = 815482
p = [0.5, 0.5]
Binomial Test:
p-value: 1.8 e-06
Outcome:
Entire Experiment Lost
Example 1: Using a Non Sequential Test](https://image.slidesharecdn.com/michaellindon-detectingincorrectlyimplementedexperimentsfinaldeck-200701231553/75/Detecting-incorrectly-implemented-experiments-15-2048.jpg)


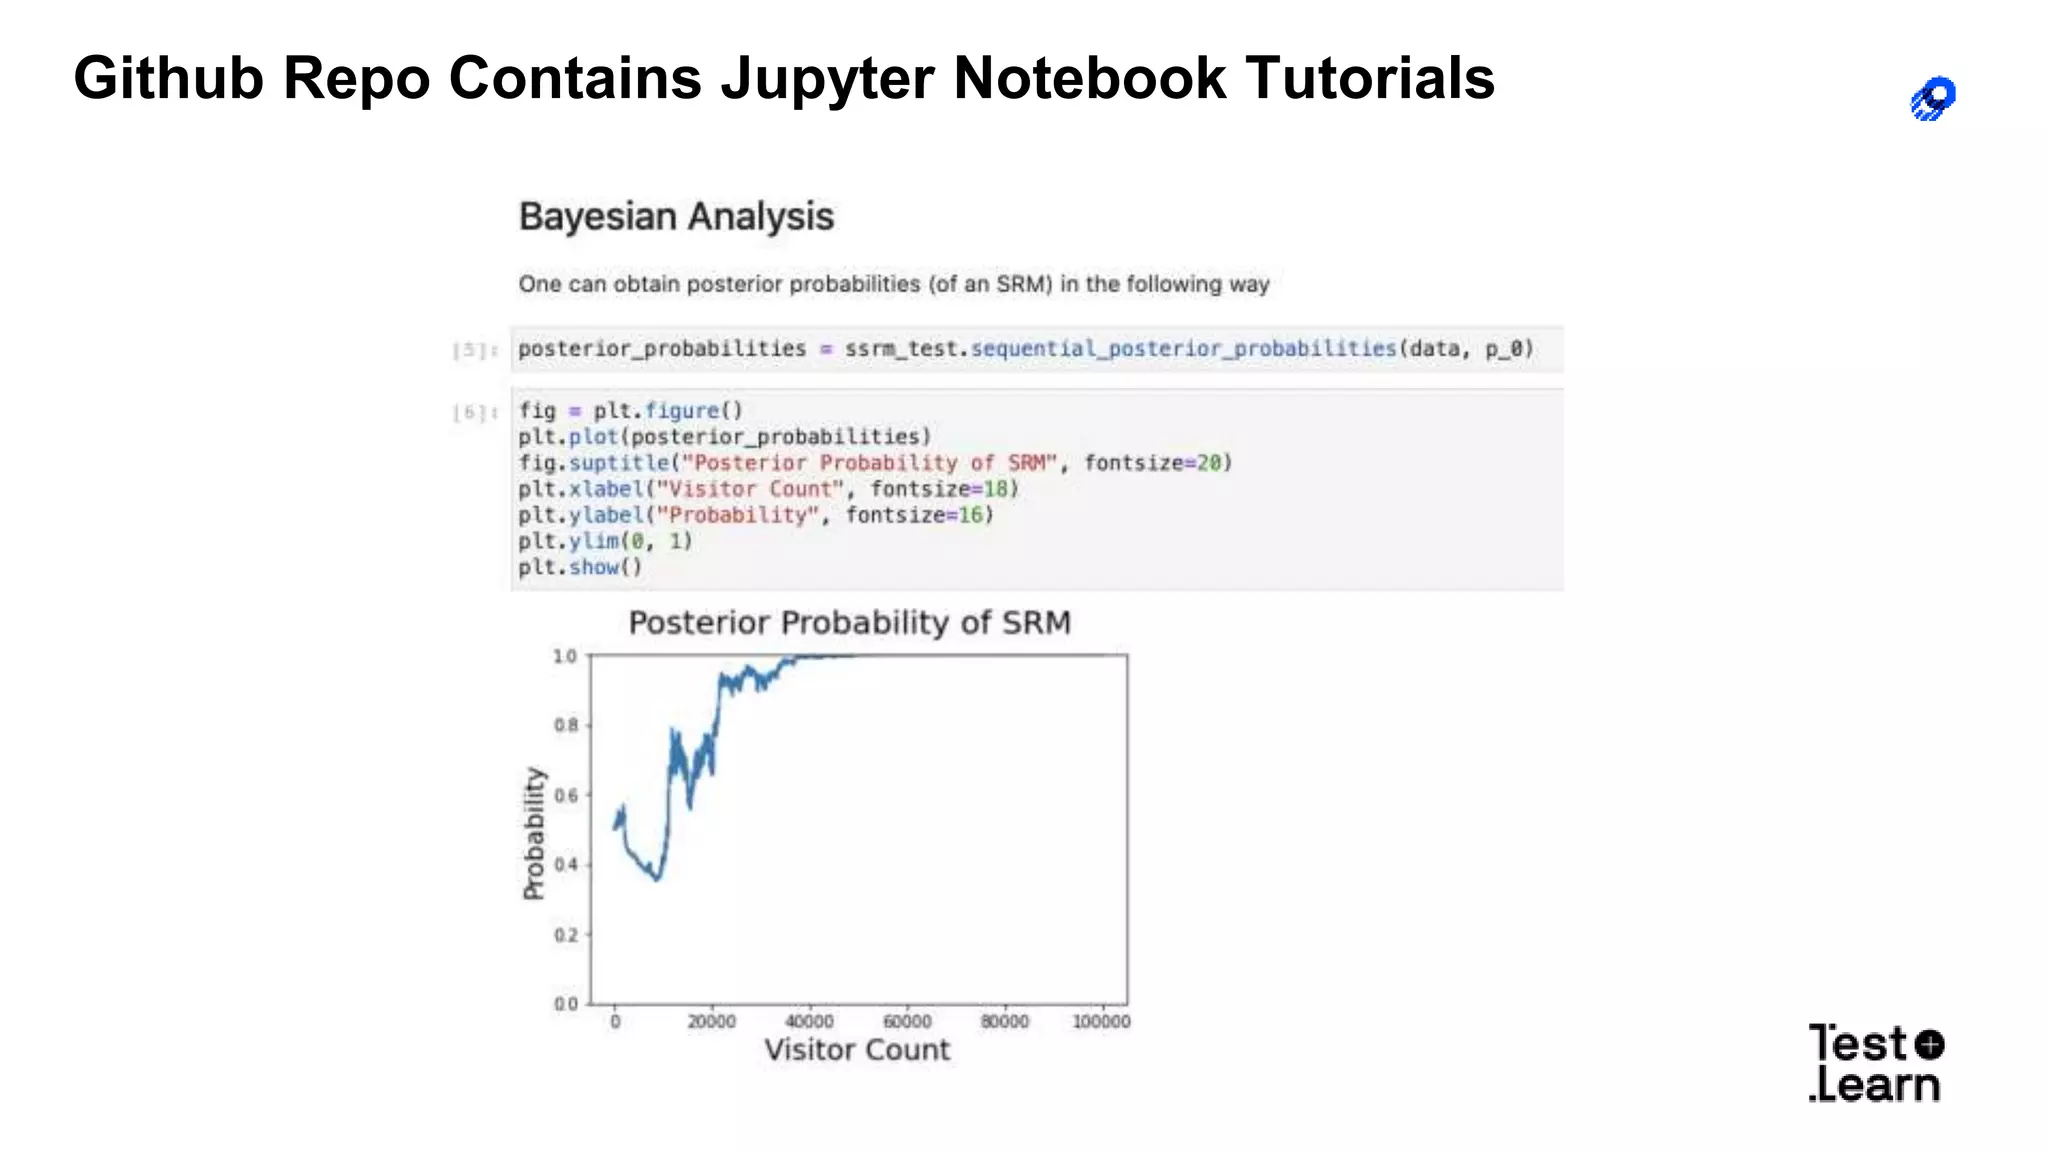


The document discusses challenges in online experimentation, particularly focusing on sample ratio mismatch (SRM) and its implications for metric interpretation. It highlights case studies where incorrect implementations led to significant errors in measuring treatment effects, such as misclassified user engagement and biased telemetry. The discussion includes methods for detecting SRMs and advantages of sequential testing over traditional methods to prevent faulty experiment outcomes.


![Vibe Coding vs. Spec-Driven Development [Free Meetup]](https://cdn.slidesharecdn.com/ss_thumbnails/vibecodingvsspecdrivendevelopment-251209105622-43f455e7-thumbnail.jpg?width=640&height=640&fit=bounds)


