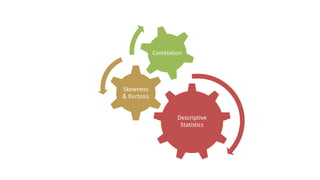
Descriptive Statistics: Skewness, Kurtosis & Correlation
•Download as PPT, PDF•
0 likes•23 views

This document discusses key concepts in descriptive statistics including measures of central tendency, spread, skewness, kurtosis, and correlation. It covers the stages of analytics from descriptive to predictive, the data life cycle process, data types, and calculating skewness and kurtosis coefficients. Correlation is defined as the analysis of co-variation between variables and the difference between correlation and causation is explained.

Recommended
More Related Content
Similar to Descriptive Statistics: Skewness, Kurtosis & Correlation
Similar to Descriptive Statistics: Skewness, Kurtosis & Correlation (20)
Recently uploaded
Recently uploaded (20)
Descriptive Statistics: Skewness, Kurtosis & Correlation
- 2. Agenda •Stages of Analytics •Data Life Cycle •Data Types •First Business Moment Decision (Measure of CentralTendency) •Second Business Moment Decision (Measure of Spread) •Third Business Moment Decision (Skewness) •Fourth Business Moment Decision(Kurtosis) •Correlation
- 4. 1. Descriptive Analytics 2. Diagnostic Analytics 3. Predictive analytics 4. Prescriptive Analytics Stages of Analytics
- 9. Balanced Vs Imbalanced Data
- 26. Skewness degree of asymmetry observed in a probability distribution that deviates from the symmetrical normal distribution (bell Curve)
- 27. 1. Positive skewed or right-skewed The extreme positive skewness is not desirable for distribution, as a high level of skewness can cause misleading results. For positively skewed distributions, the famous transformation is the log transformation. The log transformation proposes the calculations of the natural logarithm for each value in the dataset.
- 28. 2. Negative skewed or left-skewed a large number of data-pushed on the left- hand side Median is the middle value, and mode is the highest value, and due to unbalanced distribution median will be higher than the mean.
- 29. •If the skewness is between -0.5 & 0.5, the data are nearly symmetrical. •If the skewness is between -1 & -0.5 (negative skewed) or between 0.5 & 1(positive skewed), the data are slightly skewed. •If the skewness is lower than -1 (negative skewed) or greater than 1 (positive skewed), the data are extremely skewed. Calculate the skewness coefficient of the sample
- 30. Kurtosis Kurtosis refers to the degree of presence of outliers in the distribution. Kurtosis is a statistical measure, whether the data is heavy-tailed or light-tailed in a normal distribution
- 31. Types of Kurtosis 1.Leptokurtic (kurtosis > 3) 2.platykurtic (kurtosis < 3) 3.Mesokurtic (kurtosis = 3)
- 32. Correlation 1.“Correlation is an analysis of the co-variation between two or more variables”—(A.M Tuttle) 2. “Correlation analysis attempts to determine the degree of relationship between variables”—(Ya Lun Chou) 3. “Correlation analysis deals with the association between two or more variables”— (Simpson and Kafka)
- 33. Correlation and Causation Correlation: It is a numerical measure of the direction and magnitude of the mutual relationship between the variables(X and Y). Causation: X is the cause of change in Y i.e, the change of Y is the effect of change in X. NOTE: If X and Y are correlated then X and Y may or may not have a casual relationship. If X and Y have a causal relationship then X and Y must be correlated.
- 34. Reasons Behind Correlation 1. Mutual dependence Between the variables: Both the variables may be mutually influencing each other so that neither can be designated as the cause and the other the effect. When two variables(X and Y) affect each other mutually, we cannot say X is the cause or Y is the cause. For Example, The price of a commodity is affected by demand and supply. 2. Due to pure chance: In a small sample, X and Y are highly correlated but in the universe X and Y are not correlated. For Example, Correlation between income and weight of a person. This may be due to: – Sampling fluctuations – Bias of investigator in selecting the sample. Such a relation is called a non-sense or spurious relation. 3. Correlation due to any third common factor: Both the correlated variables may be influenced by one or other variables. – X and Y don’t have a direct correlation. For Example, It is between the production of tea and rice per hectare. Here they are not directly correlated instead the cause is the good rainfall well in time.
- 36. Key Takeaway After this session you learnt: 1. Stages of Analytics 2. Data Life Cycle 3. Data Types 4. First Business Moment Decision (Measure of CentralTendency) 5. Second Business Moment Decision (Measure of Spread) 6. Third Business Moment Decision (Skewness) 7. Fourth Business Moment Decision(Kurtosis) 8. Correlation