1. Black and White Thinking and Depression
Kelsey Annas
Primary Analysis Objectives
To determine if there is a relationship between higher levels of black and white thinking
and higher levels of self-reported depression in psychiatric patients hospitalized for
depression.
Secondary Analysis Objectives
To determine if the relationship (if any) between higher levels of black and white thinking
and higher levels of depression can be considered significant.
Background
It is common for people who tend to think of their reality as a series of black and white
events to suffer from depression. Psybersquare, Inc. describes a few examples of this way
of thinking by saying that those who suffer from this way of thinking think that, "If things
aren't 'perfect,' then they must be "horrible." If your child isn't "brilliant" then he must be
'stupid.' If you're not 'fascinating' then you must be 'boring.'" This can be a difficult way to
live since those suffering from this way of thinking may never feel that their reality is “good
enough”.
Data Sources
The data used for this study is from the Ginzberg data frame which is based on psychiatric
patients hospitalized for depression. Data is from the book Applied Regression Analysis
and Generalized Linear Models, Second Edition by Fox, J. (2008). The dataset includes three
variables - simplicity (black and white thinking), fatalism, and depression. The data also
includes these variables each adjusted by regression for other variables thought to
influence depression. For the purposes of this study, we will use the non-adjusted values.
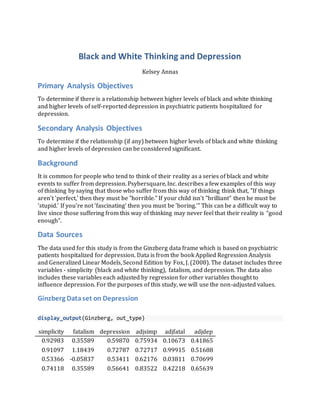
Ginzberg Dataset on Depression
display_output(Ginzberg, out_type)
simplicity fatalism depression adjsimp adjfatal adjdep
0.92983 0.35589 0.59870 0.75934 0.10673 0.41865
0.91097 1.18439 0.72787 0.72717 0.99915 0.51688
0.53366 -0.05837 0.53411 0.62176 0.03811 0.70699
0.74118 0.35589 0.56641 0.83522 0.42218 0.65639
4. 2.26926 1.59865 1.85813 2.09935 1.22550 1.52969
1.04302 1.80577 1.47061 0.72117 1.50039 1.14913
1.79763 2.22003 1.40603 1.59752 2.05016 1.16443
2.11834 0.77014 2.01960 2.39515 0.88910 2.24452
1.42033 1.18439 1.47061 1.31493 1.04058 1.37153
0.98643 1.18439 1.56749 0.97903 1.23973 1.65687
Analysis Methods
Assumptions
• All inferences are conducted using 𝛼 = 0.05 unless stated otherwise.
• What is Referred to as "Black and White Thinking" in this report is represented by the
variable "simplicity" in the coding.
• Both datasets are considered non-normal distributions according to the below tests:
##checking for normality of depression
qqnorm(depression)
qqline(depression)
##checking for normality of simplicity
qqnorm(simplicity)
qqline(simplicity)
5. Visually, it is clear that the data does not quite follow a straight line, which indicates a lack
of normality in the data. However, because it can be difficult to be certain by simply
eyeballing the graph, we perform the Shapiro Wilks test. This test gives a clearer indication
as to whether or not the data is normal.
shapiro.test(depression)
##
## Shapiro-Wilk normality test
##
## data: depression
## W = 0.8798, p-value = 1.471e-06
shapiro.test(simplicity)
##
## Shapiro-Wilk normality test
##
## data: simplicity
## W = 0.90644, p-value = 1.854e-05
Because the p-values generated from these tests are less than 0.05, the distributions fail the
normality test. Therefore, we cannot conclude that the datasets are anything but abnormal.
Because of the abnormality of the data, the following test was selected for the analysis:
• Spearman Correlation
6. Primary Objective Analysis andResults
The Spearman Correlation test will be conducted to determine if a relationship exists
between black and white thinking and depression.
cor(simplicity,depression)
## [1] 0.6432668
The correlation coefficient above indicates that the relationship between black and white
thinking and depression can be considered moderate and positive. This means that we can
see a clear relationship between black and white thinking and Depression, although the
relationship is not perfect. The fact that the correlation coefficient is positive, indicates that
higher levels of black and white thinking is associated with higher levels of depression.
We can also see this relationship demonstrated through the graphic below:
qplot(data=Ginzberg,simplicity,depression, geom=c("point","smooth"))
As you can see from the above graphic, although the data does not form a perfectly straight
line, it does fall in a way that indicates a positive relationship. Therefore, we can once again
conclude that there is a relationship between black and white thinking and depression.
It is important to note, however, that correlation does not in any way indicate causality and
is merely indicative of a relationship between the two.
7. Secondary Objective Analysis andResults
Now that we know there is at least a moderate relationship between black and white
thinking and depression, we can test to see if this correlation is statistically significant.
cor.test(simplicity,depression)
##
## Pearson's product-moment correlation
##
## data: simplicity and depression
## t = 7.5147, df = 80, p-value = 7.17e-11
## alternative hypothesis: true correlation is not equal to 0
## 95 percent confidence interval:
## 0.4954166 0.7548954
## sample estimates:
## cor
## 0.6432668
The results of this test show a p-value of less than 0.05. This indicates that we have
sufficient evidence to conclude that the results from this study are statistically significant.
Conclusions and Discussion
The results of the study conclude that there is in fact a relationship between higher levels
of black and white thinking and higher levels of depression in individuals hospitalized for
depression. However, because correlations cannot determine causation, further study is
necessary to determine if any conclusions can be drawn, such as whether or not black and
white thinking is considered a cause of depression. In addition, it is important to note that
this study was conducted using clinical depression patients and is therefore a
representation of a population of sufferers of clinical depression only. In other words, we
cannot generalize the results of this study to the general population. We only know that
there is a correlation between higher levels of black and white thinking and higher levels of
depression in individuals hospitalized for depression.
For further study, it would be interesting to see if a similar relationship exists between
black and white thinking and depression in the general population. It would also be
beneficial to study the degree of black and white thinking in individuals that show no or
very low levels of depression.
All of the statistical analyses in this document will be performed using R version 3.3.0
(2016-05-03). R packages used will be maintained using the packrat dependency
management system.
sessionInfo()
## R version 3.3.0 (2016-05-03)
## Platform: x86_64-w64-mingw32/x64 (64-bit)
## Running under: Windows 7 x64 (build 7601) Service Pack 1
##