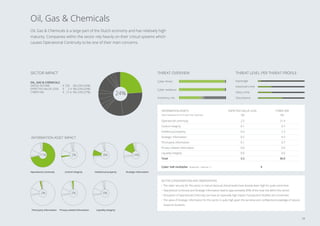
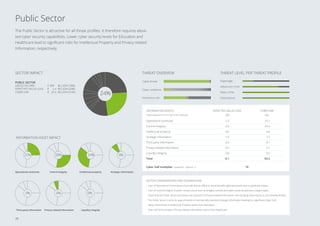
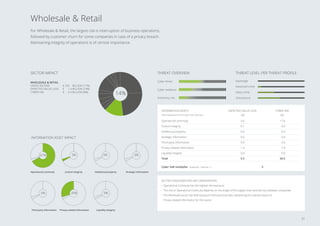
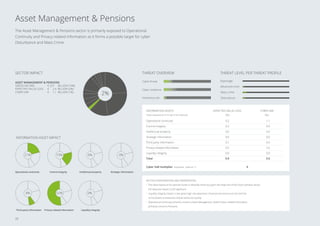
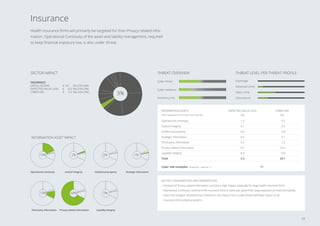
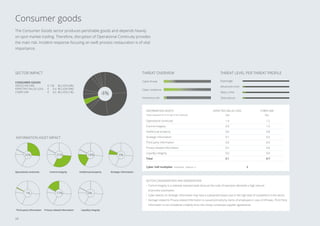
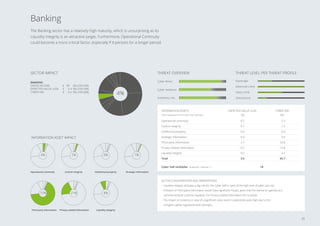
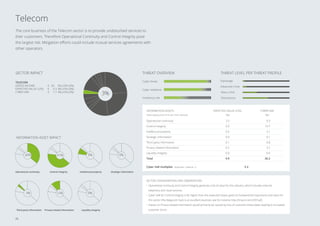
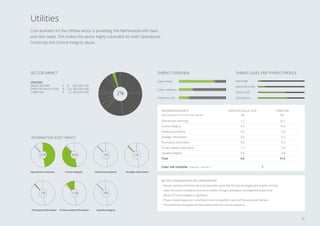
1. Cybercrime costs the Dutch economy around €10 billion annually, or 1.5% of GDP, through value lost.
2. The report estimates potential "worst case" losses from cyber risks, known as Cyber Value at Risk (VaR), and finds it is typically 8 times higher than expected losses for large Dutch organizations.
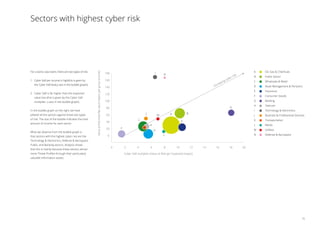
3. The sectors facing the highest cyber risks are identified as Technology & Electronics, Defense & Aerospace, Public, and Banking. Technology & Electronics and Defense & Aerospace face the highest Cyber VaR at around 17% of income.


![The Dutch state of cyber security
On average, the cyber security of organizations
in The Netherlands is relatively mature when
compared to countries with a similar threat
profile5
. Security is encoded in various laws and
regulations such as the “Wet Computercrimina-
liteit” and the “Wet Bescherming Persoonsgege-
vens”. Dutch policies are contained in the Natio-
nal Cyber Security Strategy as well as a Defense
Cyber Strategy, which are both implemented by
the National Cyber Security Center (NCSC). The
Netherlands has many international partner-
ships with European and global organizations.
It is hard to accurately determine the cyber
security of Dutch organizations based on public
data. Standardized metrics for performance
are lacking and not reported on, however,
useful metrics can be found through extensive
literature analysis. The annual Cyber Security
Assessment Netherlands (CSAN) by the NCSC
also provides useful figures. From our literature
study of over 250 scientific and professional
publications, we have inferred the maturity for
each sector, which we have validated with our
Deloitte sector experts as well as with our team
of around 180 security experts with hands-on
experience.
From this analysis, a couple of observations
stand out. First of all, cyber security maturity
levels tend to be higher for larger and heavily
regulated organizations. This effect is further
amplified when the organization in question is
multinational. Another important factor is expe-
rience with cyber threats. As a result we observe
that the Banking sector, the Oil, Gas Chemi-
cals sector, key components of Central Govern-
ment as well as the Defense Aerospace sector
are relatively mature. On the other hand, most
Small or Medium Enterprises (SMEs) as well as
organizations in the Education, Healthcare and
Utilities sectors have lower than average matu-
rity levels.
Organizations may influence each other in their
cyber maturity. For instance, all organizations
benefit from the relatively mature state of cyber
security of payments, leading to better Liquidity
Integrity for all organizations. This explains the
relatively low impact on Liquidity Integrity for all
organizations, despite high threat levels.
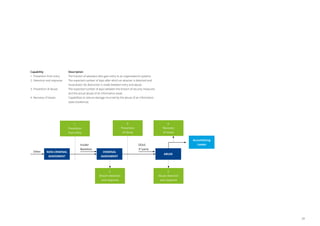
We distinguish four main layers of cyber security
controls: (I) prevention from entry (vulnerability
management, firewalls, etc.), (II) detection and
response (security monitoring and analytics,
incident response, etc.), (III) prevention of abuse
(e.g. encryption, data loss prevention, identity
and access management), and finally, (IV) reco-
very of losses (business continuity management,
crisis management, communications, legal, etc.).
Maturity in all four layers is required to obtain
optimal security. With the help of our quantifica-
tion methodology, optimizing cyber security for
individual organizations is also in reach.
The maturity level of cyber capabilities for an
organization is of key importance to seize the
opportunities of cyberspace while limiting the
impact of potential cyber incidents. Organizati-
ons with a higher level maturity take risks with
more confidence and are better able to innova-
te, or win and retain the trust of their custo-
mers. The efforts required for realizing a certain
maturity level do not exactly scale with the size
of the organization.
The cyber threat landscape
Overall, threat levels are apparent from cyber
threat intelligence reports. Furthermore, we
distinguish between threat profiles only to the
extent that they are attracted to other informati-
on assets or utilize different tactics.
Based on threat intelligence reports as well
as our own research, we make a distinction
between fast and slow attackers. The rationale
behind this is that sophisticated attackers often
make use of highly specialized methods combin-
ed with an incentive to go undetected for as long
as possible, while slowly accumulating abuse.
Less sophisticated attackers on the other hand
take advantage of known exploits and have
an incentive to act as fast as possible to take
advantage of the delay in the defender’s reac-
tion. These attackers are by nature also more
opportunistic, moving on to the next target with
the same method until they find a vulnerable
defender.
Another important characteristic that sets
threat profiles apart is the type of information
assets that are targeted. Some attackers focus
on strategically important information assets,
while others aim at disruption of Operational
Continuity. Based on these insights, we defined
four threat profiles displayed in the table on the
next page.
5 Dutch Global Cybersecurity Index score 0.6765, ranked
6th according to ITU [54] and endorsed by the World
Economic Forum [8]. Also see: www2.deloitte.com/nl/
nl/pages/risk/articles/eu-voorzitter-loopt-op-dun-ijs-als-
cyber-security-gidsland.html.
10](https://image.slidesharecdn.com/34c03d5b-5c53-4149-8730-c1790cd1fc2a-160428152121/85/deloitte-nl-risk-cyber-value-at-Risk-in-the-Netherlands-10-320.jpg)


![This analysis of Cyber VaR for the Dutch economy
is based on the Cyber VaR concept that Deloitte
developed in collaboration with the World
Economic Forum. This chapter introduces the
model components, their workings and interre-
lations as well as the underlying assumptions.
Justification
To ensure quality and facilitate reproducibility,
the model builds on previous studies in the
field of cyber risk quantification and public data
as much as possible. The model uses a set of
logical relations to translate available data into
model parameters. The scarcity of suitable cyber
incident data is well known. Heuristic estimation
methods are used where needed to determi-
ne parameters when data or reports were not
available and have been demonstrated to be
surprisingly reliable [51].
The model draws from Deloitte’s insights from
handling cyber incidents for our clients as well
as experience gained in Deloitte’s Cyber Intelli-
gence Center. Furthermore, this report builds
on the expertise of Deloitte professionals in
areas ranging from cyber security, accounting to
legal and HR. We have also extensively involved
security experts at our clients, academia and
government to validate our assumptions and
methodology.
Dealing with uncertainty and Value at Risk
When dealing with risk, the expected impact
does not tell the full story. When a significant
event happens, the severity of the event for
the organization is a major factor in actual risk
assessments and decision making. The Cyber
VaR concept deals with exactly this combination
of expected, or average, impact and severity
in the ‘worst case’. More exactly, Cyber VaR
determines the impact that will annually not be
exceeded with a likelihood of about 95%. This
implies that once in 20 years, the Cyber VaR may
be exceeded with an unknown amount.
Inspired by its successful application in financial
risk management, we use the same approach of
(i) identifying the level of uncertainty around the
expected risk and (ii) the resulting impact this
uncertainty and ‘worst case’ impact have on an
organization’s value.
Due to imperfect data, this model is based on
estimates and assumptions. In the Cyber VaR
model these uncertainties are included by con-
sidering them as a contributor to risk in itself.
The meaning of this is simple: not knowing your
risk is a risk in and of itself.
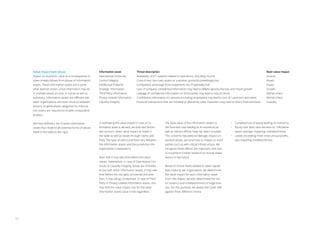
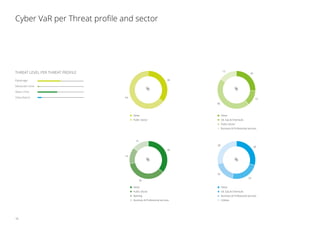
THREAT PROFILES
1. Espionage
2. Advanced Crime
3. Mass Crime
4. Disturbance
CYBER SECURITY
1. Prevention from entry
2. Detection and response
3. Prevention of abuse
4. Recovery of losses
INFORMATION ASSETS
1. Operational Continuity
2. Control Integrity
3. Intellectual Property
4. Strategic Information
5. Third Party Information
6. Privacy-related Information
7. Liquidity Integrity
Methodology and approach
“There was a statistician that
drowned crossing a river...
It was 3 feet deep on average.”
– A random statistician joke
35](https://image.slidesharecdn.com/34c03d5b-5c53-4149-8730-c1790cd1fc2a-160428152121/85/deloitte-nl-risk-cyber-value-at-Risk-in-the-Netherlands-35-320.jpg)
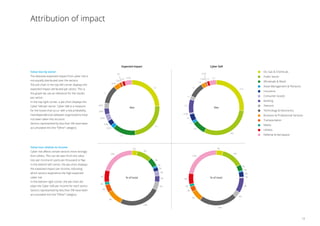
![Threat profiles
Each threat profile has its own level of maturity
in operating (i.e. sophistication level) that deter-
mines an organizations effective level of defense
against that threat profile. Based on the obser-
ved and recently modelled divide between slow
and fast attacks [56], we assign either a high or
a low sophistication level to the threat profiles.
Espionage and Advanced Crime demand a slow
approach to remain undetected and thus need
a high level of sophistication. In contrast, attac-
kers within the Mass Crime and Disturbance
profiles generally have a low sophistication and
act fast to optimize their gain. Although typical
attacks can differ slightly from these assumpti-
ons, in general attacks can be attributed to one
of these profiles.
Given the sophistication level of an attacker and
its corresponding abuse rate (slow or fast), the
total threat activity per type of information asset
is calculated. The threat activity is then distri-
buted according to the relative value impact for
each information asset type. Simply put, this
value impact determines how many attacks of
a certain threat profile are carried out on the
seven information assets.
The value impact for each information asset is
determined per organization, based on business
considerations such as the average income per
sector, as well as taking into account historic
cases of claims and fines in case of abuse.
We make an exception for the Espionage threat
profile. Since this type of attacker is interested
in information assets that are of strategic value
to them, the attractivity of these assets may far
exceed the actual value an information asset
has to the targeted organization.
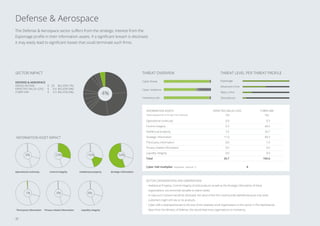
For instance, Strategic Information, Intellectual
Property and Control Integrity within the De-
fense Aerospace sector are highly attractive
to attackers that fit into the Espionage threat
profile.
Information assets
In order to determine the value impact an infor-
mation asset has on an organization in case of
abuse, a single question needs to be answered:
what would the financial impact be in the event
that the information asset would be exploited in
its entirety?
For this purpose, we distinguish two factors: va-
lue impact in the form of reduced profits (either
directly or in the future due to loss of sales) and
costs due to claims by third parties, individu-
als and fines imposed by domestic or foreign
regulators.
With the recent developments in privacy regula-
tions and export controls these claims and fines
can be substantial.
The direct value impact calculation differs per
information asset, but generally consists of com-
ponents based on yearly income, equity value
and/or cash liquidity. We consider these factors
in different quantities per organization depen-
ding on the sector or by using publicly available
information on an organization.
Cyber defense capabilities
Based on historic events and sector specifics,
the capabilities of an organization to prevent
abuse of information assets by a certain threat
profile is different. These defensive capabilities
are divided into four cyber defense capabilities
related to the attack-defense process: “pre-
vention from entry”, “detection and response”,
“prevention of abuse” and “recovery of losses”.
37](https://image.slidesharecdn.com/34c03d5b-5c53-4149-8730-c1790cd1fc2a-160428152121/85/deloitte-nl-risk-cyber-value-at-Risk-in-the-Netherlands-37-320.jpg)