


![Link to the objective
The Unique Selling Point
What you (or your unit) does
Couple of sentences only
Validation [optional]
A significant achievement
An impressive endorsement
Call for action
I know you will want to sign up
Clear explicit](https://image.slidesharecdn.com/betterpresentations-121101050642-phpapp01/85/Delivering-better-presentations-14-320.jpg)


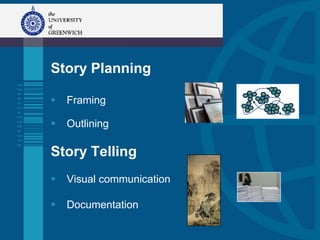


The document outlines strategies for delivering effective presentations, emphasizing the importance of clarity, audience engagement, and visual communication. It provides various techniques for planning, structuring, and rehearsing presentations to ensure the message achieves its objectives. Additionally, it advises on design elements, avoiding excessive text, and offers recommendations for using tools and templates effectively.


