Download to read offline

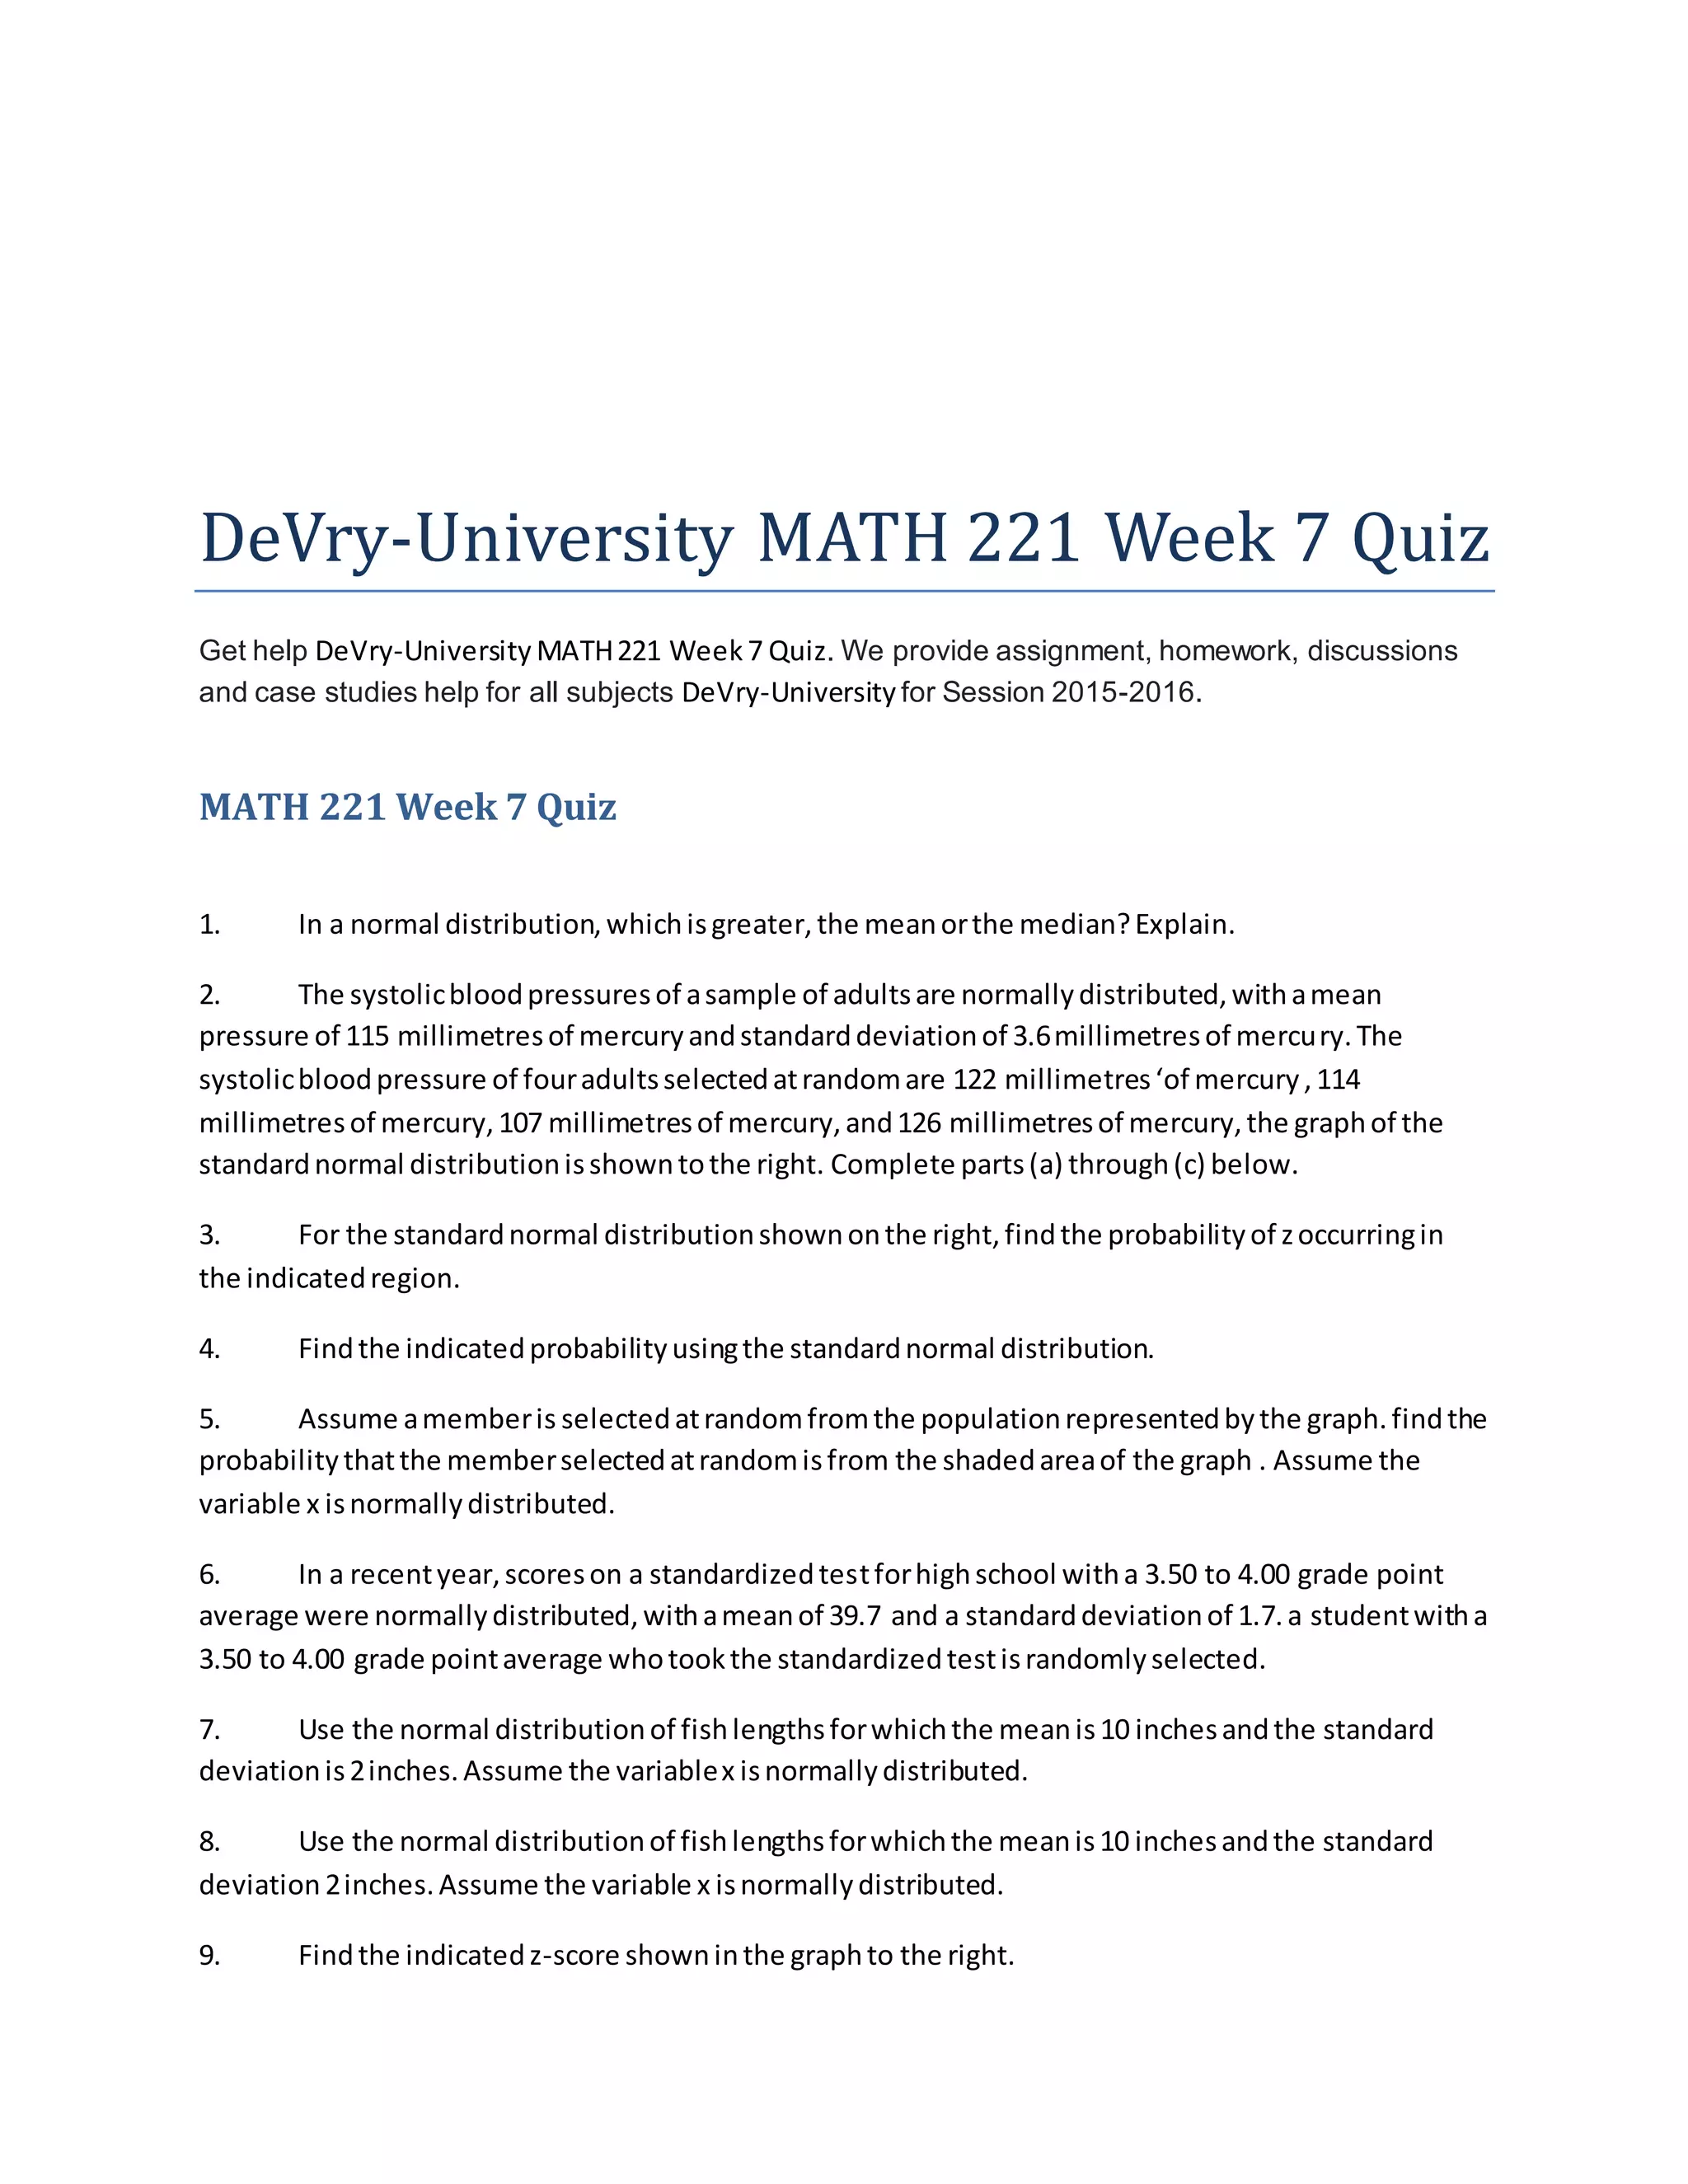
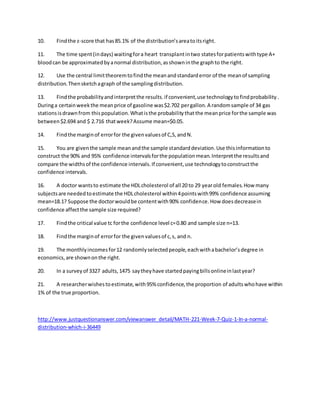

This document provides a list of 21 practice questions for a MATH 221 Week 7 Quiz. The questions cover topics related to normal distributions, z-scores, probabilities, sampling distributions, confidence intervals, and estimating proportions. They involve calculating probabilities, finding z-scores, determining sample sizes needed for confidence intervals, and interpreting results. The document aims to help students prepare for an exam on statistical concepts taught in MATH 221 during the 7th week of the course.