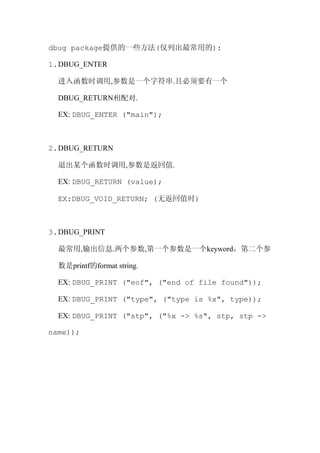
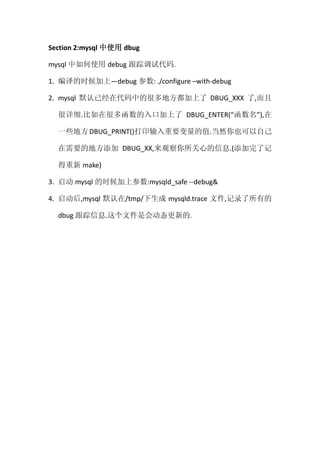
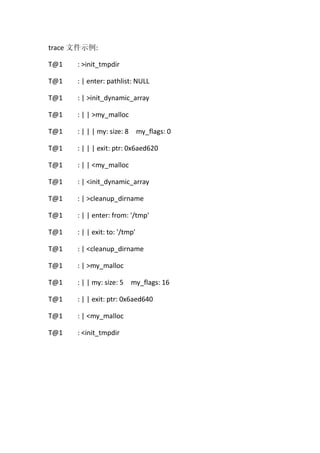
DBUG


a c program debugging package,


by Fred Fish.


http://sourceforge.net/projects/dbug


mysql 使用 dbug 来调试跟踪源代码
Section 1:dbug 的基本介绍

dbug example:

#include <dbug.h>


int main ()

{

    int result, i;

    DBUG_ENTER ("main");

    for (i=0,result=0; i != 100; i++) {

        DBUG_PRINT ("info", ("i : %dn", i);

        result += i;

    }

    DBUG_RETURN (0);

}
dbug package提供的一些方法(仅列出最常用的):

1. DBUG_ENTER

  进入函数时调用,参数是一个字符串.且必须要有一个

  DBUG_RETURN相配对.

  EX: DBUG_ENTER ("main");


2. DBUG_RETURN

  退出某个函数时调用,参数是返回值.

  EX: DBUG_RETURN (value);

  EX:DBUG_VOID_RETURN; (无返回值时)


3. DBUG_PRINT

  最常用,输出信息.两个参数,第一个参数是一个keyword,第二个参

  数是printf的format string.

  EX: DBUG_PRINT ("eof", ("end of file found"));

  EX: DBUG_PRINT ("type", ("type is %x", type));

  EX: DBUG_PRINT ("stp", ("%x -> %s", stp, stp ->

name));
Section 2:mysql 中使用 dbug

mysql 中如何使用 debug 跟踪调试代码.

1. 编译的时候加上—debug 参数: ./configure –with-debug

2. mysql 默认已经在代码中的很多地方都加上了 DBUG_XXX 了,而且

  很详细.比如在很多函数的入口加上了 DBUG_ENTER(“函数名”),在

  一些地方 DBUG_PRINT()打印输入重要变量的值.当然你也可以自己

  在需要的地方添加 DBUG_XX,来观察你所关心的信息.(添加完了记

  得重新 make)

3. 启动 mysql 的时候加上参数:mysqld_safe --debug&

4. 启动后,mysql 默认在/tmp/下生成 mysqld.trace 文件,记录了所有的

  dbug 跟踪信息.这个文件是会动态更新的.
trace 文件示例:

T@1   : >init_tmpdir

T@1   : | enter: pathlist: NULL

T@1   : | >init_dynamic_array

T@1   : | | >my_malloc

T@1   : | | | my: size: 8 my_flags: 0

T@1   : | | | exit: ptr: 0x6aed620

T@1   : | | <my_malloc

T@1   : | <init_dynamic_array

T@1   : | >cleanup_dirname

T@1   : | | enter: from: '/tmp'

T@1   : | | exit: to: '/tmp'

T@1   : | <cleanup_dirname

T@1   : | >my_malloc

T@1   : | | my: size: 5 my_flags: 16

T@1   : | | exit: ptr: 0x6aed640

T@1   : | <my_malloc

T@1   : <init_tmpdir
注:

1. T@n 的意思是表明这是在第 n 个线程中.

2. >init_tmpdir 中的>的意思是进入函数.

3. <init_tmpdir 中的<的意思是退出函数.

4. 树形结构,清晰

5. mysqld_safe& --debug 会产生很多的信息,可以加上命令关注我们

     所关心的:

     mysqld_safe

     --debug=d,info,error,query,general,where,taobao:O,/tmp/mysqld.trac

     e&

     上面的 infoerror 等是一些 tag,表明我们只需要查看这些 tag 标记

     的输出.比如我在某个地方:

     DBUG_PRINT( “taobao” , (”x is : %d” , x) );

     这个 DBUG 的 tag 是 taobao,那么我们用上面的方法启动 mysqld 后,

     就可以在 mysqld.trace 文件中看到这个 DBUG_PRINT 了.
参考:

DBUG User Manual

Creating                 Trace                  Files                :

http://dev.mysql.com/doc/refman/5.0/en/making-trace-files.html


                                                        周旻钧@taobao

                                               http://www.sa-unix.com

                                                             2010.9.19

dbug in mysql

  • 1.
    DBUG a c programdebugging package, by Fred Fish. http://sourceforge.net/projects/dbug mysql 使用 dbug 来调试跟踪源代码
  • 2.
    Section 1:dbug 的基本介绍 dbugexample: #include <dbug.h> int main () { int result, i; DBUG_ENTER ("main"); for (i=0,result=0; i != 100; i++) { DBUG_PRINT ("info", ("i : %dn", i); result += i; } DBUG_RETURN (0); }
  • 3.
    dbug package提供的一些方法(仅列出最常用的): 1. DBUG_ENTER 进入函数时调用,参数是一个字符串.且必须要有一个 DBUG_RETURN相配对. EX: DBUG_ENTER ("main"); 2. DBUG_RETURN 退出某个函数时调用,参数是返回值. EX: DBUG_RETURN (value); EX:DBUG_VOID_RETURN; (无返回值时) 3. DBUG_PRINT 最常用,输出信息.两个参数,第一个参数是一个keyword,第二个参 数是printf的format string. EX: DBUG_PRINT ("eof", ("end of file found")); EX: DBUG_PRINT ("type", ("type is %x", type)); EX: DBUG_PRINT ("stp", ("%x -> %s", stp, stp -> name));
  • 4.
    Section 2:mysql 中使用dbug mysql 中如何使用 debug 跟踪调试代码. 1. 编译的时候加上—debug 参数: ./configure –with-debug 2. mysql 默认已经在代码中的很多地方都加上了 DBUG_XXX 了,而且 很详细.比如在很多函数的入口加上了 DBUG_ENTER(“函数名”),在 一些地方 DBUG_PRINT()打印输入重要变量的值.当然你也可以自己 在需要的地方添加 DBUG_XX,来观察你所关心的信息.(添加完了记 得重新 make) 3. 启动 mysql 的时候加上参数:mysqld_safe --debug& 4. 启动后,mysql 默认在/tmp/下生成 mysqld.trace 文件,记录了所有的 dbug 跟踪信息.这个文件是会动态更新的.
  • 5.
    trace 文件示例: T@1 : >init_tmpdir T@1 : | enter: pathlist: NULL T@1 : | >init_dynamic_array T@1 : | | >my_malloc T@1 : | | | my: size: 8 my_flags: 0 T@1 : | | | exit: ptr: 0x6aed620 T@1 : | | <my_malloc T@1 : | <init_dynamic_array T@1 : | >cleanup_dirname T@1 : | | enter: from: '/tmp' T@1 : | | exit: to: '/tmp' T@1 : | <cleanup_dirname T@1 : | >my_malloc T@1 : | | my: size: 5 my_flags: 16 T@1 : | | exit: ptr: 0x6aed640 T@1 : | <my_malloc T@1 : <init_tmpdir
  • 6.
    注: 1. T@n 的意思是表明这是在第n 个线程中. 2. >init_tmpdir 中的>的意思是进入函数. 3. <init_tmpdir 中的<的意思是退出函数. 4. 树形结构,清晰 5. mysqld_safe& --debug 会产生很多的信息,可以加上命令关注我们 所关心的: mysqld_safe --debug=d,info,error,query,general,where,taobao:O,/tmp/mysqld.trac e& 上面的 infoerror 等是一些 tag,表明我们只需要查看这些 tag 标记 的输出.比如我在某个地方: DBUG_PRINT( “taobao” , (”x is : %d” , x) ); 这个 DBUG 的 tag 是 taobao,那么我们用上面的方法启动 mysqld 后, 就可以在 mysqld.trace 文件中看到这个 DBUG_PRINT 了.
  • 7.
    参考: DBUG User Manual Creating Trace Files : http://dev.mysql.com/doc/refman/5.0/en/making-trace-files.html 周旻钧@taobao http://www.sa-unix.com 2010.9.19