Dokumen tersebut memberikan ringkasan analisis dan pembahasan mengenai perkiraan jumlah penduduk dan sampah Kota Surakarta hingga tahun 2026. Data jumlah penduduk dan sampah dari tahun 2011-2016 diolah untuk memprediksi pertumbuhan ke depan dengan rumus geometrik. Hasilnya menunjukkan perkiraan jumlah penduduk 2026 sebesar 537.783 jiwa dan jumlah sampah 155.041 ton.
Pusat Pelayanan dan Interaksi Keruangan Kawasan Perkotaan Yogyakartabramantiyo marjuki
Kombinasi kalkulasi hirarki pusat pertumbuhan dan pelayanan wilayah, interaksi keruangan di dalam wilayah dan analisis ekonomi wilayah. Menggunakan Teori pusat pertumbuhan, pusat pelayanan skalogram guttman dan indeks sentralitas marshall, interaksi keruangan teori grafik kansky dan analisis ekonomi Location Quotient dan Shift Share
Laporan ini memberikan ringkasan statistik populasi penduduk DKI Jakarta tahun 2013 berdasarkan data per kelurahan. Data diolah menggunakan tabel distribusi frekuensi, ukuran pemusatan data, ukuran letak data, dan penyajian grafik. Hasil analisis menunjukkan rata-rata populasi penduduk sebesar 49.143 jiwa, median 41.265 jiwa, dan modus 33.728 jiwa.
Dokumen ini merupakan rencana perencanaan sistem penyediaan air bersih di Desa Pungkol, Kecamatan Tatapaan, Kabupaten Minahasa Selatan. Dokumen ini membahas latar belakang masalah kurangnya air bersih di desa tersebut, tujuan perencanaan sistem air bersih, dan metode analisis kebutuhan air bersih hingga tahun 2031 dengan menggunakan beberapa metode analisis seperti regresi linier, logaritma, dan e
PERKEMBANGAN SEKTOR KONTRUKSI TERHADAP PEREKONOMIAN DI JAWA TIMURSiti Farida
Sektor konstruksi di Jawa Timur didominasi oleh perusahaan-perusahaan skala kecil yang berada di bawah Rp10 miliar. Kota Surabaya memiliki jumlah perusahaan konstruksi terbanyak di Jawa Timur. Sektor konstruksi memberikan kontribusi sebesar 10% terhadap Produk Domestik Bruto Jawa Timur pada tahun 2015.
Dokumen tersebut merupakan lampiran Peraturan Komisi Pemilihan Umum Nomor 07 Tahun 2012 tentang Tahapan, Program, dan Jadual Penyelenggaraan Pemilihan Umum Anggota Dewan Perwakilan Rakyat, Dewan Perwakilan Daerah, dan Dewan Perwakilan Rakyat Daerah Tahun 2014 yang mengatur tentang perubahan kelima atas peraturan tersebut. Lampiran tersebut menjelaskan program dan jadwal penyelenggaraan pemilu mulai per
2024 State of Marketing Report – by HubspotMarius Sescu
https://www.hubspot.com/state-of-marketing
· Scaling relationships and proving ROI
· Social media is the place for search, sales, and service
· Authentic influencer partnerships fuel brand growth
· The strongest connections happen via call, click, chat, and camera.
· Time saved with AI leads to more creative work
· Seeking: A single source of truth
· TLDR; Get on social, try AI, and align your systems.
· More human marketing, powered by robots
ChatGPT is a revolutionary addition to the world since its introduction in 2022. A big shift in the sector of information gathering and processing happened because of this chatbot. What is the story of ChatGPT? How is the bot responding to prompts and generating contents? Swipe through these slides prepared by Expeed Software, a web development company regarding the development and technical intricacies of ChatGPT!
Product Design Trends in 2024 | Teenage EngineeringsPixeldarts
The realm of product design is a constantly changing environment where technology and style intersect. Every year introduces fresh challenges and exciting trends that mold the future of this captivating art form. In this piece, we delve into the significant trends set to influence the look and functionality of product design in the year 2024.
How Race, Age and Gender Shape Attitudes Towards Mental HealthThinkNow
Mental health has been in the news quite a bit lately. Dozens of U.S. states are currently suing Meta for contributing to the youth mental health crisis by inserting addictive features into their products, while the U.S. Surgeon General is touring the nation to bring awareness to the growing epidemic of loneliness and isolation. The country has endured periods of low national morale, such as in the 1970s when high inflation and the energy crisis worsened public sentiment following the Vietnam War. The current mood, however, feels different. Gallup recently reported that national mental health is at an all-time low, with few bright spots to lift spirits.
To better understand how Americans are feeling and their attitudes towards mental health in general, ThinkNow conducted a nationally representative quantitative survey of 1,500 respondents and found some interesting differences among ethnic, age and gender groups.
Technology
For example, 52% agree that technology and social media have a negative impact on mental health, but when broken out by race, 61% of Whites felt technology had a negative effect, and only 48% of Hispanics thought it did.
While technology has helped us keep in touch with friends and family in faraway places, it appears to have degraded our ability to connect in person. Staying connected online is a double-edged sword since the same news feed that brings us pictures of the grandkids and fluffy kittens also feeds us news about the wars in Israel and Ukraine, the dysfunction in Washington, the latest mass shooting and the climate crisis.
Hispanics may have a built-in defense against the isolation technology breeds, owing to their large, multigenerational households, strong social support systems, and tendency to use social media to stay connected with relatives abroad.
Age and Gender
When asked how individuals rate their mental health, men rate it higher than women by 11 percentage points, and Baby Boomers rank it highest at 83%, saying it’s good or excellent vs. 57% of Gen Z saying the same.
Gen Z spends the most amount of time on social media, so the notion that social media negatively affects mental health appears to be correlated. Unfortunately, Gen Z is also the generation that’s least comfortable discussing mental health concerns with healthcare professionals. Only 40% of them state they’re comfortable discussing their issues with a professional compared to 60% of Millennials and 65% of Boomers.
Race Affects Attitudes
As seen in previous research conducted by ThinkNow, Asian Americans lag other groups when it comes to awareness of mental health issues. Twenty-four percent of Asian Americans believe that having a mental health issue is a sign of weakness compared to the 16% average for all groups. Asians are also considerably less likely to be aware of mental health services in their communities (42% vs. 55%) and most likely to seek out information on social media (51% vs. 35%).
AI Trends in Creative Operations 2024 by Artwork Flow.pdfmarketingartwork
Creative operations teams expect increased AI use in 2024. Currently, over half of tasks are not AI-enabled, but this is expected to decrease in the coming year. ChatGPT is the most popular AI tool currently. Business leaders are more actively exploring AI benefits than individual contributors. Most respondents do not believe AI will impact workforce size in 2024. However, some inhibitions still exist around AI accuracy and lack of understanding. Creatives primarily want to use AI to save time on mundane tasks and boost productivity.
Organizational culture includes values, norms, systems, symbols, language, assumptions, beliefs, and habits that influence employee behaviors and how people interpret those behaviors. It is important because culture can help or hinder a company's success. Some key aspects of Netflix's culture that help it achieve results include hiring smartly so every position has stars, focusing on attitude over just aptitude, and having a strict policy against peacocks, whiners, and jerks.
PEPSICO Presentation to CAGNY Conference Feb 2024Neil Kimberley
PepsiCo provided a safe harbor statement noting that any forward-looking statements are based on currently available information and are subject to risks and uncertainties. It also provided information on non-GAAP measures and directing readers to its website for disclosure and reconciliation. The document then discussed PepsiCo's business overview, including that it is a global beverage and convenient food company with iconic brands, $91 billion in net revenue in 2023, and nearly $14 billion in core operating profit. It operates through a divisional structure with a focus on local consumers.
Content Methodology: A Best Practices Report (Webinar)contently
This document provides an overview of content methodology best practices. It defines content methodology as establishing objectives, KPIs, and a culture of continuous learning and iteration. An effective methodology focuses on connecting with audiences, creating optimal content, and optimizing processes. It also discusses why a methodology is needed due to the competitive landscape, proliferation of channels, and opportunities for improvement. Components of an effective methodology include defining objectives and KPIs, audience analysis, identifying opportunities, and evaluating resources. The document concludes with recommendations around creating a content plan, testing and optimizing content over 90 days.
How to Prepare For a Successful Job Search for 2024Albert Qian
The document provides guidance on preparing a job search for 2024. It discusses the state of the job market, focusing on growth in AI and healthcare but also continued layoffs. It recommends figuring out what you want to do by researching interests and skills, then conducting informational interviews. The job search should involve building a personal brand on LinkedIn, actively applying to jobs, tailoring resumes and interviews, maintaining job hunting as a habit, and continuing self-improvement. Once hired, the document advises setting new goals and keeping skills and networking active in case of future opportunities.
A report by thenetworkone and Kurio.
The contributing experts and agencies are (in an alphabetical order): Sylwia Rytel, Social Media Supervisor, 180heartbeats + JUNG v MATT (PL), Sharlene Jenner, Vice President - Director of Engagement Strategy, Abelson Taylor (USA), Alex Casanovas, Digital Director, Atrevia (ES), Dora Beilin, Senior Social Strategist, Barrett Hoffher (USA), Min Seo, Campaign Director, Brand New Agency (KR), Deshé M. Gully, Associate Strategist, Day One Agency (USA), Francesca Trevisan, Strategist, Different (IT), Trevor Crossman, CX and Digital Transformation Director; Olivia Hussey, Strategic Planner; Simi Srinarula, Social Media Manager, The Hallway (AUS), James Hebbert, Managing Director, Hylink (CN / UK), Mundy Álvarez, Planning Director; Pedro Rojas, Social Media Manager; Pancho González, CCO, Inbrax (CH), Oana Oprea, Head of Digital Planning, Jam Session Agency (RO), Amy Bottrill, Social Account Director, Launch (UK), Gaby Arriaga, Founder, Leonardo1452 (MX), Shantesh S Row, Creative Director, Liwa (UAE), Rajesh Mehta, Chief Strategy Officer; Dhruv Gaur, Digital Planning Lead; Leonie Mergulhao, Account Supervisor - Social Media & PR, Medulla (IN), Aurelija Plioplytė, Head of Digital & Social, Not Perfect (LI), Daiana Khaidargaliyeva, Account Manager, Osaka Labs (UK / USA), Stefanie Söhnchen, Vice President Digital, PIABO Communications (DE), Elisabeth Winiartati, Managing Consultant, Head of Global Integrated Communications; Lydia Aprina, Account Manager, Integrated Marketing and Communications; Nita Prabowo, Account Manager, Integrated Marketing and Communications; Okhi, Web Developer, PNTR Group (ID), Kei Obusan, Insights Director; Daffi Ranandi, Insights Manager, Radarr (SG), Gautam Reghunath, Co-founder & CEO, Talented (IN), Donagh Humphreys, Head of Social and Digital Innovation, THINKHOUSE (IRE), Sarah Yim, Strategy Director, Zulu Alpha Kilo (CA).
Trends In Paid Search: Navigating The Digital Landscape In 2024Search Engine Journal
The search marketing landscape is evolving rapidly with new technologies, and professionals, like you, rely on innovative paid search strategies to meet changing demands.
It’s important that you’re ready to implement new strategies in 2024.
Check this out and learn the top trends in paid search advertising that are expected to gain traction, so you can drive higher ROI more efficiently in 2024.
You’ll learn:
- The latest trends in AI and automation, and what this means for an evolving paid search ecosystem.
- New developments in privacy and data regulation.
- Emerging ad formats that are expected to make an impact next year.
Watch Sreekant Lanka from iQuanti and Irina Klein from OneMain Financial as they dive into the future of paid search and explore the trends, strategies, and technologies that will shape the search marketing landscape.
If you’re looking to assess your paid search strategy and design an industry-aligned plan for 2024, then this webinar is for you.
5 Public speaking tips from TED - Visualized summarySpeakerHub
From their humble beginnings in 1984, TED has grown into the world’s most powerful amplifier for speakers and thought-leaders to share their ideas. They have over 2,400 filmed talks (not including the 30,000+ TEDx videos) freely available online, and have hosted over 17,500 events around the world.
With over one billion views in a year, it’s no wonder that so many speakers are looking to TED for ideas on how to share their message more effectively.
The article “5 Public-Speaking Tips TED Gives Its Speakers”, by Carmine Gallo for Forbes, gives speakers five practical ways to connect with their audience, and effectively share their ideas on stage.
Whether you are gearing up to get on a TED stage yourself, or just want to master the skills that so many of their speakers possess, these tips and quotes from Chris Anderson, the TED Talks Curator, will encourage you to make the most impactful impression on your audience.
See the full article and more summaries like this on SpeakerHub here: https://speakerhub.com/blog/5-presentation-tips-ted-gives-its-speakers
See the original article on Forbes here:
http://www.forbes.com/forbes/welcome/?toURL=http://www.forbes.com/sites/carminegallo/2016/05/06/5-public-speaking-tips-ted-gives-its-speakers/&refURL=&referrer=#5c07a8221d9b
ChatGPT and the Future of Work - Clark Boyd Clark Boyd
Everyone is in agreement that ChatGPT (and other generative AI tools) will shape the future of work. Yet there is little consensus on exactly how, when, and to what extent this technology will change our world.
Businesses that extract maximum value from ChatGPT will use it as a collaborative tool for everything from brainstorming to technical maintenance.
For individuals, now is the time to pinpoint the skills the future professional will need to thrive in the AI age.
Check out this presentation to understand what ChatGPT is, how it will shape the future of work, and how you can prepare to take advantage.
The document provides career advice for getting into the tech field, including:
- Doing projects and internships in college to build a portfolio.
- Learning about different roles and technologies through industry research.
- Contributing to open source projects to build experience and network.
- Developing a personal brand through a website and social media presence.
- Networking through events, communities, and finding a mentor.
- Practicing interviews through mock interviews and whiteboarding coding questions.
Google's Just Not That Into You: Understanding Core Updates & Search IntentLily Ray
1. Core updates from Google periodically change how its algorithms assess and rank websites and pages. This can impact rankings through shifts in user intent, site quality issues being caught up to, world events influencing queries, and overhauls to search like the E-A-T framework.
2. There are many possible user intents beyond just transactional, navigational and informational. Identifying intent shifts is important during core updates. Sites may need to optimize for new intents through different content types and sections.
3. Responding effectively to core updates requires analyzing "before and after" data to understand changes, identifying new intents or page types, and ensuring content matches appropriate intents across video, images, knowledge graphs and more.
A brief introduction to DataScience with explaining of the concepts, algorithms, machine learning, supervised and unsupervised learning, clustering, statistics, data preprocessing, real-world applications etc.
It's part of a Data Science Corner Campaign where I will be discussing the fundamentals of DataScience, AIML, Statistics etc.
Time Management & Productivity - Best PracticesVit Horky
Here's my presentation on by proven best practices how to manage your work time effectively and how to improve your productivity. It includes practical tips and how to use tools such as Slack, Google Apps, Hubspot, Google Calendar, Gmail and others.
The six step guide to practical project managementMindGenius
The six step guide to practical project management
If you think managing projects is too difficult, think again.
We’ve stripped back project management processes to the
basics – to make it quicker and easier, without sacrificing
the vital ingredients for success.
“If you’re looking for some real-world guidance, then The Six Step Guide to Practical Project Management will help.”
Dr Andrew Makar, Tactical Project Management
Beginners Guide to TikTok for Search - Rachel Pearson - We are Tilt __ Bright...
David Anwar Bab IV.pdf
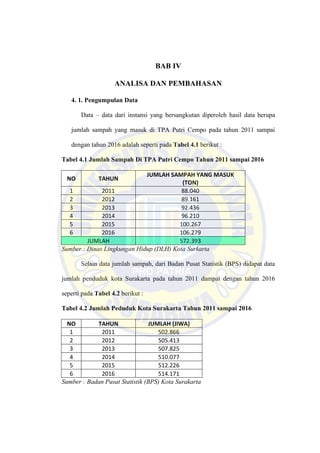
1. BAB IV
ANALISA DAN PEMBAHASAN
4. 1. Pengumpulan Data
Data – data dari instansi yang bersangkutan diperoleh hasil data berupa
jumlah sampah yang masuk di TPA Putri Cempo pada tahun 2011 sampai
dengan tahun 2016 adalah seperti pada Tabel 4.1 berikut :
Tabel 4.1 Jumlah Sampah Di TPA Putri Cempo Tahun 2011 sampai 2016
NO TAHUN
JUMLAH SAMPAH YANG MASUK
(TON)
1 2011 88.040
2 2012 89.161
3 2013 92.436
4 2014 96.210
5 2015 100.267
6 2016 106.279
JUMLAH 572.393
Sumber : Dinas Lingkungan Hidup (DLH) Kota Surkarta
Selain data jumlah sampah, dari Badan Pusat Statistik (BPS) didapat data
jumlah penduduk kota Surakarta pada tahun 2011 dampai dengan tahun 2016
seperti pada Tabel 4.2 berikut :
Tabel 4.2 Jumlah Peduduk Kota Surakarta Tahun 2011 sampai 2016
NO TAHUN JUMLAH (JIWA)
1 2011 502.866
2 2012 505.413
3 2013 507.825
4 2014 510.077
5 2015 512.226
6 2016 514.171
Sumber : Badan Pusat Statistik (BPS) Kota Surakarta
2. 53
4. 2 Analisa Data
4.2.1 Proyeksi Jumlah Penduduk Kota Surakarta Tahun 2026
Dalam perhitungan prediksi jumlah penduduk Kota Surakarta pada tahun
2026 metode persamaan yang digunakan adalah persamaan geometric dengan
rumus :
Pn = Pa (1+r)n
.......................................................................... (4.1)
Dengan : Pn = Jumlah penduduk pada tahun n proyeksi
Pa = Jumlah penduduk pada tahun awal proyeksi
R = Rata – rata pertambahan penduduk pertahun (%)
N = Selang waktu proyeksi (tahun)
1. Mencari pertumbuhan penduduk setiap tahun
a) Tahun 2011 - 2012 (X1)
=
!"#$%& ()*+"+", -%&"* ./0.1!"#$%& ()*+"+", -%&"* ./00
!"#$%& ()*+"+", -%&"* ./00
x 100%
=
2/2.40512/..677
2/..677
x 100%
= 0,506%
b) Tahun 2012 - 2013 (X2)
=
!"#$%& ()*+"+", -%&"* ./051!"#$%& ()*+"+", -%&"* ./0.
!"#$%& ()*+"+", -%&"* ./0.
x 100%
=
2/8.6.212/2.405
2/2.405
x 100%
= 0,477%
c) Tahun 2013 - 2014 (X3)
3. 54
=
!"#$%& ()*+"+", -%&"* ./041!"#$%& ()*+"+", -%&"* ./05
!"#$%& ()*+"+", -%&"* ./05
x 100%
=
20/./8812/8.6.2
2/8.6.2
x 100%
= 0,443%
d) Tahun 2014 - 2015 (X4)
=
!"#$%& ()*+"+", -%&"* ./021!"#$%& ()*+"+", -%&"* ./04
!"#$%& ()*+"+", -%&"* ./04
x 100%
=
20....7120/./88
20/./88
x 100%
= 0,421%
e) Tahun 2015 - 2016 (X5)
=
!"#$%& ()*+"+", -%&"* ./071!"#$%& ()*+"+", -%&"* ./02
!"#$%& ()*+"+", -%&"* ./02
x 100%
=
204.080120....7
20....7
x 100%
= 0,379%
Dari penjabaran perhitungan diatas, dapat dilihat ringkasan perhitungan
pada Tabel 4.3
Tabel 4.3 Pertumbuhan Kota Surakarta
NO TAHUN
JUMLAH PENDUDUK
(ORANG)
PERTUMBUHAN
ORANG (X) %
0 2011 502.866 - -
1 2012 505.413 2.547 0,506496761
2 2013 507.825 2.412 0,47723347
3 2014 510.077 2.252 0,443459853
4 2015 512.226 2.149 0,42130894
5 2016 514.171 1.945 0,379715204
JUMLAH 11.305 2,228214228
4. 55
Setelah mendapatkan pertumbuhan penduduk setiap tahunnya, kemudian
dicari rata – rata pertumbuhan penduduk dari tahun 2011 – 2016.
R =
90:9.:95:94:92
;10
R =
/,2/7:/,488:/,445:/,4.0:/,58=
710
R =
.,.5
2
= 0,45 %
Nilai rata – rata pertumbuhan (R) yang didapat dari perhitungan diatas
digunakan untuk menghitung proyeksi penduduk pada tahun 2017 sampai tahun
2026
Contoh perhitungan untuk menghitung prediksi jumlah penduduk
P2017 = P2016 (1 + r)1
= 514.171 ( 1 + 0,0045)1
= 516.485 orang
Perhitungan selengkapnya untuk jumlah penduduk sampai dengan tahun
2026 dapat ilihat pada Tabel 4.4
5. 56
Tabel 4.4 Perdiksi Jumlah Penduduk Kota Surakarta dari Tahun 2017
sampai dengan Tahun 2026
NO TAHUN JUMLAH PENDUDUK (JIWA)
1 2017 516.485
2 2018 518.809
3 2019 521.144
4 2020 523.489
5 2021 525.844
6 2022 528.211
7 2023 530.588
8 2024 532.975
9 2025 535.374
10 2026 537.783
JUMLAH 5.270.701
Jadi prediksi jumlah penduduk Kota Surakarta pada tahun 2026 adalah
537.783 jiwa.
4.2.2 Prediksi Jumlah Sampah Kota Surakarta Tahun 2026
Dalam memprediksi umlah sampah yang masuk di TPA Putri Cempo pada tahun
2026 menggunakan Rumus berikut :
Px = Pa (1+r)x
..................................................................... (4.2)
Dengan :
Px = Jumlah sampah pada tahun x proyeksi
Pa = Jumlah sampah pada tahun awal proyeksi
R = Rata-rata pertambahan sampah pertahun (%)
X = Selang waktu proyeksi / tahun
6. 57
Dari data sampah yang didapat pada Tabel 4.1 dihitung pertambahan
sampah setiap tahunnya seperti berikut :
Perhitungan pertumbuhan sampah setiap tahun
a) Tahun 2011 - 2012 (X1)
=
!"#$%& >%#(%& -%&"* ./0.1!"#$%& >%#(%& -%&"* ./00
!"#$%& >%#(%& -%&"* ./00
x 100%
=
6=.070166./4/
66./4/
x 100%
= 1,273%
b) Tahun 2012 - 2013 (X2)
=
!"#$%& >%#(%& -%&"* ./051!"#$%& >%#(%& -%&"* ./0.
!"#$%& >%#(%& -%&"* ./0.
x 100%
=
=..45716=.070
6=.070
x 100%
= 3,673%
c) Tahun 2013 - 2014 (X3)
=
!"#$%& >%#(%& -%&"* ./041!"#$%& >%#(%& -%&"* ./05
!"#$%& >%#(%& -%&"* ./05
x 100%
=
=7..0/1=..457
=..457
x 100%
= 4,082%
d) Tahun 2014 - 2015 (X4)
=
!"#$%& >%#(%& -%&"* ./021!"#$%& >%#(%& -%&"* ./04
!"#$%& >%#(%& -%&"* ./04
x 100%
=
0//..781=7..0/
=7..0/
x 100%
= 4,216%
7. 58
e) Tahun 2015 - 2016 (X5)
=
!"#$%& >%#(%& -%&"* ./071!"#$%& >%#(%& -%&"* ./02
!"#$%& >%#(%& -%&"* ./02
x 100%
=
0/7..8=10//..78
0//..78
x 100%
= 5,995%
Dari penjabaran perhitungan pertambahan jumlah sampah diatas, lebih
ringkas dapat dilihat pada Tabel 4.5
Tabel 4.5 Pertambahan Jumlah Sampah di TPA Putri Cempo
NO TAHUN
JUMLAH SAMPAH
YANG MASUK (TON)
Pertambahan
x % ton
0 2011 88.040 - -
1 2012 89.161 1,273284871 1.121
2 2013 92.436 3,673130629 3.275
3 2014 96.210 4,082824873 3.774
4 2015 100.267 4,216817379 4.057
5 2016 106.279 5,995990705 6.012
JUMLAH 19,24204846 18.239
Dari presentasi pertumbuhan pada table diatas, kemudian dihitung rata –
rata pertumbuhannya .
R =
90:9.:95:94:92
;10
R =
0,.85:5,785:4,/6.:4,.07:2,==2
710
R =
0=,.4.
2
= 3,848 %
Presentase pertambahan sampah rata – rata dari hasil perhitungan diatas dipakai
untuk memprediksi jumlah sampah dari tahun 2017 sampai 2026.
8. 59
Contoh perhitungan prediksi sampah pada tahun 2017 sampai 2026
P2017 = P2016 (1 + r)1
= 106.279 ( 1 + 0,0384)1
= 110.369 ton
Perhitungan selanjutnya jumlah penduduk sampai dengan tahun 2026
dapat dituliskan pada Tabel 4.6 sebagai berikut :
Tabel 4.6 Prediksi Jumlah Sampah Tahun 2017 Sampai Dengan Tahun 2026
NO TAHUN JUMLAH SAMPAH (TON)
1 2017 110.369
2 2018 114.617
3 2019 119.027
4 2020 123.608
5 2021 128.365
6 2022 133.305
7 2023 138.435
8 2024 143.763
9 2025 149.295
10 2026 155.041
JUMLAH 1.315.825
Jadi prediksi jumlah sampah yang masuk ke TPA Putri Cempo pada
Tahun 2026 sebanyak 155.041 ton.
Dari perhitungan data diatas kemudian dibuat grafik seperti pada Gambar
4.1 berikut :
9. 60
Gambar 4.1 Grafik Perbandingan Antara Jumlah Penduduk Dengan Jumlah
Sampah Kota Surakarta Pada Tahun 2011 Sampai Tahun 2026
4.2.3 Prediksi Jumlah Sampah Yang Ditimbun Tahun 2026
Sampah yang akan ditimbun dalam sel landfill hanya sampah yang mudah
terurai seperti sampah organik dan kertas. Dari data Dinas Lingkungan Hidup
(DLH) presentase komposisi untuk sampah organik 71% dan sampah kertas 7%.
Dari data sampah yang ada pada Tabel 4.1, jumlah sampah dipisahkan per
komposisi seperti pada Tabel 4.7
10. 61
Tabel 4.7 Jumlah Sampah Terurai
NO TAHUN
SAMPAH MUDAH
TERURAI (TON)
1 2011 68,671
2 2012 69,546
3 2013 72,100
4 2014 75,044
5 2015 78,208
6 2016 82,898
JUMLAH 446,467
Dari data sampah terurai pada tahun 2011 – 2016 bisa dihitung
pertumbuhan sampah pertahunnya dengan cara seperti pada sub bab 4.2.2.
Dengan cara perhitungan yang sama didapatkan pertumbuhan sampah mudah
terurai seperti pada Tabel 4.8
Tabel 4.8 Pertumbuhan Sampah Mudah Terurai
NO TAHUN
JUMLAH SAMPAH YANG
MASUK (TON)
Pertambahan
x % ton
0 2011 68,671 - -
1 2012 69,546 1.273284871 874
2 2013 72,100 3.673130629 2,555
3 2014 75,044 4.082824873 2,944
4 2015 78,208 4.216817379 3,164
5 2016 82,898 5.995990705 4,689
JUMLAH 19.24204846 14,226
Setelah mendapatkan akumulasi pertambahan sampah organic/sampah
terurai, maka selanjutnya dihitung R (rata – rata pertambahan per tahun) yang
nantinya digunakan untuk menghitung prediksi besarnya sampah terurai yang
dihasilkan selama 20 thun kedepan.
11. 62
R =
90:9.:95:94:92
;10
R =
0,.85:5,785:4,/6.:4,.07:2,==2
710
R =
0=,.4.
2
= 3,848 %
Presentase pertambahan rata-rata diatas digunakan untuk menghitung
prediksi jumlah sampah terurai pada tahun 2017 – 2026. Dengan menggunakan
rumus 4.2 prediksi jumlah sampah terurai dapat dihitung seperti pada Tabel 4.9.
Tabel 4.9 Prediksi Sampah Mudah Terurai Tahun 2017 – 2026
NO TAHUN JUMLAH SAMPAH (TON)
1 2017 86,088
2 2018 89,401
3 2019 92,841
4 2020 96,414
5 2021 100,125
6 2022 103,978
7 2023 107,979
8 2024 112,135
9 2025 116,450
10 2026 120,932
JUMLAH 1,026,344
4. 3 Perencanaan Sanitary Landfill
4.3.1 Perencanaan Sel Sanitary Landfil
Penentuan lokasi pembangunan TPA mengacu pada SNI 03-3241-1994
tentang Tata Cara Pemilihan Lokasi TPA Sampah. Ada beberapa parameter yang
digunakan dari SNI, yang menjadi prinsip dalam menetapkan lokasi
pengembangan TPA, sebagai berikut :
12. 63
1) Parameter Umum
Parameter ini meliputi : batas administrasi, status kepemilikan tanah,
kapasitas lahan dan pola pasrisipasi masyarakat. Calon lokasi
merupakan lahan milik Pemerintah Kota Surakarta yang berada
dalam batas administrasi Kota Surakarta, yaitu di kecamatan Jebres.
2) Parameter Fisika – Tanah
Parameter fisika tanah meliputi permeabilitas tanah, kedalaman
akuifer, system aliran air tanah, pemanfaatan air tanah, dan
ketersediaan tanah penutup.
3) Parameter Lingkungan Fisik
Parameter ini meliputi : bahaya banjir, intensitas hujan, jalan akses,
lokasi site, tata guna tanah, kondisi site, diversitas habitat, kebisingan
dan bau, serta permasalahan estetika.
Berdasarkan PerMen. PU No. 3 Tahun 2013, rencana tapak lokasi untuk
area TPA lahan sanitary landfill harus memperhatikan beberapa hal berikut :
- Pemanfaatan lahan dibuat seoptimal mungkin sehingga semua lahan
yang ada dapat dimanfaatkan dan tidak ada lahan yang tidak
dimanfaatkan.
- Lokasi TPA harus terlindungi dari jalan umum yang melintas area
dalam TPA. Hal ini dapat dihindari dengan membuat pagar hidup
disekeliling TPA yang sekaligus dapat difungsikan menjadi zona
penyangga.
13. 64
- Penempatan jalan operasional harus disesuaikan dengan sel/blok
penimbunan, sehingga semua tumpukan sampah dapat dijangkau
dengan mudah oleh truk dan alat besar.
Perencanaan sanitary landfill dilakukan di lahan seluas 6.7 Ha dengan
area dapat dilihat di Lampiran E.
Metode penimbunan yang direncanakan menggunakan metode trench.
Sel landfill tidak sepenuhnya berada dipermukaan tanah, akan tetapi ada sebagian
yang berada dibawah permukaan tanah. Dalam tugas akhir ini direncanakan tinggi
tiap litf 1.5 meter.
Metode ini dipilih untuk mencegah timbunan sampah yang terlalu tinggi
dan mengefisiensikan ketersediaan lahan untuk menampung volume sampah yang
lebih banyak. Perlu diperhatikan juga kontur TPA dan kemiringan lift untuk
mencegah adanya longsor di TPA dan menentukan elevasi awal sel landfill.
Urutan pengolahan sampah yang masuk TPA dari sampah yang masuk ke
area penimbunan maka akan dibuat kan beberapa sel dengan langkah-langkah
sebagai berikut :
§ Sampah yang masuk ditumpuk untuk mem bentuk sel sampah.
§ Sampah yang dimasukkan ke lahan urug akan diratakan dan dipadatkan
secara bertahap setiap 50 cm, hingga mencapai ketinggian 1,5 m,
kemudian sampah ditutup dengan menggunakan tanah dipadatkan hingga
setebal 15 cm.
§ Tanah penutup antara menggunakan tanah urug.
§ Bentuk sel landfill menyesuaikan bentuk lahan area penimbunan.
14. 65
Pada operasional TPA ada beberapa ketentuan mengenai sampah yang
ditangani di TPA, antara lain :
Ù Sampah yang boleh masuk ke TPA adalah sampah yang berasal dari
kegiatan rumah tangga, kegiatan pasar, kegiatan komersial, kegiatan
perkantoran, institusi Pendidikan, dan kegiatan lainnya yang
menghasilkan limbah sejenis sampah kota. Limbah yang berkatagosi
B3 dilarang masuk ke TPA.
Ù Limbah B3 yang berasal dari kegiatan rumah tangga harus ditangani
secara khusus sesai peraturan perundang-undangan yang berlaku,
dan TPA hanya berfungsi sebagai tempat penampung sementara.
Limbah B3 rumah tangga dikelola dengan mengaktifkan fungsi
pewadahan TPS untuk kemudian diangkut ke tempat pemrosesan
akhir limbah B3, untuk limbah B3 yang terlanjur masuk ke TPA.
Limbah B3 tidak dikelola oleh TPA.
Ù Limbah yang diurug dalam sebuah TPA :
• Limbah cair ysng berasal dari kegiatan rumah tangga
• Limbah yang berkatagori B3 menurut PP 18/99 jo PP85/99
• Limbah medis dari kegiatan medis
Ù Sampah yang masuk ke TPA tadak seluruhnya diurug kedalam
pengurugan. Proses 3R (Reduce-Reuse_Recycle) diwajibkan untuk
dilakukan seperti daur-ulang dan pengomposan.
15. 66
4.3.2 Rencana Galian Sel Landfill
Metode perencanaan sel landfill menggunakan metode trench yang
membutuhkan galian tanah sebagai penimbunan sampah. Berikut perhitungan dan
sketsa zona penimbunan sampah di bawah permukaan tanah :
- Rencana kedalaman lift (y) = 1,5
- x = 3m (lebar jalan operational)
Gambar 4.2 Sektsa Kemiringan Galian
X merupakan sisi alas dengan lebar 3 m. Direncanakan y (kedalamannya)
sebesar 1,5 m. Sehingga di dapatkan sudut kemmiringan galian sebesar :
tan ∝ =
@
A
tan ∝ =
0,2 B
5 B
C = 29,50
≈ 300
Cos 300
=
A
E
0,89 =
5
E
z = 3,37 m ≈ 3 m
Untuk akses jalan masuk ke area timbunan, digunakan kemiringan medan
10o
untuk memudahkan alat berat yang melintas, sehingga jalan masuknya
dapat diketahui dari perhitungan dan sketsa sebagai berikut :
X (alas)
Z Y (kedalaman)
α
16. 67
Gambar 4.3 Sketsa Kemiringan Jalan Operational
Sin 100
=
F
G
0,16 =
0,2 #
G
z = 9,375 m = 9 m
Cos 100
=
H
G
0,99 =
H
=,582
x = 9,28 m = 9 m
Z
Y (kedalaman)
X (alas)
C = 100
17. 68
Gambar 4.4 Rencana Area Landfill
4.3.3 Rencana Timbunan Sampah di Sel Landfill
Direncanakan setiap lift sel mempunyai tinggi 1,5 m. Untuk memenuhi
standart sanitary landfill, dilakukan juga pengurukan sampah setiap hari
dengan tanah penutup. Berikut perhitungan zona timbunan sampah diatas
permukaan tanah :
- Rencana tinggi lift = 1,5 m
- Area jalan operasi = 3 m
18. 69
Gambar 4.5 Sketsa Kemiringan Timbunan
tan ∝ =
@
A
tan ∝ =
0,2 B
5 B
C = 29,50
≈ 300
Cos 300
=
A
E
0,89 =
5
E
z = 3,37 m ≈ 3 m
Untuk akses jalan masuk ke area penimbunan, digunakan kemiringan
medan 10o
untuk memudahkan alat berat yang melintas, sehingga jalan masuknya
dapat diketahui dari perhitungan dan sketsa sebagai berikut :
Gambar 4.6 Sketsa Kemiringan Jalan Operational
Sin 100
=
F
G
0,16 =
0,2 #
G
z = 9,375 m = 9 m
Cos 100
=
H
G
Z
Y (kedalaman)
X (alas)
C
Z
Y (kedalaman)
X (alas)
C = 100
19. 70
0,99 =
H
=,582
x = 9,28 m = 9 m
Gambar 4.7 Rencana Denah Timbunan
4.3.4 Perhitungan Kapasitas Sel Sanitary Landfill
Perhitungan kapasitas sel dengan cara menghitung volume tiap lift
menggunakan rumus limas terpancung (persamaan 4.3). Hasil perhitungan
kapasitas zona terdapat pada table perhitungan kapasitas di lampiran, didapatkan
kapasitas zona/sel sebesar 1.090.408,667 m3
. Perhitungan dilakukan sesuai
gambar pada LAMPIRAN G.
Vlift = 1/3 x h (La + (La x Lb)1/2
+Lb) ........ (4.3)
Dimana :
H = Tinggi lift (m)
La = Lebar sisi atas lift (m)
20. 71
Lb = Lebar sisi bawah lift (m)
4.3.5 Perhitungan Kebutuhan Tanah Penutup
Kebutuhan tanah penutup antara untuk sel sanitary landfill direncanakan
setebal 30cm dan 10cm untuk tanah penutup harian. Hal ini sesuai dengan
ketentuan dari PerMen. PU No. 3 Tahun 2013. Perhitungsn kebutuhan tanah
penutup menggunakan rumus :
% kebutuhan tanah penutup =
(tebal tanah penutup/tinggi lift) x 100% ..........(4.4)
Kebutuhan tanah penutup =
% kebutuhan tanah penutup x volume lift .............(4.5)
Contoh perhitungan kebutuhan tanah penutup antara pada lift 1 :
Tingi lift = 1,5 m ; tebal tanah penutup = 0,3 m
% Kebutuhan tanah penutup = (tebal tanah penutup/tinggi lift) x 100%
= (0,3m / 1,5m) x 100%
= 20%
Kebutuhan tanah penutup = % kebutuhan tanah penutup x volume lift
= 20% x 171.895,673
= 34.379,135 m3
Contoh perhitungan kebutuhan tanah penutup harian :
Tinggi timbunan sampah per hari =0,5 m ; tebal tanah penutup = 0,1m
% Kebutuhan tanah penutup = (tebal tanah penutup/tinggi timbunan) x 100%
= (0,1m / 0,5m) x 100%
= 20%
21. 72
Kebutuhan tanah penutup = % kebutuhan tanah penutup x volume lift
= 20% x 314,908
= 62,98 m3
Hasil perhitungan kebutuhan tanah penutup antara dapat dilihat di Tabel
4.10, sedangkan kebutuhan tanah penutup harian dapat dilihat di Tabel 4.11
sebagai berikut :
Tabel 4.10 Kebutuhan Tanah Penutup Antara
LIFT VOLUME LIFT (M3)
PRESENTASE
KEBUTUHAN
TANAH PENUTUP
KEBUTUHAN
TANAH
PENUTUP (M3)
1 171895,6725 0,2 34379,135
2 171895,6725 0,2 34379,135
3 164155,6099 0,2 32831,122
4 156577,5426 0,2 31315,509
5 149161,4702 0,2 29832,294
6 141907,3919 0,2 28381,478
7 134815,3073 0,2 26963,061
TOTAL 218081,733
22. 73
Tabel 4.11 Kebutuhan Tanah Penutup Harian
TAHUN
VOLUME
TIMBUNAN
SAMPAH
PERHARI (M3)
PRESENTASE
KEBUTUHAN
TANAH
PENUTUP
KEBUTUHAN
TANAH
PENUTUP
HARIAN PER
HARI (M3)
KEBUTUHAN
TANAH
PENUTUP
HARIAN UNTUK
SETAHUN (M3)
2017 314,91 0,2 62,98 22.988,28
2018 300,73 0,2 60,15 21.953,17
2019 286,85 0,2 57,37 20.939,73
2020 273,26 0,2 54,65 19.947,95
2021 259,97 0,2 51,99 18.977,83
2022 246,98 0,2 49,40 18.029,38
2023 234,28 0,2 46,86 17.102,59
2024 221,88 0,2 44,38 16.197,47
2025 209,78 0,2 41,96 15.314,01
2026 197,98 0,2 39,60 14.452,21
4.4 Daya Dukung Tanah
Perlu diketahui daya dukung tanah untuk mengetahui apakah tanah di TPA
tersebut dapat menampung beban dari timbunan sampah, perhitungannya sebagai
berikut :
Daya dukung tanah =
IJBKLM KNOP A PN;QQN KNOP A RS;TNPLT TLBULM
0///
………………. (4.6)
=
8 A 0,2 A 7//
0///
= 6,3 ton/m2
Daya dukung tanah ini seharusnya dibandingkan dengan data daya
dukung tanah berdasarkan hasil tes sondir dan boring di lokasi. Karena
keterbatasan data, maka perencana membandingkan dengan tinggi sel eksisting,
dan diputuskan daya dukung tanah masih mencukupi karena ketinggian zona TPA
pengembangan sama dengan ketinggian zona eksisting, yaitu 10,5 m (7 lift).
23. 74
4.5 Analisis Curah Hujan
Data curah hujan berguna dalam menghitung prediksi produksi lindi dan
menentukan dimensi lebar saluran drainase yang akan digunakan. Data curah
hujan ini didapat dari kantor BPS dan dapat dilihat di LAMPIRAN H.
4.5.1 Analisis Curah Hujan Maksimum
Perhitungan hujan harian maksimum menggunakan metode Gumble.
Dalam metode ini, data curah hujan rata - rata yang digunakan dari tahun 2012
hingga tahun 2016, yakni nilai Ri adalah curah hujan rata – rata setiap tahun,
sedangkan R adalah rata – rata keseluruhan sebesar 918,133 mm/tahun
(LAMPIRAN I). Dari table tersebut, dapat ditentukan :
R =
0
*
ΣRi ............................... (4.7)
Dimana :
R = Rata – rata
N = Jumlah data
Ri = Jumlah nilai Ri
R =
0
*
ΣRi =
42=0
2
= 918,13 mm
Setelah mendapatkan nilai Ri dan R, dilakukan perhitungan standar deviasi
dari analisis Tabel 4.12
24. 75
Tabel 4.12 Standar Deviasi Curah Hujan
TAHUN Ri (mm) Ri-R (mm) (Ri-R)2
(mm)
2012 931 13 178
2013 1267 349 121621
2014 335 -583 339526
2015 870 -48 2331
2016 1187 269 72289
JUMLAH 4591 0 535946
Menentukan standar deviasi ( δR ) :
δR = V
W (YZ−Y)
2
^−1
`
0/.
.....................................(4.8)
Dimana :
δR = Standar deviasi
(Ri – R)2
= Data curah hujan dikurangi rata-rata dikuadratkan
n = Jumlah data
δR = V
W (YZ−Y)
2
^−1
`
0/.
= [
252=47
210
]0/.
= 366,041
• Untuk n = 5, dari Table of Reduced Mean (Yn) dan Reduced Standard
Deviation (δn) LAMPIRAN J didapatkan :
δ5 = 1,0206
Y5 = 0,5128
Curah hujan harian maksimum dihitung dengan menggunakan rumus :
RT = R +
de
df
(Yt – Yn) ................................................(4.9)
Dimana : δn = Reduced standard deviation
25. 76
Yt = Reduced vaieted yang merupakan fungi dari masa ulang TR
Yn = Reduced mean yang merupakan fungsi banyaknya data
Tabel 4.13 Nilai Reduced Variated (YT)
YT t
0,3665 2
1,4999 5
2,2502 10
3,1985 25
3,9019 50
4,6001 100
5,296 200
6,214 500
6,919 1000
Sumber : Ifah, 2011
• Contoh perhitungan :
PUH (T) = 2 tahun, Y2= 0,3665
Maka R2 = R +
de
dg
(Y2– Y5)
= 918,13 +
577,/40
0,/./7
( 0,3665 – 0,5128)
= 865,659 mm
Rentang keyakinan untuk harga-harga RT
Rk = ± t (a) x Se ………………………………..(4.10)
Dimana :
Rk : Rentang keyakinan (mm/jam)
T(a) : Fungsi a
Se : Probability error (deviasi)
26. 77
Untuk a = 90 % t (a) = 1,64
a = 80 % t (a) = 1,282
a = 68 % t (a) = 1,000
Se =
h H ie
√k
………………………………….. (4.11)
B = l1 + 1 + 1,3o + 1,1 . p. ………………… (4.12)
K =
qrs tf
if
…………………………………….. (4.13)
Untuk hasil perhitungan lainnya (HHMM metode Gumbel dan Rentang
Keyakinannya) dapat dilihat di Lampiran K
4.5.2 Distribusi Hujan
Metode yang dapat digunakan untuk menghitung distribusi hujan ada 3
metode, yaitu :
1. Metode Van Breen
2. Metode Hasper Weduwen
3. Metode Bell
Pemilihan metode yang akan digunakan berdasarkan perhitungan
intensitas hujan yang memiliki nilai intensitas hujan cakupan atau rentang
Intensitas hujan yang berbeda diatas metode – metode lain. Sehingga yang
diambil adalah metode yang memiliki nilai intensitas hujan yang besar. Data
HHM yang digunakan diambil dari dataHHM metode Gembel yang terdapat pada
perhitungan sebelumnya.
27. 78
Berdasarkan perhitungan, metode yang intensitasnya paling besar adalah
metode Van Breen.
Pada metode ini intensitas hujan dapat dihitung dengan menggunakan
rumus sebagai berikut :
I =
=/% H vwx
4
, dimana : R24
= HHM (mm/jam)………………… (4.14)
Contoh perhitungan :
T = 2 tahun
R24
= 865,659 mm/jam
I =
=/% H 672,72=
4
= 194,773 mm/jam
Untuk hasil perhitungan selanjutnya dapat dilihat pada Tabel 4.14 berikut :
Tabel 4.14 Hasil Perhitungan Intensitas PUH Metode Van Breen
PUH R (mm) I (mm/jam)
2 865.659 194.773
5 1272.156 286.235
10 1544.840 347.589
25 1881.364 423.307
50 1990.179 447.790
100 2384.051 536.412
Angka intensitas pada durasi 240 menit : 13, 23, 27, 32, dan 36 (dapat
dilihat di Lampiran L adalah angka pembagi, sedangkan yang lainnya adalah
angka pengali.
28. 79
Langkah selanjutnya yaitu membandingkan intensitas yang didapatkan
melalui metode Van Breen dengan intensitas hujan Kota Surakarta Lampiran M.
Berikut adalah contoh perhitungan intensitas hujan pada durasi tertentu :
Untuk PUH 2 tahun, durasi 5 menit,
I(2.5) =
045,=0
05
x 194,77
= 2156,14 mm/jam
Sehingga didapatkan hasil perhitungan selengkapnya pada Lampiran K
4.5.3 Perhitungan Lengkung Intensitas Hujan
Pada perhitungan pemilihan rumus intensitas hujan digunakan 3 metode,
yaitu :
• Metode Tanbolt
• Metode Sherman
• Metode Ishiguro
Dari ketiga metode tersebut, yang akan banyak digunakan adalah metode
yang memiliki nilai lengkung intensitas yang paling kecil. Sedangkan PUH yang
digunakan adalah PUH 2, 5, 10 karena PUH tersebut berturut-turut dianggap
sesuai untuk perencanaan saluran tersier, sekunder, primer. Perhitungan dilakukan
dengan durasi 5, 10, 20, 40, 60, 120, 240 menit.
Berdasarkan perhitungan, metode yang mempunyai lengkung intensitas
terkecil terdapat pada metode Talbot.
I =
L
P:y
………………………………………. (4.15)
29. 80
a =
(∑ {.-)|∑ {w}1(∑{w.-)(∑{)
k (∑{w)1(∑{)w
…………………….. (4.16)
b =
(∑I)(∑I.t) - N (∑{w.t)
k (∑ {w)1 (∑{)w
……………………………. (4.17)
Hasil perhitungan nilai a dan b untuk lengkung intensitas dengan Metode Talbot
dapat dilihat pada Tabel 4.15. Perhitungan lengkungan intensitas hujan metode
Talbot selengkapnya dapat dilihat di Lampiran N.
Tabel 4.15 Hasil Perhitungan Lengkung Intensitas Metode Talbot
PUH a b
SPUH 2 36642.209 14.187
SPUH 5 53925.429 21.540
SPUH 10 65439.863 21.535
4.6 Perencanaan Drainase
4.6.1 Koefisien Pengaliran C
Koefisien C pada rumus Q = 1/36 x C x I x A adalah koefisien yang
disebabkan oleh infiltrasi dan kehilangan air untuk suatu wilayah. Dimana nilai
dari koefisien C tergantung dari jenis permukaan wilayah tersebut, diambil nilai
rata-ratanya dengan menggunakan rumus berikut :
Cgabungan =
Ç ÉÑ.ÖÑ
Ç ÖÑ
...................................................... (4.18)
Ci = Koefisien pengalir untuk bagian daerah yang ditinjau
Ai = Luas bagian daerah
30. 81
Gambar 4.8 Koefisien Aliran Permukaan C
Dari data diatas digunakanlah :
C taman = 0,25
C jalan aspal = 0,9
C bangunan fasilitas = 0,5
Contoh perhitungan Cgabungan :
Dari data didapat luas area sebagai berikut:
Luas bangunan fasilitas = 0,007654 km2
Luas jalan aspal = 0,00677 km2
L taman = 0,04245 km2
31. 82
Cgabungan =
Ç ÉÑ.ÖÑ
Ç ÖÑ
=
(/,.2A/,/4.42):(/,=H/,//788):(/,2H/,//872)
/,/4.42:/,//788:/,//872
= 0,361
Perhitungan selengkapnya untuk C gabungan di setiap titik saluran dapat
dilihat di Lampiran O
4.6.2 Perhitungan Debit Saluran
Drainase di TPA dibutuhkan untuk menampung air hujan dan
menyalurkannya ke badan air. Menurut PerMen PU Nomor 3 Tahun 2013,
drainase terbagi menjadi dua, yaitu drainase permanen dan sementara. Drainase
permanen merupakan drainase yang berada disekitar kantor, jembatan timbang,
hangar TPA dan area utilitas lain yang bukan sel landfill. Sedangkan drainase
sementara yaitu drainase yang berada disekitar sel landfill.
Terdapat 3 jenis bentuk saluran drainase, yaitu segiempat, trapezium dan
setengah lingkaran. Tugas akhir perencanaan ini menggunakan bentuk segiempat
yang terbuat dari batu kali di area sel landfill dan menggunakan precast di area
permanen.
Langkah awal yang dilakukan yaitu menentukan debit saluran. Contoh
perhitungan pada saluran d1-d2 :
Panjang limpasan terjauh (Lo) = 90 m
Beda tinggi muka tananh antara limpasan terjauh dengan saluran (Ho) = 0.55 m
Slope limpasan (So) = Ho/Lo = 0,006
n = 0,015 (lapisan beton)
32. 83
Panjang Saluran (Ld) = 90 m
V yang diasumsikan = 0,6 m/dt
Cr = 0,8
Pengukuran to pada jarak limpasan kurang dari 1000 m maka digunakan rumus :
To =
0/6 A ; A Üáà/â
äáà/â ………………………………… (4.19)
Td =
ÜR
ã LTJBTN A 7/
…………………………………..(4.20)
Tc = to + td …………………………………………….(4.21)
Dengan data diatas, contoh perhitungan sebagai berikut :
To =
0/6 A /,/02 A =/à/â
/,//7à/â
= 29,952
Td =
=/
/,7 A 7/
= 2,5
Tc = 39,952 + 2,5 = 42,452 menit
Saluran drainase di TPA merupakan saluran tersier. Nilai yang digunakan
untuk saluran tersier adalah PUH 2 tahun. Akan tetapi dalam tugas perencanaan
ini, perencana menggunakan PUH 5 tahun sebagai angka keamanan untuk
mencegah luapan air drainase. Perhitungan lengkung intensitas dicari yang
terkecil dan didapatkan bahwa untuk PUH 5 tahun metode yang cocok adalah
metode Talbot.
I =
L
På (BS;NP):y
33. 84
=
25=.2,4.=
4.,42.:.0,24
= 842.693 mm/jam
Q = (1/360) x Cr x I (mm/dt) x A (m2
)………………………………………(4.22)
Perhitungan selengkapnya untuk masing – masing saluran pada Lampiran P.
4.6.3 Perhitungan Dimensi Saluran
Setelah mendapatkan debit limpasan, langkah selanjutnya yaitu
menentukan dimensi saluran. Saluran yang digunakan merupakan saluran
berbentuk segi empat dengan perencanaan saluran berdasarkan penampang
hidrolis optimum sehingga luas penampang dapat memiliki daya tampung
maksimum. Gambar berikut adalah bentuk dari saluran yang direncanakan, dapat
dilihat pada Gambar 4.9
Gambar 4.9 Bentuk Saluran Perencanaan
34. 85
A = b x h …………………………………………… (4.22)
P = b +2h …………………………………………...(4.23)
Dimana : b = Lebar Saluran (m)
H = Tinggi/kedalaman Saluran (m)
R =
ç
é
=
y A M
y:.M
…………………………………………… (4.24)
Dimana : R = Jari – Jari Hidrolis
A = Luas Penampang Basah Saluran (m2
)
P = Keliling Saluran Basah (m)
Q = v x A ………………………………………………….. (4.25)
Berdasarkan persamaan Manning :
V =
0
;
x R./5
x S0/.
…………………………….......... (4.26)
H = [
í A ;
.à/â A √ä
]5/6
……………………………………. (4.27)
Slope yang digunakan untuk perencanaa ini sedapat mungkon mengikuti slope
medan/kondisi lapangan yang ada.
Sd = DHd : Ld
Contoh perhitungan dimensi pada saluran d1-d2
Q = 0.2466 m3
/dt
Ld = 90 m
DHd = 0.55 m
Sd = DHd : Ld = 0.0061
N = 0.015 (saluran terbuat dari beton)
35. 86
Hair = [
í A ;
.à/â A √ä
]5/6
= [
/,.477 A /,/02
.à/â A √/,//70
]5/6
= 0,292 m
B = 2 x h = 2 x 0,292
=0,584 m
A = b x h = 0,584 x 0,292
= 0,169 m2
R = h/2 = 0,292/2
= 0,146 m
4.6.4 Penentuan dimensi FB (Freeboard Saluran)
Freeboard saluran merupakan area jagaan atau ketinggian dalam saluran
dimana tidak terkena aliran dari Q yang sebenarnya. Freeboard adalah lebihan
ketinggian saluran dari yang tidak terisi air. Dimendi freeboard dapat ditentukan
dengan rumus berikut :
Fb = lC . hLNï …………………………………………… (4.28)
Dimana : Fb = Freeboard saluran (m)
C = koefisien
Q < 0,6 m3
/dt -> C = 0,14
0,6 m3
/dt < Q < 8 m3
/dt -> 0,14 < C < 0,2
Q > 8 m3
/dt -> C > 0,23
36. 87
Contoh perhitungan untuk saluran d1 – d2 :
Q = 0,2466 m3
/dt maka C = 0,14
Hair = 0,292 m
Fb = √0,14 . 0,292 = 0,202 m
Sehingga, hsaluran = hair + Fb = 0,292 + 0,202 = 0,494 m
Dengan demikian didapatkan dimensi saluran d1 – d2
B : H = 0,584 m : 0,494 m
= 58,4 cm : 49,4 cm
Untuk hasil perhitungan selengkapnya tentang dimensi saluran dapat
dilihat pada Lampiran Q dan dimensi saluran yang dipakai dapat dilihat di
Lampiran R.
4.7 Perhitungan Masa Pakai TPA Pengembangan
Masa pakai atau umur TPA pengembangan dapat dihitung dengan
membandingkan volume sampah yang akan ditimbun di TPA dengan kapasitas sel
yang tersedia. Contoh perhitungannya dapat dilihat sebagai berikut :
Perhitungan tahun pertama (2017) yang direncanakan :
a. Volume sampah setelah dipadatkan di Zona TPA = (jumlah sampah yang
masuk ke TPA x 1000)/kepadatan sampah di TPA
= 86088 ton/tahun x 1000/ 600 kg/m3
= 143480 m3
/tahun
b. Volume tanah penutup = 20% x 143480 m3
/tahun
= 28696 m3
/tahun
37. 88
c. Total Volume sampah dan tanah penutup (timbunan)
= 143480 m3/tahun + 28696 m3/tahun
= 172176 m3
/tahun
d. Masa Pakai
= Volume komulatif timbunan/volume komulatif kapasitas zona
= 172176 m3
/tahun / 1323829,21 m3
= 0,13
Hasil perhitungan masa pakai tersebut selanjutnya dilakukan rumus
roundup pada Microsoft excel. Batas nilai yang diijinkan yaitu 1 untuk hasil
roundup. Jika lebih dari itu , maka zona TPA melebihi masa pakainya. Masa pakai
TPA terhitung 6 tahun (2017-2022). Perhitungan dapat dilihat di Tabel 4.16.
Tabel 4.16 Perhitungan Masa Pakai TPA
Tahun
Total Timbunan
Yang
Diakumulasikan
Akumulasi
Volume Zona Zona TPA
Zona TPA
(Setelah
Roundup)
(m3/tahun) m3
2017 172175.7201 1323829.205 0.130058862 1
2018 350977.4673 1323829.205 0.265122922 1
2019 536660.2382 1323829.205 0.4053848 1
2020 729488.8429 1323829.205 0.551044531 1
2021 929738.2823 1323829.205 0.702309844 1
2022 1137694.141 1323829.205 0.859396466 1
2023 1353652.992 1323829.205 1.022528425 2
2024 1577922.825 1323829.205 1.19193837 2
2025 1810823.48 1323829.205 1.367867904 2
2026 2052687.107 1323829.205 1.550567927 2