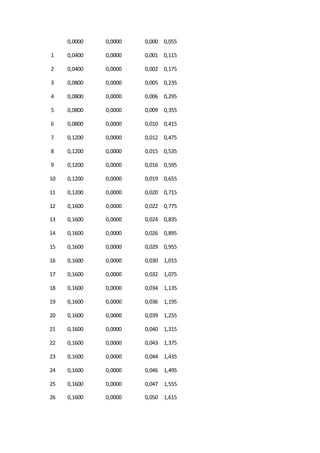
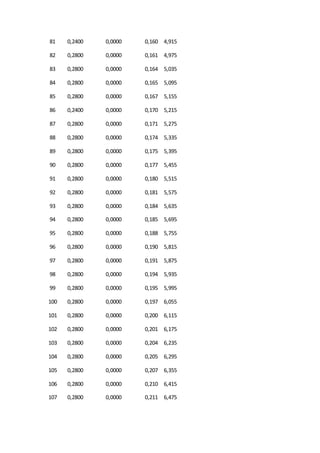
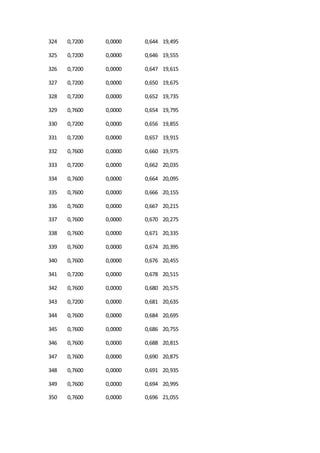
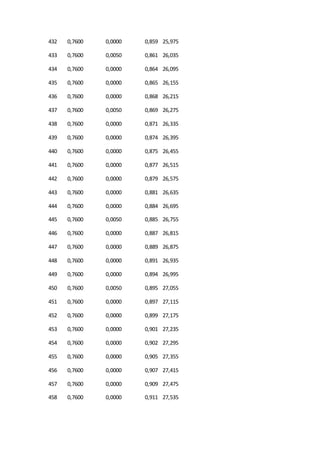
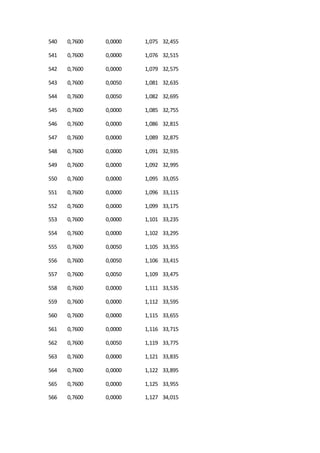
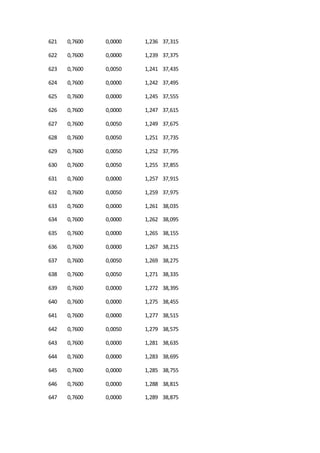
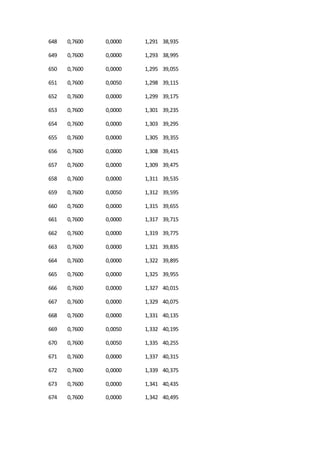
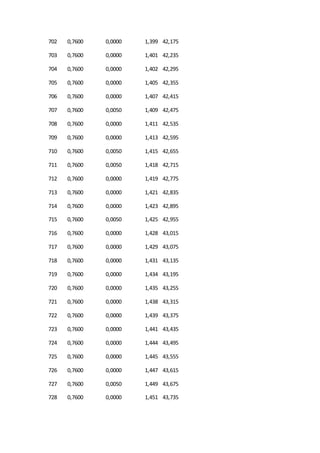
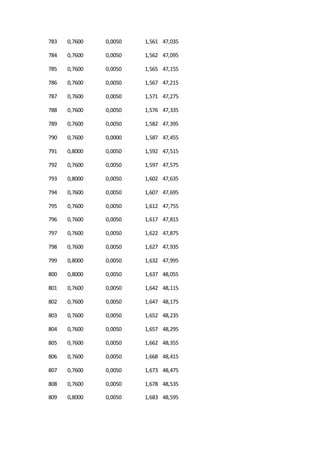
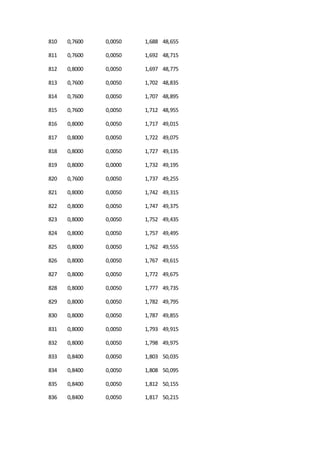
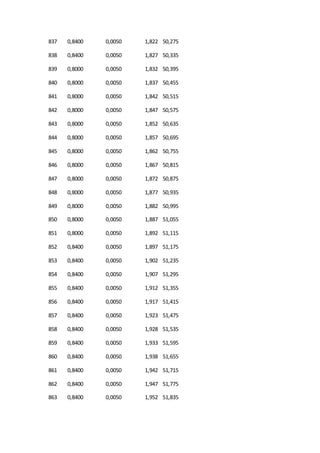
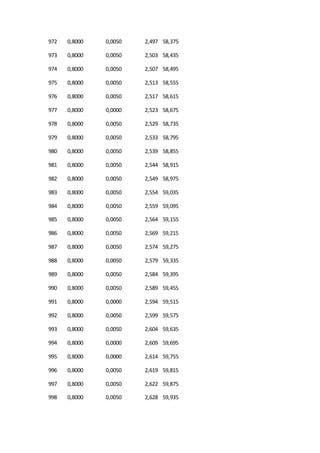
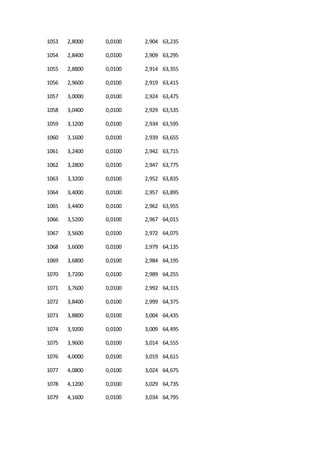
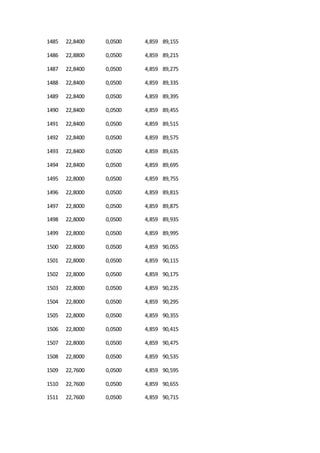
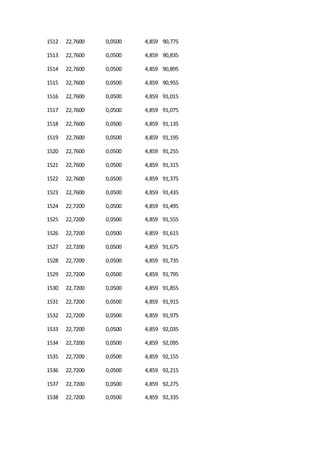
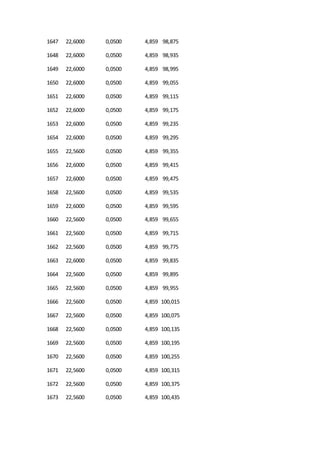
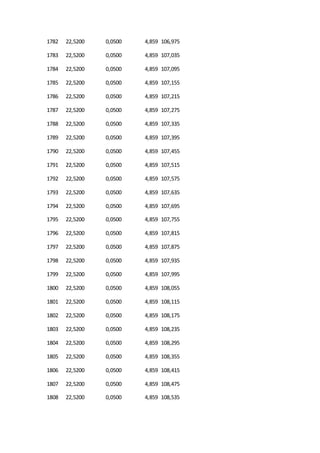
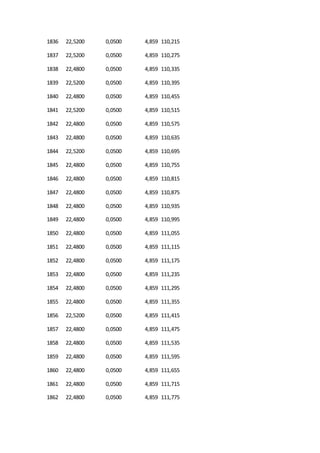
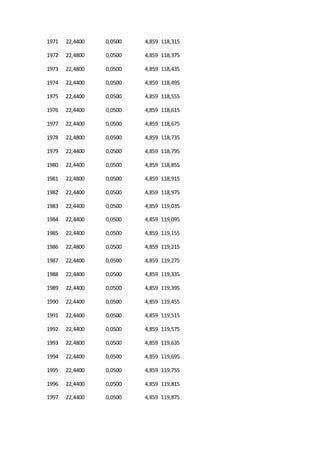
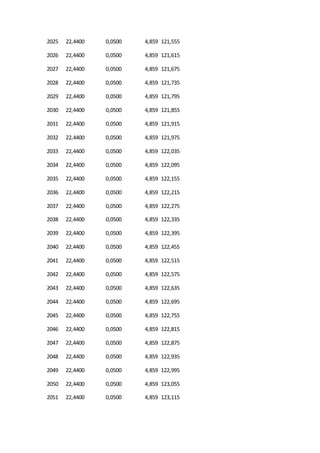
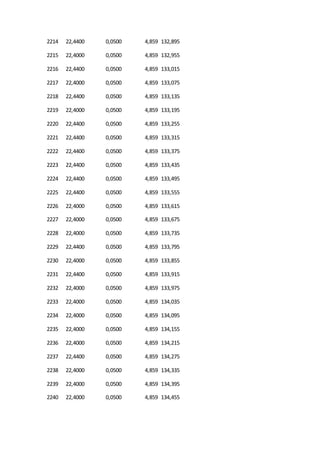
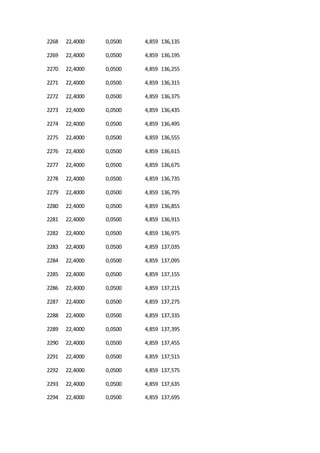
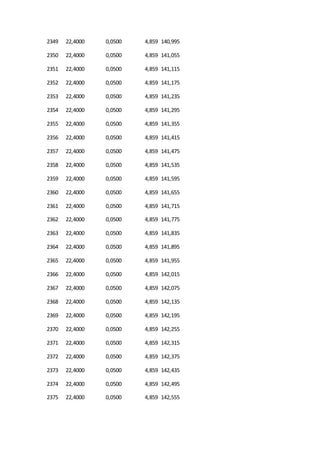
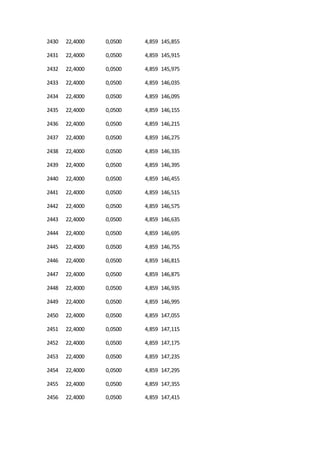
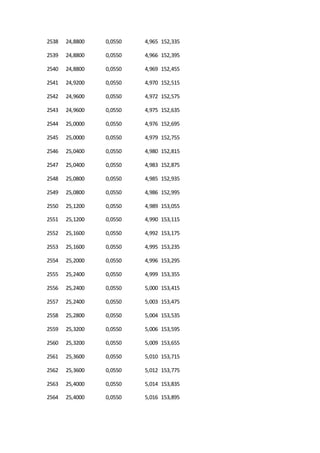
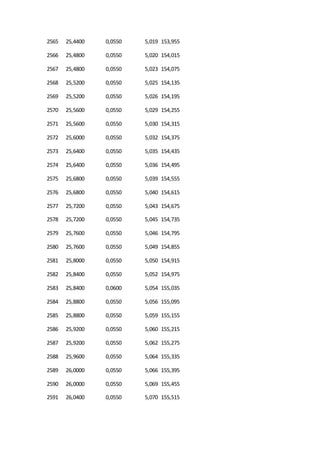
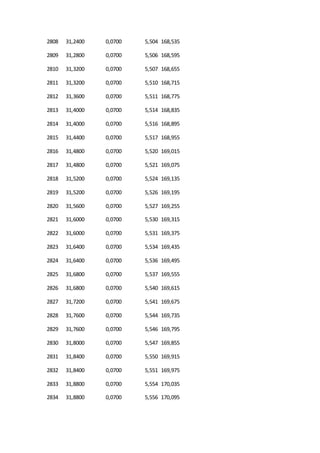
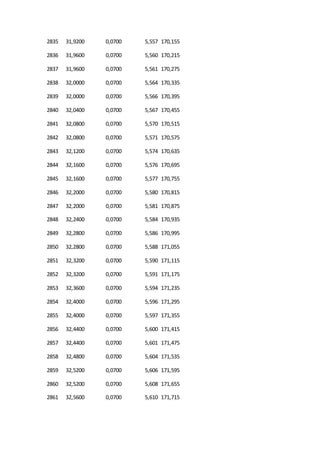
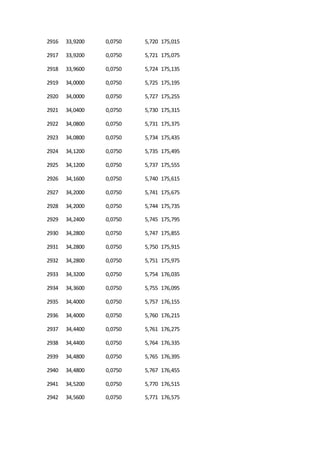
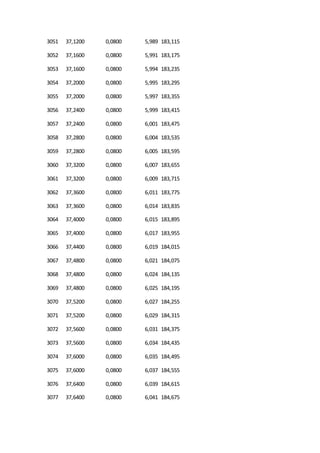
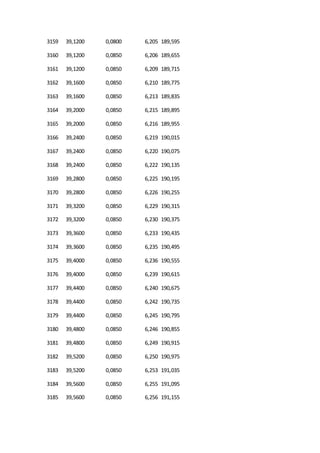
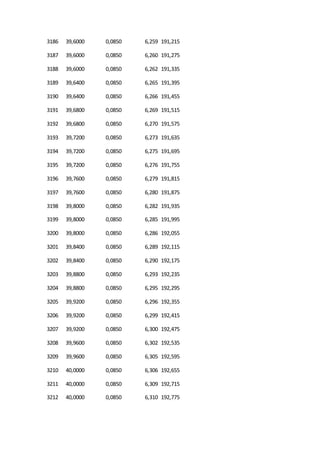
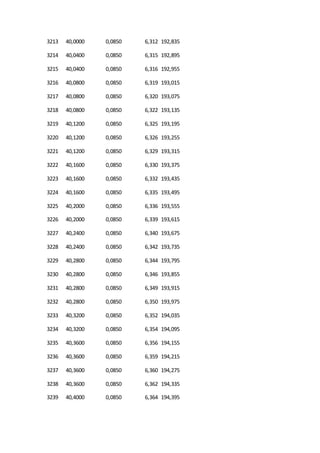
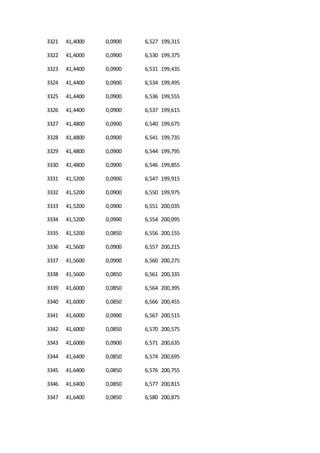
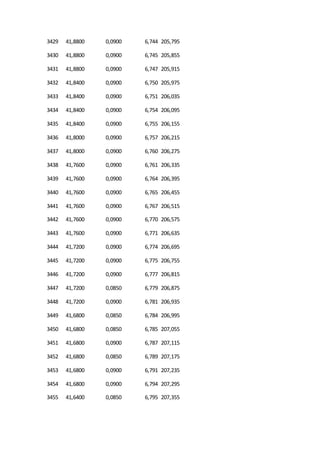
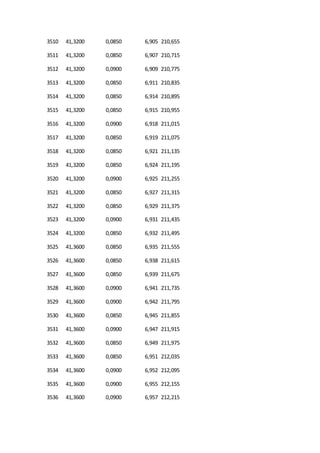
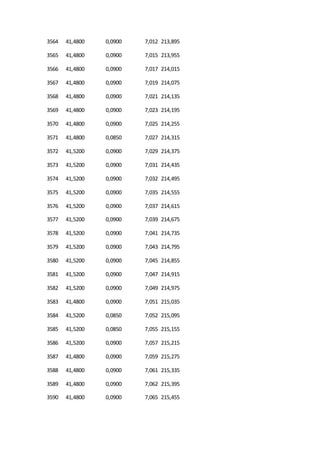
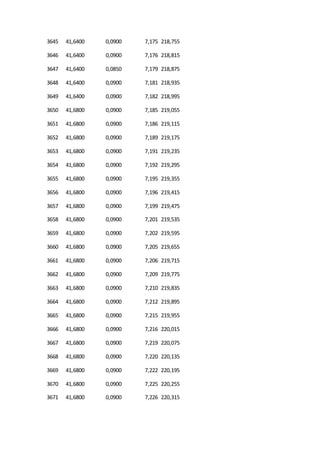
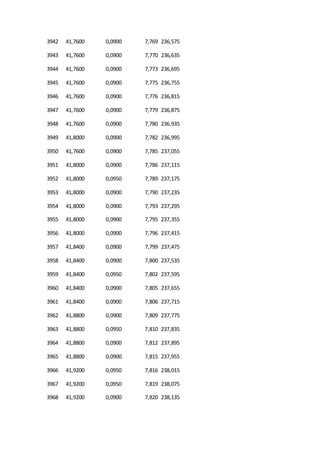
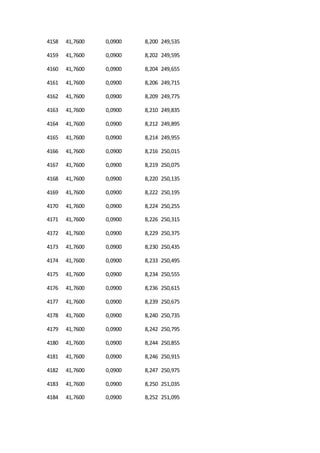
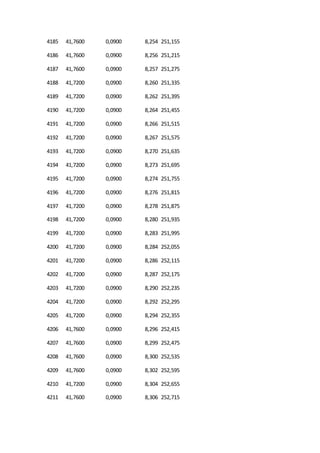
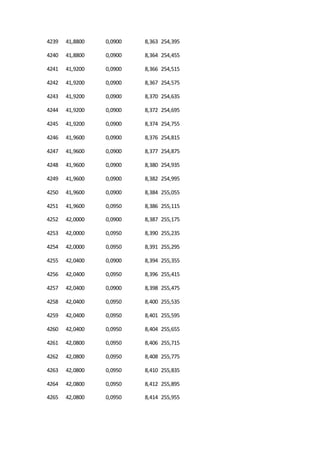
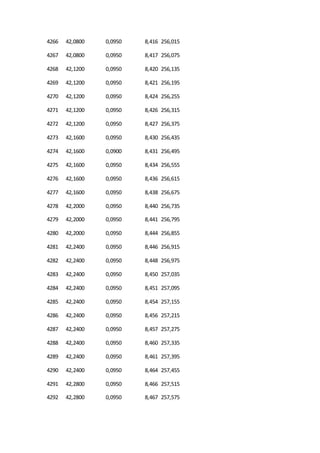
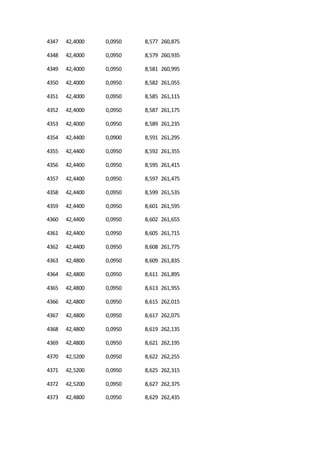
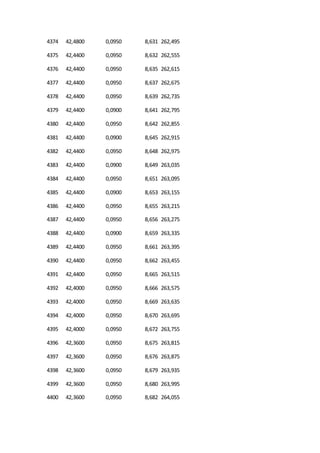
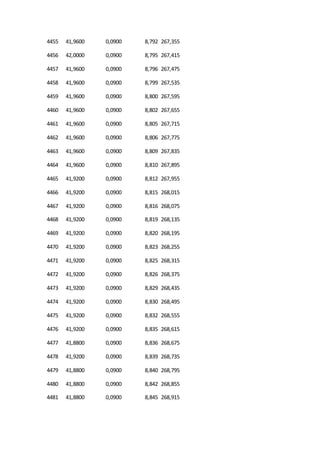
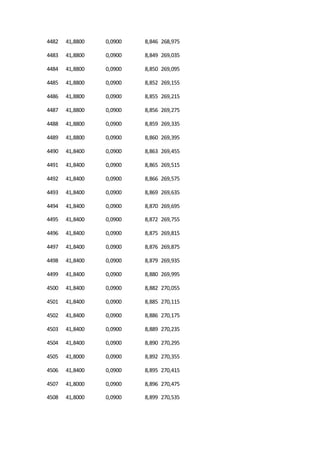
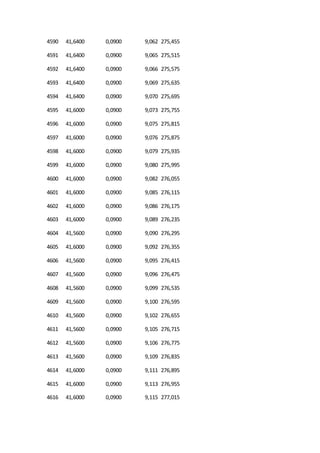
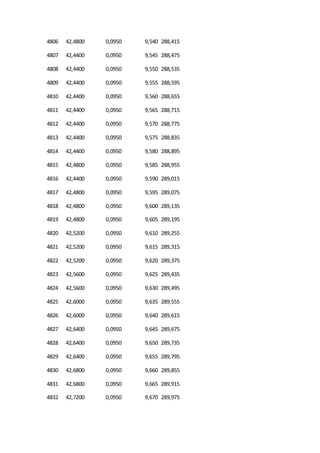
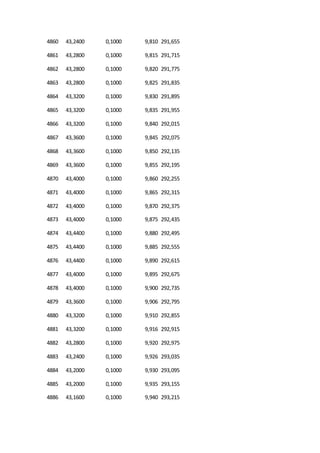
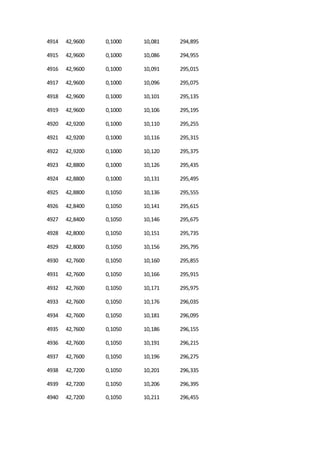
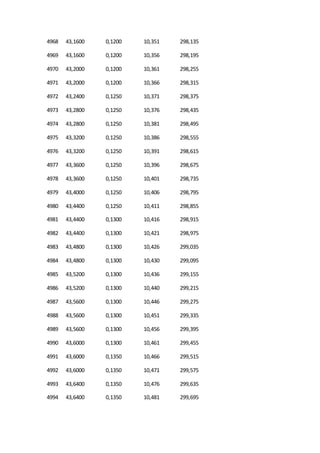
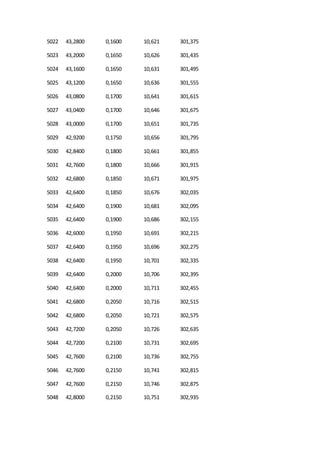
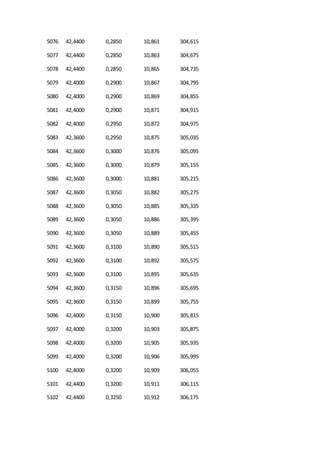
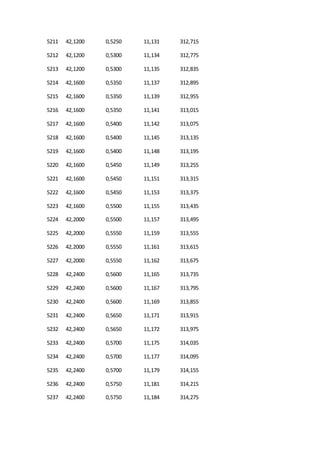
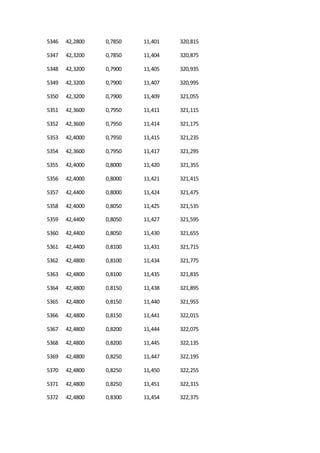
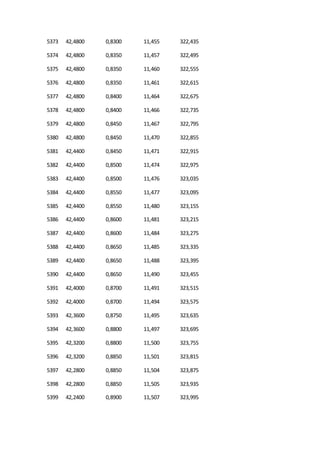
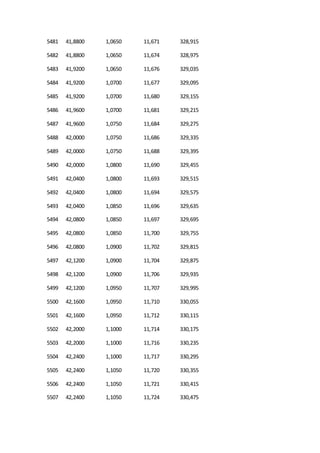
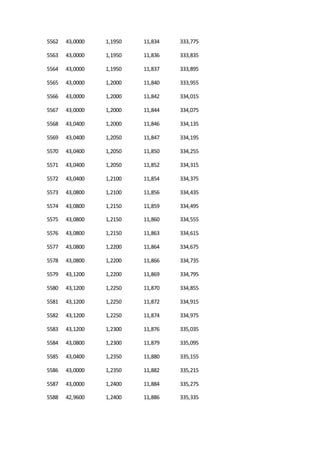
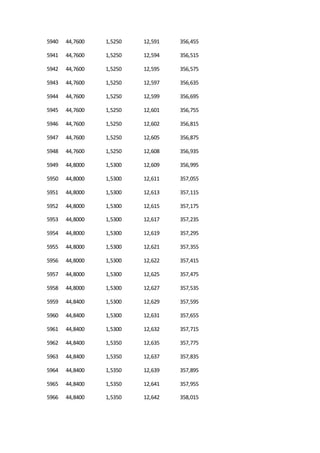
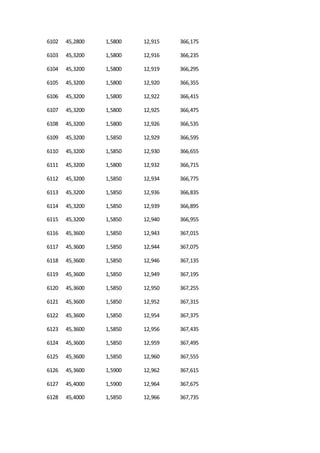
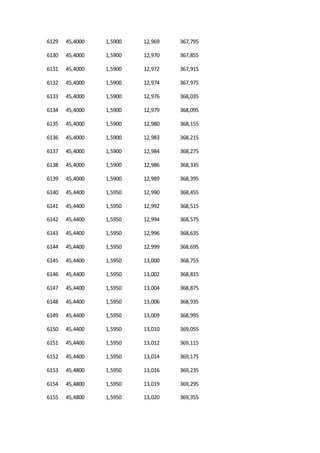
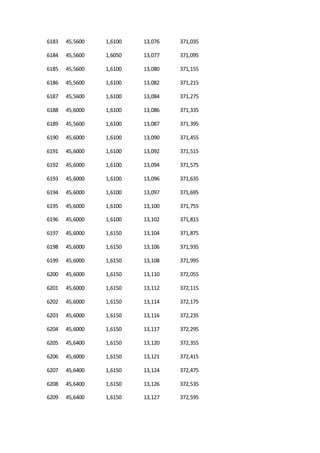
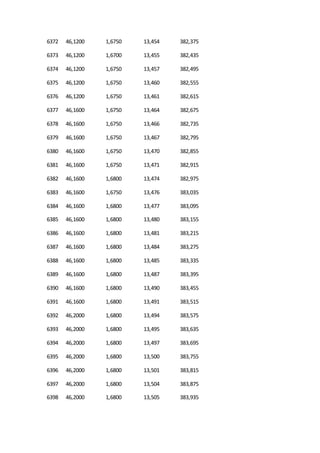
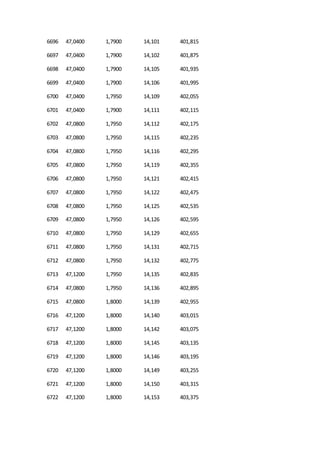
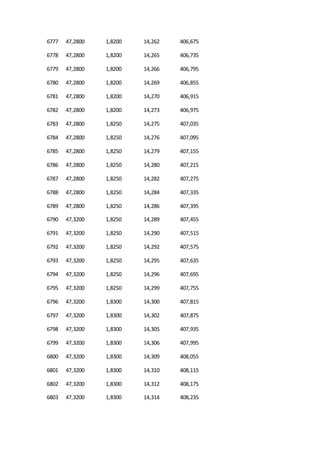
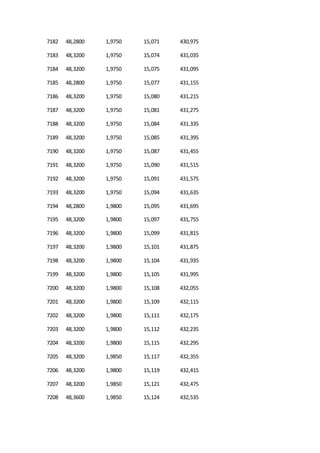
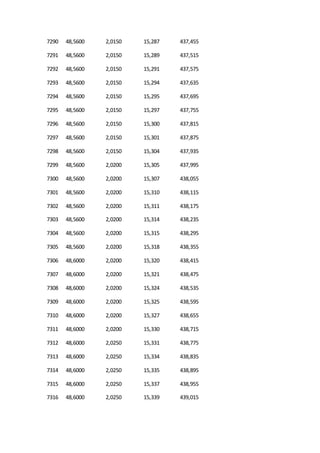
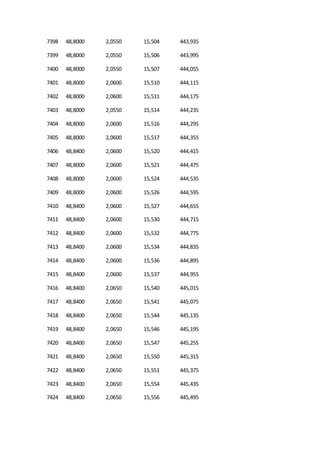
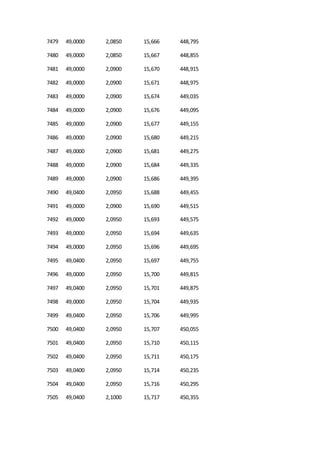
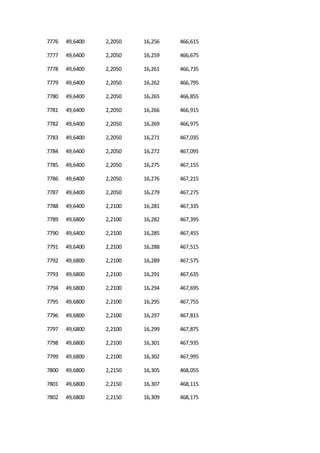
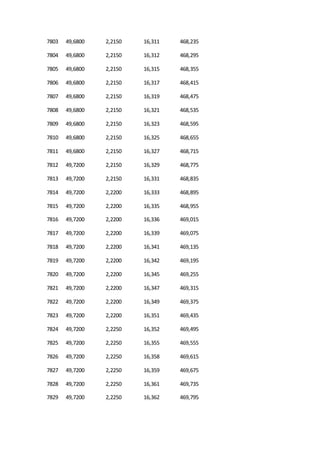
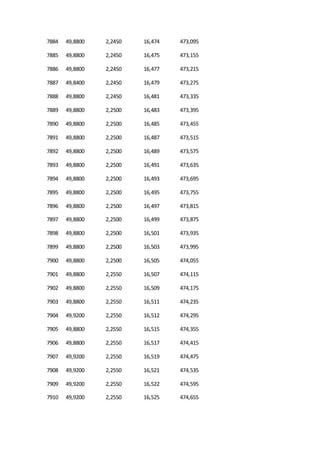
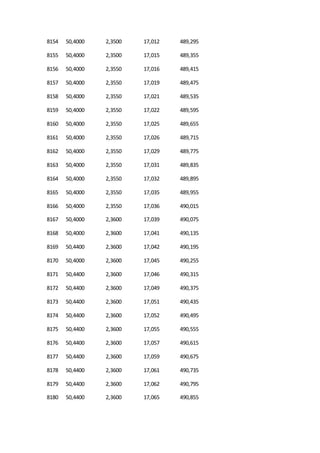
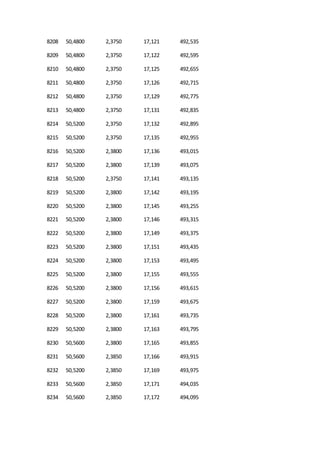
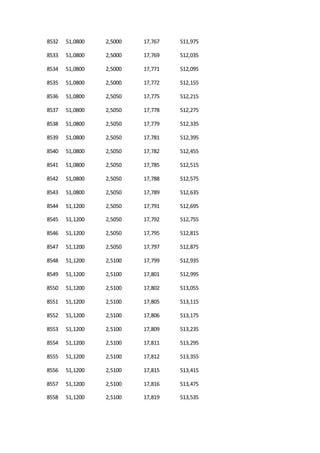
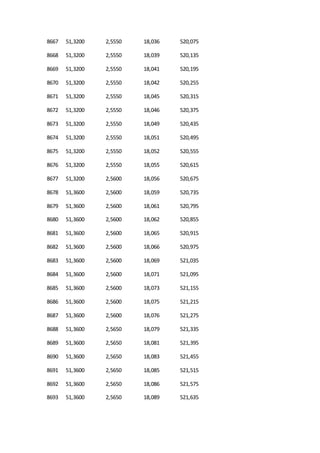
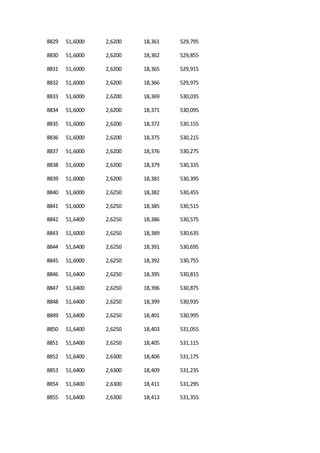
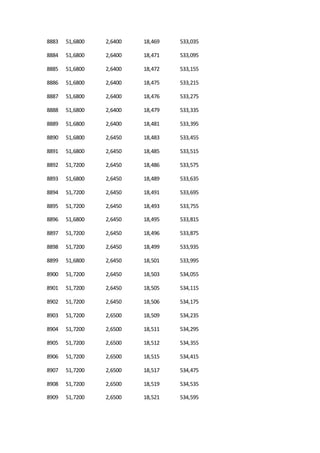
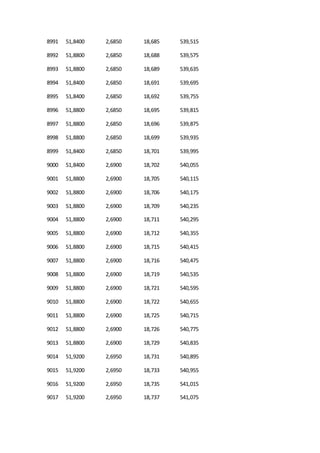
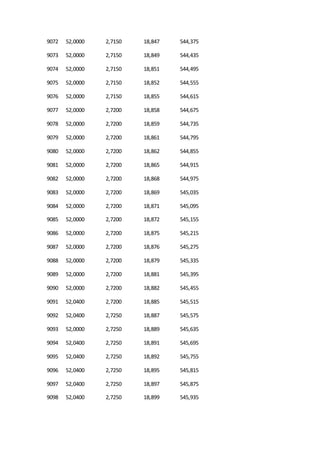
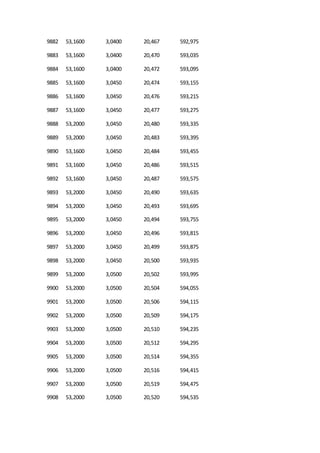
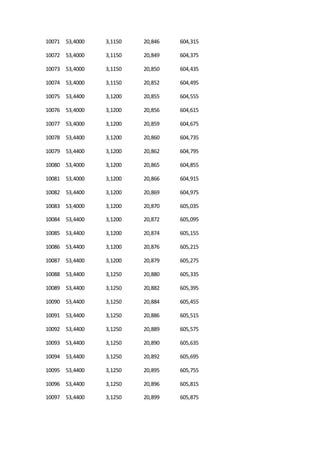
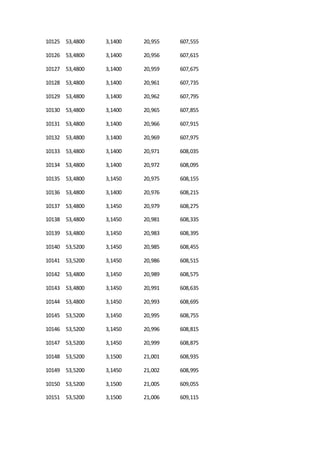
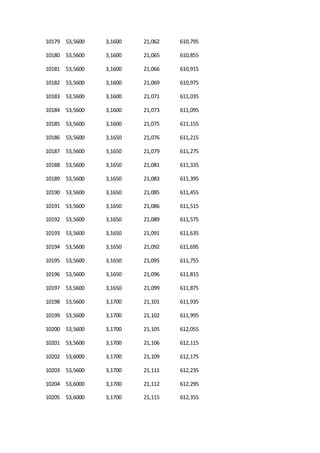
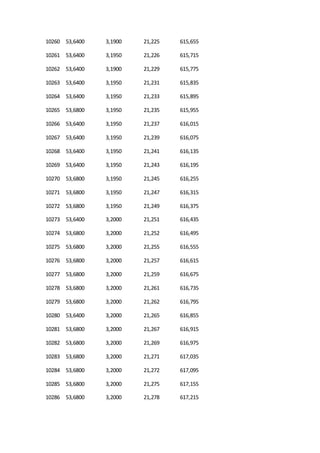
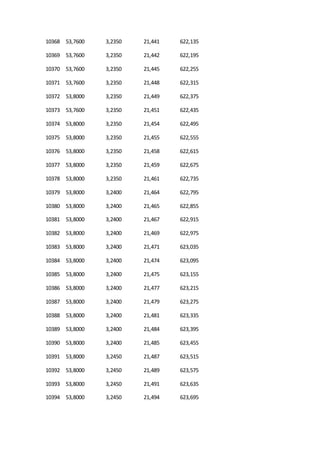
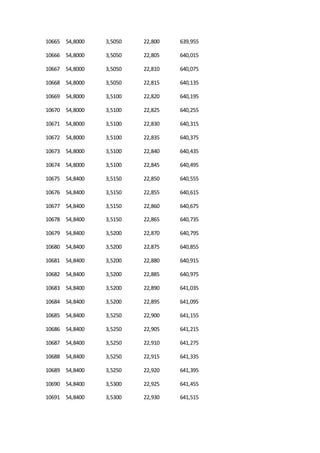
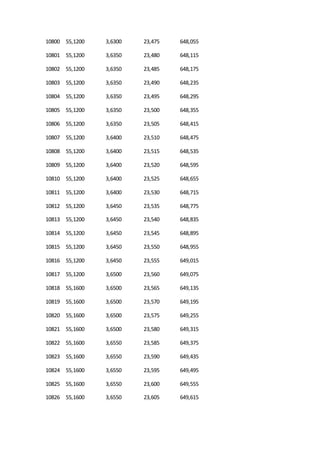
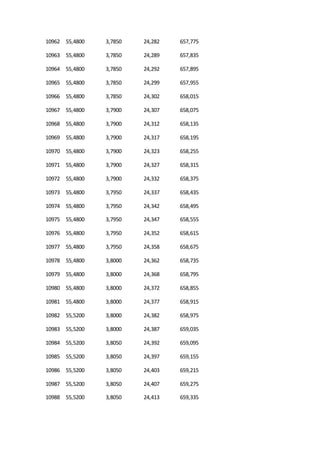
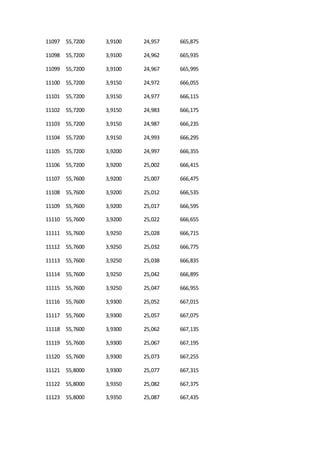
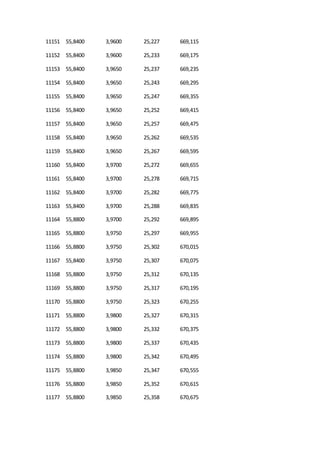
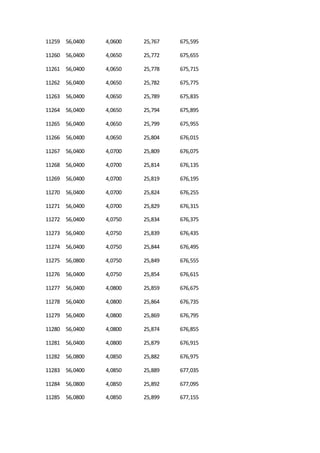
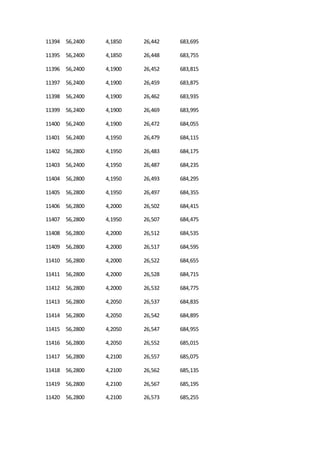
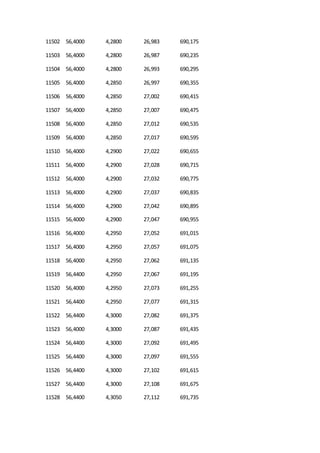
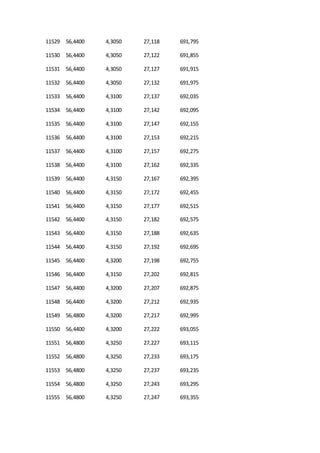
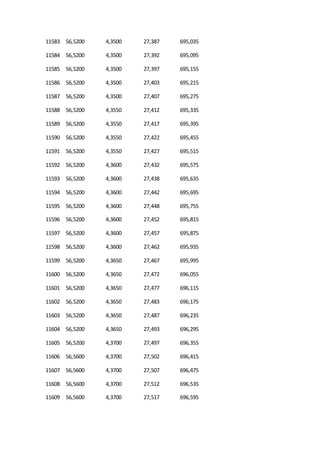
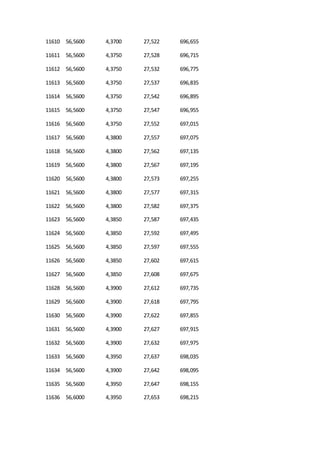
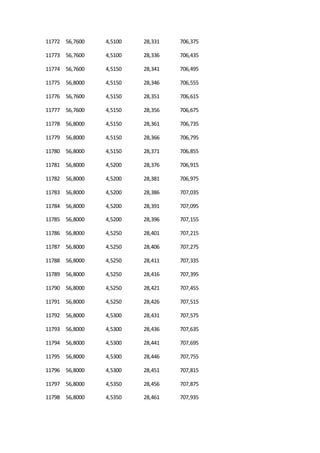
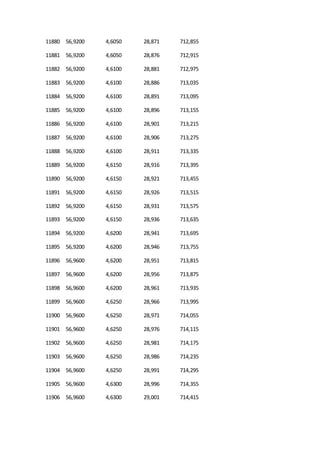
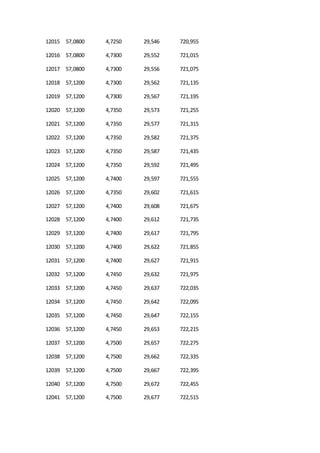
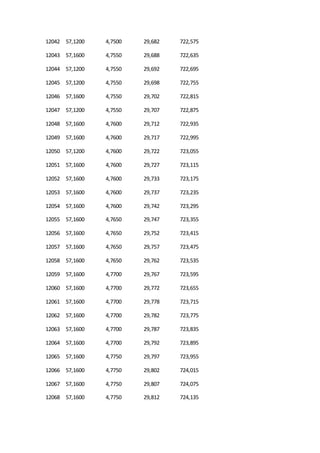
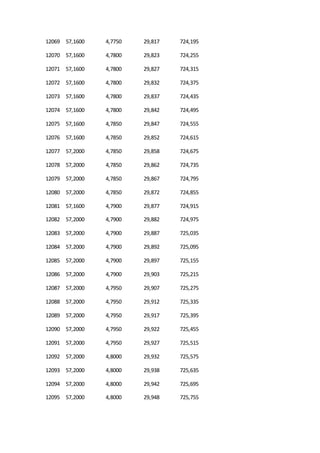
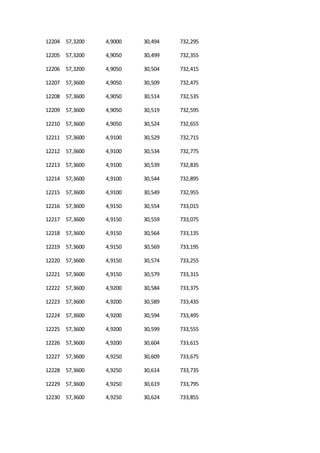
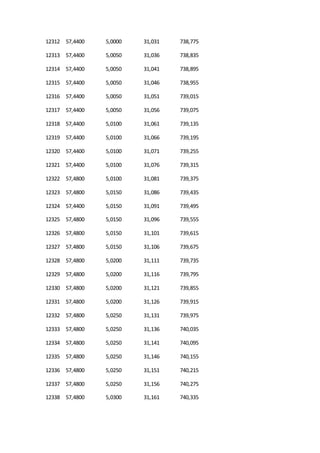
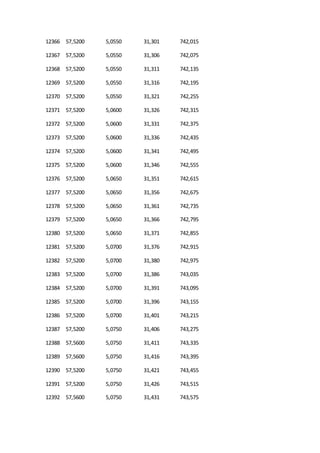
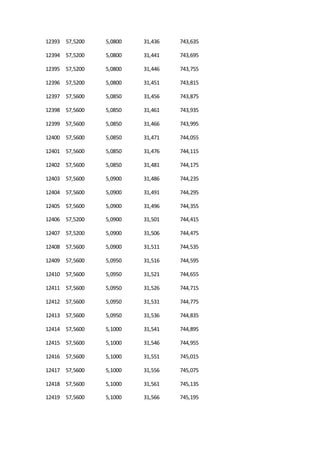
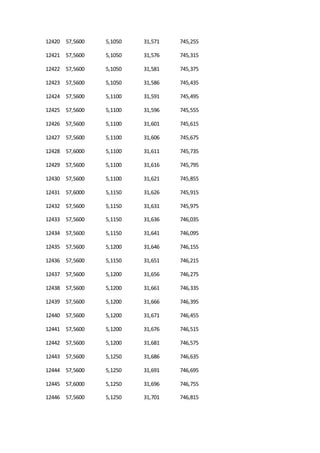
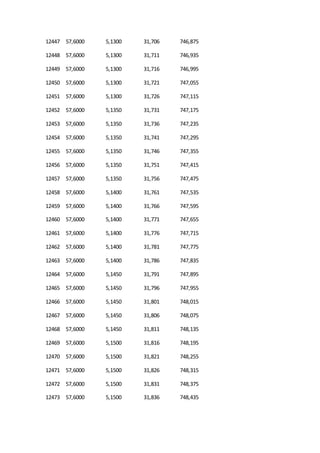
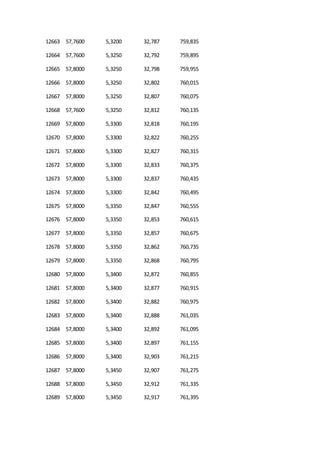
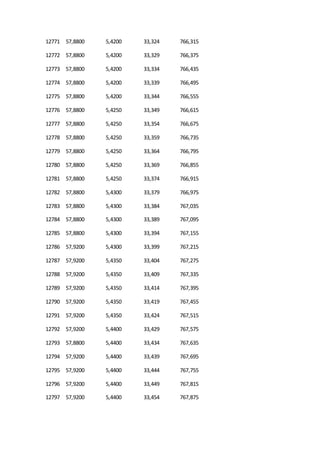
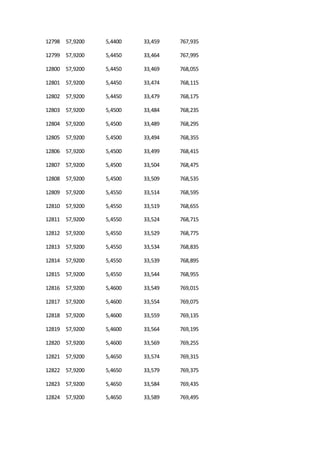
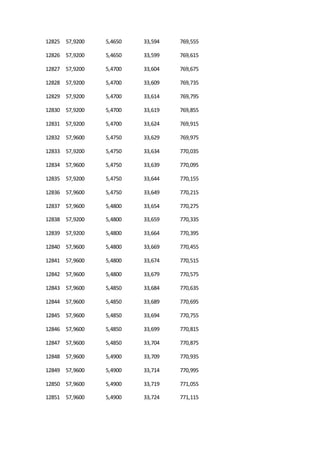
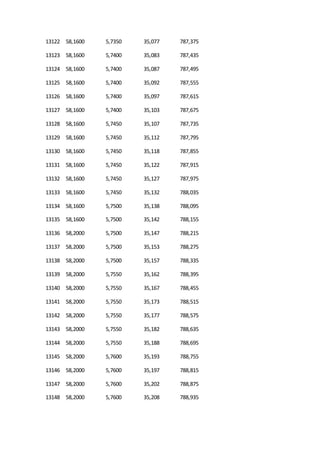
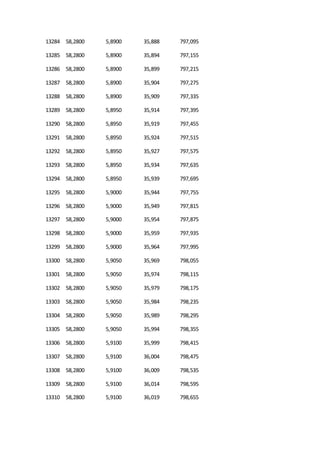
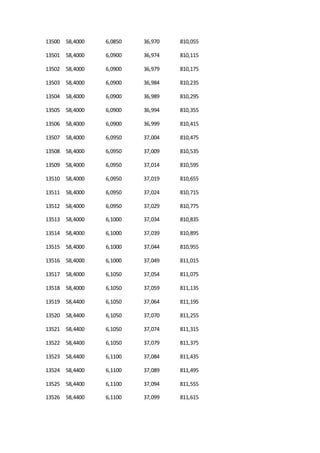
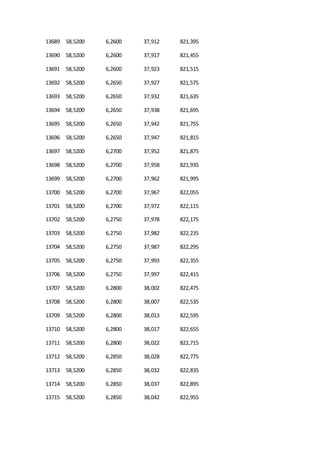
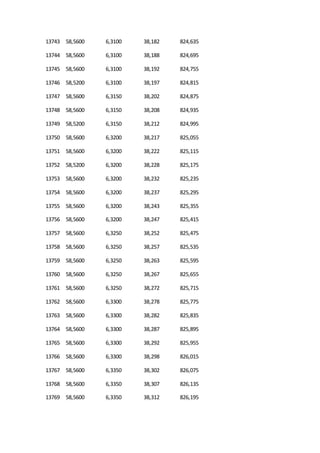
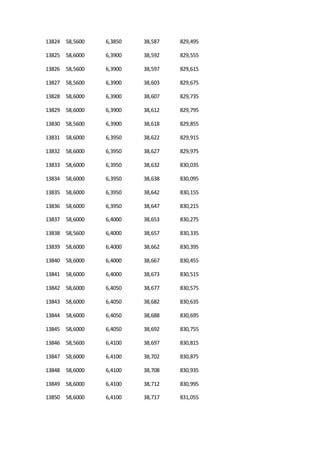
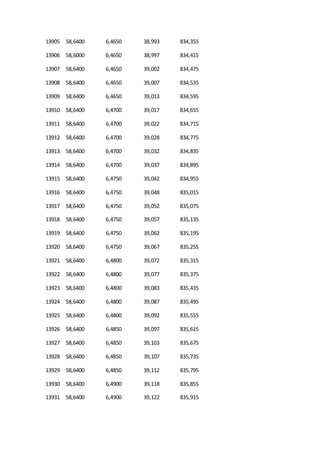
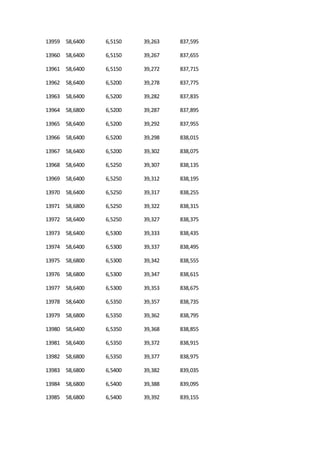
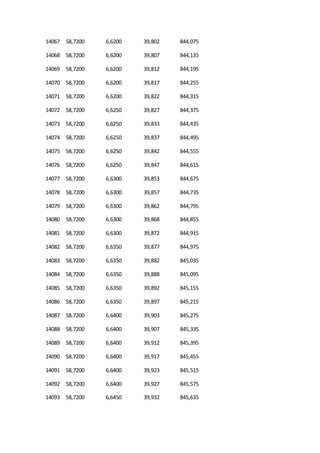
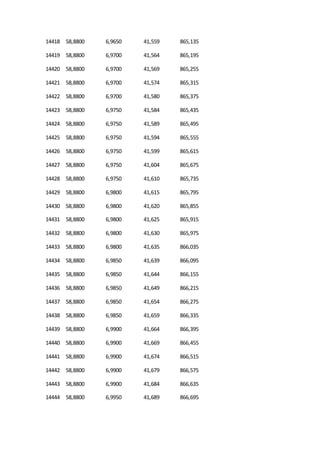
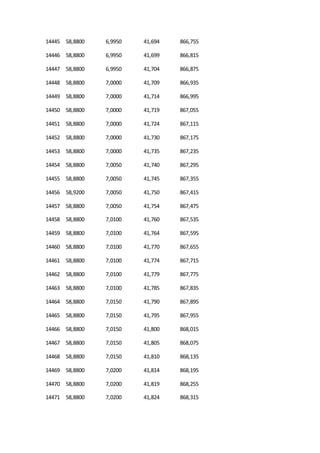
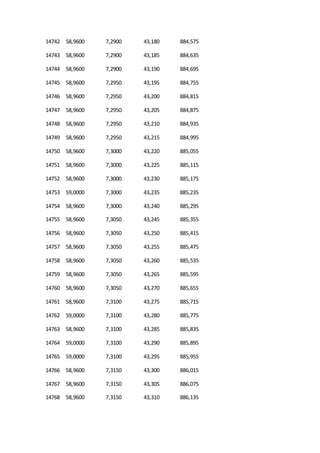
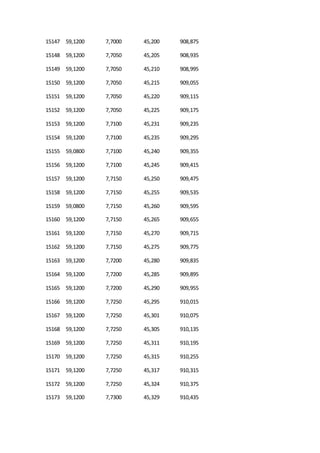
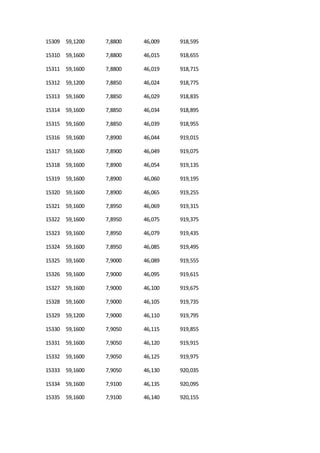
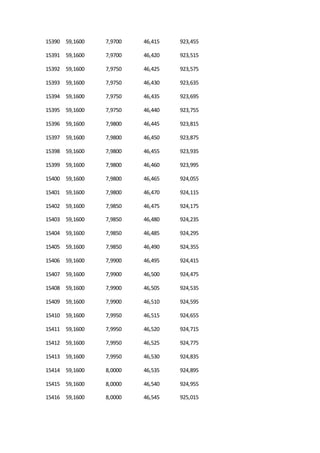
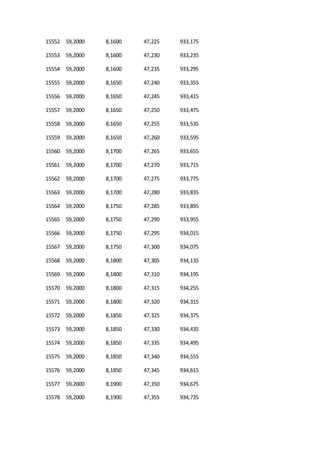
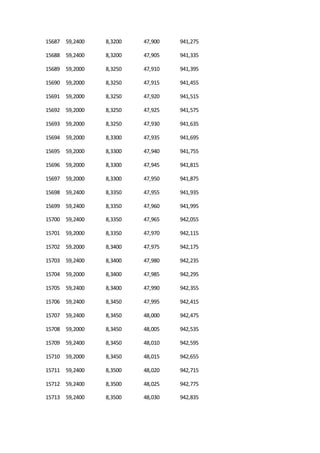
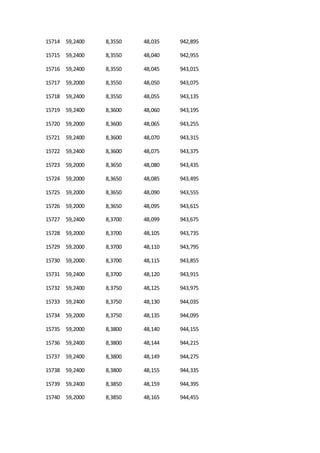
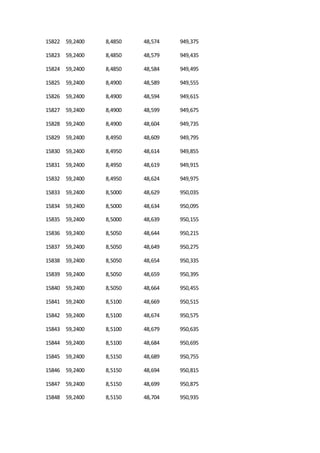
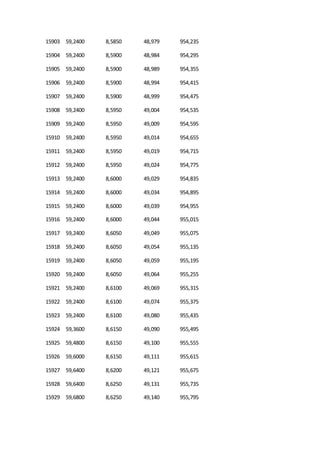
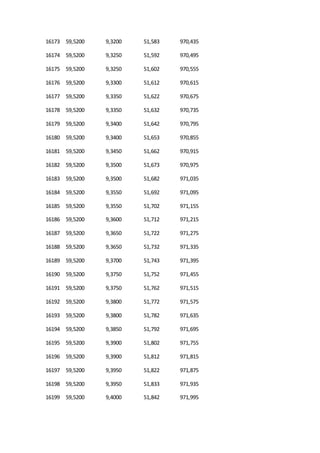
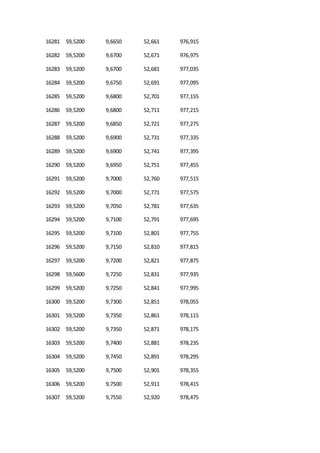
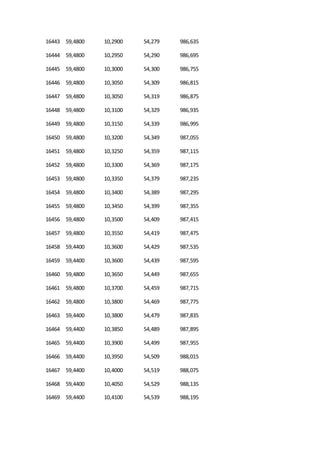
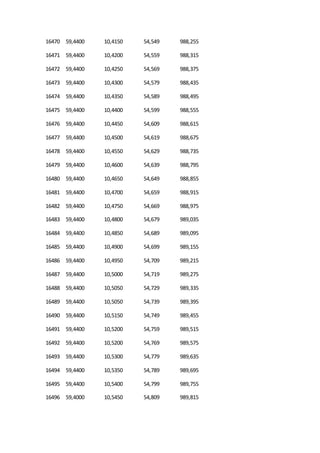
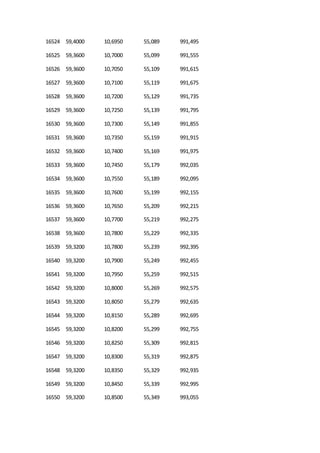
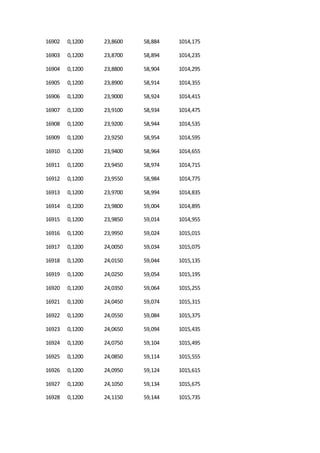
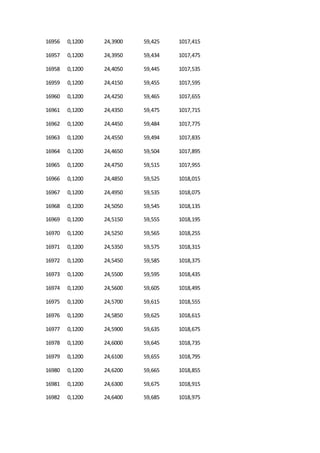
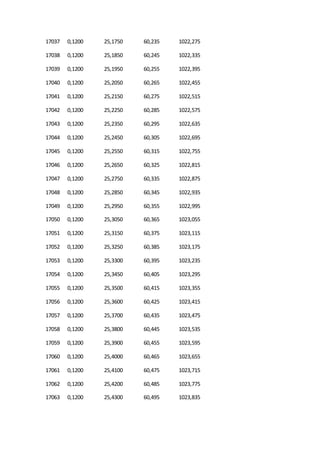
The document appears to contain numerical data in a table format organized with 4 columns and multiple rows. The first column contains numbers incrementing by 1 from 0 to 191. The second through fourth columns contain numerical values that also increment at varying levels through the rows. The data likely describes some type of test or measurement results collected over multiple time periods.
The document appears to be a list ranking individuals from 1st to 171st place based on their scores on three assessments: Note 1, Note 2, and Concurso. Each individual's total score is calculated by adding their scores on the three assessments. The individuals are ranked from highest total score to lowest total score.
Beijing Huanqiu Guangyang Bearings Co.,Ltd(GPZ Bearing), the professional manufacturer and exporter of high quality ball and roller bearings with more than 20 years of experience to meet the customers require.
We have won good market in Eastern European countries,Southeast Asia,American countries.
Choose GPZ Bearing to won your market based on quality guarantee.
We thank you for your attention and look forward to the cooperation with you!
Sincerely Yours,
Alan Yu
Export Manager
BEIJING HUANQIU GUANGYANG BEARINGS CO.,LTD
Tel:86-15101602678
Fax:86-319-6112678
Cell: 86-15032602678/ 15354192678
Email: alan@gpzbearing.com
Yahoo: gpzbearing@yahoo.com
MSN: gpzbearing@live.com
Gmail: gpzbearing@gmail.com
Skype: gpzbearing
Web: www.gpzbearing.com / www.gpzbearing.net
The document appears to contain a table of numerical values organized in a grid with 26 rows and varying columns from 0 to 62. The values generally increase moving from left to right across each row and downward in each column. The highest values are near the bottom right of the table and the lowest values are near the top left.
The document provides information on thin section, slewing rings, and other bearing products. It lists various bearing series and part numbers. Specific pages are dedicated to thin section Conrad ball bearings in inch series, including their part numbers, dimensions, dynamic capacities, and weights. Engineering support is available from sales representatives.
This document contains monthly financial data from 2014 for various categories such as mining, industry, construction, transportation, communications and others. It provides the revenue, expenditures, profits and other financial figures for each sector in each month of the year. The data is presented in a table with columns for the category, monthly figures, and a total for the year.
The document provides pay scales for government employees in Pakistan from 1983 to 2017 according to the BPS (Basic Pay Scale) system. It lists the minimum and maximum salary rates for employees in BPS 1 to 30 for each time period. The pay scales are adjusted over time with periodic wage increases. Contact information is provided at the bottom for inquiries.
Yıdız Teknik Üniversitesi - Rüzgr Günleri Sunum - 29032016Bahadır Bulut
The document discusses wind data analysis and measurement equipment recommendations. It provides an overview of Kintech Engineering and their products, including data loggers and sensors for measuring wind speed, direction, temperature, pressure and more. Examples of data output are shown containing time series measurements from multiple sensors. Key steps in analyzing wind data are outlined, such as checking for physically realistic values and comparing to other long-term weather datasets.
The summary provides an overview of the key information from the technical report on the stock market:
- The indices closed lower, with the Nifty down 0.91% and Sensex down 0.92%, after opening higher but being unable to sustain gains. Support levels of 20400-20250 and 6150-6100 and resistance at 20855 and 6284 are identified.
- SESAGOA gained the most at 4.15% while BPCL lost the most at 5.19%. The top sector gainers were CG and OIL&GAS, while the top losers were POWER and PSU.
- Pivot points are provided for the key indices and stocks to identify support and
This document provides a table showing the present value of a 1 unit annual annuity for "n" periods using interest rates from 1% to 40%. It was created by Angel Higuerey Gómez in November 2000 to calculate the future value of annuities using different interest rates over varying time periods. The table allows the user to look up the present value factor for any number of periods at any whole percentage interest rate between 1% and 40%.
Tabla salarial docentes decreto 2277 de 1979Carlos Estrada
This document contains tables of salary grades and assignments for Colombian teachers from 1979 to 2015. The tables show increasing salary amounts over time for 14 grades of teachers. Decrees from various years are cited as having modified the salary tables.
This document contains tables listing the prices of various motorcycle models from different manufacturers like Honda, Yamaha, Suzuki and others. The tables include the retail price and installment amounts for different down payment options. There are also sections listing requirements for individual and company loan applications, as well as notes about prices including taxes, changes to prices without notice and inability to withdraw applications submitted to the listed finance provider.
The document contains measurements of TV voltage over 30 time periods for two different TVs. TV 1 has a mean voltage of 88.8 ± 0.076 and measurements range from 88.737 to 88.864. TV 2 has a mean voltage of 84.21 ± 0.153 and measurements range from 84.137 to 84.301. The data is arranged in a table with the voltage measurements for each TV over the 30 time periods recorded in two separate blocks.
1. The document presents a table with standardized normal distribution values including the z-score, the areas under the normal curve to the left and right of the z-score, and the ordinate value at that z-score.
2. It provides the z-score from 0 to 0.725 in increments of 0.005 and the corresponding standard normal distribution values.
3. The table is referenced from the textbook "Fundamental Statistics In Psychology and Education" by Guilford and Fruchter published in 1978.
The document discusses two types of seals - Springsele and Teesele - used in the oil and gas industry. Springsele is recommended for static duties and can seal under higher pressures, while Teesele can operate dynamically. Both seals are double acting and can withstand extremes of pressure, temperature, and chemical attack. They are commonly used to seal downhole equipment, wellheads, valves, and pipelines. The document provides information on common materials, temperature ranges, applications, and housing dimensions for the seals.
This document contains the SQL code to create a database table called "articulos" to store product inventory information like codes, descriptions, prices, etc. It also includes the data inserted into 14 fields of the articulos table with over 200 product entries listed. Each entry contains the product code, specifications, price, description, existing quantity and other details. The table is created in the "dima_dima" database on a server running MySQL version 5.0.51.
Tabla de factores de descuento flujos constantesDiego Oviedo
1. The table shows interest rates for constant cash flows over different years.
2. Interest rates decrease as the number of years increases, with the highest rates for early years and lowest for later years.
3. The table has 24 rows representing years 1 through 24 and columns for the interest rate and accumulated interest each year.
The technical report provides a daily market summary for the Indian stock market. Key details include:
- The Nifty and Sensex indices closed marginally lower after opening higher.
- Top gainers were led by LT, SBIN, and AXISBANK, while top losers were IDEA, M&M, and RANBAXY.
- Sectoral performances were mixed with IT and metal sectors declining while consumer goods rose.
- The report provides analysis that the intermediate trend remains positive and support levels are identified. Pivot levels are also given for various stocks to watch the next day's trading ranges.
The market indices opened marginally lower but closed higher. Top gainers were Maruti, Unitech and Sun Pharma, while top losers were LT, HCL Tech and Sterlite. The realty and healthcare sectors saw gains while capital goods saw losses. Stocks like Maruti and Essar Oil are positively biased for the next 2-3 days, while technical indicators suggest the market may consolidate at current levels or see a slight decline. Pivot points are provided for various stocks.
The market summary provides an overview of the performance of key indices and sectors in the Indian market on June 22, 2010. The Nifty closed slightly lower at 5353 points, down 0.23%, while the Sensex closed lower at 17877 points, down 0.26%. Metal and realty sectors performed strongly with gains above 5% and 2.5% respectively, while banking stocks gained around 2%. Tata Steel, Hindalco and Reliance Capital were among the top gainers. GAIL, HDFC Bank and HCL Technologies were among the top losers. The markets opened on a positive note and closed near the day's highs.
The document is a list of numeric values ranging from approximately 1 to 9. There are over 200 data points listed without any additional context or explanation provided.
This document lists part numbers and specifications for Slydring® wear rings for rods. It provides the inner diameter, outer diameter, width, and thickness for over 200 wear ring part numbers, organized into different series based on material thickness. The part numbers and specifications are for ordering from TSS.
Daily Production & WIP Analysis Dashboard - page 1Imran Yousuf
This document provides daily production data and work in process summaries for various departments of a garment manufacturing company over the month of July 2015. It shows the daily production quantities for cutting, stitching, washing/dyeing, checking, packing and shipment departments. It also provides a monthly production trend by department and customer-wise production data for specific styles shipped to different customers over June, July and August 2015. The work in process summary at the end indicates the current quantity of unfinished inventory for different departments.
Daily technical analysis of NSE Nifty along with market bias and technical analysis. Easily identify breakout and breakdown stocks using volume & price data. Various tools for trading in Forex and Stocks including Fibonacci, Pivots, Option Pricing, Black Scholes etc.
The document contains a series of numbers ranging from 5.961 to 6.345. It then provides statistical analysis of these numbers including calculations of minimum, maximum, range, number of intervals, mean, standard deviation, variance and limits. Two histograms are presented with the data divided into classes and the corresponding frequencies. Measures of central tendency, dispersion and process capability are reported.
China turcon Slydring wear ring for pistonBanana Yuan
This document provides a table listing specifications for Slydring® wear rings for pistons. It includes the ordering code, dimensions such as bore diameter, groove diameter, groove width, and thickness for various sizes ranging from 1.250 to 20.000 inches. The table is separated into different part numbers depending on the groove width specification. The document notes that more details can be found on the company's website.
STOXX 600 Index - Dividends and Implied Volatility Surfaces ParametersBCV
The document appears to be a table containing stock market data for various companies, including ticker name, sector, dividend yield, next ex-dividend date, and historical volatility measures such as ATM volume and skew over different time periods ranging from 30 days to 24 months. The table contains data for 25 companies across sectors such as health care, financials, consumer staples, and materials.
The document appears to be a list ranking individuals from 1st to 171st place based on their scores on three assessments: Note 1, Note 2, and Concurso. Each individual's total score is calculated by adding their scores on the three assessments. The individuals are ranked from highest total score to lowest total score.
The document provides a table of critical values for the Student's t-distribution for different degrees of freedom (df) and significance levels (α). The table shows the critical t-values for df ranging from 1 to 144 and α levels of 0.1, 0.05, 0.025, 0.01, 0.005, and 0.001.
This document contains a table that lists the standard normal distribution probabilities (P[Z ≤ z]) for z-scores between -3.5 and 1.8 in increments of 0.1. It gives the probability that a random variable from the standard normal distribution will be less than or equal to each corresponding z-score.
6cw95kf4spaybsbhz5na 140618171029-phpapp02Huỳnh Thế
The document contains two tables of numbers. The first table lists values of the standard normal probability density function φ(x) for values of x from 0 to 3.6. The second table lists values of the standard normal cumulative distribution function Φ(x) for values of x from 0 to 2.6. Both tables show the standard normal distribution, which has applications in statistics.
The document contains two tables of numbers. The first table lists values of the standard normal probability density function φ(x) for values of x from 0 to 3.6. The second table lists values of the standard normal cumulative distribution function Φ(x) for values of x from 0 to 2.6. Both tables show the standard normal distribution, which is commonly used in statistics.
This document contains a table of values for the standard normal cumulative distribution function φ(z) for z-values ranging from -3 to 2.7 in increments of 0.1. For each z-value, it provides the corresponding φ(z) value which represents the probability that a random variable from the standard normal distribution will be less than or equal to that z-value.
This document provides a table of critical values for the t-distribution and F-distribution for various degrees of freedom and significance levels. The table lists the critical values for one-tailed and two-tailed tests with significance levels ranging from 0.2% to 20% for distributions with 1 to 100 degrees of freedom.
This document contains a table with statistical data showing the standard normal distribution. The table lists z-scores ranging from -3.9 to 2.7 across the top and the corresponding probability values for each z-score listed down the left side. The probability values indicate the percentage of the distribution that falls below that z-score.
This document contains a table of numbers arranged in a grid. The numbers decrease as the rows progress from top to bottom and as the columns progress from left to right. Most numbers range between 0 and 1, becoming smaller the further they are from the top left corner of the table.
The document contains a table with critical values for the F-test (Fisher's criterion) at α=5% for different numbers of degrees of freedom. It lists the critical values of the F-distribution for various combinations of degrees of freedom in the numerator (kбільш) and denominator (kменш) of the F-ratio. The table provides critical values from 1 to 110 degrees of freedom in both the numerator and denominator.
The document contains measurements of pH values from 20 samples. It presents the data in tables and graphs, and calculates statistical measures such as mean, median, variance, and standard deviation. It finds that the process is within specifications but should be closely monitored, as the Cpk value could potentially drop below 1.
The document contains tables showing the probability distribution and cumulative distribution of the standard normal distribution. It provides the probability and cumulative probability values corresponding to a z-score of 1.34. The probability of being left of 1.34 is 0.9099. The probability of being right of 1.34 is 0.0901. The cumulative probability from 0 to 1.34 is 0.4099.
1. The document presents a table with standardized normal distribution values including the z-score, the areas under the normal curve to the left and right of the z-score, and the ordinate value at that z-score.
2. It provides the z-score from 0 to 0.725 in increments of 0.005 and the corresponding standard normal distribution areas and ordinates.
3. The table is from the textbook "Fundamental Statistics In Psychology and Education" by Guilford and Fruchter published in 1978 by McGraw-Hill.
The document contains timing data from an Olympic swimming pool in seconds. It includes the raw timing data in two tables, as well as an analysis of the data including measures of central tendency, variance, standard deviation, and a histogram and pie chart of the frequency distribution. A total of 300 data points are analyzed and grouped into 11 classes with a range of 0.02 seconds.
The document appears to contain statistical data organized into a table with over 100 rows and columns. It includes values ranging from around 1.5 to over 250. The data is grouped into categories including degrees of freedom, sample sizes ranging from 1 to over 10,000, and values in increments of 1 from 1 to 30 or more.
This document contains technical specifications for various engine models including dimensions, performance characteristics, and emissions data. It lists over 100 engine types along with their cylinder bore, rated power, maximum torque, displacement, compression ratio, and other metrics. The formatting includes model names and numbers in the left column with corresponding measured values in the right column.
MR. AMIR IKRAM is a resource person with an MPhil from GC University Lahore and an MBIT in Finance from Punjab University. The document contains tables with values for future value (FV), present value (PV), and other time value of money calculations at varying interest rates and time periods. The tables provide the calculations for interest rates from 2% to 18% and time periods from 1 to 50 years for future value, and periods from 1 to 20 years for present value.
This document appears to be a table containing random digits organized into lines. There are 141 lines shown, with each line containing 10 random digits. The table seems to be providing random number data for statistical analysis or simulation purposes.
The document contains two columns of numbers. The first column appears to list percentile values from 0 to 100 in increments of 0.1. The second column lists corresponding z-score values for each given percentile. The table provides a way to convert between percentiles and z-scores for common statistical calculations and analyses.
Literature Review Basics and Understanding Reference Management.pptxDr Ramhari Poudyal
Three-day training on academic research focuses on analytical tools at United Technical College, supported by the University Grant Commission, Nepal. 24-26 May 2024
A review on techniques and modelling methodologies used for checking electrom...nooriasukmaningtyas
The proper function of the integrated circuit (IC) in an inhibiting electromagnetic environment has always been a serious concern throughout the decades of revolution in the world of electronics, from disjunct devices to today’s integrated circuit technology, where billions of transistors are combined on a single chip. The automotive industry and smart vehicles in particular, are confronting design issues such as being prone to electromagnetic interference (EMI). Electronic control devices calculate incorrect outputs because of EMI and sensors give misleading values which can prove fatal in case of automotives. In this paper, the authors have non exhaustively tried to review research work concerned with the investigation of EMI in ICs and prediction of this EMI using various modelling methodologies and measurement setups.
DEEP LEARNING FOR SMART GRID INTRUSION DETECTION: A HYBRID CNN-LSTM-BASED MODELgerogepatton
As digital technology becomes more deeply embedded in power systems, protecting the communication
networks of Smart Grids (SG) has emerged as a critical concern. Distributed Network Protocol 3 (DNP3)
represents a multi-tiered application layer protocol extensively utilized in Supervisory Control and Data
Acquisition (SCADA)-based smart grids to facilitate real-time data gathering and control functionalities.
Robust Intrusion Detection Systems (IDS) are necessary for early threat detection and mitigation because
of the interconnection of these networks, which makes them vulnerable to a variety of cyberattacks. To
solve this issue, this paper develops a hybrid Deep Learning (DL) model specifically designed for intrusion
detection in smart grids. The proposed approach is a combination of the Convolutional Neural Network
(CNN) and the Long-Short-Term Memory algorithms (LSTM). We employed a recent intrusion detection
dataset (DNP3), which focuses on unauthorized commands and Denial of Service (DoS) cyberattacks, to
train and test our model. The results of our experiments show that our CNN-LSTM method is much better
at finding smart grid intrusions than other deep learning algorithms used for classification. In addition,
our proposed approach improves accuracy, precision, recall, and F1 score, achieving a high detection
accuracy rate of 99.50%.
ACEP Magazine edition 4th launched on 05.06.2024Rahul
This document provides information about the third edition of the magazine "Sthapatya" published by the Association of Civil Engineers (Practicing) Aurangabad. It includes messages from current and past presidents of ACEP, memories and photos from past ACEP events, information on life time achievement awards given by ACEP, and a technical article on concrete maintenance, repairs and strengthening. The document highlights activities of ACEP and provides a technical educational article for members.
KuberTENes Birthday Bash Guadalajara - K8sGPT first impressionsVictor Morales
K8sGPT is a tool that analyzes and diagnoses Kubernetes clusters. This presentation was used to share the requirements and dependencies to deploy K8sGPT in a local environment.