SlideShare a Scribd company logo
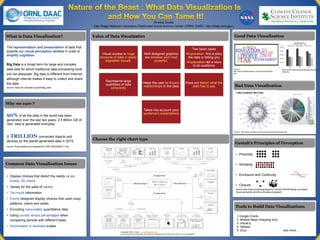
The representation and presentation of data that
exploits our visual perception abilities in order to
amplify cognition.
Big Data is a broad term for large and complex
data sets for which traditional data processing tools
are not adequate. Big data is different from Internet,
although internet makes it easy to collect and share
the data.
source: https://en.wikipedia.org/wiki/Big_data
Shweta Gupte
Oak Ridge National Laboratory Distributed Active Archive Center (ORNL DAAC, http://daac.ornl.gov)
What is Data Visualization?
90% of all the data in the world has been
generated over the last two years, 2.5 Billion GB of
new data is generated everyday.
1 TRILLION connected objects and
devices on the planet generated data in 2015.
source: Sciencedaily.com/releases/2013/05/130522085217.htm
Why we care ?
Value of Data Visualization
Choose the right chart type
• Proximity
• Similarity
• Enclosure and Continuity
• Closure
Source:http://www.smashingmagazine.com/2014/03/28/design-principles-
visual-perception-and-the-principles-of-gestalt/
Gestalt’s Principles of Perception
S
Good Data Visualization
Bad Data Visualization
• Display choices that distort the reality i.e pie
charts, 3D charts
• Variety for the sake of variety
• Too much information
• Poorly designed display choices that used noisy
patterns, colors and styles
• Encoding inaccurately quantitative data
• Using counts versus percentages when
comparing periods with different totals
• Inconsistent or reversed scales
Common Data Visualization Issues
Tools to Build Data Visualizations
Copyright 2006 A.Abela – a.v.abela@gmail.com
source:Dr.Andrew Abela http://www.labnol.org/software/find-right-chart-type-for-your-data/6523/.
Source:
http://www.colbertsuperpac.com/wordclouds/index.
php
Source: http://www.microsiervos.com/archivo/azar/loto-estrella.html
1.Google Charts
2. Modest Maps (mapping tool)
3. Visual.ly
4. Tableau
5. d3.js and more….
Source:http://www.perceptualedge.com/exam
ple3.php
Visual access to huge
amounts of data in easily
digestible visuals.
Well designed graphics
are simplest and most
powerful.
Two basic types
•Exploration- find a story
the data is telling you
•Explanation-tell a story
to an audience
Represents large
quantities of data
coherently
Helps the user to discern
relationships in the data
Does not distort what the
data has to say
Takes into account your
audience’s expectations

More Related Content

What's hot

Knowledge Architecture: Graphing Your Knowledge
Knowledge Architecture: Graphing Your KnowledgeKnowledge Architecture: Graphing Your Knowledge
Knowledge Architecture: Graphing Your Knowledge
Neo4j
 
Top 5 Deep Learning and AI Stories - August 31, 2018
Top 5 Deep Learning and AI Stories - August 31, 2018Top 5 Deep Learning and AI Stories - August 31, 2018
Top 5 Deep Learning and AI Stories - August 31, 2018
NVIDIA
 
Colocation Services Going Green.
Colocation Services Going Green.Colocation Services Going Green.
Colocation Services Going Green.
Web Werks Data Centers
 
Internet Infrastructures for Big Data (Verisign's Distinguished Speaker Series)
Internet Infrastructures for Big Data (Verisign's Distinguished Speaker Series)Internet Infrastructures for Big Data (Verisign's Distinguished Speaker Series)
Internet Infrastructures for Big Data (Verisign's Distinguished Speaker Series)
eXascale Infolab
 
KNOWLEDGE ARCHITECTURE: IT’S IMPORTANCE TO AN ORGANIZATION
KNOWLEDGE ARCHITECTURE: IT’S IMPORTANCE TO AN ORGANIZATIONKNOWLEDGE ARCHITECTURE: IT’S IMPORTANCE TO AN ORGANIZATION
KNOWLEDGE ARCHITECTURE: IT’S IMPORTANCE TO AN ORGANIZATION
Connected Data World
 
Edi presentation 2013 03-01
Edi presentation 2013 03-01Edi presentation 2013 03-01
Edi presentation 2013 03-01ianjkalin
 
Auclair 3D, Immersive Virtual Reality Augmented Reality
Auclair 3D, Immersive Virtual Reality Augmented RealityAuclair 3D, Immersive Virtual Reality Augmented Reality
Auclair 3D, Immersive Virtual Reality Augmented Reality
National Information Standards Organization (NISO)
 
(Big) Data Analytics for Environmental Sustainability
(Big) Data Analytics for Environmental Sustainability(Big) Data Analytics for Environmental Sustainability
(Big) Data Analytics for Environmental Sustainability
Wassim Derguech
 
VFB 2013 - HP Labs - Horizon Scanning - Technology Trends
VFB 2013 - HP Labs - Horizon Scanning - Technology TrendsVFB 2013 - HP Labs - Horizon Scanning - Technology Trends
VFB 2013 - HP Labs - Horizon Scanning - Technology Trends
Science City Bristol
 
OW2con'14 - OW2 Big data initiative, SpagoBI Labs by Engineering
OW2con'14 - OW2 Big data initiative, SpagoBI Labs by EngineeringOW2con'14 - OW2 Big data initiative, SpagoBI Labs by Engineering
OW2con'14 - OW2 Big data initiative, SpagoBI Labs by Engineering
OW2
 
Enabling a Data Driven Agile Business
Enabling a Data Driven Agile BusinessEnabling a Data Driven Agile Business
Enabling a Data Driven Agile Business
Tharindu Mathew
 
Ceph Day Beijing: Welcome
Ceph Day Beijing: Welcome Ceph Day Beijing: Welcome
Ceph Day Beijing: Welcome
Ceph Community
 
Top 5 Deep Learning and AI Stories - November 3, 2017
Top 5 Deep Learning and AI Stories - November 3, 2017Top 5 Deep Learning and AI Stories - November 3, 2017
Top 5 Deep Learning and AI Stories - November 3, 2017
NVIDIA
 
Extend the Reach of Data Science with Data Virtualization
Extend the Reach of Data Science with Data VirtualizationExtend the Reach of Data Science with Data Virtualization
Extend the Reach of Data Science with Data Virtualization
Denodo
 
Seeking serendipity
Seeking serendipitySeeking serendipity
Seeking serendipity
Andrew Treloar
 
David Park APAN Slid..
David Park APAN Slid..David Park APAN Slid..
David Park APAN Slid..Videoguy
 
Top 5 AI and Deep Learning Stories - November 9, 2018
Top 5 AI and Deep Learning Stories - November 9, 2018Top 5 AI and Deep Learning Stories - November 9, 2018
Top 5 AI and Deep Learning Stories - November 9, 2018
NVIDIA
 
InSTEDD Where 2.0
InSTEDD Where 2.0InSTEDD Where 2.0
InSTEDD Where 2.0
Eduardo Jezierski
 
InSTEDD - Where 2.0
InSTEDD - Where 2.0InSTEDD - Where 2.0
InSTEDD - Where 2.0InSTEDD
 

What's hot (20)

Knowledge Architecture: Graphing Your Knowledge
Knowledge Architecture: Graphing Your KnowledgeKnowledge Architecture: Graphing Your Knowledge
Knowledge Architecture: Graphing Your Knowledge
 
Top 5 Deep Learning and AI Stories - August 31, 2018
Top 5 Deep Learning and AI Stories - August 31, 2018Top 5 Deep Learning and AI Stories - August 31, 2018
Top 5 Deep Learning and AI Stories - August 31, 2018
 
Colocation Services Going Green.
Colocation Services Going Green.Colocation Services Going Green.
Colocation Services Going Green.
 
Internet Infrastructures for Big Data (Verisign's Distinguished Speaker Series)
Internet Infrastructures for Big Data (Verisign's Distinguished Speaker Series)Internet Infrastructures for Big Data (Verisign's Distinguished Speaker Series)
Internet Infrastructures for Big Data (Verisign's Distinguished Speaker Series)
 
KNOWLEDGE ARCHITECTURE: IT’S IMPORTANCE TO AN ORGANIZATION
KNOWLEDGE ARCHITECTURE: IT’S IMPORTANCE TO AN ORGANIZATIONKNOWLEDGE ARCHITECTURE: IT’S IMPORTANCE TO AN ORGANIZATION
KNOWLEDGE ARCHITECTURE: IT’S IMPORTANCE TO AN ORGANIZATION
 
Edi presentation 2013 03-01
Edi presentation 2013 03-01Edi presentation 2013 03-01
Edi presentation 2013 03-01
 
Auclair 3D, Immersive Virtual Reality Augmented Reality
Auclair 3D, Immersive Virtual Reality Augmented RealityAuclair 3D, Immersive Virtual Reality Augmented Reality
Auclair 3D, Immersive Virtual Reality Augmented Reality
 
BIG DATA
BIG DATABIG DATA
BIG DATA
 
(Big) Data Analytics for Environmental Sustainability
(Big) Data Analytics for Environmental Sustainability(Big) Data Analytics for Environmental Sustainability
(Big) Data Analytics for Environmental Sustainability
 
VFB 2013 - HP Labs - Horizon Scanning - Technology Trends
VFB 2013 - HP Labs - Horizon Scanning - Technology TrendsVFB 2013 - HP Labs - Horizon Scanning - Technology Trends
VFB 2013 - HP Labs - Horizon Scanning - Technology Trends
 
OW2con'14 - OW2 Big data initiative, SpagoBI Labs by Engineering
OW2con'14 - OW2 Big data initiative, SpagoBI Labs by EngineeringOW2con'14 - OW2 Big data initiative, SpagoBI Labs by Engineering
OW2con'14 - OW2 Big data initiative, SpagoBI Labs by Engineering
 
Enabling a Data Driven Agile Business
Enabling a Data Driven Agile BusinessEnabling a Data Driven Agile Business
Enabling a Data Driven Agile Business
 
Ceph Day Beijing: Welcome
Ceph Day Beijing: Welcome Ceph Day Beijing: Welcome
Ceph Day Beijing: Welcome
 
Top 5 Deep Learning and AI Stories - November 3, 2017
Top 5 Deep Learning and AI Stories - November 3, 2017Top 5 Deep Learning and AI Stories - November 3, 2017
Top 5 Deep Learning and AI Stories - November 3, 2017
 
Extend the Reach of Data Science with Data Virtualization
Extend the Reach of Data Science with Data VirtualizationExtend the Reach of Data Science with Data Virtualization
Extend the Reach of Data Science with Data Virtualization
 
Seeking serendipity
Seeking serendipitySeeking serendipity
Seeking serendipity
 
David Park APAN Slid..
David Park APAN Slid..David Park APAN Slid..
David Park APAN Slid..
 
Top 5 AI and Deep Learning Stories - November 9, 2018
Top 5 AI and Deep Learning Stories - November 9, 2018Top 5 AI and Deep Learning Stories - November 9, 2018
Top 5 AI and Deep Learning Stories - November 9, 2018
 
InSTEDD Where 2.0
InSTEDD Where 2.0InSTEDD Where 2.0
InSTEDD Where 2.0
 
InSTEDD - Where 2.0
InSTEDD - Where 2.0InSTEDD - Where 2.0
InSTEDD - Where 2.0
 

Viewers also liked

Innovation Game
Innovation GameInnovation Game
Innovation Game
Den Reymer
 
1 Joval Engineering Logo (1)
1 Joval Engineering Logo (1)1 Joval Engineering Logo (1)
1 Joval Engineering Logo (1)Susan Da Fonte
 
BanditProblems_final
BanditProblems_finalBanditProblems_final
BanditProblems_finalShweta Gupte
 
Unidad de aprendizaje votos responsables
Unidad de aprendizaje    votos responsablesUnidad de aprendizaje    votos responsables
Unidad de aprendizaje votos responsables
Jarry Salas Solgorre
 
Reseña contable carla avila
Reseña contable carla avilaReseña contable carla avila
Reseña contable carla avila
karla avila
 
Curso de visual fox pro - Desprotejido para Imprimirlo
Curso de visual fox pro - Desprotejido para ImprimirloCurso de visual fox pro - Desprotejido para Imprimirlo
Curso de visual fox pro - Desprotejido para Imprimirlo
hmosquera
 
Appendicitis
AppendicitisAppendicitis
Appendicitis
Ruparee
 
Subli̇mi̇nal adverti̇si̇ng
Subli̇mi̇nal adverti̇si̇ngSubli̇mi̇nal adverti̇si̇ng
Subli̇mi̇nal adverti̇si̇ng
Sumru Bayram
 
Luxury Travel Company vietnam 2013
Luxury Travel Company    vietnam 2013Luxury Travel Company    vietnam 2013
Luxury Travel Company vietnam 2013
LUXURY TRAVEL™
 
Yoga Is My Health Insurance Philosophy on Social Media
Yoga Is My Health Insurance Philosophy on Social MediaYoga Is My Health Insurance Philosophy on Social Media
Yoga Is My Health Insurance Philosophy on Social Media
YIMHI
 
4 pilares educacion delors(1)
4 pilares educacion delors(1)4 pilares educacion delors(1)
4 pilares educacion delors(1)
izhar
 
Yelp Rating Prediction
Yelp Rating PredictionYelp Rating Prediction
Yelp Rating PredictionKartik Lunkad
 

Viewers also liked (13)

Innovation Game
Innovation GameInnovation Game
Innovation Game
 
1 Joval Engineering Logo (1)
1 Joval Engineering Logo (1)1 Joval Engineering Logo (1)
1 Joval Engineering Logo (1)
 
BanditProblems_final
BanditProblems_finalBanditProblems_final
BanditProblems_final
 
Unidad de aprendizaje votos responsables
Unidad de aprendizaje    votos responsablesUnidad de aprendizaje    votos responsables
Unidad de aprendizaje votos responsables
 
Reseña contable carla avila
Reseña contable carla avilaReseña contable carla avila
Reseña contable carla avila
 
Curso de visual fox pro - Desprotejido para Imprimirlo
Curso de visual fox pro - Desprotejido para ImprimirloCurso de visual fox pro - Desprotejido para Imprimirlo
Curso de visual fox pro - Desprotejido para Imprimirlo
 
Appendicitis
AppendicitisAppendicitis
Appendicitis
 
Sachchidanand Diwakar Resume
Sachchidanand Diwakar ResumeSachchidanand Diwakar Resume
Sachchidanand Diwakar Resume
 
Subli̇mi̇nal adverti̇si̇ng
Subli̇mi̇nal adverti̇si̇ngSubli̇mi̇nal adverti̇si̇ng
Subli̇mi̇nal adverti̇si̇ng
 
Luxury Travel Company vietnam 2013
Luxury Travel Company    vietnam 2013Luxury Travel Company    vietnam 2013
Luxury Travel Company vietnam 2013
 
Yoga Is My Health Insurance Philosophy on Social Media
Yoga Is My Health Insurance Philosophy on Social MediaYoga Is My Health Insurance Philosophy on Social Media
Yoga Is My Health Insurance Philosophy on Social Media
 
4 pilares educacion delors(1)
4 pilares educacion delors(1)4 pilares educacion delors(1)
4 pilares educacion delors(1)
 
Yelp Rating Prediction
Yelp Rating PredictionYelp Rating Prediction
Yelp Rating Prediction
 

Similar to DataViz_What_How_Why

Big data mining
Big data miningBig data mining
Big data and data mining
Big data and data miningBig data and data mining
Big data and data mining
Polash Halder
 
WORLD CAT AS BIG DATA
WORLD CAT AS  BIG DATAWORLD CAT AS  BIG DATA
WORLD CAT AS BIG DATA
Dr. Anjaiah Mothukuri
 
An Overview of BigData
An Overview of BigDataAn Overview of BigData
An Overview of BigData
Valarmathi V
 
Big Data Analysis
Big Data AnalysisBig Data Analysis
Big Data Analysis
IRJET Journal
 
BrightTALK - Semantic AI
BrightTALK - Semantic AI BrightTALK - Semantic AI
BrightTALK - Semantic AI
Semantic Web Company
 
Data Mining in the World of BIG Data-A Survey
Data Mining in the World of BIG Data-A SurveyData Mining in the World of BIG Data-A Survey
Data Mining in the World of BIG Data-A Survey
Editor IJCATR
 
Our big data
Our big dataOur big data
Our big data
uthrarajan
 
wireless sensor network
wireless sensor networkwireless sensor network
wireless sensor networkparry prabhu
 
Citrination-MRS Fall Meeting 2015
Citrination-MRS Fall Meeting 2015Citrination-MRS Fall Meeting 2015
Citrination-MRS Fall Meeting 2015
bmeredig
 
Bigdatacooltools
BigdatacooltoolsBigdatacooltools
Bigdatacooltools
suresh sood
 
20211011112936_PPT01-Introduction to Big Data.pptx
20211011112936_PPT01-Introduction to Big Data.pptx20211011112936_PPT01-Introduction to Big Data.pptx
20211011112936_PPT01-Introduction to Big Data.pptx
SyauqiAsyhabira1
 
Data Science For Social Good: Tackling the Challenge of Homelessness
Data Science For Social Good: Tackling the Challenge of HomelessnessData Science For Social Good: Tackling the Challenge of Homelessness
Data Science For Social Good: Tackling the Challenge of Homelessness
Anita Luthra
 
Big Data & Data Mining
Big Data & Data MiningBig Data & Data Mining
Big Data & Data Mining
Md Mizanur Rahman
 
Data mining with big data
Data mining with big dataData mining with big data
Data mining with big data
Sandip Tipayle Patil
 
research publish journal
research publish journalresearch publish journal
research publish journal
rikaseorika
 
research publish journal
research publish journalresearch publish journal
research publish journal
rikaseorika
 
Understand the Idea of Big Data and in Present Scenario
Understand the Idea of Big Data and in Present ScenarioUnderstand the Idea of Big Data and in Present Scenario
Understand the Idea of Big Data and in Present Scenario
AI Publications
 
BIG Data and Methodology-A review
BIG Data and Methodology-A reviewBIG Data and Methodology-A review
BIG Data and Methodology-A review
Shilpa Soi
 
A Comprehensive Study on Big Data Applications and Challenges
A Comprehensive Study on Big Data Applications and ChallengesA Comprehensive Study on Big Data Applications and Challenges
A Comprehensive Study on Big Data Applications and Challenges
ijcisjournal
 

Similar to DataViz_What_How_Why (20)

Big data mining
Big data miningBig data mining
Big data mining
 
Big data and data mining
Big data and data miningBig data and data mining
Big data and data mining
 
WORLD CAT AS BIG DATA
WORLD CAT AS  BIG DATAWORLD CAT AS  BIG DATA
WORLD CAT AS BIG DATA
 
An Overview of BigData
An Overview of BigDataAn Overview of BigData
An Overview of BigData
 
Big Data Analysis
Big Data AnalysisBig Data Analysis
Big Data Analysis
 
BrightTALK - Semantic AI
BrightTALK - Semantic AI BrightTALK - Semantic AI
BrightTALK - Semantic AI
 
Data Mining in the World of BIG Data-A Survey
Data Mining in the World of BIG Data-A SurveyData Mining in the World of BIG Data-A Survey
Data Mining in the World of BIG Data-A Survey
 
Our big data
Our big dataOur big data
Our big data
 
wireless sensor network
wireless sensor networkwireless sensor network
wireless sensor network
 
Citrination-MRS Fall Meeting 2015
Citrination-MRS Fall Meeting 2015Citrination-MRS Fall Meeting 2015
Citrination-MRS Fall Meeting 2015
 
Bigdatacooltools
BigdatacooltoolsBigdatacooltools
Bigdatacooltools
 
20211011112936_PPT01-Introduction to Big Data.pptx
20211011112936_PPT01-Introduction to Big Data.pptx20211011112936_PPT01-Introduction to Big Data.pptx
20211011112936_PPT01-Introduction to Big Data.pptx
 
Data Science For Social Good: Tackling the Challenge of Homelessness
Data Science For Social Good: Tackling the Challenge of HomelessnessData Science For Social Good: Tackling the Challenge of Homelessness
Data Science For Social Good: Tackling the Challenge of Homelessness
 
Big Data & Data Mining
Big Data & Data MiningBig Data & Data Mining
Big Data & Data Mining
 
Data mining with big data
Data mining with big dataData mining with big data
Data mining with big data
 
research publish journal
research publish journalresearch publish journal
research publish journal
 
research publish journal
research publish journalresearch publish journal
research publish journal
 
Understand the Idea of Big Data and in Present Scenario
Understand the Idea of Big Data and in Present ScenarioUnderstand the Idea of Big Data and in Present Scenario
Understand the Idea of Big Data and in Present Scenario
 
BIG Data and Methodology-A review
BIG Data and Methodology-A reviewBIG Data and Methodology-A review
BIG Data and Methodology-A review
 
A Comprehensive Study on Big Data Applications and Challenges
A Comprehensive Study on Big Data Applications and ChallengesA Comprehensive Study on Big Data Applications and Challenges
A Comprehensive Study on Big Data Applications and Challenges
 

DataViz_What_How_Why

  • 1. The representation and presentation of data that exploits our visual perception abilities in order to amplify cognition. Big Data is a broad term for large and complex data sets for which traditional data processing tools are not adequate. Big data is different from Internet, although internet makes it easy to collect and share the data. source: https://en.wikipedia.org/wiki/Big_data Shweta Gupte Oak Ridge National Laboratory Distributed Active Archive Center (ORNL DAAC, http://daac.ornl.gov) What is Data Visualization? 90% of all the data in the world has been generated over the last two years, 2.5 Billion GB of new data is generated everyday. 1 TRILLION connected objects and devices on the planet generated data in 2015. source: Sciencedaily.com/releases/2013/05/130522085217.htm Why we care ? Value of Data Visualization Choose the right chart type • Proximity • Similarity • Enclosure and Continuity • Closure Source:http://www.smashingmagazine.com/2014/03/28/design-principles- visual-perception-and-the-principles-of-gestalt/ Gestalt’s Principles of Perception S Good Data Visualization Bad Data Visualization • Display choices that distort the reality i.e pie charts, 3D charts • Variety for the sake of variety • Too much information • Poorly designed display choices that used noisy patterns, colors and styles • Encoding inaccurately quantitative data • Using counts versus percentages when comparing periods with different totals • Inconsistent or reversed scales Common Data Visualization Issues Tools to Build Data Visualizations Copyright 2006 A.Abela – a.v.abela@gmail.com source:Dr.Andrew Abela http://www.labnol.org/software/find-right-chart-type-for-your-data/6523/. Source: http://www.colbertsuperpac.com/wordclouds/index. php Source: http://www.microsiervos.com/archivo/azar/loto-estrella.html 1.Google Charts 2. Modest Maps (mapping tool) 3. Visual.ly 4. Tableau 5. d3.js and more…. Source:http://www.perceptualedge.com/exam ple3.php Visual access to huge amounts of data in easily digestible visuals. Well designed graphics are simplest and most powerful. Two basic types •Exploration- find a story the data is telling you •Explanation-tell a story to an audience Represents large quantities of data coherently Helps the user to discern relationships in the data Does not distort what the data has to say Takes into account your audience’s expectations